

Abstract
The neurobiological basis of neuroticism in late-life depression (LLD) is understudied. We hypothesized that older depressed subjects scoring high in measures of neuroticism would have smaller hippocampal and prefrontal volumes compared with non-neurotic older depressed subjects and with nondepressed comparison subjects based on previous research. Non-demented subjects were recruited and were either depressed with high neuroticism (n = 65), depressed with low neuroticism (n = 36), or never depressed (n = 27). For imaging outcomes focused on volumetric analyses, we found no significant between-group differences in hippocampal volume. However, we found several frontal lobe regions for which depressed subjects with high neuroticism scores had smaller volumes compared with non-neurotic older depressed subjects and with nondepressed comparison subjects, controlling for age and gender. These regions included the frontal pole, medial orbitofrontal cortex, and left pars orbitalis. In addition, we found that non-neurotic depressed subjects had a higher volume of non-white matter hypointensities on T1-weighted images (possibly related to cerebrovascular disease) than did neurotic depressed subjects. Our finding that depressed subjects low in neuroticism had higher volumes of non-white matter hypointensities is consistent with prior literature on “vascular depression.” In contrast, the finding that those high in neuroticism had smaller frontal volume than depressed subjects low in neuroticism and never-depressed subjects highlight the importance of frontal circuitry in the subgroup of older depressed individuals with comorbid neuroticism. Together, these results implicate different neural mechanisms in older neurotic and non-neurotic depressed groups and suggest that multiple biological pathologies may lead to different clinical expressions of LLD.
Keywords: late-life depression, neuroticism, white matter, imaging
Introduction
Neuroticism is a personality trait that is commonly seen in late-life depression (LLD) (Steunenberg et al., 2009) and refers to the propensity to experience negative emotions (e.g. guilt, fear, sadness, shame, and anxiety) as well as having poor coping skills in the face of stress or negative life events (Steunenberg et al., 2009). As a clinical construct, neuroticism is challenging to measure in the context of depression, as symptoms of depression and neuroticism may overlap (Li et al., 2019). Yet, there may be a clinical subtype of depression with comorbid neuroticism in older adults. Finding a biological basis for LLD with neuroticism would support its clinical classification as a subtype among older adults. (Steffens et al., 2017).
Previous structural imaging studies in LLD found that older patients have smaller hippocampal and prefrontal volumes (such as the orbital frontal region) and a greater volume of white matter hyperintensities (WMHs) compared with nondepressed subjects. (Xekardaki et al., 2012). However, structural imaging studies of neuroticism in older depressed adults are scarce. Thus, in this study, we sought to examine structural brain changes associated with neuroticism in LLD. Specifically, given prior studies linking depression with hippocampal and prefrontal cortex volumes, we chose to focus on changes in these areas, hypothesizing that older depressed subjects scoring high in a measure of neuroticism would have smaller hippocampal and prefrontal cortex volumes compared with non-neurotic older depressed and with never-depressed subjects. We also aimed to explore the role of WMHs in neuroticism in patients with and without depression.
Methods
Participants
All subjects were enrolled in Neurobiology of Late-life Depression (NBOLD), an NIMH-supported study (R01 MH108578) at the University of Connecticut Health Center (UCHC) and the Olin Neuropsychiatry Research Center (ONRC) at the Institute of Living at Hartford Hospital. The study was approved by the Institutional Review Boards of UCHC and Hartford Hospital. All subjects were provided with information about the studying, including a review of the consent form, and then provided written, informed consent to participate.
Depressed participants were recruited from clinical referrals, newspaper advertisements, and community presentations. Nondepressed comparison participants were recruited from a volunteer registry list housed in the Center on Aging at UCHC, as well as newspaper advertisements and community presentations.
As methods related to the NBOLD study have been previously reported (Steffens et al., 2015), we will summarize them below.
Inclusion criteria for all subjects were age 60 or above, ability to read and write English, Mini-Mental State Examination (MMSE) score 25 or greater. In addition, depressed subjects met the criteria for major depression, single episode, or recurrent.
Exclusion criteria for the study were lifetime alcohol or drug dependence; neurological diseases conditions associated with MRI abnormalities such as benign and cancerous brain tumors, epilepsy, Parkinson’s disease, Huntington’s chorea, dementia, and demyelinating diseases; endocrine disorders other than diabetes mellitus; any physical or intellectual disability that may affect the completion of self-rating instruments; established clinical diagnosis of dementia; other primary psychiatric disorders, e.g. panic disorder, social phobia, obsessive-compulsive disorder, schizoaffective disorder, schizophrenia, bipolar disorder; claustropho-bia, and any metal or pacemaker in the body that might preclude MRI. In addition, current treatment with fluoxetine was an exclusion criterion for the depressed group given its long washout period. Generalized anxiety disorder, a common comorbid-ity in LLD, was not an exclusion.
Upon enrollment and completion of clinical assessments, each participant was paid $100 for their time completing the MRI, cognitive test battery, and experimental computerized measures (described below).
Assessments of neuroticism, depression, and cognition
Neuroticism and depression symptoms were assessed using the NEO Personality Inventory (NEO-PI) (Costa and McCrae, 1992) and the Montgomery–Asberg Depression Rating Scale (MADRS; Montgomery and Asberg, 1979) respectively. A study psychiatrist performed a clinical interview to confirm or rule out a diagnosis of depression for depressed and comparison subjects and also administered the MADRS and the MMSE. Subjects with MMSE scores below 24 even after successful treatment were excluded from the study.
MRI data acquisition, processing, and analysis
Subjects were transported to the ONRC at the Institute of Living at Hartford Hospital for a brain magnetic resonance imaging scan. All subjects were scanned under a Skyra 3T scanner (Siemens, Erlangen, Germany) with 32 surface coils located at ONRC. Five high-resolution axial T1-weighted magnetization-prepared rapid gradient-echo (MPRAGE) images were acquired parallel with the anterior commissure–posterior commissure (AC-PC) line. The acquisition parameters were TR/TE= 2200/2.88ms, flip angle = 13°, matrix = 220 × 320 × 208, and voxel size 0.8 × 0.8 × 0.8 mm.
FreeSurfer (version 5.1.0) software was used to conduct automatic preprocessing and data analysis pipeline. The technical details of the pipeline procedures are described in prior publications (Dale et al., 1999). The remainder of the FreeSurfer methods is shown in the Supplementary materials.
Statistical analysis
Descriptive statistics were summarized in the three groups (never, depressed/low neuroticism, and depressed/high neuroticism). A t-score of ≥ 55 was used to define high versus low neuroticism (Costa and McCrae, 1992).
One-way ANOVA was conducted to test the relationship between MRI imaging variables and group, using SAS Version 9.4 (SAS Institute, Cary, NC, USA). When the overall test of no group differences from the ANOVA was statistically significant (α = 0.05), post hoc pairwise comparisons with Tukey’s adjustment were performed to identify group pairs that differed significantly (α = 0.05). These models were not corrected for multiple comparisons. Significant results were visualized in the form of boxplots.
To confirm the results and avoid region of interest (ROI) selective bias, we also conducted general linear regression analyses for ROI volumetric measures using the Freesurfer program, which includes whole-brain ROIs in the model. We used mri_glm-fit-sim, a program for clusterwise correction for multiple comparisons using a permutation test and set clusterwise p-values < 0.05 as the threshold.
Finally, for significant findings related to hypointensity volumes, e.g. white matter and non-white matter hypointensities, we visually inspected images to determine patterns of locations of hypointensity changes.
Results
The study sample consisted of 92 older depressed subjects and 36 never-depressed subjects (total 128). Subjects had a mean age of 72 and were 70% female (see Table 1). Seventy-one percent of depressed subjects scored high on the NEO-PI neuroticism measure. One-hundred and fifteen (90%) had MMSE scores 28 or higher, while 13 (10%) had MMSE scores of 25–27.
Table 1.
Demographic and clinic characteristics
| DEMOGRAPHIC AND BASELINE CLINICAL INFORMATION: | |||||
|---|---|---|---|---|---|
| TOTAL (n = 128) |
NEVER DEPRESSED (n = 36) |
DEPRESSED WITH HIGH NEUROTICISM (n = 65) |
DEPRESSED WITH LOW NEUROTICISM (n = 27) |
STATISTICAL TEST, DEGREES OF FREEDOM, p-VALUE | |
| Age, Mean (SD) | 72.5 (7.5) | 74.7 (7.4) | 71.1 (7.4) | 72.9 (7.6) | One-way ANOVA, F = 2.70, df = (2125), p = 0.07 |
| Gender (% Male) | 38 (29.7%) | 9 (25%) | 20 (30.8%) | 9 (33.3%) | Chi-square test, χ2 = 0.59, df = 2, p = 0.75 |
| Race (% White) | 116 (90.6%) | 32 (88.9%) | 59 (90.8%) | 25 (92.6%) | Exact Chi-square, χ2 = 0.25, df = 2, p = 0.93 |
| Education level | Exact Chi-square, χ2 = 0.94, df = 8 | ||||
| Less than high school (%) | 2 (1.6%) | 0 (0%) | 1 (1.5%) | 1 (3.7%) | p = 0.29 |
| High school diploma (%) | 18 (14.1%) | 9 (25%) | 5 (7.7%) | 4 (14.8%) | |
| Some college (%) | 27 (21.1%) | 9 (25%) | 15 (23.1%) | 3 (11.1%) | |
| College degree (%) | 25 (19.5%) | 6 (16.7%) | 14 (21.5%) | 5 (18.5%) | |
| Beyond college (%) | 56 (43.8%) | 12 (33.3%) | 30 (46.2%) | 14 (51.9%) | |
| Baseline MADRS, Mean (SD) | 14.1 (9.9) | 0.9 (2.1) | 19.6 (6.5) | 18.6 (6.0) | One-way ANOVA, F = 145.66, df = (2125), p < 0.0001 |
| Baseline neuroticism t-score, Mean (SD) | 56.4 (12.8) | 43.9 (9.2) | 66.8 (6.2) | 48.0 (5.1) | One-way ANOVA, F = 150.02, df = (2125), p < 0.0001 |
| Baseline MMSE score, mean (SD) | 29.3(1.1) | 28.9(1.4) | 29.4(0.9) | 29.4(0.9) | One-way ANOVA, F = 2.5, df = (2125), p = 0.084 |
We found that there were no differences in the hippocampal volumes for the depressed high neuroticism relative to depressed low neuroticism or never-depressed subjects as hypothesized. For imaging outcomes focused on volumetric analyses in other regions, we identified several frontal lobe regions for which depressed subjects with high neuroticism scores had smaller volumes compared with non-neurotic older depressed subjects and with nondepressed subjects, controlling for age and gender. These regions included the frontal pole, medial orbitofrontal cortex, and left pars orbitalis. For example, results were significant for the cortical volume of medial orbitofrontal cortex normalized to total cortical volume (F[2, 123] = 3.78, p = 0.026), with post hoc analyses revealing a smaller value among depressed with high neuroticism compared with depressed with low neuroticism (Δ = 0.092, Tukey-adjusted 95% CI = [ − 0.012, 0.196], p = 0.095), and compared with comparison subjects (Δ = 0.096, Tukey-adjusted 95% CI = [0.0001, 0.192], p = 0.0497). With a mean of 2.4 for nondepressed subjects, the effect sizes captured by the deltas above represent ~4% change from the mean. There were no significant differences between depressed with low neuroticism and never-depressed (p = 0.996; see Figure 1a).
Figure 1.
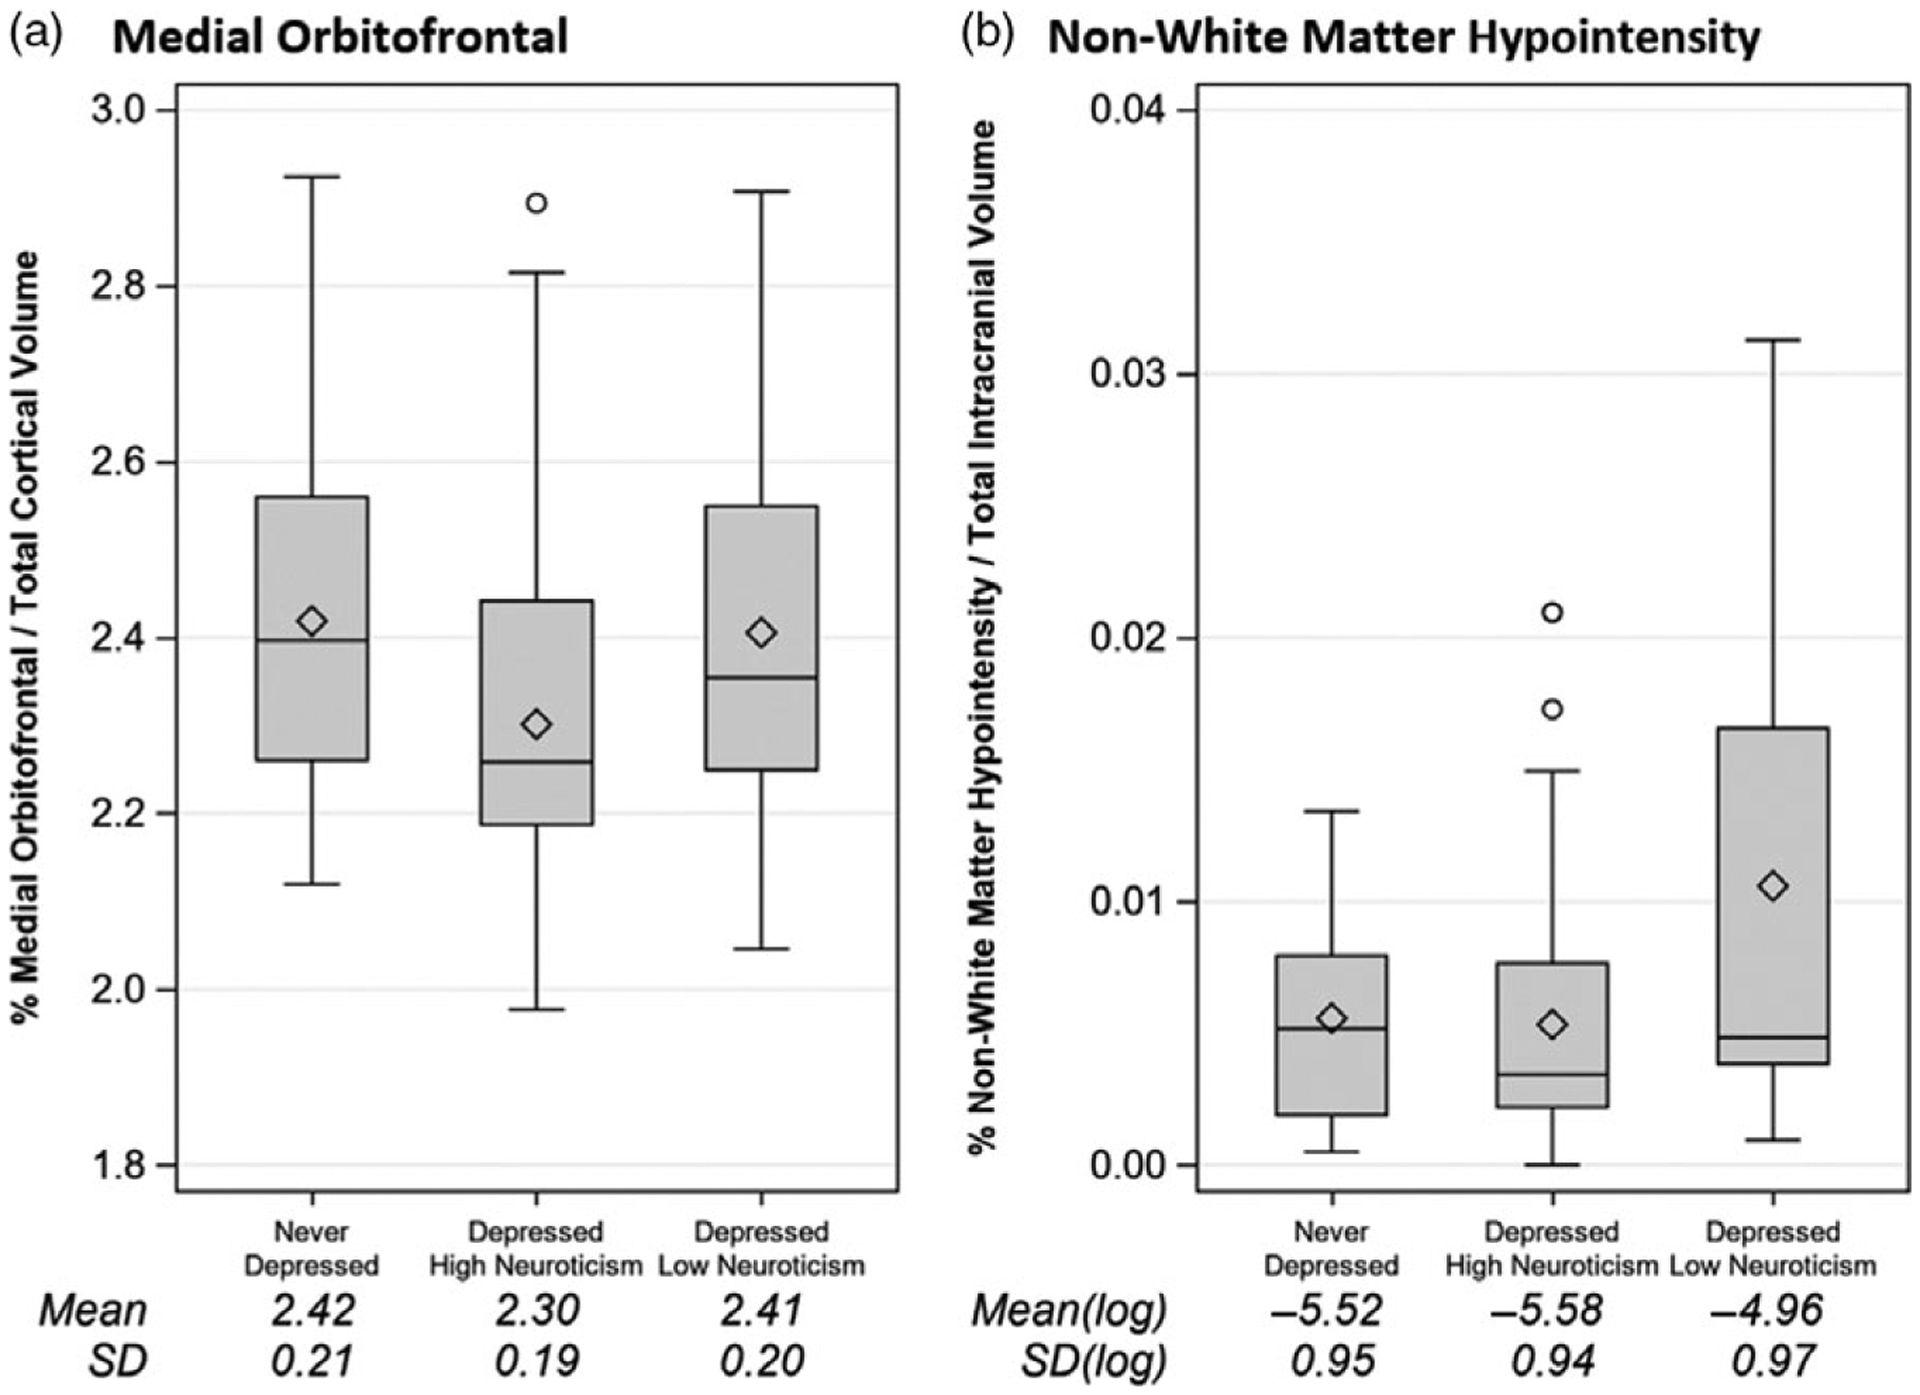
Boxplots showing structural imaging results across three groups. (a) Medial orbitofrontal cortex volumes. (b) Non-white matter hypointensity volumes.
We did not find significant between-group differences in white matter volumes. However, we found a significant group difference with the volume of non-white matter hypointensity (F[2,97] = 3.69, p = 0.028), with volumes greater in non-neurotic depressed subjects than in the other two groups. Post hoc analyses confirmed a significant difference between non-neurotic depressed and neurotic depressed subjects (Δ[of log-transformed value] = 0.54, Tukey-adjusted 95% CI = [0.02, 1.06], p = 0.04), but no significant difference between low-neurotic depressed subjects and comparison subjects (Δ[of log-transformed value] = 0.66, Tukey-adjusted 95% CI = [ − 0.025, 1.34], p = 0.061) or between never-depressed and neurotic depressed. (p = 0.89, see Figure 1b). With a mean of − 4.96 for non-neurotic depressed subjects, the effect sizes captured by the deltas above represent ~10% change from the mean.
We next examined brain regional volumes of all participants using the FreeSurfer program to double confirm the statistical results mentioned above, and we found there was indeed a group difference in the medial orbitofrontal cortex. There was also a significant difference in non-white matter hypointensity, but it was not significant when clusterwise correction was used to correct for multiple comparisons. We further inspected T1-weighted images for each subject, and found that the majority of hypointensities were located in the basal ganglia area, and particularly in the bilateral putamen.
Discussion
In this study, we confirmed our hypothesis that older depressed individuals high in neuroticism would have smaller frontal lobe volumes (exemplified by smaller medial orbitofrontal cortex volumes) compared to older non-neurotic depressed subjects and never-depressed older subjects. We did not find a difference in hippocampal volumes. In addition, we found that depressed subjects low in neuroticism had a higher volume of non-white matter hypointensities, especially in the bilateral putamen.
Our finding that those high in neuroticism had smaller frontal volumes compared with non-neurotic depressed and nondepressed comparison subjects implies that there may be a neurobiological mechanism specific to the older neurotic depressed group that involves diminished executive control over emotional reactivity. This result is consistent with a study in young healthy adults, which showed an association between higher neuroticism and smaller left orbitofrontal cortex (Wright et al., 2006). In contrast, those low in neuroticism had greater non-white matter hypointensity volumes compared with depressed patients high in neuroticism. Our finding that most of the hypointensities were in the basal ganglia, especially the bilateral putamen, is interesting, as these changes typically are due to cerebrovascular ischemia. Putaminal vascular changes have been previously reported in LLD (Tupler et al., 2002) and support the notion that older non-neurotic depressed patients may have vascular depression, another distinct subtype previously reported (Krishnan et al., 1997). Here, the neurobiological mechanism is structural disconnection among key brain networks involved in emotion regulation. The magnitude of differences (i.e. effect sizes) represents about 4% and 10% for normalized medial orbitofrontal cortex and non-white matter hypointensity volumes, respectively. The challenge in interpreting these findings is that there are no currently accepted definitions for meaningful neu-roimaging differences.
Our results suggest that multiple biological pathologies that can lead to different clinical expressions of LLD, particularly in the presence or absence of comorbid neuroticism. Vascular changes in low neuroticism older depressed are indicative of fronto-striatal pathophysiology, consistent with the vascular depression hypothesis proposed over two decades ago. In contrast, our finding of frontal changes in the high neuroticism depressed group supports a growing literature highlighting the importance of the prefrontal cortex in older depressed adults with neuroticism (Steffens et al., 2017). It is plausible that early adversity contributes to neurotic personality traits, including a hypersensitivity to perceived threat and the tendency to react negatively to stress, and results in lifelong brain changes, or neuroticism moderates the effect of mid or later life stress on subsequent brain function (Gatt et al., 2009). This association requires further investigation.
This study has limitations that include the relatively small number of never-depressed participants, not correcting for multiple statistical comparisons, and our inability to find differences in hippocampal volume among groups, which has been previously reported. Despite these weaknesses, we were able to examine multiple brain structures in a large sample of depressed elders who underwent a comprehensive assessment of neuroticism with the NEO-PI-R. Future studies should investigate imaging differences between facets of neuroticism, as there is evidence to suggest differential clinical outcomes among varying facets.
Supplementary Material
Acknowledgements
The investigators wish to acknowledge Dr. Godfrey Pearlson, Director of the Olin Neuropsychiatry Research Center, Institute of Living/Hartford Hospital, Hartford, CT, and Professor of Psychiatry, Yale University School of Medicine, for providing access to the 3T scanner and for his key input into the development of MRI protocols for the study.
Funding
This study was supported by U.S. National Institute of Health grant R01 MH108578.
Footnotes
Conflict of interest
None.
Supplementary material
To view supplementary material for this article, please visit https://doi.org/10.1017/S1041610221000284.
References
- Costa PT and McCrae RR (1992). NEO PI-R Professional Manual. Odessa, FL: Psychological Assessment Resources. [Google Scholar]
- Dale AM, Fischl B and Sereno MI (1999). Cortical surface-based analysis. I. Segmentation and surface reconstruction. Neuroimage, 9, 179–194. doi: 10.1006/nimg.1998.0395. [DOI] [PubMed] [Google Scholar]
- Gatt JM et al. (2009). Interactions between BDNF Val66Met polymorphism and early life stress predict brain and arousal pathways to syndromal depression and anxiety. Molecular Psychiatry, 14, 681–695. doi: 10.1038/mp.2008.143. [DOI] [PubMed] [Google Scholar]
- Krishnan KR, Hays JC and Blazer DG (1997). MRI-defined vascular depression. The American Journal of Psychiatry, 154, 497–501. doi: 10.1176/ajp.154.4.497. [DOI] [PubMed] [Google Scholar]
- Li JJ, Hilton EC, Lu Q, Hong J, Greenberg JS and Mailick MR (2019). Validating psychosocial pathways of risk between neuroticism and late life depression using a polygenic score approach. Journal of Abnormal Psychology, 128, 200–211. doi: 10.1037/abn0000419. [DOI] [PMC free article] [PubMed] [Google Scholar]
- Montgomery SA and Asberg M (1979). A new depression scale designed to be sensitive to change. British Journal of Psychiatry, 134, 382–89. [DOI] [PubMed] [Google Scholar]
- Steffens DC, Manning KJ, Wu R, Grady JJ, Fortinsky RH and Tennen HA (2015). Methodology and preliminary results from the neurobiology of late-life depression study. International Psychogeriatrics, 27, 1987–1997. doi: 10.1017/S1041610215001386. [DOI] [PMC free article] [PubMed] [Google Scholar]
- Steffens DC, Wang L, Manning KJ and Pearlson GD (2017). Negative Affectivity, Aging, and Depression: Results From the Neurobiology of Late-Life Depression (NBOLD) Study. American Journal of Geriatric Psychiatry, 25, 1135–1149. doi: 10.1016/j.jagp.2017.03.017. [DOI] [PMC free article] [PubMed] [Google Scholar]
- Steunenberg B, Braam AW, Beekman AT, Deeg DJ and Kerkhof AJ (2009). Evidence for an association of the big five personality factors with recurrence of depressive symptoms in later life. International Journal of Geriatric Psychiatry, 24, 1470–1477.doi: 10.1002/gps.2291. [DOI] [PubMed] [Google Scholar]
- Tupler LA, Krishnan KR, McDonald WM, Dombeck CB, D’Souza S and Steffens DC (2002). Anatomic location and laterality of MRI signal hyperintensities in late-life depression. Journal of Psychosomatic Research, 53, 665–676. doi: 10.1016/s0022-3999(02)00425-7. [DOI] [PubMed] [Google Scholar]
- Wright CI et al. (2006) Neuroanatomical correlates of extraversion and neuroticism. Cerebral Cortex, 16, 1809–1819. doi: 10.1093/cercor/bhj118. [DOI] [PubMed] [Google Scholar]
- Xekardaki A, Santos M, Hof P, Kovari E, Bouras C and Giannakopoulos P (2012). Neuropathological substrates and structural changes in late-life depression: the impact of vascular burden. Acta Neuropathologica, 124, 453–464. doi: 10.1007/s00401-012-1021-5 [DOI] [PubMed] [Google Scholar]
Associated Data
This section collects any data citations, data availability statements, or supplementary materials included in this article.