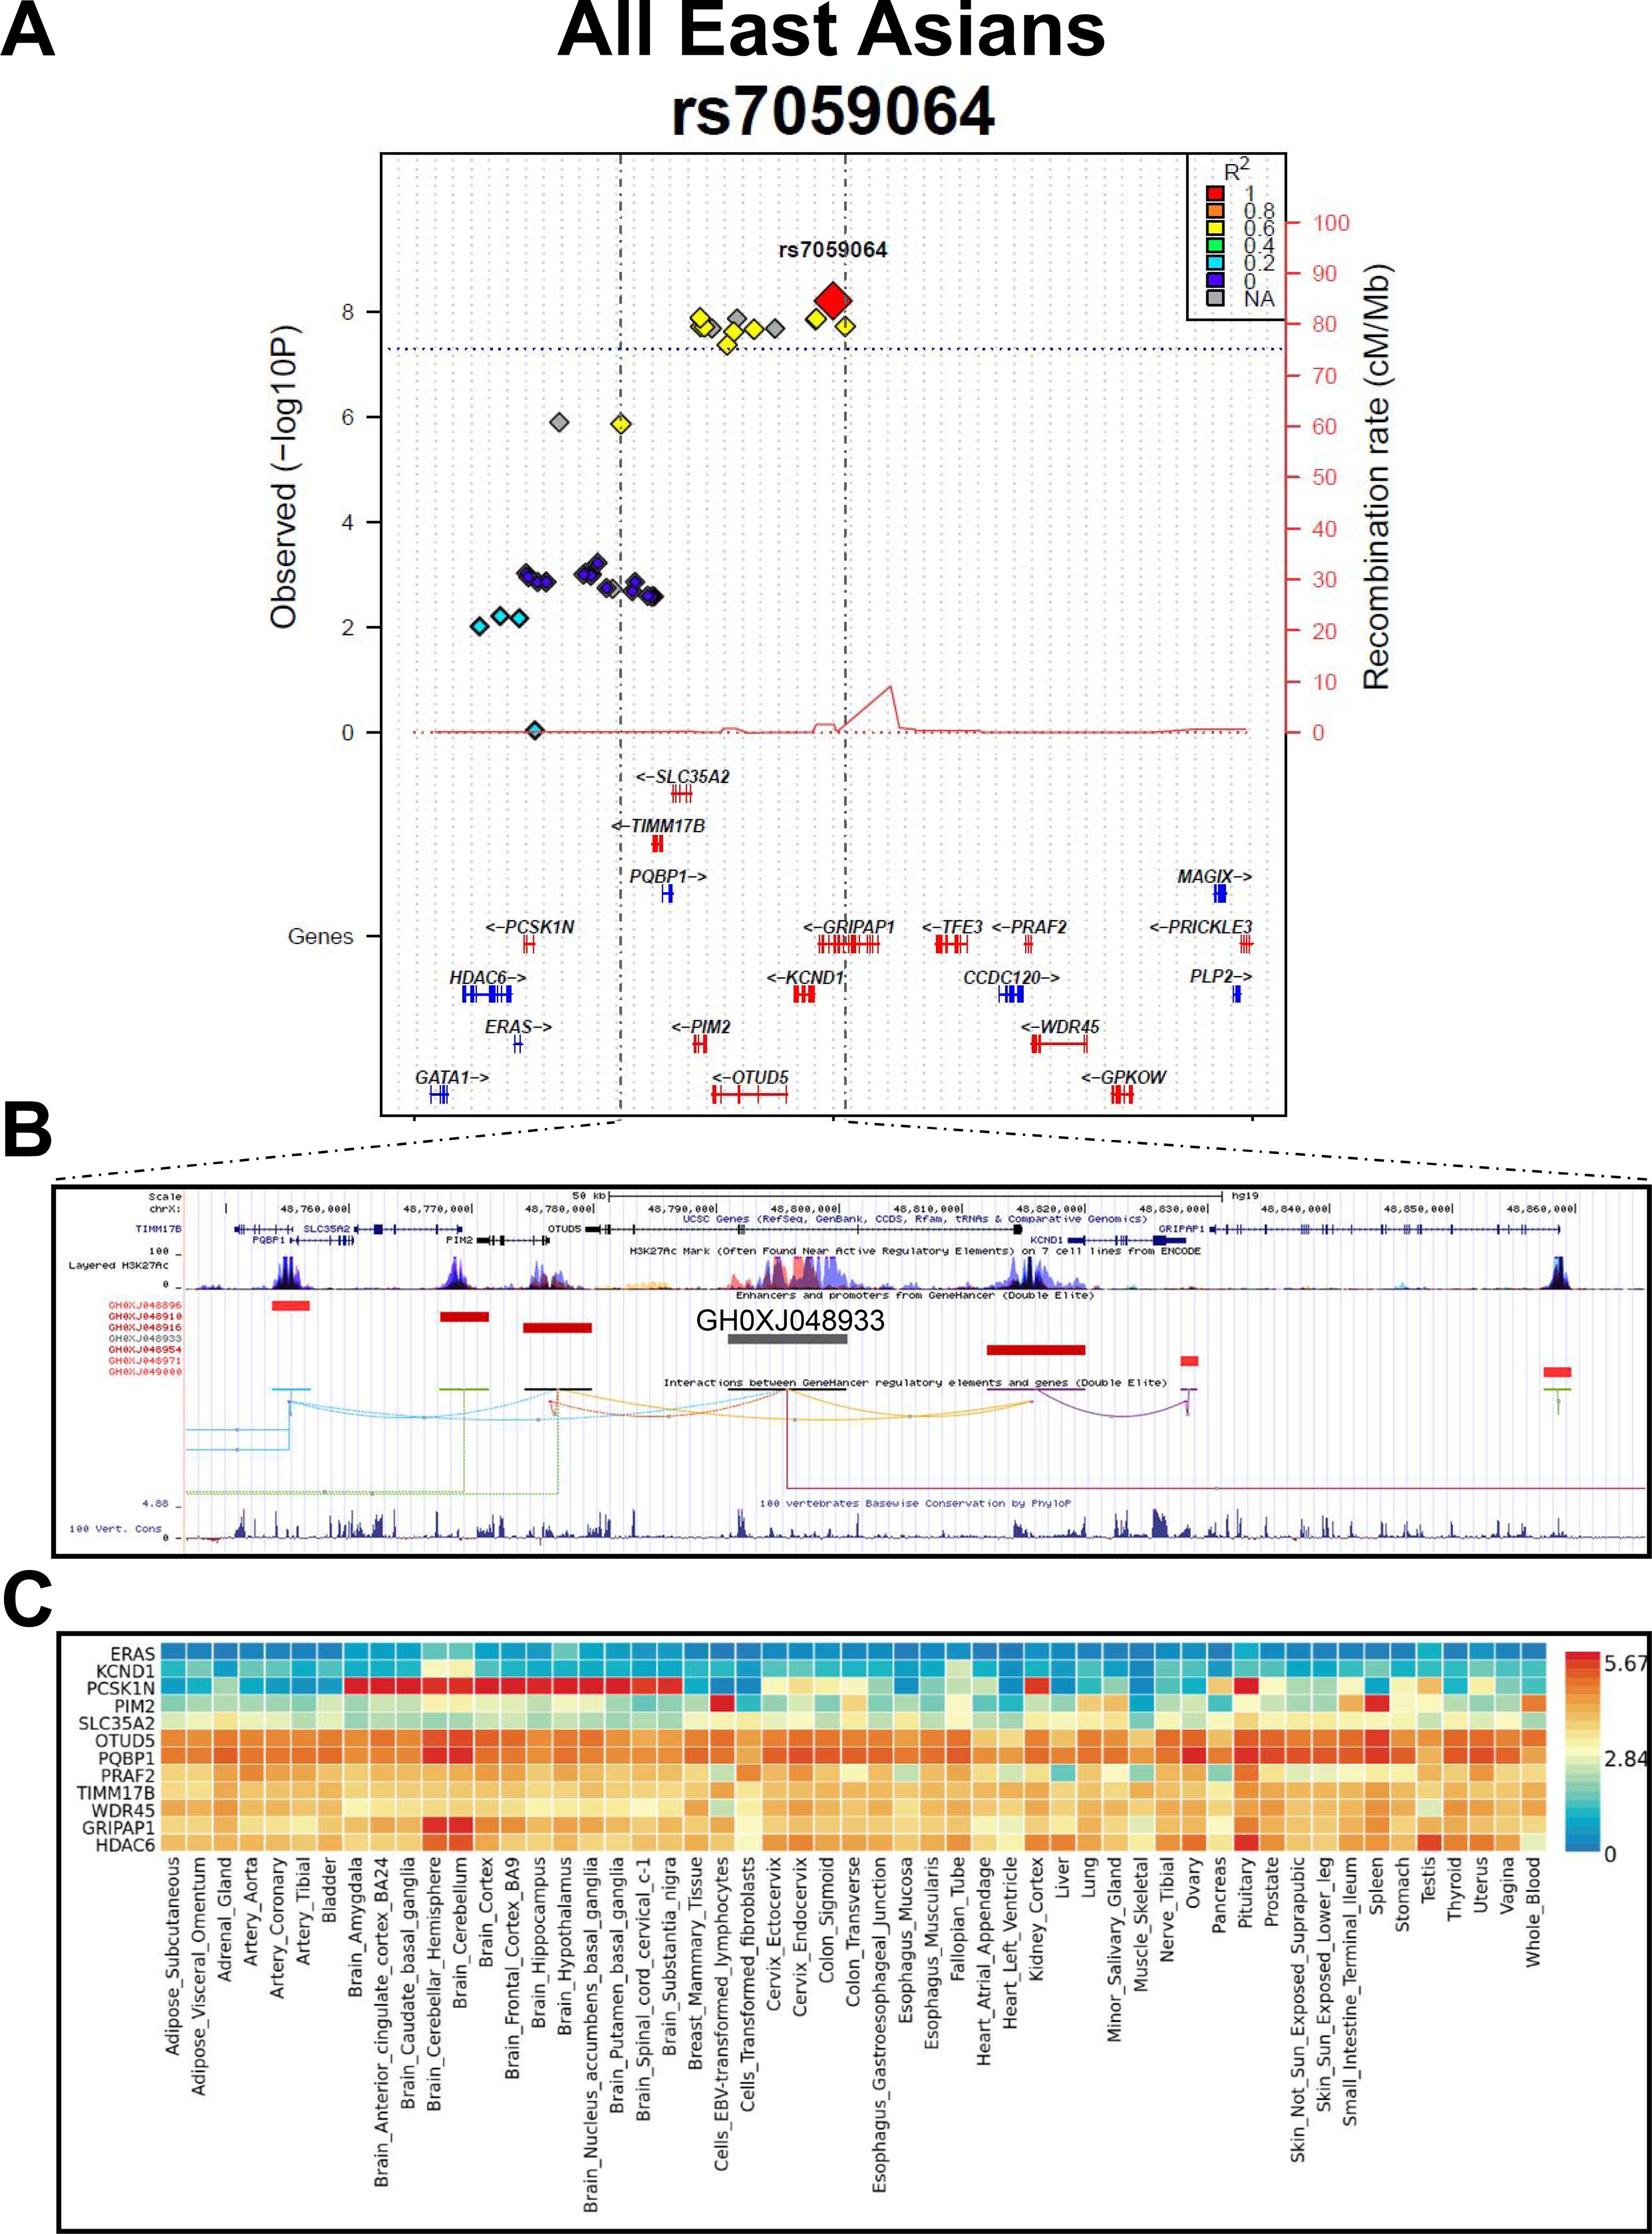
Figure 3. The GRIPAP1/PIM2 locus.

A) Plot of the regional association signals surrounding the rs7059064 top hit in East Asians. The plot was built using the LocusTrack site (https://gump.qimr.edu.au/general/gabrieC/LocusTrack/).40
B) Screenshot from the UCSC Genome browser (http://genome.ucsc.edu/; GRCh37/hg19) highlighting the PBC-associated LD region (coordinates chrX:48,750,000–48,865,000). The panel shows the following tracks: i) the ruler with the scale at the genomic level; ii) chrX nucleotide numbering; iii) the UCSC RefSeq track; iv) ENCODE data (https://www.encodeproject.org/) for H3K4Me1, H3K4Me3, H3K27Ac histone marks, derived from seven cell lines; v) enhancers (grey bars) and promoters (red bars) from GeneHancer41 with the GH0XJ048933 enhancer targets; vi) interactions (curved lines) connecting GeneHancer regulatory elements/genes; vii) basewise conservation track.
C) Expression panel across tissues of the genes depicted in panel A (GTEx data; https://gtexportal.org/home/).
