Abstract
BACKGROUND & AIMS:
Although the role of gut microbiota in Clostridioides difficile infection (CDI) has been well established, little is known about the role of mycobiota in CDI. Here, we performed mycobiome data analysis in a well-characterized human cohort to evaluate the potential of using gut mycobiota features for CDI diagnosis.
METHODS:
Stool samples were collected from 118 hospital patients, divided into three groups: CDI (n = 58), asymptomatic carriers (Carrier, n = 28) and Control (n = 32). The nuclear ribosomal DNA internal transcribed spacer 2 was sequenced using the Illumina HiSeq platform to assess the fungal composition. Downstream statistical analyses (including Alpha diversity analysis, ordination analysis, differential abundance analysis, fungal correlation network analysis, and classification analysis) were then performed.
RESULTS:
Significant differences were observed in alpha and beta diversity between CDI patients and Carrier (P < .05). Differential abundance analysis identified two genera (Cladosporium and Aspergillus) enriched in Carrier. The ratio of Ascomycota to Basidiomycota was dramatically higher in CDI patients than in Carrier and Control (P < .05). Correlations between host immune factors and mycobiota features were weaker in CDI patients than in Carrier. Using 4 fungal OTUs combined with 6 host immune markers in the random forest classifier can achieve very high performance (AUC~92.38%) in distinguishing CDI patients from Carrier.
CONCLUSIONS:
Our study provides specific markers of stool fungi combined with host immune factors to distinguish CDI patients from Carrier. It highlights the importance of gut mycobiome in CDI, which may have been underestimated. Further studies on the diagnostic applications and therapeutic potentials of these findings are warranted.
Keywords: C. difficile, Diagnostics, Gut Mycobiome, Immune response
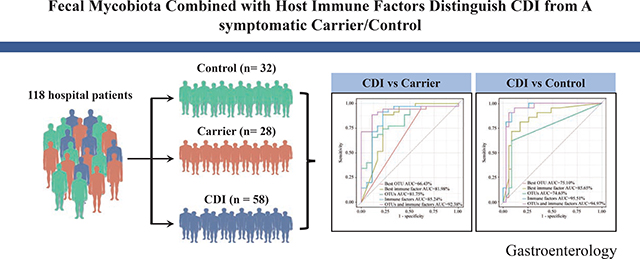
Graphical Abstract
Introduction
Clostridioides difficile (C. difficile) remains the leading cause of healthcare-associated infectious diarrhea and is responsible for 500,000 illnesses and up to 30,000 deaths annually in the United States1. Exposure to C. difficile can lead to asymptomatic carriage (presence of toxinogenic C. difficile in the colon, but no symptoms), or C. difficile infection (CDI) with a range of clinical presentations (ranging from mild diarrhea to severe colitis and/or death)2. Asymptomatic C. difficile colonization refers to the shedding of C. difficile in stool but without diarrhea or other clinical symptoms3. Previous studies revealed that asymptomatic C. difficile colonized patients in the acute care setting may be protected from progression to infection since they can mount a humoral immune response to C. difficile toxins4. Toxin-targeting treatments, such as vaccines and monoclonal antibodies, may protect against CDI recurrence but are unlikely to prevent asymptomatic colonization with C. difficile5, 6.
Currently, no diagnostic method can accurately differentiate CDI from C. difficile colonization. This constitutes a critical unmet need in clinical care. Literature regarding colonized patients varies significantly in the patient inclusion criteria, tested material, and applied diagnostic and gold standard tests. Additionally, various diagnostic screening tests have been used to detect C. difficile, frequently divided into assays to recognize toxinogenic or nontoxinogenic strains3. Our previous study also revealed that neither stool toxin concentration nor nucleic acid amplification testing (NAAT) cycle threshold value can reliably distinguish a symptomatic CDI patient from a C. difficile colonized patient with diarrhea due to other causes2, 7. Therefore, novel diagnostic markers for differentiation of CDI from asymptomatic carriers (Carrier) are urgently needed.
The human gastrointestinal tract harbors a complex and diverse community of commensal microorganisms, providing a variety of beneficial effects to the host. They contribute to the maintenance of intestinal homeostasis and epithelial integrity and exert anti-inflammatory effects by interacting with the mucosal immune system8. A healthy microbiome, composed of diverse communities of bacteria, viruses, fungi, protozoa, and archaea, offers colonization resistance against pathogens through various mechanisms9. Hence, disruption of the microbiome (a.k.a. microbial dysbiosis) due to immunodeficiency, chemotherapy, antibiotic use, or other factors, is known to increase the risk of CDI by disrupting the gut microbiome’s ability to resist pathogen colonization or by weakening the intestinal barrier10.
While growing evidence supports the importance of the gut microbiota11, 12 and bacteriophages13 in the pathogenesis of CDI, the potential role of the fungal component of the gut microbiota, namely the gut mycobiota, in CDI has long been overlooked. A few existing studies focused on the gut mycobiota comparison between CDI patients and healthy Control14. There is a paucity of literature studying the gut mycobiota difference between CDI patients and Carrier. This represents a significant knowledge gap that warrants filling and can be essential for understanding the overall gut microbiota dysbiosis associated with CDI.
We hypothesize that the fecal mycobiota can serve for CDI diagnosis purpose. To test this hypothesis, we analyzed mycobiota data analysis of 118 hospitalized individuals that consist of CDI patients (n = 58), antibiotic exposed Carrier (n = 28), and antibiotic exposed asymptomatic non-carriers (n = 32). In this study, we aimed to profile gut mycobiota using internal transcribed spacer 2 (ITS2) sequencing of stool samples from these individuals. Infection with C. difficile leads to both adaptive and innate immune responses15. Our several previous studies revealed that adaptive immune responses to C. difficile toxins have been associated with symptomless carriage16, 17. Meanwhile, C. difficile and its toxins are potent activators of innate immune responses in vitro and in vivo18. Our previous study also showed that specific serum markers of innate and adaptive immunity can distinguish CDI from Carrier7. Hence, here we also aimed to determine whether these immune factors combined with specific fungal markers could further increase the discriminative power between CDI and Carrier.
Methods
Study participants.
The background and design of this cohort has been detailed in our previous study2, 7. Concisely, all individuals were adults (age > 18 years old). CDI patients were inpatients with positive clinical stool NAAT result, new-onset diarrhea, and a decision to treat for CDI. The diagnostic clinical stool sample was captured as a discarded sample; a discarded serum sample collected within 1 day of that stool sample was also captured. Patients were excluded if the diagnostic stool specimen was more than 72 hours old, if they had received CDI treatment for more than 24 hours prior to stool collection, or if they had a colostomy. Carrier were admitted for at least 72 hours, had received at least one dose of an antibiotic within the past 7 days, and did not have diarrhea in the 48 hours prior to stool sample collection, but had positive NAAT results on stool testing and were not treated for CDI. Patients with 2 or more loose stools within a 24-hour period were excluded; patients with 1 loose stool were included only if providers had recently administered a laxative. Patients were excluded if they had a colostomy; received oral or intravenous metronidazole, oral vancomycin, oral rifaximin, and/or oral fidaxomicin for more than 24 hours within the prior 7 days; had been diagnosed with CDI in the past 6 months; or had tested negative for C. difficile within the past 7 days. Stool samples were collected prospectively under verbal informed consent. A discarded serum sample from within 1 day of the stool sample was also captured. Control groups included individuals without diarrhea who had screened as eligible for the Asymptomatic Carrier group but were NAAT negative on stool testing. Discarded serum samples were captured within 1 day of the stool sample. Patients who had antifungal medication 7 days prior to sample collection were excluded.
Serum immune marker measurement
The measurement of host serum cytokines concentrations of IL2, IL4, IL6, IL8, IL10, IL13, IL15, IL1β, GCSF, MCP1, VEGFA and TNFα was performed using a Milliplex magnetic bead kit and Luminex analyzer (MAGPIX) (Millipore Sigma, Inc., Burlington, MA) as per the manufacturer’s instructions. Serum antibody levels against C. difficile toxins A (anti-toxin A IgA, anti-toxin A IgG and anti-toxin A IgM) and B (anti-toxin B IgA, anti-toxin B IgG and anti-toxin B IgM) were measured by semi-quantitative enzyme-linked immunosorbent assay (ELISA). All the experimental details have been reported previously2, 7.
Fungal ITS2 sequencing and bioinformatics analysis.
ITS2 sequencing was conducted on an Illumina HiSeq platform (Illumina Hiseq 2500). Details of fecal DNA isolation, ITS2 sequencing, library preparation, data processing and bioinformatics analysis are available online as supplementary methods.
Data analysis.
Alpha (i.e., within-sample) diversity measures: Chao1 (estimated richness) and Shannon diversity of any two groups were compared using Wilcoxon rank sum test19. Permutational multivariate analysis of variance (PERMANOVA) was performed with the default 999 permutations based on the Adonis and the Bray-Curtis and unweighted UniFrac distance20. Note that in the PERMANOVA tests, we only included subjects with known information of age, sex, race and ethnicity. ANCOM was conducted after removing spurious observations using default parameters with a Benjamini-Hochberg correction significance threshold of 0.0521. The P values of Ascomycota to Basidiomycota ratio was calculated based on Wilcoxon rank sum test22. Microbial correlation network was constructed using SparCC23. Correlated genus pairs were selected if the absolute value of sparse correlation |r| > 0.1 and P < .05. All statistical analysis was performed using R, except SparCC analysis (based on python).
Results
Study population.
Fecal samples from our clinical cohorts of 118 patients from Beth Israel Deaconess Medical Center (BIDMC) were prospectively collected, including 58 stool samples of the CDI cohort, 28 of Carrier, and 32 stool samples of Control subjects. There was no difference in clinical characteristics of the participants including sex, age, gender and ethnicity among the three groups (P > .05, Supplementary Table 1) as described in detail previously7. PERMANOVA showed that cohorts and clinical characteristics of the participants such as age, sex, race and ethnicity had no significant effect on the mycobiome composition (P > .05, Supplementary Table 2).
Characteristics of the sequence datasets.
With fungal ITS2 region sequencing, the total number of sequences was 7,418,956, with an average of 62,344 reads per sample, the average length of the reads was approximately 383 bp. Sequences were clustered into 712 OTUs based on their shared sequence similarity at a 97% threshold. Overall, a total of 6 phyla, 26 classes, 74 orders, 165 families, and 279 genera from fungi were identified, while 410 OTUs were identified to the species level.
Ecological features of the fecal fungal communities.
A Shannon-Wiener curves analysis was performed to evaluate whether we obtained sufficient sequencing sampling reads to perform a meaningful ITS2 analysis. The number of OTUs plateaued in all samples as the sample sequencing reads increased (Supplementary Figure 1A), suggesting that we acquired a sufficient number of sequencing sampling reads to reach plateau levels. All samples had a good depth of coverage as indicated by the Good’s coverage estimates (>99.98%, data not shown).
The Venn diagram depicts those OTUs that were unique to three cohorts, or shared by them. Venn diagram showed that 128 of the total 712 OTUs were shared among the three groups, while 466 of 712 OTUs were unique for three groups (Supplementary Figure 1B).
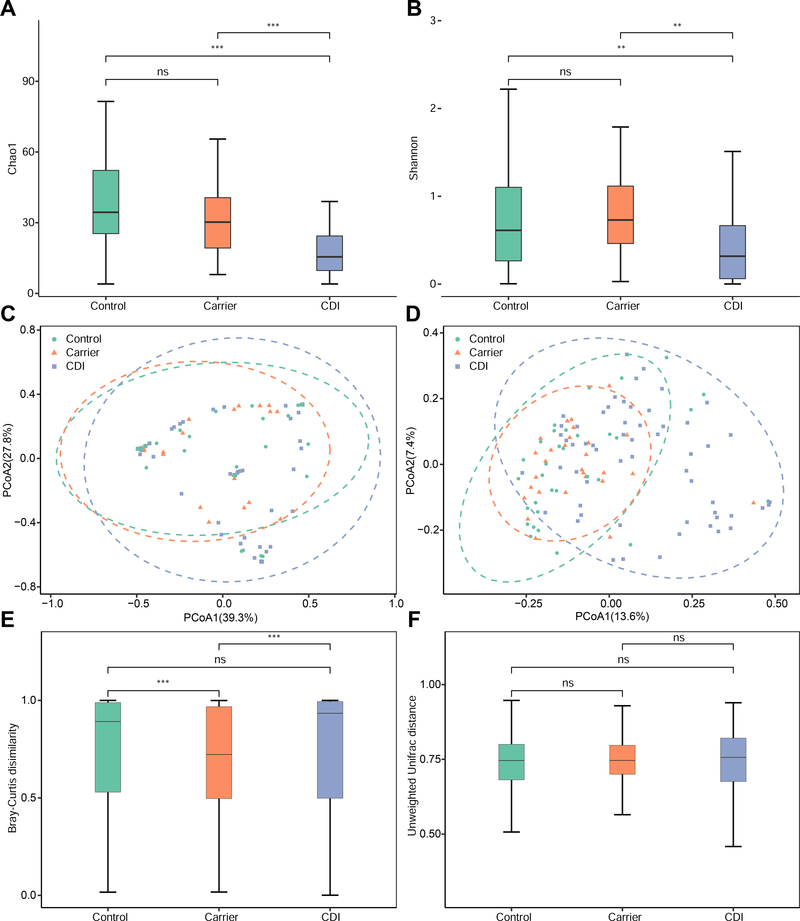
In order to assess the variations of fungal biodiversity, the Chao1 index (estimated richness) and Shannon diversity were used to compare the three groups at the OTU levels. Compared with the Carrier and Control groups, the fungal richness and diversity were significantly decreased in the CDI group (P < .01; Figure 1A and B).
Figure 1. Alpha and beta diversities, and ordination analysis of the gut mycobiota with three distinct phenotypes: Control, Carrier and CDI.
A,B: The alpha diversity analysis was based on: Chao1 index (A) and Shannon index (B). C,D: Principle Coordinate Analysis (PCoA) of the fungal compositions at the operational taxonomic unit (OTU) level based on the Bray-Curtis dissimilarity (C) and unweighted UniFrac distance (D). The ellipses represent the 95% of the samples belonging to each group. Dissimilarity was analyzed using Adonis statistical tests with 999 permutations based on Bray-Curtis dissimilarity: CDI vs Carrier (R2 = 0.0299, P = .032), CDI vs Control (R2 = 0.0121, P = .337) and Carrier vs Control (R2 = 0.0147, P = .491). Similar analysis based on unweighted UniFrac distance yielded: CDI vs Carrier (R2 = 0.0363, P = .001), CDI vs Control (R2 = 0.0361, P = .001) and Carrier vs Control (R2 = 0.0118, P = .957). E,F: The beta diversity analysis was based on Bray-Curtis dissimilarity (E) and unweighted UniFrac distance (F). ns: P > .05, *P < .05, **P < .01, ***P < .001.
To display fungal community composition among cohorts, we performed Principal Coordinates Analysis (PCoA) using Bray-Curtis and the unweighted UniFrac distance. These data indicated that the fungal compositions of CDI patients vary more prominently than Carrier. As expected, significant differences of fungal compositions were observed between CDI and Carrier (P < .05) when analyzed by pairwise tests (Figure 1C and D). Interestingly, no significant difference was observed between Carrier and Control (P > .05; Figure 1C and D). Meanwhile, by directly comparing the beta diversity of each group, we found that the CDI group had the largest variability, whereas the Carrier group showed lower variability (Figure 1E and F), indicating that the fungal compositions of participants within the CDI group vary more prominently than Carrier.
Taxonomic composition of the gut mycobiota.
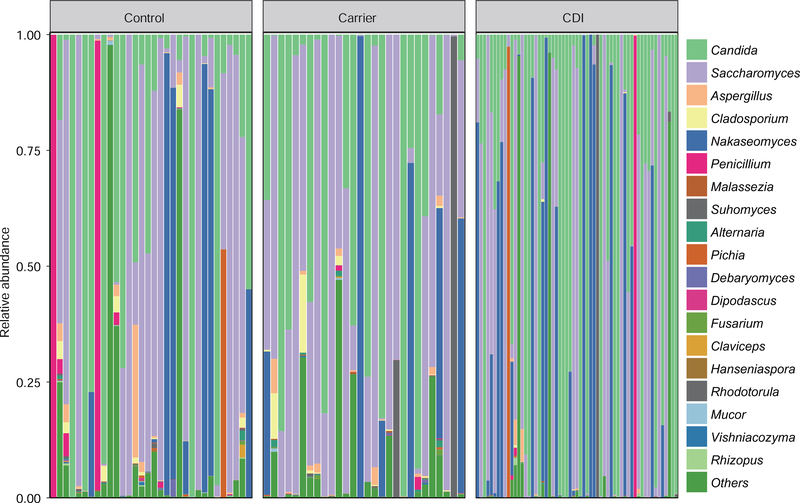
Fungal phyla of Ascomycota, Basidiomycota and unclassified fungi, together accounting for up to 90% of sequences on average, were the three dominant taxa in all three groups (Supplementary Figure 2). Fungal genera of Saccharomyces, Candida, Nakaseomyces, and Penicillium were the dominant taxa among these groups (Figure 2). The ternary plot showed that Carrier shared higher proportions of fungal communities (at the genus level) with Control subjects than with CDI patients (Supplementary Figure 3A). Further classification at the genus level, a hierarchical heat map of the relative abundance of top-30 most abundant fungal genera (Supplementary Figure 3B) indicated that fungal communities of those three groups were quite unique.
Figure 2. Genus-level taxonomic profiles of the gut mycobiota from three distinct phenotypes: Control, Carrier and CDI.
Only genera with ≥ 1% abundance in at least one sample were depicted. Otherwise, they were included in the category “others”.
Ascomycota:Basidiomycota ratio.
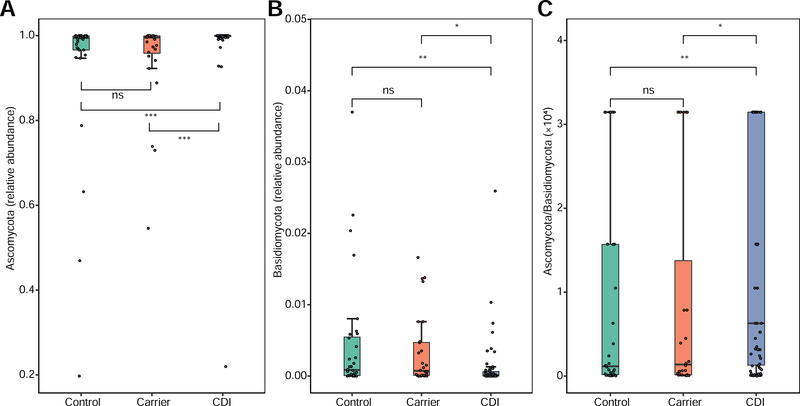
A previous work revealed that gut mycobiota is dysbiotic in inflammatory bowel disease patients with much lower Ascomycota:Basidiomycota ratio than that of healthy Control22. The prompts us to study the Ascomycota:Basidiomycota ratio in our cohort. Interestingly, we found that the Ascomycota:Basidiomycota ratio was dramatically higher in CDI than in Carrier (P < .05, Figure 3). These results suggested that the Ascomycota:Basidiomycota ratio could represent a fungal dysbiosis index to differentiate CDI from Carrier.
Figure 3. The relative abundance and ratio of Ascomycota to Basidiomycota of gut mycobiota from three distinct phenotypes: Control, Carrier and CDI.
(A) Ascomycota, (B) Basidiomycota, (C) Ascomycota to Basidiomycota ratio. Data are presented as median and 95% CI with P values based on Wilcoxon rank sum test. ns: P > .05, *P < .05, **P < .01, ***P < .001.
Fungal differential abundance analysis.
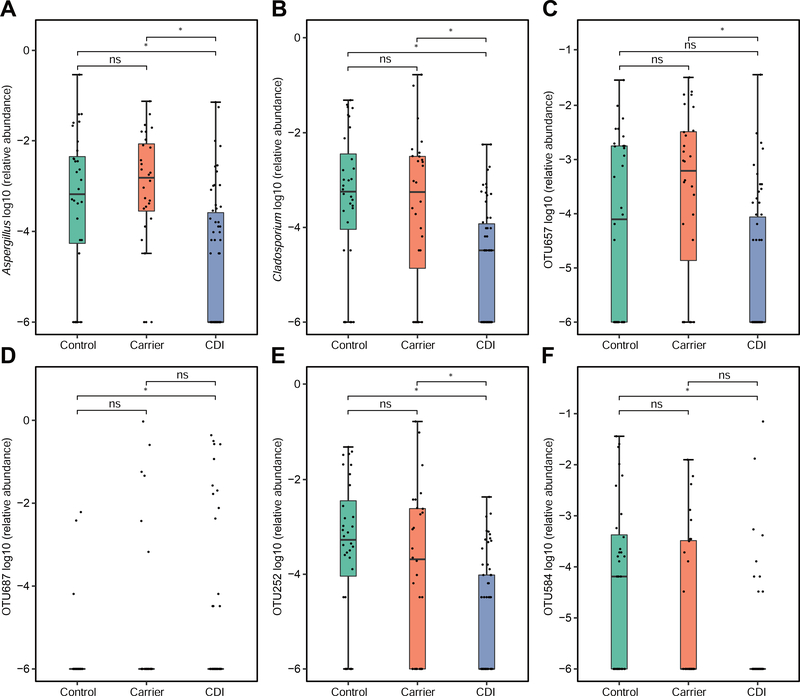
When conducting differential abundance analysis, ANCOM detected 2 differentially abundant fungal genera (Supplementary Table 3; Figure 4), including genera Aspergillus and Cladosporium. ANCOM also detected 2 differentially abundant fungal OTUs (OTU657: Aspergillus proliferans; OTU252: unclassified_g_Cladosporium, an unclassified OTU within genus Cladosporidium) between CDI and Carrier, also detected 3 differentially abundant fungal OTUs (OTU252; OTU584: unclassified_g_Aspergillus; OTU687: Candida dubliniensis) between CDI and Control (Supplementary Table 4; Figure 4). No differentially abundant fungal genera or OTUs were found between Carrier and Control. These results suggested that differentially abundant fungal genera or OTUs could be used as potential biomarkers to differentiate CDI from Carrier.
Figure 4. Differentially abundant fungal taxa among the three phenotypical groups: Control, Carrier and CDI.
Differentially abundant genera (A-B) and OTUs (C-F) were found using ANCOM. Note that for a taxon that is absent in most subjects, the interquartile range (difference between first quartile and third quartile) will be extremely small. ns: P > .05, *P < .05.
Fungal correlation networks.
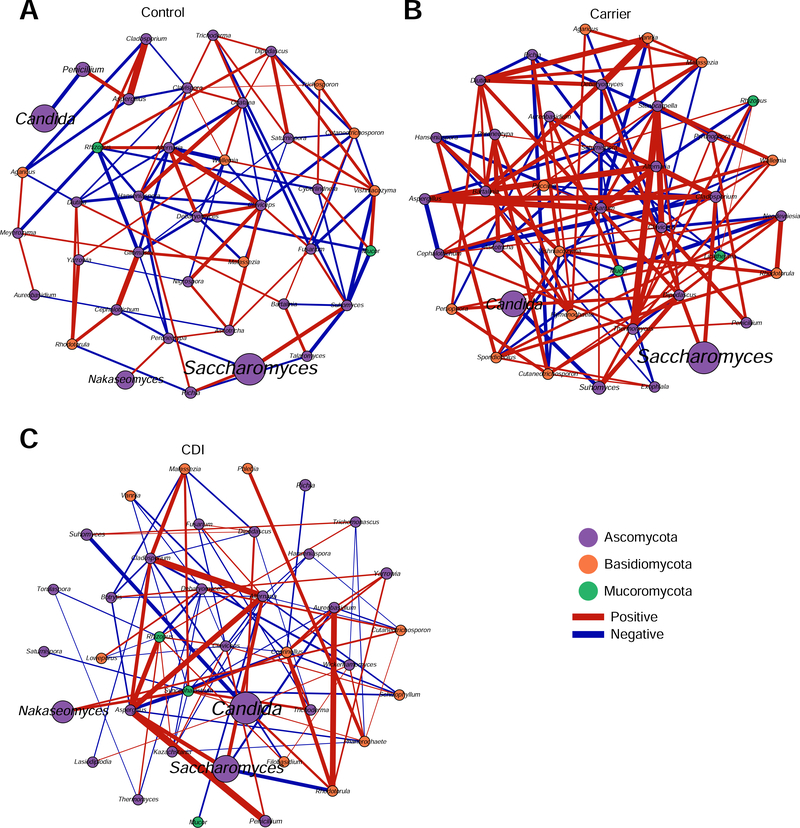
To compare the fungal communities of the three groups at the network-level, we constructed the fungal correlation network for each group using SparCC23 (sparse correlations for compositional data). We found that the fungal correlation network of the CDI group has quite different structure compared to the other two groups. The overall fungal correlations in the CDI group are much weaker than those in the Carrier group (Figure 5). We also observed the disappearance of some fungal correlations in CDI compared to Carrier and Control. Strong positive correlations were found among Aspergillus, Cladosporium, and Saccharomyces, while Ascomycota and Basidiomycota exhibited the strong negative correlation in all three cohorts (P <.05, data not shown).
Figure 5. Fungal correlation networks of the three phenotypical groups: Control (A), Carrier (B) and CDI (C).
Nodes represent genera and are colored based on their phylum. Edges represent fungal correlations: green/red means positive/negative correlations, respectively. Edge thickness indicates the absolute value of correlation coefficient, and only the high confidence interactions (P < .05) with high absolute correlation coefficients (> 0.1) were presented.
Diagnostic accuracy of CDI classification based on host immune markers and gut mycobiota.
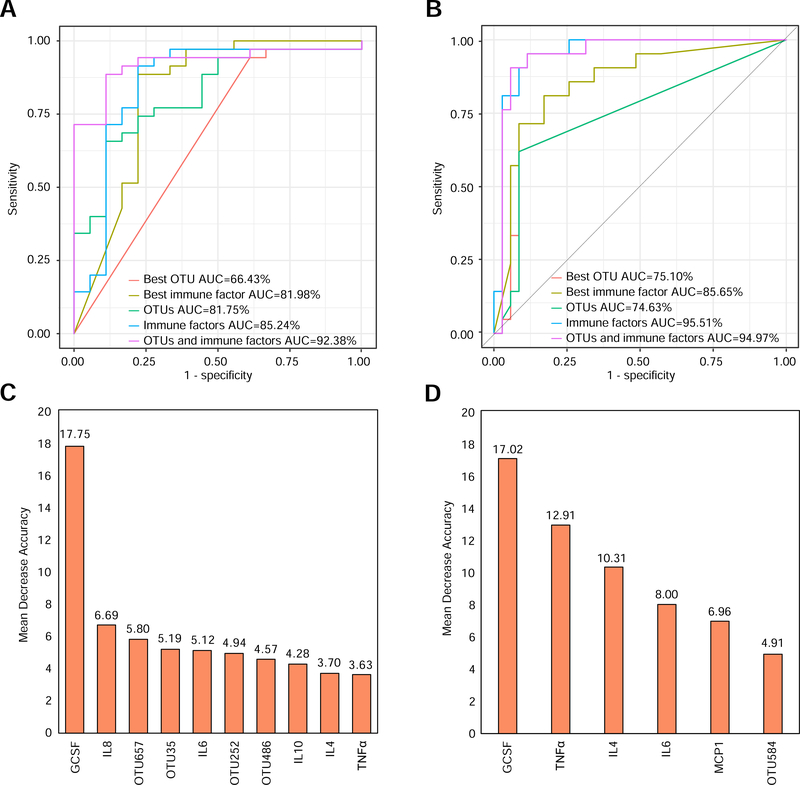
To illustrate the diagnostic power of fecal mycobiota and immune factors, we constructed a Random Forest Classifier to distinguish CDI from Carrier or Control. The classification performance was evaluated by the area under the curve (AUC) of receiver operating characteristic (ROC). In classifying CDI and Carrier, we found that OTU486 (unclassified_o_Pleosporales) is the top feature with AUC~0.664, and GCSF remains as the top immune feature as we previously reported7 with AUC~0.820 (Figure 6A). For the optimal marker sets of OTUs (or immune factors), we achieved AUC~0.818 (or 0.8524), respectively. Notably, combining features of fungal OTUs with immune factors reached a superior classification with AUC~0.924. The optimal set of consisted of 4 fungal OTU (OTU657: Aspergillus_proliferans, OTU35: unclassified fungi, OTU252: unclassified_g_Cladosporium, and OTU486) and 6 immune markers (GCSF, IL6, IL8, IL10, TNFα, and IL4) (Figure 6C). In classifying CDI and Control, the mean AUC values were 0.751, 0.857, 0.746, 0.955, and 0.950 for the top OTU feature (OTU584: unclassified_g_Aspergillus), the top immune feature (GCSF), the optimal feature set of OTUs, the optimal feature set of immune factors, and the optimal combined feature set of fungal OTUs and immune factors, respectively (Figure 6B). The optimal combined feature set consisted of 1 fungal OTU (OTU584) and 5 immune markers (GCSF, TNFα, IL6, IL4 and MCP1) (Figure 6D). These results suggested that the random forest classifier based on a combined feature set of fungal OTUs and immune factors can achieve a powerful diagnostic performance in differentiating CDI from the Carrier (or Control) group.
Figure 6. Classification analyses based on random forest models.
A,C: CDI vs. Carrier. B,D: CDI vs. Control. For each classification analysis, we tried different types of features: best OTU, best immune factor, all OTUs, all immune factors, all OTUs and immune factors. The receiver operating characteristic (ROC) curves were shown in A and B. The top features ranked based on their mean decrease accuracy were shown in C and D. The lengths of the bars in the histogram represent the mean decrease accuracy, which indicates the importance of features (OTUs and immune factors) for classification. OTU657: Aspergillus_proliferans, OTU35: unclassified fungi, OTU252: unclassified_g_Cladosporium, OTU486: unclassified_o_Pleosporales, OTU584: unclassified_g_Aspergillus.
Correlation between serum biomarkers and mycobiota features.
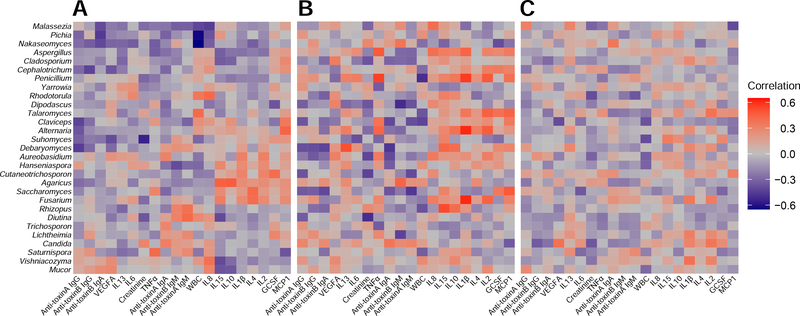
To reveal the interplay between the gut mycobiome and the host immune system, we calculated the correlations between fungal compositions (at the genus level) and the circulating levels of host immune markers. A total of 20 serum immune factors were measured for correlation with mycobiota features (Figure 7). Overall, the three groups have quite different correlations between gut fungal genera and host immune factors. More strongly positive associations between gut fungal genera and host immune factors were found in Carrier than in CDI. For example, in each group, we focused on the correlations among two main different genera (Saccharomyces and Aspergillus) with host immune factors. In the CDI group we observed negative associations between Saccharomyces and IL6, GCSF. In the Carrier group, we observed positive associations between Aspergillus and IL1β, IL8 and TNFα, positive associations between Saccharomyces and MCP1, negative associations between Saccharomyces and anti-toxin B IgA and anti-toxin A IgM. In the Control group, Saccharomyces was significantly positively associated with IL4. These results indicated that the correlations between gut fungal genera and host immune factors can be very sensitive to the colonization/infection status.
Figure 7. Spearman correlations between fungal abundances in stool samples and the circulating levels of host immune markers in serum samples from the three phenotypic groups: Control (A), Carrier (B) and CDI (C).
For each heat map, rows correspond to fungal taxa at the genus level, columns correspond to immune factors. Red and blue represents the positive and negative correlations, respectively. The intensity of the colors denotes the degree of correlation between the genera abundances and the circulating levels of host serum immune factors. *P < .05, **P < .01, ***P < .001.
Discussion
Our study is the first to report a diagnostic model using fecal fungal OTUs and serum immune markers with a powerful diagnostic potential to differentiate CDI patients from Carrier. We found that fungal alpha diversity (richness and diversity) and beta diversity were significantly lower in the CDI group compared to the Carrier group; and the abundance of several fungi at the phylum and genus levels between these two groups significantly differed. The Ascomycota:Basidiomycota ratio could represent a fungal dysbiosis index to differentiate CDI from Carrier and Control. The marked differences in the associations between mycobiome features and serum cytokines in the three different cohorts suggests interactions between the host systemic immune response and the gut mycobiome.
Comparisons between healthy and diseased cohorts have highlighted the importance of class discovery (detecting novel subtypes of a disease) and class prediction (forecasting the disease subtype of an individual or group)14, 24–26. Previous studies revealed that host inflammatory markers (including serum cytokines, calprotectin, and fecal lactoferrin) have diagnostic potential; however, they are not disease specific in CDI, and therefore are imperfect biomarkers27. Our classification analysis based on the optimal fungal OTU features achieved a powerful classification potential for distinguishing CDI from Asymptomatic Carrier (AUC~0.818). As we integrated gut fungal OTUs and host immune markers, we identified a specific immune-mycobiota signature for CDI that further enhances the classification performance in differentiating CDI from Asymptomatic Carrier (AUC~0.924). Our previous study found that serum GCSF concentration alone can achieve AUC~0.842 in discriminating CDI from Carrier7. Hence, the addition of gut fungal OTUs further enhance the discriminative power of GCSF.
We found that fecal fungal richness and diversity were significantly decreased in CDI compared to Carrier and Control groups. This is consistent with previous findings comparing CDI with healthy Control14. Beta diversity was significantly different between CDI and Carriers, which is also consistent with previous reports where PCoA revealed significant clustering of samples between CDI and non-CDI24, 25. These results indicate a significant global shift in gut mycobiota between Carrier and CDI, suggesting that an altered fungal community might play a role in CDI pathogenesis. Thus, greater diversity or richness in the fungal community is a sign of a relatively healthy gut mycobiota, even in patients receiving antibiotics.
Our current study showed that phyla of Ascomycota and Basidiomycota were the two dominant taxa in the three groups, which is consistent with a previous study28. The most commonly reported fungi found in the human gastrointestinal tract include members of the genera Candida, Saccharomyces, Penicillium, Aspergillus, and Cladosporium28. Accordingly, our study found genera Saccharomyces and Candida to be the two dominant taxa in all three cohorts. Furthermore, we also observe that the abundance of phyla Ascomycota has a strongly negative correlation with that of Basidiomycota. Thus, the Ascomycota:Basidiomycota ratio was higher in CDI patients than in Asymptomatic Carrier, suggesting this imbalance between Ascomycota and Basidiomycota may be correlated with CDI pathobiology, and could be used as biomarker to differentiate CDI from Carrier.
Although Candida was among the most abundant genera in CDI, it is not identified to be differentiating CDI from Carrier in our study. This may be due to the high heterogeneity within the Candida genera and to the difficulty in identifying fungi at the species level using our sequencing approach. Several previous studies have evaluated the relation between CDI and Candida colonization and/or disease, and both positive and negative associations have been reported14, 29–32. In this study, the fungal genus Saccharomyces were found to be depleted in CDI, suggesting a potential beneficial role of Saccharomyces abundance in the gut, consistent with our previous studies22, 33–36. Interestingly, Saccharomyces abundance had a strong negative correlation with IL6 in the CDI cohort. Previous observations described the serum IL6 concentration correlating with CDI severity and mortality37, 38. Though the directionality of these correlations is unclear, a previous study found that Saccharomyces cerevisae inhibits the transcription and translation of IL6 in enterocytes39. The differential abundance analysis of fungal taxonomic composition, as conducted by ANCOM in this study, detected two differentially abundant genera between CDI and Carrier (or Control): Aspergillus and Cladosporium. The decrease of Aspergillus and Cladosporium in CDI compared to Carrier (or Control) may suggest a beneficial role of these fungi in patients at risk for CDI. Another study suggested that Aspergillus penicillioides was more enriched in healthy individuals than in CDI; treating CDI patients with fecal microbiota transplantation restored the abundance of this species14. The present study is the first to report increased abundance of Cladosporium in Carriers/Control compared to CDI. Thus, Cladosporium could perhaps play a protective role in patients at risk for CDI. Network analyses established strong fungal abundance correlations in the Carrier/Control groups, which were absent in the CDI group. Furthermore, the fungal correlations in the CDI group were weaker than those in the Carrier/Control group. This could be interpreted as CDI being a state in which physiological fungal correlations are disrupted. The absence of these correlations may reflect mycobiota-immune cross-talk that could mediate disease susceptibility, the directionality of these interactions remains to be further studied.
In conclusion, we describe previously unknown characteristics of the gut mycobiota in the C. difficile colonization-infection continuum, pinpoint fungal taxonomic units that may play key roles in CDI pathogenesis and, identified specific fungal markers with promising diagnostic features. Gut mycobiota-targeted biomarkers together with immune factors could become potential diagnostic tools to discriminate CDI from Carrier. However, studies with larger cohorts need to be done to further validate the findings before this test can be used in the clinical diagnostic settings. Systematic investigation of the key fungal genera or OTUs by metagenomic sequencing may further improve the diagnostic value of these markers for CDI. Nonetheless, a method simpler and cheaper than sequencing of the mycobiome will need to be further developed.
Supplementary Material
What you need to know:
Background and Context:
It is an existing challenge for clinicians who care for patients with C. difficile infection (CDI) to distinguish active infection from C. difficile carriage. Little is known about the role of mycobiome in CDI.
New findings:
Mycobiota appears to be an important component of microbial dysbiosis associated with CDI. Fungal OTUs combined with host immune factors provide high power for distinguishing CDI from Carrier.
Limitations:
This was a cross-sectional study of 58 patients with CDI, 28 Carrier and 32 Control from a single hospital. Further studies are needed in other geographical regions and larger populations to validate these findings.
Impact:
Fecal mycobiota combined with host immune factors may be useful biomarkers to distinguish CDI from Carrier.
Lay Summary:
Incorporating both gut mycobiota and host immune factors into classification models can better distinguish CDI from Carrier.
Acknowledgments
Funding
This study was supported by the National Key Research and Development Projects of China (grant number 2017YFD0500500 and 2018YFD0501600 to YCao and JY), National Institutes of Health/National Institute of Allergy and Infectious Diseases (grant number 1R01AI116596-01 to NP and CK; grant number 1R01AI141529-01 to Y-YL), National Institute of Diabetes and Digestive and Kidney Diseases (grant number T32 DK 07760 to CK), and Irving W. and Charlotte F. Rabb Award (to XC)
Abbreviations used in this paper
- ANCOM
analysis of composition of microbiomes
- AUC
area under the curve
- Carrier
asymptomatic carriers
- CDI
Clostridioides difficile infection
- ITS2
internal transcribed spacer 2
- NAAT
nucleic acid amplification testing
- OTU
operational taxonomic unit
- PERMANOVA
Permutational multivariate analysis of variance
- PCoA
Principle Coordinate Analysis
- QIIME
Quantitative insights into microbial ecology
- ROC
receiver operating characteristics
Footnotes
Competing interests
No conflict of interest exists.
Ethics approval
This study was approved by the institutional review board of Beth Israel Deaconess Medical Center (IRB protocol number 2016P000026 and 2016P000054).
Publisher's Disclaimer: This is a PDF file of an unedited manuscript that has been accepted for publication. As a service to our customers we are providing this early version of the manuscript. The manuscript will undergo copyediting, typesetting, and review of the resulting proof before it is published in its final form. Please note that during the production process errors may be discovered which could affect the content, and all legal disclaimers that apply to the journal pertain.
References
- 1.Lessa FC, Mu Y, Bamberg WM, et al. Burden of Clostridium difficile infection in the United States. N Engl J Med 2015;372:825–834. [DOI] [PMC free article] [PubMed] [Google Scholar]
- 2.Pollock NR, Banz A, Chen X, et al. Comparison of Clostridioides difficile stool toxin concentrations in adults with symptomatic infection and asymptomatic carriage using an ultrasensitive quantitative immunoassay. Clin Infect Dis 2019;68:78–86. [DOI] [PMC free article] [PubMed] [Google Scholar]
- 3.McDonald LC, Gerding DN, Johnson S, et al. Clinical practice guidelines for Clostridium difficile infection in adults and children: 2017 Update by the infectious diseases society of america (IDSA) and society for healthcare epidemiology of america (SHEA). Clin Infect Dis 2018;66:987–994. [DOI] [PubMed] [Google Scholar]
- 4.Shim JK, Johnson S, Samore MH, et al. Primary symptomless colonisation by Clostridium difficile and decreased risk of subsequent diarrhoea. Lancet 1998;351:633–636. [DOI] [PubMed] [Google Scholar]
- 5.Gerding DN, Johnson S. Management of Clostridium difficile infection: thinking inside and outside the box. Clin Infect Dis 2010;51:1306–1313. [DOI] [PubMed] [Google Scholar]
- 6.Wilcox MH, Gerding DN, Poxton IR, et al. Bezlotoxumab for prevention of recurrent Clostridium difficile infection. N Engl J Med 2017;376:305–317. [DOI] [PubMed] [Google Scholar]
- 7.Kelly CP, Chen X, Williams D, et al. Host immune markers distinguish Clostridioides difficile infection from asymptomatic carriage and non-C. difficile diarrhea. Clin Infect Dis 2020, 70: 1083–1093. [DOI] [PMC free article] [PubMed] [Google Scholar]
- 8.Huang J, Kelly CP, Bakirtzi K, et al. Clostridium difficile toxins induce VEGF-A and vascular permeability to promote disease pathogenesis. Nat Microbiol 2019;4:269–279. [DOI] [PMC free article] [PubMed] [Google Scholar]
- 9.Seekatz AM, Young VB. Clostridium difficile and the microbiota. J Clin Invest 2014;124:4182–4189. [DOI] [PMC free article] [PubMed] [Google Scholar]
- 10.Nycz BT, Dominguez SR, Friedman D, et al. Evaluation of bloodstream infections, Clostridium difficile infections, and gut microbiota in pediatric oncology patients. PLoS One 2018;13:e0191232. [DOI] [PMC free article] [PubMed] [Google Scholar]
- 11.Samarkos M, Mastrogianni E, Kampouropoulou O. The role of gut microbiota in Clostridium difficile infection. Eur J Intern Med 2018;50:28–32. [DOI] [PubMed] [Google Scholar]
- 12.Schubert AM, Rogers MA, Ring C, et al. Microbiome data distinguish patients with Clostridium difficile infection and non-C. difficile-associated diarrhea from healthy controls. MBio 2014;5:e01021–14. [DOI] [PMC free article] [PubMed] [Google Scholar]
- 13.Zuo T, Wong SH, Lam K, et al. Bacteriophage transfer during faecal microbiota transplantation in Clostridium difficile infection is associated with treatment outcome. Gut 2018;67:634–643. [DOI] [PMC free article] [PubMed] [Google Scholar]
- 14.Zuo T, Wong SH, Cheung CP, et al. Gut fungal dysbiosis correlates with reduced efficacy of fecal microbiota transplantation in Clostridium difficile infection. Nat Commun 2018;9:3663–3674. [DOI] [PMC free article] [PubMed] [Google Scholar]
- 15.Kelly CP, Kyne L. The host immune response to Clostridium difficile. J Med Microbiol 2011;60:1070–1079. [DOI] [PubMed] [Google Scholar]
- 16.Kyne L, Warny M, Qamar A, et al. Asymptomatic carriage of Clostridium difficile and serum levels of IgG antibody against toxin A. N Engl J Med 2000;342:390–397. [DOI] [PubMed] [Google Scholar]
- 17.Kyne L, Warny M, Qamar A, et al. Association between antibody response to toxin A and protection against recurrent Clostridium difficile diarrhoea. Lancet 2001;357:189–193. [DOI] [PubMed] [Google Scholar]
- 18.Chen X, Kokkotou EG, Mustafa N, et al. Saccharomyces boulardii inhibits ERK1/2 mitogen-activated protein kinase activation both in vitro and in vivo and protects against Clostridium difficile toxin A-induced enteritis. J Biol Chem 2006;281:24449–24454. [DOI] [PubMed] [Google Scholar]
- 19.Schloss PD, Westcott SL, Ryabin T, et al. Introducing mothur: open-source, platform-independent, community-supported software for describing and comparing microbial communities. Appl Environ Microbiol 2009;75:7537–7541. [DOI] [PMC free article] [PubMed] [Google Scholar]
- 20.Lozupone C, Knight R. UniFrac: a new phylogenetic method for comparing microbial communities. Appl Environ Microbiol 2005;71:8228–8235. [DOI] [PMC free article] [PubMed] [Google Scholar]
- 21.Mandal S, Van Treuren W, White RA, et al. Analysis of composition of microbiomes: a novel method for studying microbial composition. Microb Ecol Health Dis 2015;26:27663. [DOI] [PMC free article] [PubMed] [Google Scholar]
- 22.Sokol H, Leducq V, Aschard H, et al. Fungal microbiota dysbiosis in IBD. Gut 2017;66:1039–1048. [DOI] [PMC free article] [PubMed] [Google Scholar]
- 23.Friedman J, Alm EJ. Inferring correlation networks from genomic survey data. PLoS Comput Biol 2012;8:e1002687. [DOI] [PMC free article] [PubMed] [Google Scholar]
- 24.Stewart DB Sr., Wright JR, Fowler M, et al. Integrated meta-omics reveals a fungus-associated bacteriome and distinct functional pathways in Clostridioides difficile infection. mSphere 2019;4: e00454–19. [DOI] [PMC free article] [PubMed] [Google Scholar]
- 25.Lamendella R, Wright JR, Hackman J, et al. Antibiotic treatments for Clostridium difficile infection are associated with distinct bacterial and fungal community structures. mSphere 2018;3: e00572–17. [DOI] [PMC free article] [PubMed] [Google Scholar]
- 26.Sangster W, Hegarty JP, Schieffer KM, et al. Bacterial and fungal microbiota changes distinguish C. difficile infection from other forms of diarrhea: results of a prospective inpatient study. Front Microbiol 2016;7:789. [DOI] [PMC free article] [PubMed] [Google Scholar]
- 27.Martinez-Melendez A, Camacho-Ortiz A, Morfin-Otero R, et al. Current knowledge on the laboratory diagnosis of Clostridium difficile infection. World J Gastroenterol 2017;23:1552–1567. [DOI] [PMC free article] [PubMed] [Google Scholar]
- 28.Hallen-Adams HE, Suhr MJ. Fungi in the healthy human gastrointestinal tract. Virulence 2017;8:352–358. [DOI] [PMC free article] [PubMed] [Google Scholar]
- 29.Panpetch W, Somboonna N, Palasuk M, et al. Oral Candida administration in a Clostridium difficile mouse model worsens disease severity but is attenuated by Bifidobacterium. PLoS One 2019;14:e0210798. [DOI] [PMC free article] [PubMed] [Google Scholar]
- 30.van Leeuwen PT, van der Peet JM, Bikker FJ, et al. Interspecies interactions between Clostridium difficile and Candida albicans. mSphere 2016;1: e00187–16. [DOI] [PMC free article] [PubMed] [Google Scholar]
- 31.Markey L, Shaban L, Green ER, et al. Pre-colonization with the commensal fungus Candida albicans reduces murine susceptibility to Clostridium difficile infection. Gut Microbes 2018;9:497–509. [DOI] [PMC free article] [PubMed] [Google Scholar]
- 32.Raponi G, Visconti V, Brunetti G, et al. Clostridium difficile infection and Candida colonization of the gut: is there a correlation? Clin Infect Dis 2014;59:1648–1649. [DOI] [PubMed] [Google Scholar]
- 33.Koon HW, Su B, Xu C, et al. Probiotic Saccharomyces boulardii CNCM I-745 prevents outbreak-associated Clostridium difficile-associated cecal inflammation in hamsters. Am J Physiol Gastrointest Liver Physiol 2016;311:G610–G623. [DOI] [PMC free article] [PubMed] [Google Scholar]
- 34.Pothoulakis C, Kelly CP, Joshi MA, et al. Saccharomyces boulardii inhibits Clostridium difficile toxin A binding and enterotoxicity in rat ileum. Gastroenterology 1993;104:1108–1115. [DOI] [PubMed] [Google Scholar]
- 35.Castagliuolo I, LaMont JT, Nikulasson ST, et al. Saccharomyces boulardii protease inhibits Clostridium difficile toxin A effects in the rat ileum. Infect Immun 1996;64:5225–5232. [DOI] [PMC free article] [PubMed] [Google Scholar]
- 36.Czerucka D, Rampal P. Diversity of Saccharomyces boulardii CNCM I-745 mechanisms of action against intestinal infections. World J Gastroenterol 2019;25:2188–2203. [DOI] [PMC free article] [PubMed] [Google Scholar]
- 37.Rao K, Erb-Downward JR, Walk ST, et al. The systemic inflammatory response to Clostridium difficile infection. PLoS One 2014;9:e92578. [DOI] [PMC free article] [PubMed] [Google Scholar]
- 38.Saleh MM, Frisbee AL, Leslie JL, et al. Colitis-induced Th17 cells increase the risk for severe subsequent Clostridium difficile infection. Cell Host Microbe 2019;25:756–765. [DOI] [PMC free article] [PubMed] [Google Scholar]
- 39.Zanello G, Berri M, Dupont J, et al. Saccharomyces cerevisiae modulates immune gene expressions and inhibits ETEC-mediated ERK1/2 and p38 signaling pathways in intestinal epithelial cells. PLoS One 2011;6:e18573. [DOI] [PMC free article] [PubMed] [Google Scholar]
Associated Data
This section collects any data citations, data availability statements, or supplementary materials included in this article.


