

Abstract
We compared focused and unfocused Ultrasound Targeted Microbubble Destruction (UTMD) for delivery of reporter plasmids to the liver and heart in mice. Optimal hepatic expression was seen with double-depth targeting at 5 and 13mm in vivo, and incorporated a low pulse repetition frequency and short pulse duration. Reporter expression was similar but the transfection patterns were distinct, with intense foci of transfection using focused UTMD (F-UTMD). We then compared both approaches for cardiac delivery and found 10-fold stronger levels of reporter expression for F-UTMD and observed small areas of intense luciferase expression in the left ventricle. Nonlinear contrast imaging of the liver before and after insonation also showed a substantially greater change in signal intensity for F-UTMD suggesting distinct cavitation mechanisms for both approaches. Overall, similar levels of hepatic transgene expression were observed but cardiac-directed F-UTMD was substantially more effective. Focused ultrasound presents a new frontier in UTMD-directed gene therapy.
Keywords: Focused ultrasound, ultrasound targeted microbubble destruction, acoustic cavitation, microbubbles, average radiance, gene therapy
Introduction
Minimally invasive gene transfer that can target specific anatomical regions could substantially enhance gene therapy strategies. Such a technology would also be useful for testing potential therapeutic transgenes. Current approaches primarily use viral vectors, which can deliver transgenes with high efficiency but are often associated with undesirable systemic effects including immune responses and transduction of non-target organs.(Chen, et al. 2013, Rincon, et al. 2015). Nonviral technologies offer the advantages of improved safety with lower immune responses, enhanced tissue specificity, the capacity to deliver larger transgenes and their regulatory elements, and the potential for repeated treatments.(Bekeredjian, et al. 2003, Kay 2011) However, the translation of nonviral approaches to clinical application has been stymied by inefficient vector delivery and transfection. To address these limitations, we have been working to improve the transfection efficiency of Ultrasound Targeted Microbubble Destruction (UTMD).
In UTMD, plasmid DNA is attached to the shells of cationic lipid microbubble contrast agents and is delivered to the cells of the target organ by acoustic cavitation.(Bekeredjian, et al. 2003, Chen, et al. 2003) Microbubble cavitation is strongly influenced by many factors including the amplitude of acoustic pressure, referred to as the peak negative rarefactional pressure (PNP), the pulse duration of the ultrasound, frequency of the pulsing (pulse repetition frequency), and characteristics of the ultrasound transducer. (Miao, et al. 2005, Shapiro, et al. 2016, Tran, et al. 2018) The PNP, along with microbubble composition (the shell and gas core), diameter, and properties of the blood vessel walls, produce dynamic and tissue-specific biophysical interactions.(Qin, et al. 2009) Under lower PNP conditions, lipid microbubbles oscillate stably between compression and rarefaction; but as the threshold of acoustic pressure increases microbubbles may undergo destruction by inertial cavitation.(Choi, et al. 2011, Chomas, et al. 2001, Qin, et al. 2009) The pressure threshold for inertial cavitation is dependent on many variables including ultrasound pulsing parameters, transducer working center frequency, cellular organization of the targeted tissue, and the size and composition of the microbubbles.(Ilovitsh, et al. 2018) In vivo interactions with blood and tissue can also influence microbubble oscillation and the resulting acoustic-driven dynamics that occur at the lipid-gas and blood-tissue interfaces. Variations in the energies generated from different microbubble cavitation mechanisms will also have different biophysical effects on the insonated blood vessels and surrounding cells.(Choi, et al. 2011) Inertial cavitation with microbubble destruction as well as stable cavitation can result in transient sonoporation.(Peruzzi, et al. 2018, Song, et al. 2011, Wang, et al. 2015) This facilitates transfection of cells in the targeted region with exogenously delivered DNA. In addition, the pulsing parameters and scanning procedures in UTMD are typically applied in a manner that allows replenishment of microbubbles within the blood vessels of the targeted tissue after cavitation to increase transfection efficiency.(Qin, et al. 2009) We and others have shown that UTMD transfects the cells of ultrasound treated tissues with high specificity that can be further enhanced by using DNA vectors with tissue-specific promoters.(Bekeredjian, et al. 2003, Chen, et al. 2006, Chen, et al. 2003)
In these studies, we incorporated focused ultrasound (FUS) with UTMD to augment transfection efficiency. FUS transducers can incorporate acoustic lenses in conventional single element systems or have electronic phased array properties to converge ultrasound energy to small focal points in targeted tissues.(Fishman and Frenkel 2017, Kim, et al. 2008, Shaw, et al. 2014) This technology has been mainly used for thermal ablation in oncologic therapies, treatment of uterine fibroids, and lithotripsy of kidney stones, however, its potential in gene therapy has become an area of recent investigation.(Copelan, et al. 2015, Lipsman, et al. 2018, Noble-Vranish, et al. 2018, Timbie, et al. 2015, Tran, et al. 2019, Wang, et al. 2014) Focused and unfocused microbubble-mediated delivery of reporter plasmids to the exposed liver has been previously evaluated in rodents (Song, et al. 2012, Song, et al. 2011) and more recently in porcine models.(Noble-Vranish, et al. 2018, Tran, et al. 2019) These studies compared different ultrasound transducers and importantly, identified specific acoustic parameters that enhanced transgene expression with minimal ultrasound-related bioeffects. FUS with microbubbles has also been used to achieve transient opening of the blood brain barrier for gene or drug delivery. (Carpentier, et al. 2016, Lipsman, et al. 2018, Price, et al. 2019) We hypothesize that incorporating FUS into our UTMD approach for gene transfer may further increase vascular permeability in the target organ and facilitate the delivery of a more concentrated dose of a therapeutic gene.(Choi, et al. 2011) It is our goal to optimize FUS targeting parameters for different organs using a minimally invasive intravenous delivery strategy that can safely achieve improved transfection efficiency, which remains a limiting factor for ultrasound-directed gene delivery strategies.
In the present study, we evaluated various FUS conditions including the amplitude signal, pulse interval, pulse repetition frequency, focal point targeting depth, and treatment duration for hepatic gene transfer using microbubbles and reporter constructs. We integrated some of the parameters previously reported by Song et al. (Song, et al. 2012) into these studies and compared a UTMD protocol optimized for our FUS transducer to the unfocused method. In these studies, we also incorporated a novel retro-orbital route for UTMD (Wang, et al. 2015) and found this approach to be highly reproducible in achieving similar average radiance levels for anatomically targeted transfection. We then further extended these studies to evaluate UTMD-mediated gene transfer in the heart. Nonlinear contrast imaging was additionally used in our comparison to study microbubble acoustic characteristics and hepatic tissue perfusion before and after UTMD for both protocols. The ablative potential of FUS is currently being examined in clinical trials for treating cardiovascular conditions including atrial fibrillation, drug-resistant hypertension, and deep vein thrombosis. However, the application of FUS with microbubbles for gene therapy is an exciting, and less explored, opportunity. Recent studies incorporating FUS for gene delivery have included delivering therapeutic constructs across the blood brain barrier to the brain for the preclinical treatment of neurological disorders (Fisher and Price 2019, Price, et al. 2019, Timbie, et al. 2015, Wang, et al. 2017) as well as FUS and microbubble delivery of reporter constructs to the porcine liver for hepatic gene delivery applications.(Noble-Vranish, et al. 2018, Tran, et al. 2019) Here, we contribute to this newly growing field using a novel minimally invasive microbubble delivery strategy for directing focused UTMD to the murine liver and extend these FUS and microbubble studies to explore gene delivery to the heart.
Materials & Methods
Preparation of Microbubbles
Lipid-stabilized microbubbles were prepared as previously described from a stock solution of 200 mg DPCC (DL-α-phosphatidylcholine, dipalmitolyl), 50 mg of DPEE (DL-α-phosphatidylethanolamine, dipalmitoyl) (both from Sigma-Aldrich Inc., St. Louis, MO), and 1 g glucose dissolved in 1X phosphate buffered saline (PBS) to a final volume of 10 ml.(Walton, et al. 2011) The stock solution was heated in a boiling water bath, periodically mixed by pipetting for 30 minutes, and stored at 4°C. For in vivo delivery, a 250μl volume of the microbubble stock was heated to 40°C for 15 minutes and then added to a 1.5ml microtube with 50μl glycerol and 200μl 1x PBS. Octafluoropropane gas was then added to replace the microtube air space and the solution was mixed vigorously for 20 seconds in a Vialmix dental amalgamator (Lantheus Medical Imaging, North Billerica, MA, USA) and 500–1000μg of purified plasmid DNA (Qiagen Endofree Mega Purification Kit, Qiagen Inc., Germantown, MD, USA) dissolved in TE buffer was added. The DNA-bound microbubble solution was further diluted in 1x PBS to a final volume of 1 ml, mixed by inversion, and then kept on ice until use. Approximately 25–50μg of DNA is delivered per 50μl injection. In previous studies, this protocol produces microbubbles with an average size of 2.1 ± 0.9μm and a concentration of 2.1 ± 0.4 x 10⁹ microbubbles per ml.(Anderson, et al. 2013, Bekeredjian, et al. 2005)
Plasmids
The pcDNA3-luciferase plasmid (pcDNA-luc) (Addgene #18964) contains the cytomegalovirus (CMV) promoter. The pZY53-luc plasmid contains the apolipoprotein E enhancer/α1-antitrypsin liver-specific promoter (ZY53). This promoter (generously provided by M. Kay, Stanford University) was cloned into a luciferase reporter construct as previously described.(Anderson, et al. 2016)
Animals
Wild type C57BL/6 mice, 8–10 weeks old, were used for these studies. All animal research was approved by the Institutional Animal Care and Use Committee (IACUC) at the University of Hawaii John A. Burns School of Medicine.
Ultrasound system and transducers
The FUS system incorporates a 1.1 MHz FUS transducer, model H-102, designed by Sonic Concepts Inc. (Bothell, WA, USA). The ultrasound focal point has an approximate width of 1.4mm and length of 10.2mm and is coupled to a modular water coupling cone with interchangeable offset rings that can be adjusted to achieve focal point depths at fixed distances of 5mm, 13mm, and 18mm, as depicted in Supplementary Figure 1. The water coupling cone is filled with degassed water prior to use. The ultrasound signal is generated using a waveform generator (National Instruments Corporation, Austin, TX, USA) equipped with a built-in oscilloscope that is connected to a computer with Laboratory Virtual Instrumentation Engineering Workbench (LabVIEW) software (National Instruments Corporation) which allows us to modulate ultrasound parameters and monitor the peak mechanical index readings in real-time during treatments. The sine wave signal is sent to a 55 dB gain radio frequency (RF) power amplifier (Electronics & Innovation, EI, Model A150, 150W) and is transmitted to the FUS transducer through a DC coupler impedance matching unit (Sonic Concepts Inc., Bothell, WA, USA). Using optimized acoustic parameters determined from these studies, the average peak pressure amplitudes observed during a single ultrasound treatment using the National Instruments system ranged from ~0.40–0.55 MPa.
The unfocused ultrasound set-up incorporates a 1.0 MHz immersion-style transducer (Olympus Panametrics NDT model A303S, 0.5 inch nominal element size). An arbitrary function generator (Tektronix, Model AFG3021C) operating in burst mode is used to generate the ultrasound signal, which is sent to the power amplifier (mentioned above) connected to the transducer. Briefly, calibration of this system (Anderson, et al. 2013) is obtained with a 1 mm needle hydrophone coupled with a 20 dB in-line amplifier (Precision Acoustics Ltd, United Kingdom) faced co-linear to the ultrasound transducer in deionized and degassed water using an adjustable 3D stage. The hydrophone is connected to a DC coupler with a power supply and is measured using an oscilloscope triggered by a function generator, and ultrasound signals are processed in LabVIEW. This calibration protocol measures an average peak negative pressure output from the transducer of 1.3–1.8 MPa.
UTMD-mediated reporter gene delivery
Mice were anesthetized with 100 mg kg−1 ketamine and 5 mg kg−1 xylazine in saline by intraperitoneal injection (IP), and depilated in the thoracic and abdominal regions. A Vevo 2100 array-based micro-ultrasound imaging system equipped with a 22–55 MHz high frequency transducer (VisualSonics Inc., transducer model MS550D, Toronto, Ontario, Canada) was used to visualize ultrasound guided intraventricular cardiac injections and to confirm microbubble delivery to the liver or heart after retro-orbital infusions.(Anderson, et al. 2016, Wang, et al. 2015, Yardeni, et al. 2011) Depending on the delivery strategy, 50–100μl of DNA-loaded microbubbles was injected into the left ventricle or right retro-orbital plexus using a sterile 30 G needle over a 10 second period. Retro-orbital injections were administered as the predominant intravenous delivery route in treated mice and resulted in consistent and reproducible delivery of DNA-bound microbubbles in these studies. While the retro-orbital delivery route demonstrated enhanced efficiency compared to other routes explored in preliminary studies (tail, jugular, and femoral veins), it is not a clinically applicable intravenous delivery strategy. When this work is scaled up to a larger animal, direct intravenous delivery would provide greater clinical relevance. However, given the small size of the mice and inconsistency of the tail vein route for microbubble-DNA delivery, we selected the retro-orbital method for these experiments for its effectiveness, reproducibility and enhanced safety over the other routes explored. Immediately after visualizing arrival of microbubbles in the target organ, UTMD was carried out with either the FUS or unfocused transducer with specific parameters of interest. The water-coupled FUS transducer was repeatedly scanned across the liver to traverse the left, medial and right sides of the liver with additional scanning performed on the right lateral side of the abdomen to target the right anterior and posterior liver lobes that are situated more posteriorly within the animal behind the right side of the medial lobe. To enhance reproducibility, The Vevo 2100 imaging machine is used for target organ visualization prior to UTMD and assists in planning out optimal transcutaneous positioning of the FUS or unfocused transducer (when the imaging transducer is removed) to direct UTMD treatment to the target region. After microbubble delivery, careful attention is given to manipulating the transducer to perform scanning at approximately the same speed, direction, and position of the FUS water coupling cone with the target area. For the liver transfections, a uniform circular motion is used to traverse the abdomen but for targeting the heart a more stationary position directed toward the anatomical position of the left ventricle (crossing a smaller region) is used for a shorter duration. These methods have been carefully optimized in extensive preliminary experiments and scanning with the FUS and unfocused transducers were all performed manually by the same person to further enhance the reproducibility of our Focused UTMD experiments. Multiple FUS parameters, including pulse repetition frequency (PRF), amplitude signal, pulse duration, acoustic exposure time, and targeting depth, were evaluated to optimize the delivery of liver-specific reporter plasmids. The range of specific parameters used was 10–100Hz for pulse repetition frequency, 50–350mV peak to peak for the amplitude signal, 5, 13 and 18mm for focal point targeting depth (and multi-depth combinations), and 2–4 minutes for treatment duration, using 3–6 mice per treatment group (Table 1). For the combined multi-depth targeting treatments at 5mm and 13mm, FUS was applied at each depth for 2 minutes. After insonation at 5mm, a small volume of degassed water was quickly removed from the coupling cone using a syringe directly connected to the cone and the 5mm offset was removed to switch to the 13mm depth. Insonation was then performed for the second 2 minute treatment. Using this technique, the offset can be carefully changed from 5mm to 13mm within one minute. Since minimal time is lost in this technique, microbubbles are not re-injected at this point. In preliminary experiments, we tested the targeting at 13mm first for 2 minutes followed by switching to the 5mm offset. An additional volume of degassed water was added to fill the coupling cone and the second 2 minute treatment proceeded. In these experiments, a difference in the level of bioluminescence expression between these methods was observed in which targeting initially at 5mm followed by 13mm was more efficient. Control mice receiving microbubble and UTMD treatments without DNA or DNA and UTMD without microbubbles were included as controls (n=3 for each group).
Table 1.
FUS Parameter Optimization: Conditions Evaluated
Ultrasound conditions modified in the different optimization groups (1–6). Samples sizes and statistical significance values are provided for each group in comparison to the control group. PRF= pulse repetition frequency, Hz= Hertz, mVpp=milivolts peak to peak, FUS focal point targeting depths (5 or 13mm). Increasing voltages were tested in group 3 (50, 100, 150mVpp; n=2 for each voltage). Conditions incorporating 350mVpp and a pulse duration of 18.2μs were used for all groups (except for group 3).
| Group | FUS Parameters Evaluated | Treatment sample size and P value |
|---|---|---|
| 1 | 14Hz PRF, 350mVpp, 5mm depth, 4 minute treatment | N=5, P=0.0095** |
| 2 | 14Hz PRF, 350mVpp, 5mm depth, 2 minute treatment | N=5, P=0.126 |
| 3 | 14Hz PRF, 50–150mVpp, 5mm depth, 4 minute treatment | N=6, P=0.130 |
| 4 | 56Hz PRF, 350mVpp, 5mm depth, 2 minute treatment | N=6, P=0.0334* |
| 5 | 56Hz PRF, 350mVpp, 13mm depth, 2 minute treatment | N=3, P=0.092 |
| 6 | 14 or 56Hz, 350mVpp, 2 minutes at each depth- 5mm, 13mm | N=10, P=0.0039** |
| Control | F-UTMD and microbubbles or F-UTMD and plasmid DNA | N=6 |
| Unfocused | 14Hz PRF, 950mVpp, 4 minute treatment | N=8 |
For the focused component of comparison studies, F-UTMD to the liver was administered using double depth targeting at 5 and 13mm for two minutes at each depth, a PRF of 14 or 56 Hz, amplitude signal of 350mVpp, and pulse duration <20us. For unfocused UTMD the same parameters were used with the immersion-style transducer except the amplitude signal was increased to 950mVpp, and a single depth was used and included a layer of coupling gel (~1.5 cm thick) between the skin surface and transducer face. Findings from the F-UTMD studies that were determined to be optimal (strong, consistent reporter expression across animals with minimal tissue bioeffects assessed using ALT assays and H&E staining) shown in Figure 1, were applied for the unfocused UTMD studies (same PRF, ultrasound exposure time, pulse interval and duration, etc.). The amplitude values (mVpp) differ for the unfocused and FUS transducers because we were able to achieve highly similar levels of transfection (without tissue damage) using a lower amplitude setting for the FUS transducer compared to the unfocused transducer. In addition, the targeting depth varies between the two methods since the FUS transducer has the capability for directing more precise targeting of the focal point and the capability to modulate the depth which we were unable to modify for the unfocused transducer. Based on preliminary reporter gene transfer experiments to the heart and the liver results presented here, for the F-UTMD cardiac delivery studies a 14 Hz PRF was used at only a single 5mm depth directed to the left ventricle for 90 s. Scanning is carried out using a more stationary placement of the FUS transducer directed toward the anatomic position of the left ventricle. The FUS transducer is maneuvered at a slight angle to avoid the sternum and target the left ventricular free wall. Scanning over this left thoracic region to target the heart is carried out over a smaller locus of approximately 1–1.5 cm2 for a shorter, 90 second duration. The same unfocused protocol from the liver studies was used but for only 90s. The UTMD parameters for focused and unfocused gene transfer incorporates a very low duty cycle ranging from 0.025 to 0.1%.
Figure 1.

Evaluation of hepatic bioluminescence resulting from different focused ultrasound parameters in vivo.
The effects of modifying FUS PRF, insonation time, amplitude signal intensity, and/or focal point depth were evaluated in different pZY53-luc UTMD treatment groups. An 18.2μs pulse duration was kept constant for all F-UTMD treatments, a 350mVpp amplitude signal was used in all groups except Group 3. Group 1: 14 PRF, 4 minute treatment, 5mm depth (n=5, P=0.0095**), Group 2: 14Hz, 2 minute treatment, 5mm depth (n=5, P=0.126), Group 3: 14Hz, 50–150mVpp (n=6, P=0.130), Group 4: 56Hz, 2 minute treatment, 5mm depth (n=6, P=0.0334*), Group 5: 56Hz, 2 minute treatment, 13mm depth (n=3, P=0.092), Group 6: 14Hz, 2 minute treatment at each depth, 5mm and 13mm (n=10, P=0.0039**). Control group: FUS and MB (no DNA) or FUS and DNA (no MB) delivery only (n=6). PRF: pulse repetition frequency, HZ: Hertz, mVpp: millivolts peak to peak, MB: microbubbles, FUS: focused ultrasound. Data are represented as mean ± SD, *P <0.05, **P<0.01.
Bioluminescence imaging
Bioluminescence imaging was performed with the In Vivo Imaging System (IVIS) Lumina II (Perkin Elmer, Hopkington, MA, USA) after delivery of either liver-specific or CMV-based luciferase plasmids (pZY53-luc or pcDNA3-luc). Treated mice were evaluated for in vivo reporter expression 24–48 hours after UTMD and after 4–5 and 7–8 days for some of the treatment groups. To acquire images, mice were injected IP with 150 mg kg −1 of the luciferase substrate D-luciferin diluted in 1x PBS and were anesthetized 3 minutes later. Bio-distribution of the luciferin substrate proceeded for ~10 minutes before full-body IVIS scans were carried out with a 5-minute acquisition time. The Living Image 3.2 IVIS software was used to measure and quantify the bioluminescent regions of interest in these studies. Regions of interest in treated mice were selected using the automatic software selection method. The threshold % was kept at the default setting and was the same for all image analyses. An average background ROI of uniform dimensions was included in every image analysis for all treated animals to obtain a background-corrected intensity signal. The average signal intensity of the ROI (not the total flux) was subtracted from the average signal intensity of the average background ROI. Bioluminescent values were obtained as the average radiance measured as photons per second per centimeter squared per steradian (p/s/cm2/sr) for each mouse, and these data were normalized to a background measurement obtained for each image.
Nonlinear contrast imaging (NLC)
NLC imaging was incorporated to examine the specific microbubble dynamics involved in our UTMD methodology and integrated a modified bolus-perfusion protocol.(Needles, et al. 2010, Shirinifard, et al. 2017) Our gene therapy transducers (FUS or immersion-style) were used to direct the cavitation, and imaging was performed before and after treatment to assess contrast signal intensity changes. A lower frequency array-based transducer was used to perform nonlinear contrast imaging (NLC) (MS250, 13–24MHz, VisualSonics Inc., Toronto, Ontario, Canada) in a set of experiments comparing focused and unfocused UTMD in the liver after delivery of pZY53-luc. When operating in NLC mode, the MS250 transducer is clamped in a stationary position over the abdominal surface of the mice to obtain a transverse scan of the liver. Specific regions of interest (ROIs) of varying dimensions were configured throughout the liver to capture contrast agent delivery in two regions of the liver (medial left and right-sided) and two major hepatic vessels (the inferior vena cava and portal vein) which served as anatomical landmarks for detecting the initial arrival of microbubbles to the liver. Identical ROIs of the same dimensions were applied in the same positions for every scan to maintain consistency. The same NLC imaging presets (image depth, power, gating, threshold, dynamic range etc.) were also kept identical for all images to minimize variations. After applying the ROIs to each image prior to analyzing the NLC imaging frames, a motion correction feature of the Vevo CQ software (VisualSonics Inc., Toronto, Ontario, Canada) was applied before quantifying the signals. There can be some variations in the precise placement of the ROIs from one animal to the next due to the scan obtained or slight anatomical variations between animals. However, by ensuring the same dimension ROIs are used, the other presets mentioned above are kept constant, and motion correction is used, additional variations can be minimized. NLC images were acquired before microbubble infusion, during microbubble infusion and for an additional ~1500 frames after a 100μl retro-orbital bolus delivery. F-UTMD was then carried out for 2 minutes using the 5mm offset followed by 2 minutes at the 13mm offset. For the unfocused treatments, UTMD was carried out for 4 minutes using the immersion transducer. In all experiments, an additional 1500 frames of scanning data was collected after UTMD for each mouse to assess microbubble signal intensity using each insonation method.
Images were analyzed with Vevo CQ contrast quantification (Visual Sonics Inc., Toronto, Ontario, Canada) to measure contrast perfusion parameters, including peak enhancement and linearized contrast signal. The linearized signal intensities include the measured intensities of the all of the contrast signal data collected for the given time evaluated after the bolus injection. For these studies, the first 1000 frames of each scan were uploaded for quantification. The motion correction feature was applied to all images after overlaying the identical ROI markers onto each scan prior to quantification of the signal data. The contrast gain and dynamic range values were kept the same for all scans. Linearized signal data was collected and quantified for the first 35 seconds of each scan and corresponds to the signal intensity values collected for the two ROIs highlighted in the liver tissue. For each scan of each animal, signal intensity values (quantified in arbitrary units) for the two liver ROIs were averaged. Changes in signal intensity pre- and post-bolus injection prior to ultrasound treatment and after insonation were determined for each animal. This data is displayed as the contrast mean power (measured as linear arbitrary units) corresponding to the linear measurements of the echo power of the injected microbubbles measured as a function of time (seconds).
Histological assessment of transgene expression
UTMD-treated and control liver and heart samples were collected 24–48 hours, 4–5 days or 7–8 days after treatment for histological analysis. Samples were prepared by in situ perfusion with 1x PBS and 10% neutral buffered formalin (NBF) followed by immersion of tissue explants in 10% NBF at 4°C overnight before paraffin embedding and sectioning at 5μm thickness. Samples were sectioned in a transverse orientation to evaluate the depth of transgene expression in the different liver lobes. Heat-induced antigen retrieval was performed at 95°C in citrate solution, pH 6.1 (Agilent Dako, Carpinteria, CA, USA) for 20–30 minutes. After blocking, samples were incubated in a 1:100 dilution of a monoclonal anti-luciferase antibody (Thermo Fisher Scientific, Waltham, MA, USA) or a 1:1,000 dilution of a polyclonal rabbit anti-luciferase antibody (Abcam, Cambridge, UK). A mouse-on-mouse basic kit (Vector Laboratories, Burlingame, CA, USA) was utilized for the samples incubated with the monoclonal antibody stained slides followed by incubation with a streptavidin AlexaFluor 488 conjugate (Thermo Fisher Scientific, Waltham, MA, USA) at a 1:1,000 dilution. The polyclonal luciferase stained slides were incubated with an AlexaFluor 488 donkey anti-rabbit secondary antibody at a 1:1,000 dilution. Heart samples were formalin fixed and paraffin-embedded and cut serially into 5μm sections every ~250μm throughout the entire tissue to evaluate luciferase transgene expression in different anatomic regions of the heart. Slides were stained for luciferase with the mouse-on-mouse basic kit according to the manufacturer’s instructions and were incubated with the monoclonal anti-luciferase antibody as described above. Slides were mounted with ProLong diamond antifade mountant containing 4’-6-Diamidino-2-phenylindole (DAPI) (Thermo Fisher, Waltham, MA, USA). Fluorescent microscopy was used to evaluate luciferase transgene expression and localization (Zeiss Axioscop 2 Plus with AxioVision Release 4.7 software, Carl Zeiss MicroImaging, LLC, Thornwood, NY, USA). Two to three sections from each embedded liver lobe (left, right and left portions of the median and anterior and posterior right lobe) for a total of approximately ten to fifteen sections per mouse were evaluated by immunofluorescence. Approximately 12–14 sections were evaluated for each heart sample to best characterize the transfection localization patterns and assess for UTMD-related bioeffects throughout the whole heart. Hematoxylin and Eosin (H and E) staining. was also performed on serial sections of all tissue samples.
ALT activity assay
An alanine transaminase (ALT) activity colorimetric assay was used to evaluate plasma samples after ultrasound treatment, and was compared to untreated controls according to the manufacturer’s protocol (Abcam, Cambridge, UK, Cat. No. ab105134). Mouse plasma was prepared by collecting blood 9:1 in 3.2% sodium citrate followed by centrifugation.
Statistical analysis
The GraphPad Prism program (Version 8.0, La Jolla, CA, USA) was used to analyze data. Mean values were determined for experimental groups and error bars indicate ± standard deviation (s.d.) or standard error of the mean (SEM for the ALT activity assay). Student’s t-test (two-sided) was used to analyze differences in luciferase expression between groups and analysis of variance was used for multiple group comparisons. A P-value <0.05 was considered statistically significant.
Results
Evaluation of FUS parameters in the mouse liver
F-UTMD was used to deliver a liver-specific expression construct, pZY53-luc, to the livers of C57BL/6 mice. Different FUS parameters were investigated in separate treatment groups to develop an optimized approach for subsequent UTMD comparison studies (Figure 1). The experimental basis for evaluating certain UTMD-based parameters was established from findings previously reported by other groups as well as our own studies.(Anderson, et al. 2016, Shapiro, et al. 2016, Song, et al. 2012, Wang, et al. 2014) Figure 1 displays in vivo bioluminescence average radiance data from the most effective treatments, which were then evaluated in larger treatment groups (n=3–10 mice per group). The specific parameters assessed in these studies are shown in Table 1. The highest levels of in vivo bioluminescence expression 48 hours after treatment were detected in treatment groups 1, 4, and 6 compared to control mice that received FUS and microbubbles without DNA (P=0.0095, P=0.0334 and P=0.0039 respectively). These groups included treatments using a 350mVpp amplitude signal to operate the transducer with either a 14Hz (groups 1 and 6) or 56Hz PRF (group 4), a 5mm target depth (groups 1 and 4) or a combined 5mm and 13mm strategy (group 6) and incorporated treatment durations of 2 minutes (group 4) or 4 minutes (groups 1 and 6). A large variation was observed in group 4 as two of the six mice treated in this group had bioluminescence levels that were over 10-fold lower than three of the mice and over 100-fold lower than the mouse with the strongest expression. The control group included mice that received FUS and an injection of microbubbles only or FUS and naked plasmid DNA. In our previous UTMD studies, we have not found a difference between injecting naked DNA and not performing any ultrasound and injecting naked DNA followed by ultrasound. We thought that a more representative control in these new FUS studies would include the ultrasound treatment for both control groups since it is our goal to evaluate the effects of FUS on gene delivery. Lower amplitude signals ranging from 50–150mVpp were explored in group 3 in addition to other combined parameter changes incorporating either the 14 or 56Hz PRF, 2–4 minute treatment duration and 5 or 13mm depth changes as shown in Table 1. Additional increasing voltages were also explored between 200–300mVpp (n=3 mice exposed to 200, 250 and 300mVpp each), however this data is not shown in Table 1 since the resulting in vivo bioluminescence expression was not significantly different from the 50–150mVpp group. Groups 2, 3, and 5 were not significantly enhanced compared to the control. Other FUS parameter changes (mainly to the PRF and pulse duration) were evaluated in preliminary experiments that examined additional modifications but were associated with lower intensities of bioluminescence expression and were not included in the expanded optimization work presented here. Based on the data shown in Figure 1, incorporation of a lower PRF (14Hz), short pulse duration (<20us), and longer insonation time (4 minutes) were optimal and resulted in fewer ultrasound-related bioeffects (assessed histologically) than what was observed with increased PRF, even when treatment times were reduced to 2 minutes. It appears that the extended treatment time allows for more exposure of the liver to FUS as the relatively small focal point is scanned manually across the liver. In addition, manipulation of the depth to deposit focused ultrasound energy at both ~5mm and 13mm likely permits more exposure of hepatocytes to ultrasound.
Liver samples from treatment groups 1–6 were harvested 48 hours after delivery of pZY53-luc and the distribution of the luciferase transgene expression was evaluated in the right and left portions of the medial lobe, left lobe, and anterior and posterior right-sided lobes by immunofluorescence. Immunofluorescent images of samples collected from treatment groups 1 and 6 in Figure 2A–C show patches of robust luciferase expression in clusters of hepatocytes throughout the liver (Figure 2D). The more superficial medial lobe of the mouse liver had the greatest transgene expression with some expression detectable in the left and right lobes. Liver sections were stained in transverse orientations to evaluate the depth of transfection. The different patches shown in the fluorescent staining pattern in Figure 2C result from delivery at multiple depths for the group 6 treatment. Serial sections from these samples were also evaluated by H&E staining (Figure 2E–F). Small, localized regions of red blood cell extravasation and hemorrhage were evident in some of the treated mice. This finding was more prominent in samples exposed to F-UTMD for 4 minutes at a single depth (group 1) compared to 2 minutes at two varying depths (group 6). As previously observed in conventional UTMD studies, hepatic regions where bio-effects are evident correspond to regions where increased transgene transfection is observed.(Anderson, et al. 2016, Miao, et al. 2005) The images shown correspond to tissue samples from groups 1 and 6 collected 48 hours after F-UTMD, whereas damage was less evident in samples examined more than 7 days after transfection (data not shown).
Figure 2.

F-UTMD directs gene transfer of pZY53-luc to localized regions and multiple depths in the liver.
A-B. Luciferase expression from pZY53-luc in the medial and left lobes of the mouse liver, 48 hours after F-UTMD-mediated transfection using the parameters from study 6. Sections were incubated with anti-luciferase primary antibody and AlexaFluor488. C. Luciferase expression detected at multiple depths (5mm and 13mm) from group 6. D. Control sample from mouse liver treated with FUS and microbubbles only. E-F. H&E staining of serial sections of plasmid and FUS control (E) and treated (F) livers. White arrows= luciferase expression resulting from multiple targeting depths (immunofluorescent images) or regions of red blood d cell extravasation, hemorrhage/tissue injury (H&E staining); green= luciferase, blue= DAPI, 100, 200μm scale bars. F-UTMD: focused ultrasound targeted microbubble destruction.
In these treatments, livers were first insonated at the 5mm depth and it is likely that cells in the medial lobe and parts of the left lobe received increased exposure to FUS with an increased frequency of microbubble cavitation. For group 6, after 2 minutes of F-UTMD at 5mm, livers were subjected to 2 minutes of F-UTMD using the 13mm offset with the goal of achieving deeper transfection into the liver. We also evaluated hepatic delivery using the 13mm offset first followed by insonation at 5mm; transfection efficiency was greater when targeting was initiated at 5mm (data not shown). The third FUS transducer offset, designed to target at 18mm, was also explored in preliminary studies but focal point positioning appeared to be too deep for transfecting the mouse liver (data not shown). Directing FUS to a greater depth in a mouse may also increase risks for undesirable FUS exposure to deeper anatomical regions, including the intestines and spinal cord.
Assessment of ALT activity in UTMD-treated plasma
To assess tissue damage, alanine transaminase (ALT) levels were measured in plasma collected from treated animals in the different F-UTMD optimization groups (Table 1) and unfocused studies. Increased ALT activity was observed in plasma collected from mice 48 hours after treatment in all of the groups evaluated. However, aside from Study group 1 (P=0.005) these elevations were modest and not statistically distinct from the control group (Figure 3, ~52.5 mU/mL for n=3 mice). There was also a significant difference in ALT activity between groups 1 and 6, 48 hours after treatment (P=0.011).
Figure 3.
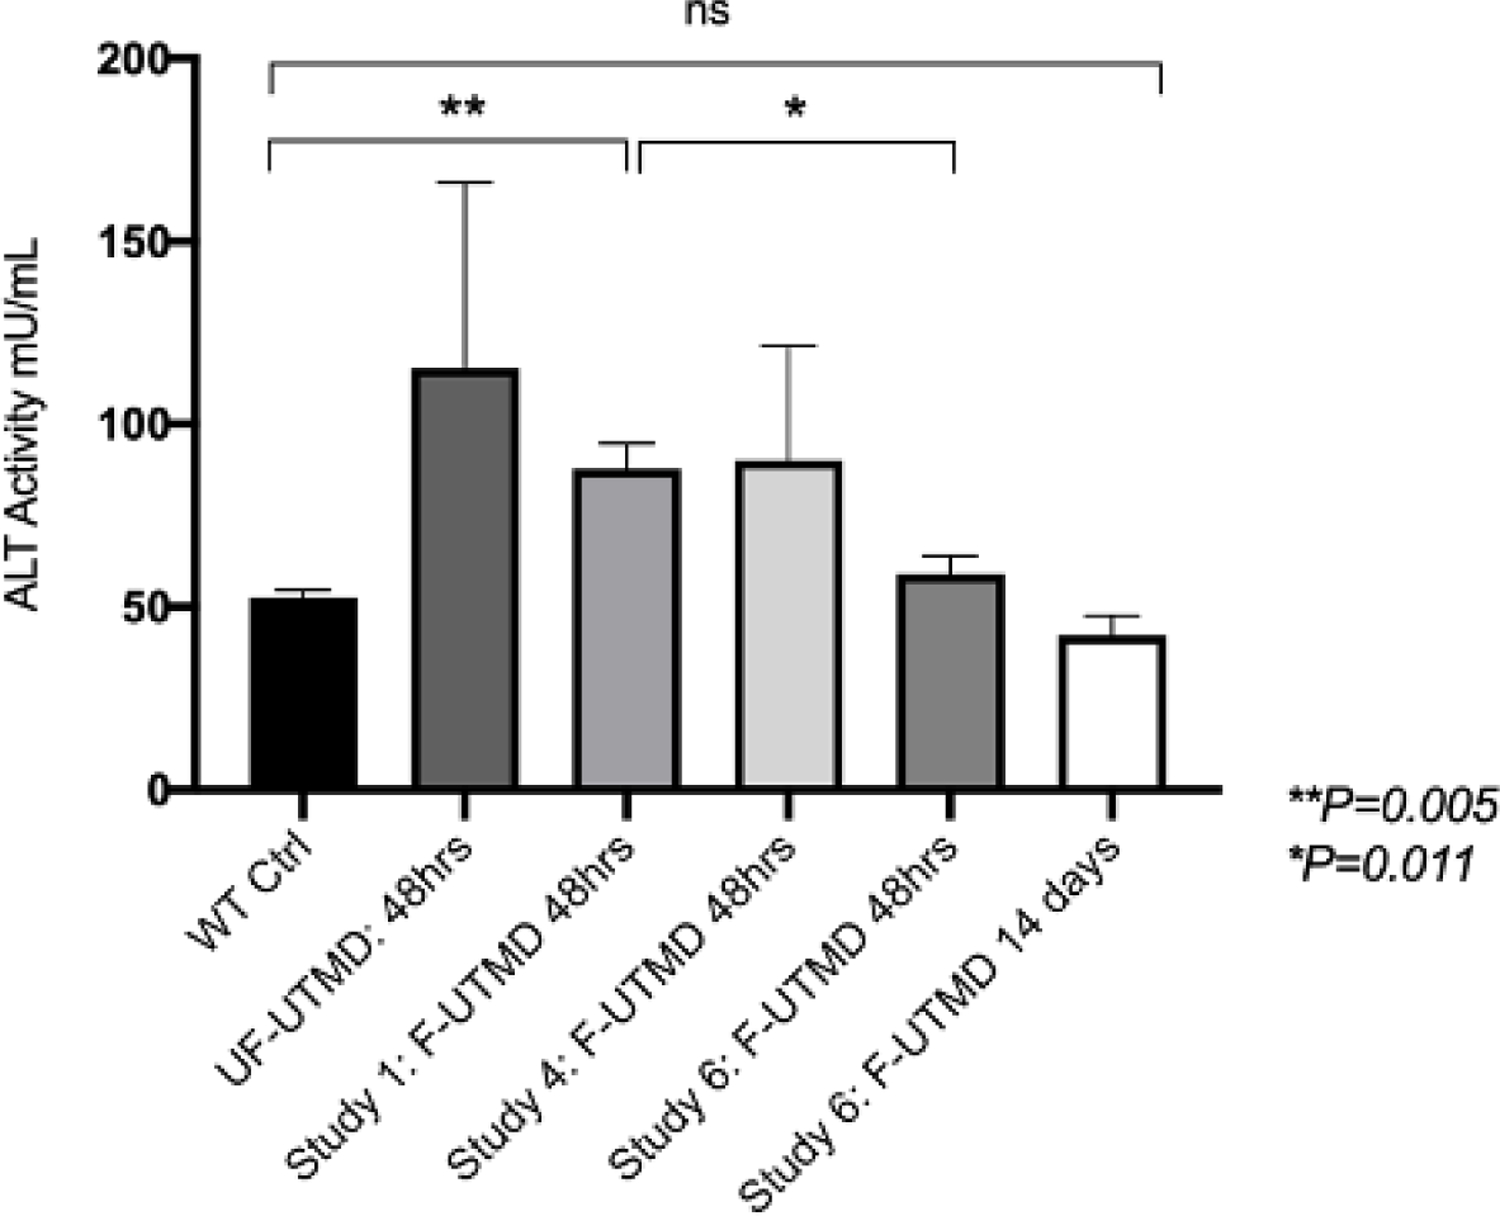
ALT activity shows a mild increase 48 hours after focused and unfocused UTMD.
ALT activity measured in plasma samples collected 48 hours or 14 days after F or UF-UTMD. Plasma from F-UTMD optimization groups 1 (n=5), 4 (n=5), and 6 (n=4) and the non-focused (NF, n=3) UTMD group are provided. Wild type (WT) control plasma was pooled from n=3 mice. Data are represented as mean ± SEM, P=0.282, F-UTMD group 6 compared to the control group, and P=0.341, unfocused group compared to the control group, P=0.355, F-UTMD group 4 compared to the control group, **P=0.005, F-UTMD group 1 compared to the control group, and *P=0.011, F-UTMD group 6 compared to group 1. *P <0.05, **P<0.01.
Comparison of FUS and unfocused UTMD in the liver
Using the optimized double depth targeting F-UTMD protocol from treatment group 6 (Figure 1), we compared focused to unfocused ultrasound using in vivo bioluminescence from pZY53-luc (samples were collected after 24 hours and 8 days, Figure 4A–B). We observed essentially the same levels of reporter expression from both methods. To explore reporter expression contributed from non-hepatocyte cells in the liver (potentially from endothelial cells and hepatic stellate cells), we delivered the CMV-based pcDNA-luc plasmid using focused and unfocused UTMD and again observed similar levels of reporter expression for both methods (Figure 5A–B).
Figure 4.

Hepatic reporter expression intensity is similar for focused and unfocused UTMD using a liver-specific plasmid.
A. Average bioluminescence expression 24 hrs, 5 and 8 days after UTMD delivery of pZY53-luc with FUS (n=10) or unfocused transducers (n=8). The average radiance of luciferase expression is normalized to background control images for each mouse in each bioluminescence image (Living Image Software 3.0). Data is reported in units of p/s/cm2/sr = photons per second per squared centimeter per steradian (Data are represented as mean ± SD, *P=0.963, ns = not statistically significant). B. Representative bioluminescence images from n=2 mice per treatment group, 24 hours after treatment (focused UTMD-left side and unfocused UTMD- right side).
Figure 5.

Comparable levels of bioluminescence expression are achieved with focused and unfocused UTMD delivery of CMV-directed reporter expression in the liver.
A. Average bioluminescence expression 24 hrs, 5 and 8 days after UTMD delivery of pcDNA-luc with focused (n=3) or unfocused transducers (n=3). The average radiance of luciferase expression is normalized to background control images for each mouse in each bioluminescence image (Living Image Software 3.0). Data are represented as mean ± SD, *P=0.70). B. Representative bioluminescence from each group, 24 hours after treatment (unfocused- left side and focused UTMD- right side). C-D. Immunofluorescence staining for luciferase in liver samples collected from pcDNA-luc treated animals with unfocused (C) and focused (D) UTMD. The F-UTMD transfected sample (D) is shown from a distinct region of increased transfection observed in the liver and is not representative of the transfection pattern throughout the entire liver. Luciferase shown as green, DAPI = nuclei shown as blue. White arrows indicate non-hepatocyte cells lining the sinusoidal spaces transfected with luciferase. Scale bar = 50μm.
When we evaluated transfection by immunofluorescence, we noticed differences in the transfection patterns after UTMD (Figure 5C–D and Supplementary Figure 3). F-UTMD again resulted in patches of homogeneously transfected cells while transfection with unfocused UTMD resulted in a diffusely scattered distribution of transfected cells throughout the liver, with the most expression detected in the left and medial lobes (Figure 5C–D, images shown for the right medial lobe and Supplementary Figure 3A–B, images of left lobe). For these hepatic pcDNA-luc transfections, there was also evidence of luciferase transfection in other liver cells types, which may be endothelial cells given their morphology and localization within the hepatic vasculature and sinusoids. There appeared to be more of these transfected non-hepatocytes in the FUS-treated samples compared to unfocused UTMD (Figure 5D, denoted by the white arrows).
Nonlinear contrast imaging to assess microbubble perfusion and cavitation in the liver
Nonlinear contrast (NLC) imaging captures nonlinear microbubble responses by directing multiple ultrasound pulses in which the amplitude of the pulse is modulated so that background tissue signals can be distinguished from nonlinear microbubble signals.(Needles, et al. 2010) In NLC mode, tissue signals are suppressed allowing for nonlinear signals from microbubbles to be captured in real-time which eliminates the post-processing of images that is needed for linear contrast imaging. NLC was used in this study to visualize and quantify the microbubble signal intensity in different regions of the liver immediately after retro-orbital delivery and resulting changes after unfocused or focused UTMD was administered (Supplementary Figure 4–5). Two ROIs were selected within the liver tissue to assess microbubble signal intensity and two ROIs were used for detection of microbubble arrival in the hepatic portal vein and inferior vena cava. After focused or unfocused UTMD, linearized signal intensity was quantitated. Linearized signal intensities were determined from the measured intensities of all of the contrast signal data collected for the given time evaluated after the bolus injection. Interestingly, there was a robust difference with lower intensities associated with focused compared to the unfocused treatment (P=0.002). The average radiance of luciferase reporter expression observed 24 hours after NLC imaging with UTMD was comparable for both methods, despite the significant variations in microbubble signal intensity (P=0.002, Figure 6A–B). The differences in ultrasound intensity at the focal point for FUS, compared to the unfocused beam, may result in different mechanical or thermal effects in response to cavitation, which may in turn influence vascular permeability. Under the conditions of our comparison, these differences in cavitation efficiency and area of insonation led to similar levels of overall transfection.
Figure 6.

Nonlinear Contrast Imaging reveals differences in microbubble dynamics between focused and unfocused UTMD.
A. Average linearized microbubble signal intensities pre- and post- UTMD with the optimized focused (n=3 mice) or unfocused UTMD (n=3 mice) protocols. Control values represent microbubble signal intensity changes immediately after bolus administration of microbubbles and after 4 minutes without insonation (n=1 mouse). Linearized signal intensity values were quantified from average region of interest areas (ROIs with dimensions and relative hepatic positions kept identical for each scan) are reported in arbitrary units (a.u.) quantified using the Vevo 2100 VevoCQ software (Visual Sonics, Inc.). Data are represented as mean ± SD, **P= 0.0015, linearized signal change pre-F-UTMD compared to post-F-UTMD, **P=0.0035, pre-unfocused versus post-unfocused signal changes, and **P=0.0022, post-focused vs. post-unfocused signal change. B. Representative bioluminescence images 24 hrs after pZY53-luc delivery by F-UTMD with integration of non-linear contrast imaging (n=3 mice from F-UTMD NLC imaging data shown in 6A). F-UTMD, focused UTMD; UF-UTMD, unfocused UTMD.
Comparison of UTMD-mediated gene transfer to the heart
We evaluated the F-UTMD approach for directing gene transfer to the mouse heart. The pcDNA-luc plasmid was delivered to the hearts of mice after retro-orbital infusion using the Study 6 targeting parameters for the liver, except that the treatment time was reduced to 90 s and we only utilized the 5mm offset (n=4) (as deeper targeting would be below the heart). Compared to the liver studies, the FUS transducer was scanned over a much smaller region of the left side of the thoracic cavity (~1–1.5cm2 area) with the goal of directing transgene delivery to the left ventricular myocardium, and with careful attention to avoid focal point exposure to the lungs. Delivery of the pcDNA-luc plasmid was performed with unfocused UTMD for comparison. Luciferase expression was detected by in vivo bioluminescence imaging for both ultrasound methods, and the F-UTMD strategy resulted in substantially stronger average radiance intensities, as assessed 1 and 5 days after treatment (Figure 7A–B). Serial cross sections spanning entire heart samples were evaluated by immunofluorescence to characterize the location and depth of transgene expression in the heart (Figure 7C–F). Luciferase expression was predominantly evident in the left ventricle of the myocardium and was again localized to small and highly transfected foci in the heart. In evaluating cross section samples spanning 250–500um above and below the most highly transfected regions we saw a sharp demarcation in the frequency of positively transfected cells (Figure 7C–D). H&E staining was performed on interleaved sections between the immunofluorescence-stained samples to assess damage from the FUS exposure (Figure 7E–F). There was some red blood cell extravasation in myocardial regions proximal to regions of luciferase-expressing cells. To further evaluate the safety of this approach, western blotting to assess troponin leak into the plasma (indicative of cardiomyocyte damage) revealed a very faint band which was most pronounced in the treated sample with the highest bioluminescent signal (Supplementary Figure 2).
Figure 7.

Focused UTMD delivery of luciferase to the heart is enhanced compared to unfocused UTMD and directs delivery of luciferase to the myocardium at precise regions.
A. Average bioluminescence expression 24hrs and 5 days after UTMD delivery of pcDNA-luc with focused (n=4) or unfocused transducers (n=3). (Data are represented as mean ± SD, **P=0.001). B. Representative bioluminescence images from n=2 mice per treatment group, 24 hours after treatment (unfocused- left side, focused UTMD- right side). C-D. Luciferase expression 48 hours after delivery of pcDNA-luc delivery with FUS and microbubbles in the myocardium of the left ventricle (cross-section view), same region of transfection shown with 50μm (C) and 100μm (D) scale bars. Sections incubated with anti-luciferase primary antibody and Streptavidin AlexaFluor488, luciferase (green), DAPI (blue). E-F. H&E staining of untreated WT heart control (E) and serial section of F-UTMD treated heart sample (F) shown in C-D. White arrows indicate regions of red blood cell extravasation (E). FUS, focused ultrasound, F-UTMD, focused UTMD.
Discussion
The goal of this study was to evaluate FUS for microbubble-based gene therapy. Nonviral delivery to the liver has been attained with high-pressure hydrostatic tail vein injection but is associated with a number of safety issues and has obvious limitations for clinical applicability.(Suda and Liu 2007) Ultrasound-based gene transfer with microbubbles is minimally invasive and achieves high tissue specificity for plasmid DNA delivery.(Walton, et al. 2011, Wang, et al. 2015, Yardeni, et al. 2011) However, the relative bioluminescence expression attained with these methods is much lower than viral-based strategies. We hypothesized that focused ultrasound could enhance sonoporation effects of UTMD.(Copelan, et al. 2015, Liang, et al. 2010)
In the present study, we established a reproducible method for directing luciferase expression constructs to the liver (with specific targeting to the medial, left, and right lobes) using F-UTMD parameters that allowed us to achieve robust average radiance levels in the range of 104 – 105 p/s/cm2/sr for the liver-specific pZY53-luc treated mice and on average >10-fold higher levels of expression for delivery of the CMV-based construct, pcDNA-luc. We observed persistent expression for a week after treatment. We selected a double-depth targeting strategy to try and enhance delivery of the reporter construct. However, the average bioluminescence activity was similar to that obtained with unfocused ultrasound (Figures 4–5). We did find that transfection patterns (Figure 5C–D) and microbubble bursting characteristics (Figure 6A) showed important differences. Distinct regions of luciferase-expressing cells were observed in localized regions, and at different depths, in all liver lobes of mice transfected with reporter constructs by F-UTMD (Figure 2A–D). In contrast, with the unfocused approach, a diffuse pattern of rare luciferase-positive cells was seen throughout the parenchyma of the liver with some regions of increased localized expression proximal to blood vessels (Figure 5C). Immunofluorescence staining of transverse liver sections revealed dense regions of luciferase-positive cells at different depths in the tissue (Figure 2C). We attribute this finding to F-UTMD targeting at multiple depths, which may increase the likelihood for enhanced cavitation at deeper regions of the liver, including the right-sided lobes, which are situated more posteriorly in the mouse in relation to the left and medial portions. Operating at two depths with FUS may reduce focal acoustic exposure and thermal effects while also bringing tissues that are out of range, such as the right lobe, into the treatable window. Reduced ALT release was observed using 2 minutes at two depths, compared to 4 minutes at one depth (5mm) (Figure 3, P=0.011). The sensitivity of bioluminescence imaging can be influenced by the anatomical depth of reporter expression in vivo.(Zinn, et al. 2008) It is possible that the actual expression of luciferase is higher in the F-UTMD treated animals, and that IVIS imaging is less efficient for the deeper transfection foci seen.
The pressure amplitude plays an essential role in the transfection success of UTMD. However, given the small focal point size of the FUS transducer, we felt that the positioning of the focal point and varying this position and the depth of this position (between 5mm and 13mm) for the liver F-UTMD studies may also play a significant role in augmenting transfection. The goal of this approach was to scan the focal point across the entire liver at multiple depths to target different regions within the different liver lobes. We hypothesized that the medial lobe and portions of the left lobe would be more readily targeted with the 5mm offset, whereas targeting other portions the left lobe and the more posteriorly situated right lobe would be more efficiently targeted with the 13mm offset.
We observed stronger bioluminescence for the pcDNA-luc plasmid, compared to the pZY53-luc transfections. Our original hypothesis for performing a comparison experiment with the CMV-based plasmid was that F-UTMD may be a more efficient method for transfecting endothelial cells than unfocused ultrasound, as FUS is associated with increased vascular permeability within endothelial cells lining the hepatic microvasculature.(Copelan, et al. 2015, Sheikov, et al. 2008) While the pZY53-luc study allowed us to compare these methods in hepatocytes, the pcDNA-luc experiments allowed us to examine the potential role each method might play in transfecting additional cell types. Immunofluorescence from pcDNA-luc treated livers showed luciferase expression in additional hepatic cells types, particularly in sinusoidal regions of the liver (Figure 5D). Endothelial cells line the hepatic blood vessels and sinusoidal regions and this finding suggests that F-UTMD can direct gene transfer to these cells. There is great interest in delivering blood coagulation Factor IX to hepatocytes, its natural place of production, as a therapy for Hemophilia B.(Tatsumi, et al. 2012) If F-UTMD more efficiently transfects endothelial cells than unfocused ultrasound, then this method could be particularly useful for delivery of Factor VIII (deficient in the more common form of the disease, Hemophilia A), which is naturally synthesized and secreted by hepatic endothelial cells.(Mahlangu, et al. 2018, Turner and Moake 2015) Overall, there may be differences in the relative transfection efficiency of different cell types with both ultrasound methods which will require further evaluation.
We used NLC imaging to assess microbubble delivery and bursting methods in specific regions of the liver. We observed consistent linearized signal intensities in specific ROIs in the liver and a similar level of reduction in this intensity after F-UTMD at 5mm and 13mm depths. This indicates that our delivery strategy and acoustic parameters for both focused and unfocused UTMD have reproducibility between multiple experiments. We also observed similar signal intensity changes between animals evaluated from UF-UTMD, however, the average intensity changes in these studies were not as strong as the F-UTMD group (Figure 6A). These observations suggest that the FUS protocol may result in more microbubble cavitation events compared to unfocused ultrasound despite lower PNP intensities (fluctuating in the peak intensity range of 0.40–0.55 MPa) than the immersion-style transducer (1.3–1.8 MPa) using the same bursting parameters but different amplitude signal intensities. This finding is particularly surprising given the relatively small size of the FUS focal point compared to the hepatic exposure generated from the unfocused transducer. Similarly, bioluminescence expression generated similar average radiance intensities between the two types of treatment. It is possible that there is a DNA transfection threshold attained in these UTMD treatments in which greater cavitation events within the 4 minute treatment time observed for F-UTMD does not necessarily result in an enhancement in DNA uptake by the surrounding hepatocytes. In addition, the greater change in contrast signal intensity change observed by NLC imaging after focused UTMD could also be the result of the multi-depth targeting that was implemented in these experiments using the 5mm and 13mm FUS transducer offsets combined in the 4 minute insonation. The unfocused ultrasound beam depth cannot be as tightly controlled or modified in comparison to the FUS transducer. Evaluation of microbubble signal intensity changes using NLC imaging provides a noninvasive quantification of microbubble signal intensities and changes within the hepatic vasculature after insonation.(Feingold, et al. 2010, Needles, et al. 2010) This method has also allowed us to begin to explore microbubble circulation, persistence, and the effects of acoustic cavitation for our protocols in real-time and could be useful for evaluating additional ultrasound parameter modifications, microbubble formulations, and transducers.
To our knowledge, this study presents the first data on using FUS and microbubbles to direct gene transfer to the heart. We have previously used unfocused UTMD for delivery of luciferase and VEGF to the heart in rats.(Bekeredjian, et al. 2005, Chen, et al. 2003) UF-UTMD has also been used to deliver therapeutic angiogenic plasmids after myocardial infarction in mice and rats.(Fujii, et al. 2011, Fujii, et al. 2009, Kobulnik, et al. 2009) There has been limited success using this strategy, perhaps related to the size of the unfocused ultrasound beam relative to the size of the mouse heart or potential attenuation of the unfocused wave resulting from skeletal structures including the sternum and ribcage. In the F-UTMD cardiac gene transfer studies presented here, we were able to obtain luciferase expression in the heart using lower acoustic pressure intensities and pulsing frequencies than were required for cavitation by unfocused insonation (Figure 7C–D). When we performed comparison experiments using unfocused UTMD, we observed substantially lower intensities of reporter expression (Figure 7A–B, P=0.001). It appears that F-UTMD is more effective for achieving gene transfer to the heart than the liver. We hypothesize that the localized energy of the FUS focal point may be more efficient at transfecting muscle tissue, specifically cardiomyocytes, than unfocused energy. It is also possible that FUS is more efficient at bypassing the attenuating skeletal features of the thoracic cavity (sternum and ribs) compared to unfocused ultrasound and that the considerable size differences between the FUS focal point and unfocused ultrasound beam (in relation to the size of the mouse) makes F-UTMD a more accurate and efficient method for targeting the myocardium in these small rodents. In our set-up, the FUS transducer is positioned to avoid contact with the sternum. Avoiding contact with thoracic bone structures and attenuation of the FUS pressure is more challenging without imaging guidance but we have found that these effects can be minimized with careful positioning of the FUS transducer directed from the apex and up toward the left ventricle. This data suggests the potential for using FUS and microbubbles to noninvasively direct cardiac gene transfer.
Overall, the goal of this study was to compare two ultrasound approaches for achieving tissue-specific, bubble-augmented, reporter gene transfer. Focused and unfocused transducers were used with an optimized UTMD protocol to evaluate the delivery of luciferase to the mouse liver and heart. For the F-UTMD studies, we developed a protocol for targeting transgene delivery to multiple depths in the same treatment that resulted in strong levels of reporter expression. This method is useful for distributing the energy of the FUS focal point to different planes in the liver and may be helpful for directing gene transfer to a specific lobe/and or region within a lobe in the liver, perhaps even to very defined areas of metastases. Recent advances in technology using ultrasound-guided focused ultrasound (USg-FUS) allow electronic modulation of a the focus, which could further enhance the volume of transfected tissue.(Ebbini and ter Haar 2015) We also incorporated NLC imaging to evaluate delivery, perfusion, and acoustic dynamics of our DNA-microbubble formulations before and after UTMD. NLC imaging has been used previously in preclinical studies as a tool for quantifying blood perfusion and assessing perfusion in small animal disease models.(Shirinifard, et al. 2017) In the studies presented here, we were interested in using NLC imaging as a tool for assessing UTMD in real-time. We were able to compare the contrast signal intensity changes between our focused and unfocused ultrasound protocols using similar acoustic conditions. In vivo bioluminescence imaging was used to assess the resulting transfection efficiency and served as an indirect measure of overall UTMD effectiveness. These results point to more effective methods for microbubble-DNA delivery and parameters for applying acoustic cavitation to deliver therapeutic transgenes.
Supplementary Material
The HIFU transducer (model H-102, Sonic Concepts Inc.) has a 1.1MHz working center frequency and is fitted with a modular water coupling cone that can be adjusted to position the focal point to 5, 13, and 18mm depths by changing the offset rings at the tip of the cone. The focal point width is ~1.4mm and the length is ~10.2mm.
Western blot of treated plasma samples (n=4) diluted 1:50 and incubated with an anti-Troponin T antibody (Santa Cruz Biotechnology), untreated plasma from pooled WT mice (n=3) are shown as a control. Representative bioluminescent images from the corresponding mice are shown.
A-B. Immunofluorescence staining for luciferase in left liver lobe samples collected from pcDNA-luc treated animals with unfocused (A) and focused (B) UTMD. The F-UTMD transfected sample (B) is shown from a distinct region of increased transfection observed in the liver and is not representative of the transfection pattern throughout the entire liver. Luciferase shown as green, DAPI = nuclei shown as blue. White boxes denote specific magnified regions shown below each immunofluorescence section (A-B). Scale bar = 200μm.
A-B. Panels of nonlinear contrast (NLC) images in the liver for Unfocused UTMD (A) or Focused UTMD (B): before microbubbles were administered retro-orbitally, immediately after microbubble arrival to the liver, 10 seconds after microbubble delivery, and after either unfocused UTMD (A) or focused UTMD (B) was administered for 4 minutes. The bottom panels for A and B represent enlarged images after unfocused (A) and focused (B) UTMD was performed. The dashed white line denotes the region of interest to observe microbubble perfusion differences between A and B and the white arrows (A, enlarged bottom panel) point to areas where microbubble perfusion is still evident in the liver. Mouse liver is shown in a transverse orientation; MBs, microbubbles; PV, portal vein.
A-B. Nonlinear contrast imaging-based detection of contrast agent signal intensity after intravenous delivery. A. Perfusion curve graph of the contrast mean power intensity (measure in linear arbitrary units) measured over time (105 seconds). Colored curves refer to distinct regions of interest (ROI) in the transverse orientation of the mouse liver, shown: ROI 1 (green) liver parenchyma, ROI 2 (yellow) hepatic portal vein, ROI 3 (pink) vena cava, ROI 4 and 5 (non-target control regions). Portal vein and vena cava serve as anatomical landmarks for detecting initial arrival of microbubbles after bolus delivery. For the NLC imaging analysis in Figure 6, 2 distinct ROIs in the liver parenchyma were used for the data acquisition and analysis pre-bolus delivery, immediately after bolus delivery, and after UTMD treatment (focused or unfocused).
Acknowledgements
The researchers would like to thank Abigail Avelar, Giorgio Tran, Aaron Tuia, and Mark Khemmani from the UH Center for Cardiovascular Research for research support and Miyoko Bellinger and Kris Ewell from the UH Histology & Imaging core for embedding and sectioning of histological samples. This research was supported by AHA Fellowship 33990116 (to CDA) and NIH T32 HL115505 (to RVS).
Footnotes
Publisher's Disclaimer: This is a PDF file of an unedited manuscript that has been accepted for publication. As a service to our customers we are providing this early version of the manuscript. The manuscript will undergo copyediting, typesetting, and review of the resulting proof before it is published in its final form. Please note that during the production process errors may be discovered which could affect the content, and all legal disclaimers that apply to the journal pertain.
Declaration of Competing Interest
A US provisional patent application has been filed, No. 62/924,626 that is relevant to the UTMD methodology presented in this study.
References
- Anderson CD, Moisyadi S, Avelar A, Walton CB, Shohet RV. Ultrasound-targeted hepatic delivery of factor IX in hemophiliac mice. Gene Ther 2016; 23:510–9. [DOI] [PMC free article] [PubMed] [Google Scholar]
- Anderson CD, Urschitz J, Khemmani M, Owens JB, Moisyadi S, Shohet RV, Walton CB. Ultrasound directs a transposase system for durable hepatic gene delivery in mice. Ultrasound Med Biol 2013; 39:2351–61. [DOI] [PMC free article] [PubMed] [Google Scholar]
- Bekeredjian R, Chen S, Frenkel PA, Grayburn PA, Shohet RV. Ultrasound-targeted microbubble destruction can repeatedly direct highly specific plasmid expression to the heart. Circulation 2003; 108:1022–6. [DOI] [PubMed] [Google Scholar]
- Bekeredjian R, Chen S, Grayburn PA, Shohet RV. Augmentation of cardiac protein delivery using ultrasound targeted microbubble destruction. Ultrasound Med Biol 2005; 31:687–91. [DOI] [PubMed] [Google Scholar]
- Carpentier A, Canney M, Vignot A, Reina V, Beccaria K, Horodyckid C, Karachi C, Leclercq D, Lafon C, Chapelon JY, Capelle L, Cornu P, Sanson M, Hoang-Xuan K, Delattre JY, Idbaih A. Clinical trial of blood-brain barrier disruption by pulsed ultrasound. Sci Transl Med 2016; 8:343re2. [DOI] [PubMed] [Google Scholar]
- Chen S, Ding JH, Bekeredjian R, Yang BZ, Shohet RV, Johnston SA, Hohmeier HE, Newgard CB, Grayburn PA. Efficient gene delivery to pancreatic islets with ultrasonic microbubble destruction technology. Proc Natl Acad Sci U S A 2006; 103:8469–74. [DOI] [PMC free article] [PubMed] [Google Scholar]
- Chen S, Shohet RV, Bekeredjian R, Frenkel P, Grayburn PA. Optimization of ultrasound parameters for cardiac gene delivery of adenoviral or plasmid deoxyribonucleic acid by ultrasound-targeted microbubble destruction. J Am Coll Cardiol 2003; 42:301–8. [DOI] [PubMed] [Google Scholar]
- Chen ZY, Lin Y, Yang F, Jiang L, Ge S. Gene therapy for cardiovascular disease mediated by ultrasound and microbubbles. Cardiovasc Ultrasound 2013; 11:11. [DOI] [PMC free article] [PubMed] [Google Scholar]
- Choi JJ, Selert K, Vlachos F, Wong A, Konofagou EE. Noninvasive and localized neuronal delivery using short ultrasonic pulses and microbubbles. Proc Natl Acad Sci U S A 2011; 108:16539–44. [DOI] [PMC free article] [PubMed] [Google Scholar]
- Chomas JE, Dayton P, May D, Ferrara K. Threshold of fragmentation for ultrasonic contrast agents. J Biomed Opt 2001; 6:141–50. [DOI] [PubMed] [Google Scholar]
- Copelan A, Hartman J, Chehab M, Venkatesan AM. High-Intensity Focused Ultrasound: Current Status for Image-Guided Therapy. Semin Intervent Radiol 2015; 32:398–415. [DOI] [PMC free article] [PubMed] [Google Scholar]
- Ebbini ES, ter Haar G. Ultrasound-guided therapeutic focused ultrasound: current status and future directions. Int J Hyperthermia 2015; 31:77–89. [DOI] [PubMed] [Google Scholar]
- Feingold S, Gessner R, Guracar IM, Dayton PA. Quantitative volumetric perfusion mapping of the microvasculature using contrast ultrasound. Invest Radiol 2010; 45:669–74. [DOI] [PMC free article] [PubMed] [Google Scholar]
- Fisher DG, Price RJ. Recent Advances in the Use of Focused Ultrasound for Magnetic Resonance Image-Guided Therapeutic Nanoparticle Delivery to the Central Nervous System. Front Pharmacol 2019; 10:1348. [DOI] [PMC free article] [PubMed] [Google Scholar]
- Fishman PS, Frenkel V. Treatment of Movement Disorders With Focused Ultrasound. J Cent Nerv Syst Dis 2017; 9:1179573517705670. [DOI] [PMC free article] [PubMed] [Google Scholar]
- Fujii H, Li SH, Wu J, Miyagi Y, Yau TM, Rakowski H, Egashira K, Guo J, Weisel RD, Li RK. Repeated and targeted transfer of angiogenic plasmids into the infarcted rat heart via ultrasound targeted microbubble destruction enhances cardiac repair. Eur Heart J 2011; 32:2075–84. [DOI] [PubMed] [Google Scholar]
- Fujii H, Sun Z, Li SH, Wu J, Fazel S, Weisel RD, Rakowski H, Lindner J, Li RK. Ultrasound-targeted gene delivery induces angiogenesis after a myocardial infarction in mice. JACC Cardiovasc Imaging 2009; 2:869–79. [DOI] [PubMed] [Google Scholar]
- Ilovitsh T, Ilovitsh A, Foiret J, Caskey CF, Kusunose J, Fite BZ, Zhang H, Mahakian LM, Tam S, Butts-Pauly K, Qin S, Ferrara KW. Enhanced microbubble contrast agent oscillation following 250 kHz insonation. Sci Rep 2018; 8:16347. [DOI] [PMC free article] [PubMed] [Google Scholar]
- Kay MA. State-of-the-art gene-based therapies: the road ahead. Nat Rev Genet 2011; 12:316–28. [DOI] [PubMed] [Google Scholar]
- Kim YS, Rhim H, Choi MJ, Lim HK, Choi D. High-intensity focused ultrasound therapy: an overview for radiologists. Korean J Radiol 2008; 9:291–302. [DOI] [PMC free article] [PubMed] [Google Scholar]
- Kobulnik J, Kuliszewski MA, Stewart DJ, Lindner JR, Leong-Poi H. Comparison of gene delivery techniques for therapeutic angiogenesis ultrasound-mediated destruction of carrier microbubbles versus direct intramuscular injection. J Am Coll Cardiol 2009; 54:1735–42. [DOI] [PubMed] [Google Scholar]
- Liang HD, Tang J, Halliwell M. Sonoporation, drug delivery, and gene therapy. Proc Inst Mech Eng H 2010; 224:343–61. [DOI] [PubMed] [Google Scholar]
- Lipsman N, Meng Y, Bethune AJ, Huang Y, Lam B, Masellis M, Herrmann N, Heyn C, Aubert I, Boutet A, Smith GS, Hynynen K, Black SE. Blood-brain barrier opening in Alzheimer’s disease using MR-guided focused ultrasound. Nat Commun 2018; 9:2336. [DOI] [PMC free article] [PubMed] [Google Scholar]
- Mahlangu J, Oldenburg J, Paz-Priel I, Negrier C, Niggli M, Mancuso ME, Schmitt C, Jimenez-Yuste V, Kempton C, Dhalluin C, Callaghan MU, Bujan W, Shima M, Adamkewicz JI, Asikanius E, Levy GG, Kruse-Jarres R. Emicizumab Prophylaxis in Patients Who Have Hemophilia A without Inhibitors. N Engl J Med 2018; 379:811–22. [DOI] [PubMed] [Google Scholar]
- Miao CH, Brayman AA, Loeb KR, Ye P, Zhou L, Mourad P, Crum LA. Ultrasound enhances gene delivery of human factor IX plasmid. Hum Gene Ther 2005; 16:893–905. [DOI] [PubMed] [Google Scholar]
- Needles A, Arditi M, Rognin NG, Mehi J, Coulthard T, Bilan-Tracey C, Gaud E, Frinking P, Hirson D, Foster FS. Nonlinear contrast imaging with an array-based micro-ultrasound system. Ultrasound Med Biol 2010; 36:2097–106. [DOI] [PubMed] [Google Scholar]
- Noble-Vranish ML, Song S, Morrison KP, Tran DM, Sun RR, Loeb KR, Keilman GW, Miao CH. Ultrasound-Mediated Gene Therapy in Swine Livers Using Single-Element, Multi-lensed, High-Intensity Ultrasound Transducers. Mol Ther Methods Clin Dev 2018; 10:179–88. [DOI] [PMC free article] [PubMed] [Google Scholar]
- Peruzzi G, Sinibaldi G, Silvani G, Ruocco G, Casciola CM. Perspectives on cavitation enhanced endothelial layer permeability. Colloids Surf B Biointerfaces 2018; 168:83–93. [DOI] [PubMed] [Google Scholar]
- Price RJ, Fisher DG, Suk JS, Hanes J, Ko HS, Kordower JH. Parkinson’s disease gene therapy: Will focused ultrasound and nanovectors be the next frontier? Mov Disord 2019; 34:1279–82. [DOI] [PMC free article] [PubMed] [Google Scholar]
- Qin S, Caskey CF, Ferrara KW. Ultrasound contrast microbubbles in imaging and therapy: physical principles and engineering. Phys Med Biol 2009; 54:R27–57. [DOI] [PMC free article] [PubMed] [Google Scholar]
- Rincon MY, VandenDriessche T, Chuah MK. Gene therapy for cardiovascular disease: advances in vector development, targeting, and delivery for clinical translation. Cardiovasc Res 2015; 108:4–20. [DOI] [PMC free article] [PubMed] [Google Scholar]
- Shapiro G, Wong AW, Bez M, Yang F, Tam S, Even L, Sheyn D, Ben-David S, Tawackoli W, Pelled G, Ferrara KW, Gazit D. Multiparameter evaluation of in vivo gene delivery using ultrasound-guided, microbubble-enhanced sonoporation. J Control Release 2016; 223:157–64. [DOI] [PMC free article] [PubMed] [Google Scholar]
- Shaw CJ, ter Haar GR, Rivens IH, Giussani DA, Lees CC. Pathophysiological mechanisms of high-intensity focused ultrasound-mediated vascular occlusion and relevance to non-invasive fetal surgery. J R Soc Interface 2014; 11:20140029. [DOI] [PMC free article] [PubMed] [Google Scholar]
- Sheikov N, McDannold N, Sharma S, Hynynen K. Effect of focused ultrasound applied with an ultrasound contrast agent on the tight junctional integrity of the brain microvascular endothelium. Ultrasound Med Biol 2008; 34:1093–104. [DOI] [PMC free article] [PubMed] [Google Scholar]
- Shirinifard A, Thiagarajan S, Johnson MD, Calabrese C, Sablauer A. Measuring Absolute Blood Perfusion in Mice Using Dynamic Contrast-Enhanced Ultrasound. Ultrasound Med Biol 2017; 43:1628–38. [DOI] [PubMed] [Google Scholar]
- Song S, Noble M, Sun S, Chen L, Brayman AA, Miao CH. Efficient microbubble- and ultrasound-mediated plasmid DNA delivery into a specific rat liver lobe via a targeted injection and acoustic exposure using a novel ultrasound system. Mol Pharm 2012; 9:2187–96. [DOI] [PMC free article] [PubMed] [Google Scholar]
- Song S, Shen Z, Chen L, Brayman AA, Miao CH. Explorations of high-intensity therapeutic ultrasound and microbubble-mediated gene delivery in mouse liver. Gene Ther 2011; 18:1006–14. [DOI] [PMC free article] [PubMed] [Google Scholar]
- Suda T, Liu D. Hydrodynamic gene delivery: its principles and applications. Mol Ther 2007; 15:2063–9. [DOI] [PubMed] [Google Scholar]
- Tatsumi K, Ohashi K, Mukobata S, Kubo A, Koyama F, Nakajima Y, Shima M, Okano T. Hepatocyte Is a Sole Cell Type Responsible for the Production of Coagulation Factor IX In Vivo. Cell Med 2012; 3:25–31. [DOI] [PMC free article] [PubMed] [Google Scholar]
- Timbie KF, Mead BP, Price RJ. Drug and gene delivery across the blood-brain barrier with focused ultrasound. J Control Release 2015; 219:61–75. [DOI] [PMC free article] [PubMed] [Google Scholar]
- Tran DM, Harrang J, Song S, Chen J, Smith BM, Miao CH. Prolonging pulse duration in ultrasound-mediated gene delivery lowers acoustic pressure threshold for efficient gene transfer to cells and small animals. J Control Release 2018; 279:345–54. [DOI] [PMC free article] [PubMed] [Google Scholar]
- Tran DM, Zhang F, Morrison KP, Loeb KR, Harrang J, Kajimoto M, Chavez F, Wu L, Miao CH. Transcutaneous Ultrasound-Mediated Nonviral Gene Delivery to the Liver in a Porcine Model. Mol Ther Methods Clin Dev 2019; 14:275–84. [DOI] [PMC free article] [PubMed] [Google Scholar]
- Turner NA, Moake JL. Factor VIII Is Synthesized in Human Endothelial Cells, Packaged in Weibel-Palade Bodies and Secreted Bound to ULVWF Strings. PLoS One 2015; 10:e0140740. [DOI] [PMC free article] [PubMed] [Google Scholar]
- Walton CB, Anderson CD, Boulay R, Shohet RV. Introduction to the ultrasound targeted microbubble destruction technique. J Vis Exp 2011. [DOI] [PMC free article] [PubMed] [Google Scholar]
- Wang F, Nojima M, Inoue Y, Ohtomo K, Kiryu S. Assessment of MRI Contrast Agent Kinetics via Retro-Orbital Injection in Mice: Comparison with Tail Vein Injection. PLoS One 2015; 10:e0129326. [DOI] [PMC free article] [PubMed] [Google Scholar]
- Wang S, Karakatsani ME, Fung C, Sun T, Acosta C, Konofagou E. Direct brain infusion can be enhanced with focused ultrasound and microbubbles. J Cereb Blood Flow Metab 2017; 37:706–14. [DOI] [PMC free article] [PubMed] [Google Scholar]
- Wang S, Samiotaki G, Olumolade O, Feshitan JA, Konofagou EE. Microbubble type and distribution dependence of focused ultrasound-induced blood-brain barrier opening. Ultrasound Med Biol 2014; 40:130–7. [DOI] [PMC free article] [PubMed] [Google Scholar]
- Yardeni T, Eckhaus M, Morris HD, Huizing M, Hoogstraten-Miller S. Retro-orbital injections in mice. Lab Anim (NY) 2011; 40:155–60. [DOI] [PMC free article] [PubMed] [Google Scholar]
- Zinn KR, Chaudhuri TR, Szafran AA, O’Quinn D, Weaver C, Dugger K, Lamar D, Kesterson RA, Wang X, Frank SJ. Noninvasive bioluminescence imaging in small animals. ILAR J 2008; 49:103–15. [DOI] [PMC free article] [PubMed] [Google Scholar]
Associated Data
This section collects any data citations, data availability statements, or supplementary materials included in this article.
Supplementary Materials
The HIFU transducer (model H-102, Sonic Concepts Inc.) has a 1.1MHz working center frequency and is fitted with a modular water coupling cone that can be adjusted to position the focal point to 5, 13, and 18mm depths by changing the offset rings at the tip of the cone. The focal point width is ~1.4mm and the length is ~10.2mm.
Western blot of treated plasma samples (n=4) diluted 1:50 and incubated with an anti-Troponin T antibody (Santa Cruz Biotechnology), untreated plasma from pooled WT mice (n=3) are shown as a control. Representative bioluminescent images from the corresponding mice are shown.
A-B. Immunofluorescence staining for luciferase in left liver lobe samples collected from pcDNA-luc treated animals with unfocused (A) and focused (B) UTMD. The F-UTMD transfected sample (B) is shown from a distinct region of increased transfection observed in the liver and is not representative of the transfection pattern throughout the entire liver. Luciferase shown as green, DAPI = nuclei shown as blue. White boxes denote specific magnified regions shown below each immunofluorescence section (A-B). Scale bar = 200μm.
A-B. Panels of nonlinear contrast (NLC) images in the liver for Unfocused UTMD (A) or Focused UTMD (B): before microbubbles were administered retro-orbitally, immediately after microbubble arrival to the liver, 10 seconds after microbubble delivery, and after either unfocused UTMD (A) or focused UTMD (B) was administered for 4 minutes. The bottom panels for A and B represent enlarged images after unfocused (A) and focused (B) UTMD was performed. The dashed white line denotes the region of interest to observe microbubble perfusion differences between A and B and the white arrows (A, enlarged bottom panel) point to areas where microbubble perfusion is still evident in the liver. Mouse liver is shown in a transverse orientation; MBs, microbubbles; PV, portal vein.
A-B. Nonlinear contrast imaging-based detection of contrast agent signal intensity after intravenous delivery. A. Perfusion curve graph of the contrast mean power intensity (measure in linear arbitrary units) measured over time (105 seconds). Colored curves refer to distinct regions of interest (ROI) in the transverse orientation of the mouse liver, shown: ROI 1 (green) liver parenchyma, ROI 2 (yellow) hepatic portal vein, ROI 3 (pink) vena cava, ROI 4 and 5 (non-target control regions). Portal vein and vena cava serve as anatomical landmarks for detecting initial arrival of microbubbles after bolus delivery. For the NLC imaging analysis in Figure 6, 2 distinct ROIs in the liver parenchyma were used for the data acquisition and analysis pre-bolus delivery, immediately after bolus delivery, and after UTMD treatment (focused or unfocused).