

Abstract
During diabetes human serum albumin (HSA), an important drug transport protein, can be modified by agents such as glyoxal (Go) and methylglyoxal (MGo) to form advanced glycation end-products. High-performance affinity microcolumns and zonal elution competition studies were used to compare interactions by the anti-diabetic drugs repaglinide and nateglinide with normal and Go- or MGo-modified HSA at Sudlow sites I and II of this protein. Both drugs had their strongest binding at Sudlow site II for the normal and modified forms of HSA. The association equilibrium constants at this site for repaglinide and nateglinide with normal HSA were 6.1 (± 0.2) × 104 M−1 and 7.1 (± 0.8) × 105 M−1, respectively, at pH 7.4 and 37° C; these values increased by up to 3.6-fold for repaglinide and decreased by up to 45–55% for nateglinide when HSA was modified by Go or MGo at levels seen in prediabetes or diabetes. Both drugs were also found to bind at Sudlow site I, with association equilibrium constants at this site on normal HSA of 4.2 (± 0.3) × 104 M−1 for repaglinide and 5.0 (± 0.1) × 104 M−1 for nateglinide. The binding strength for repaglinide at Sudlow site I increased by 1.3- to 1.7-fold with the Go-modified HSA and decreased slightly (i.e., up to 19%) for the MGo-modified HSA, while nateglinide showed only a small or insignificant change in binding with the same modified HSA samples. These results indicated that binding by repaglinide and nateglinide with HSA can be altered significantly by modification of this protein with Go or MGo, making these modifications of potential interest in the treatment of patients with these drugs during diabetes.
Keywords: Repaglinide, Nateglinide, Drug-protein binding, Human serum albumin, Advanced glycation end-products, High-performance affinity chromatography
1. Introduction
More than 383 million people around the world suffer from diabetes [1]. About 90–95% of these persons have type II diabetes, which is a condition characterized by impaired insulin action and/or insulin secretion [1,2]. Diabetes results in high sugar levels in blood, which can lead to the modification of proteins through their reaction with glucose (i.e., glycation) or related products [2,3]. Two of these related products are glyoxal (Go) and methylglyoxal (MGo) [3–8]. The serum levels of Go and MGo increase during diabetes [5–7], with these agents possibly reacting with N-termini, lysines, or arginines on proteins to form advanced glycation end-products (AGEs) [3–8].
Human serum albumin (HSA) is one protein known to be modified by glucose, Go, and MGo during diabetes [2,4]. HSA is the most abundant protein in human plasma/serum (concentration, 30–50 g/L) and is responsible for the transportation of many endogenous and exogenous compounds (e.g., drugs and fatty acids) in the circulatory system [4,9]. Many drugs bind to HSA at one or both of two major regions: Sudlow sites I and II, which are located in subdomains IIA and IIIA of HSA, respectively [2,9]. Drugs that are known to bind HSA at these sites include many sulfonylureas that are used to treat type II diabetes [2,10]. It has further been shown in recent studies that the modification of HSA by glucose, Go, or MGo can affect the binding of this protein to sulfonylureas, thus affecting the non-bound and biologically active fraction of these drugs in the circulation [2,10–12].
Repaglinide and nateglinide (see Figure 1) are meglitinide-based drugs that are used to treat type II diabetes by stimulating the secretion of insulin from pancreatic beta cells [13,14]. Like sulfonylureas, these drugs are known to be highly bound (95– 99%) to albumin [15–18]. HSA and the closely-related protein bovine serum albumin (BSA) [9] have both been found in prior studies to have strong binding to these drugs, with reported association equilibrium constants on the order of 105 M−1 at 35–37 °C [15–17]. It has been further determined, by using site-selective probes, that repaglinide has its strongest binding at Sudlow site II of HSA or BSA [15,17]. However, little or no quantitative data are available on how these drugs may bind to Sudlow site I or on the site-specific binding by nateglinide with HSA [15–18]. In addition, there is no information at present on how binding by these drugs with HSA may be affected by protein modifications that occur during diabetes, such as AGE formation [4].
Figure 1.
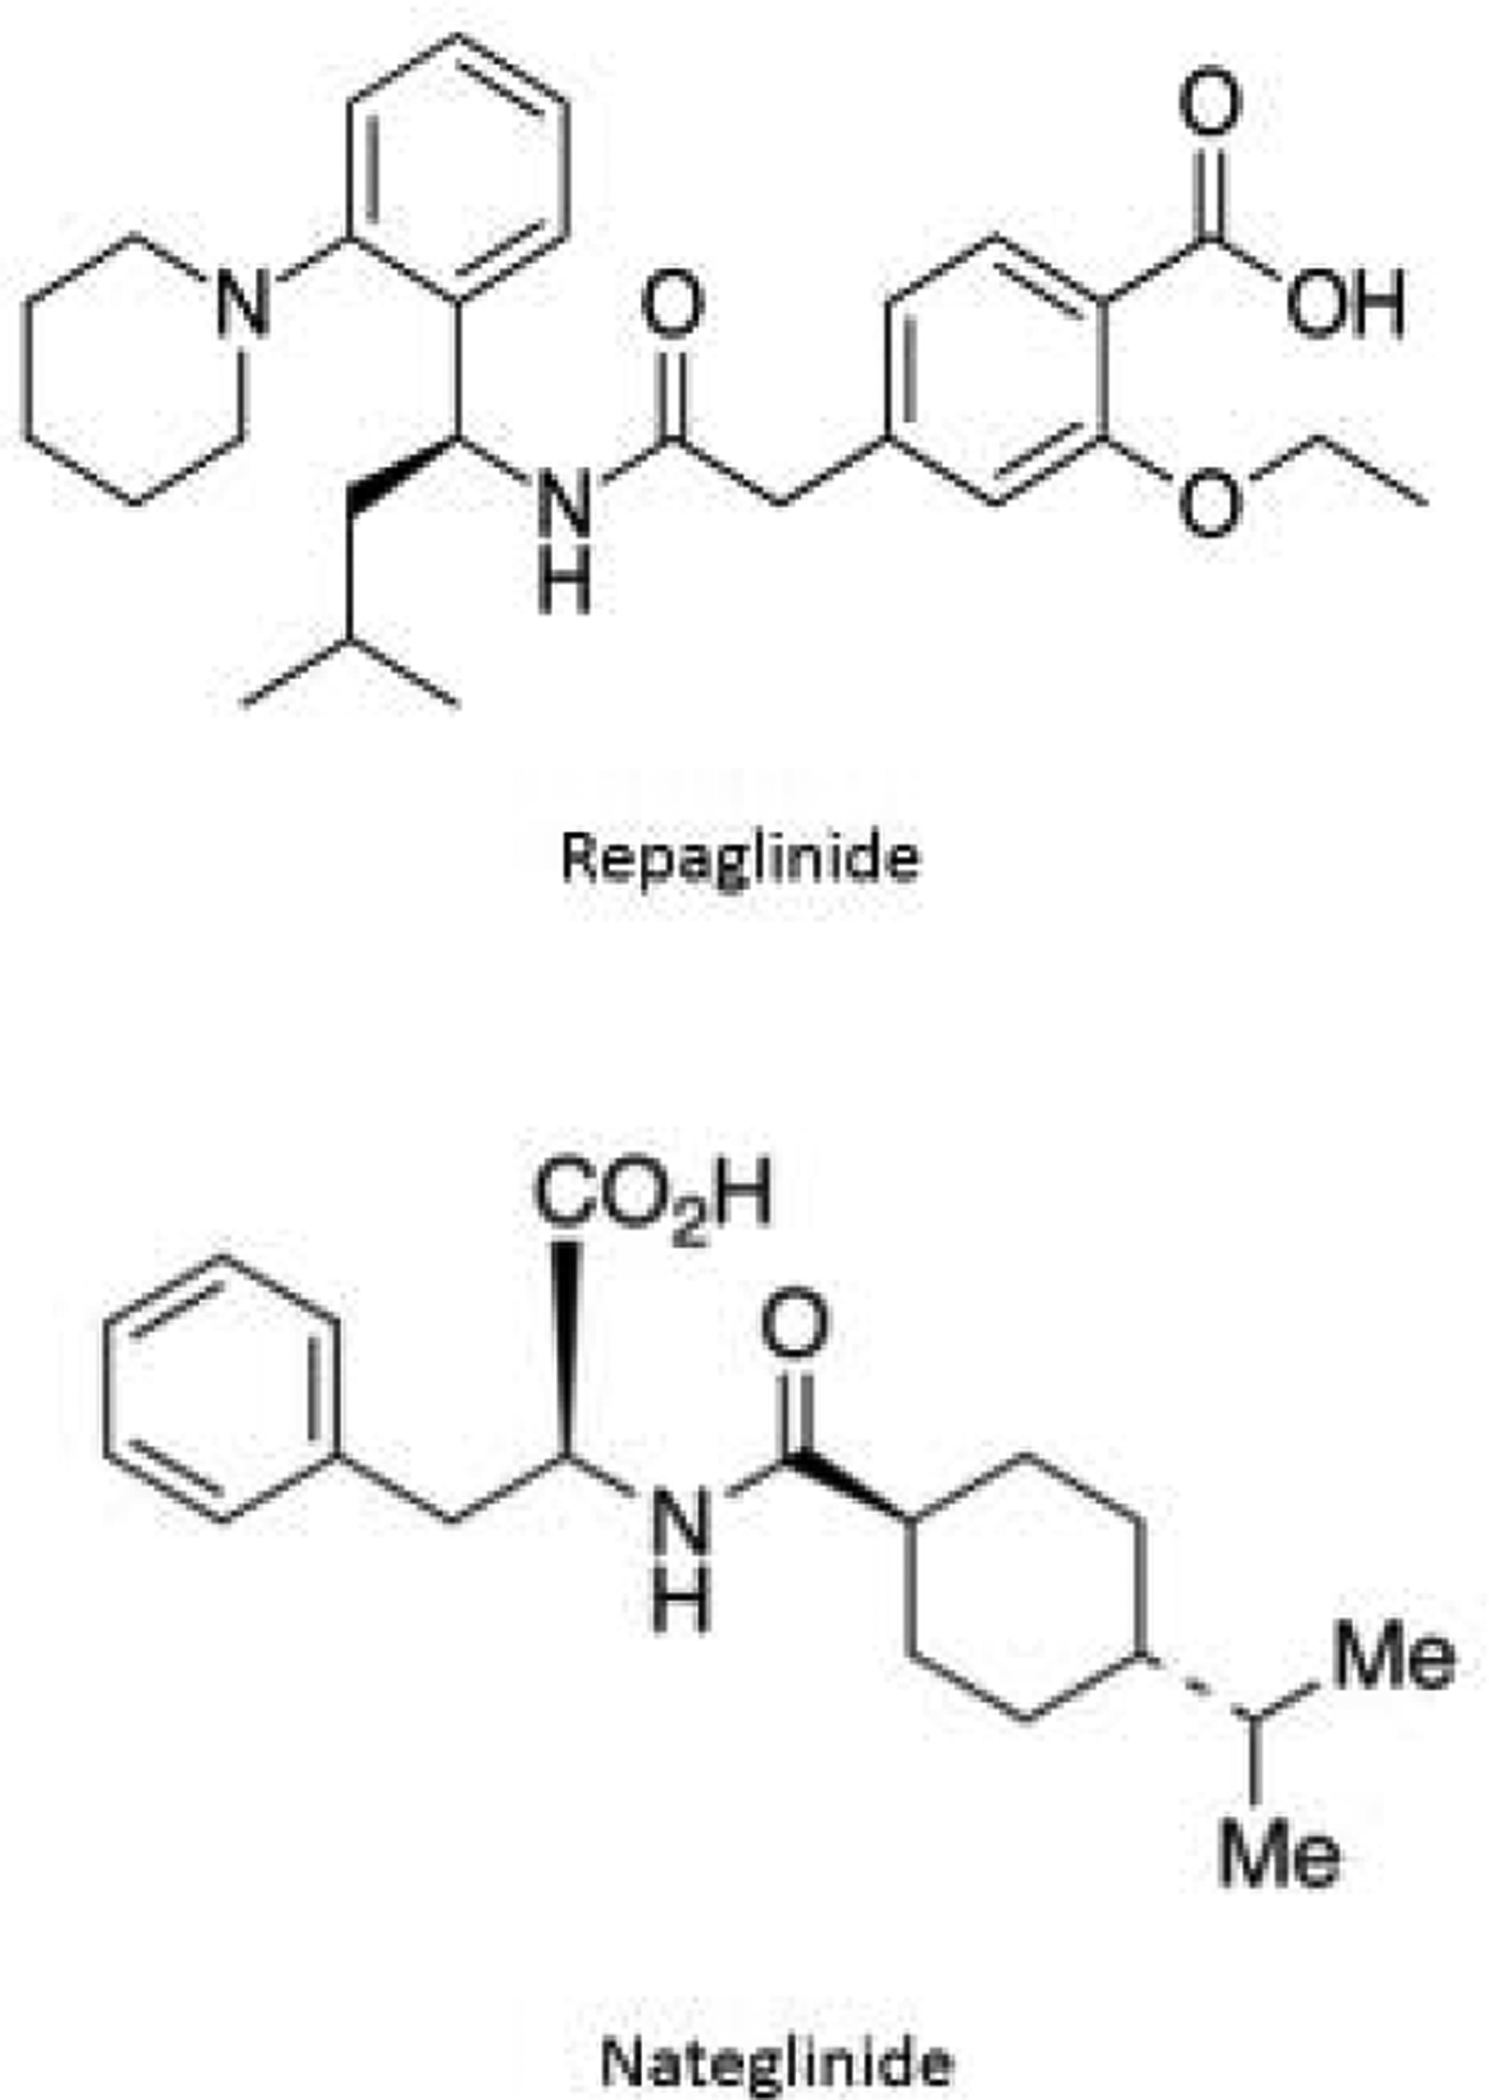
Structures of repaglinide and nateglinide.
High-performance affinity chromatography (HPAC) and affinity microcolumns (i.e., columns with volumes in the low- to the mid-microliter range) have been used in previous studies to examine the effects of modification by glucose on the binding by sulfonylureas with HSA [2,19]. This approach has also recently been shown to be useful in examining binding by sulfonylureas with Go- or MGo-modified HSA [10]. Advantages of this approach include its speed, good correlation with reference methods, high precision, and ability to use small amounts of a modified protein for many experiments [2,10,19]. These tools will be used in this current report to examine the site-specific binding of repaglinide and nateglinide with normal HSA and, for the first time, the binding of these drugs with HSA that has been modified with clinically-relevant levels of Go or MGo. The results should be valuable in indicating how binding by these drugs to HSA can be altered by Go- or MGo-related AGE formation during type II diabetes.
2. Experimental
2.1. Materials
The silica (pore size, 300 Å; particle size, 7 μm) was Nucleosil Si-300 from Macherey-Nagel (Duren, Germany). Repaglinide (≥ 99.5%) was obtained from Santa Cruz Biotech (Dallas, TX, USA). The L-tryptophan (≥ 98%), R-warfarin (≥ 97%), nateglinide (≥ 98%), HSA (fatty acid-free, ≥ 96%), MGo and Go were from Sigma-Aldrich (St. Louis, MO, USA). Water purified by a Milli-Q-Advantage A 10 system (EMD Millipore, Billerica, MA, USA) was used to make all aqueous mobile phases and solutions. Also, 0.20 μm GNWP nylon membranes (Fisher Scientific, Pittsburgh, PA, USA) were used to filter these aqueous solutions and mobile phases.
2.2. Apparatus
The HPLC system was from Jasco (Tokyo, Japan) and contained the following: a UV visible absorbance detector (UV-2080), a column oven (CO-2067), two pumps (PU-2080), an autosampler (AS-2057), and a degasser (DG-2080). A Rheodyne Advantage PF six-port valve (Cotati, CA, USA) was also used in this system. LCNet and ChromNav software from Jasco were used to control the HPLC system. Peak Fit 4.12 software from Jandel Scientific (San Rafael, CA, USA) was utilized to analyze the data from the chromatographic system. Data Fit 8.169 (Oakdale, PA, USA) was used to perform regression and to obtain best-fit parameters for the data.
2.3. Preparation of modified HSA and affinity microcolumns
The Go- and MGo-modified HSA were prepared as described in a recent report examining protein binding by sulfonylurea-class drugs [10] (see Supplementary Material for details). This was done by using sterile solutions that contained around 130 nM to 210 nM Go, or 40 nM to 120 nM MGo in pH 7.4, 0.067 M potassium phosphate buffer that were incubated at 37° C for 4 weeks with a physiological concentration of normal human serum albumin (42 g/L). The modified HSA samples that were prepared under these conditions will be referred to as GoHSA1, GoHSA2, MGoHSA1, and MGoHSA2, respectively. The levels of Go used to make GoHSA1 and GoHSA2 were representative of concentrations for this agent that are seen in serum for healthy adults or adults with type II diabetes, while the levels of MGo used in preparing MGoHSA1 and MGoHSA2 represented typical serum levels seen in healthy adults and individuals with pre-diabetes or type II diabetes [3,10]. These preparations of HSA were lyophilized and stored at −80 °C. The levels of lysine and arginine modification in these samples are provided in the Supplementary Material.
The normal HSA and samples of modified HSA were immobilized onto silica modified into a diol-bonded form by using the Schiff base technique [20,21]. A control column was also made that contained a support prepared in the same way but with no HSA or modified HSA being added. The protein content of each support was determined by a bicinchoninic acid protein assay using soluble, normal HSA as the standard and the control support as the blank [2]. The supports were determined by this method to have the following amounts of immobilized protein, in units of mg HSA/g silica: normal unmodified HSA, 51 (± 3); GoHSA1, 55 (± 2); GoHSA2, 69 (± 4); MGoHSA1, 51 (± 2); MGoHSA2, 65 (± 5). These supports were packed into separate 1.0 cm × 2.1 mm i.d. stainless steel microcolumns, with each containing 0.8–1.1 mg (12–16 nmol) HSA.
Each microcolumn was downward slurry packing at 4000 psi (28 MPa) using pH 7.4, 0.067 M potassium phosphate buffer as the packing solution. The packed microcolumns and the remaining supports were kept in the pH 7.4, 0.067 M phosphate buffer and stored at 4 °C until use. It is known from previous work that hundreds of sample applications or injections can be made on these or similar HSA supports and microcolumns [21,22]. Such columns, including those used in this current study, have been validated in prior work with other drugs (e.g., sulfonylureas) and found to provide binding results that are good agreement with those reported in the literature or obtained by other methods [2,10,11,20,22,23]. For the microcolumns used in this study, consistent results were obtained over more than 500 injection/sample application cycles, or the equivalent of < 1.6–2.2 μg (24–32 pmol) of HSA per assay.
2.4. Chromatographic conditions
All the drug and solute solutions in this study (i.e., containing repaglinide, nateglinide, R-warfarin, L-tryptophan, or sodium nitrate) were prepared in the mobile phase, which was pH 7.4, 0.067 M potassium phosphate buffer. These solutions were filtered and degassed for 10–20 min before use. The solutions of R-warfarin were used within four weeks of preparation, and the L-tryptophan solutions were prepared daily [11,22]. All chromatographic studies were done at 0.50 ml/min and 37°C. The backpressures of the microcolumns were typically 3.0 MPa (435 psi) or less under these conditions, as noted in prior studies with similar columns [12,21].
Zonal elution competition studies were carried out on the microcolumns by using R-warfarin and L-tryptophan as the injected probe compounds. These probes are known from previous studies with similar microcolumns to selectively bind at Sudlow sites I and II of HSA [9,20] and to have negligible non-specific binding to such microcolumns and supports under the conditions used in this study [20,22,23]. The mobile phase in these experiments contained up to seven concentrations of repaglinide or nateglinide in the range of 0–25 μM. The same solutions were used to make sample solutions containing 5 μM of the desired probe. A 20 μL injection volume was used, with six injections being made for each sample and mobile phase combination. Injections of the probe samples were made on both the HSA microcolumns and a control column to correct for any non-specific binding by the probes to the support (i.e., typically 1–2% of the total retention obtained on an HSA microcolumn). A sample containing 20 μM sodium nitrate was injected in the same manner to obtain the column void time and system void time. Sodium nitrate was monitored at 205 nm, while R-warfarin was detected at 308 nm and L-tryptophan was detected at 280 nm. A fit to an exponentially-modified Gaussian curve was used in PeakFit 4.12 to obtain the mean retention time of each peak.
3. Results and Discussion
3.1. General approach to site-specific binding studies
Zonal elution competition studies were employed to examine how the binding of repaglinide or nateglinide was altered at Sudlow sites I or II of HSA due to modification of this protein by Go or MGo. These experiments made use of site-specific probes for these regions, with the probes being injected in the presence of a mobile phase that contained a known concentration of the drug to be studied. Some typical chromatograms that were acquired (i.e., showing the shift in retention for the probe’s peak in the presence or absence of the competing drug in the mobile phase) are provided in the Supplementary Material. For each of the probes used in this study (i.e., R-warfarin and L-tryptophan), the elution of the probe peak occurred in 5 min or less at the given flow rate, column type, and set of mobile phase conditions that were present during this work.
If the injected probe and drug in the mobile phase have direct competition for binding sites on an immobilized protein, the retention factor (k) for the probe should decrease in a well-defined manner as the concentration of the drug in the mobile phase is increased [20,23]. If the drug (D) in the mobile phase and the injected probe (P) compete at a single type of site on the immobilized binding agent, this change in the retention factor for the probe is described by eq. (1) [20,24].
| (1) |
This situation should produce a linear plot of 1/k versus the drug’s molar concentration, [D] [20]. Other terms in eq. (1) include the column void volume (VM), the moles of the common binding site (mL), and the association equilibrium constants for the drug and the probe with the immobilized binding agent (i.e., Ka and KaP) [20,24]. The slope and intercept of this plot can be used to find the association equilibrium constant for the drug at the site that is binding to the probe. This local association equilibrium constant, as is represented by Ka, can be obtained from the ratio of the slope versus the intercept of the plot [20,24]. This value is independent of the moles of binding sites and is not be affected by specific or non-specific binding by the drug at other sites on the support or immobilized agent as long as the probe does not interact with these other sites [20,24].
3.2. Site-specific binding studies at Sudlow site II
The first set of studies examined binding at Sudlow site II of the normal and modified forms of HSA by using L-tryptophan as a site-selective probe for this region [9,20,22]. This site was of interest because it has previously been reported to be the major binding region for repaglinide on both HSA and BSA [15,17]. The retention factors acquired for L-tryptophan during these studies (see Supplementary Material) had precisions of ± 0.6–17.8% (average, ± 6.1%) in the work with repaglinide and ± 6.4–14.4% (average, ± 10.1%) in the studies with nateglinide.
Figure 2 shows some typical plots that were obtained when the retention data for L-tryptophan were analyzed according to eq. (1). The results showed good agreement with the linear response predicted for a system with direct competition at a single type of common binding site for the drug in the mobile phase and the injected probe [20]. The correlation coefficients of these plots ranged from 0.9851–0.9981 for repaglinide and 0.9566–0.9845 for nateglinide (n = 6). In addition, the residual plots for all these graphs gave only random variations in the data about the best-fit lines. These results indicated that repaglinide and nateglinide had direct interactions at Sudlow site II with both normal HSA and each of the forms of modified HSA that were tested.
Figure 2.
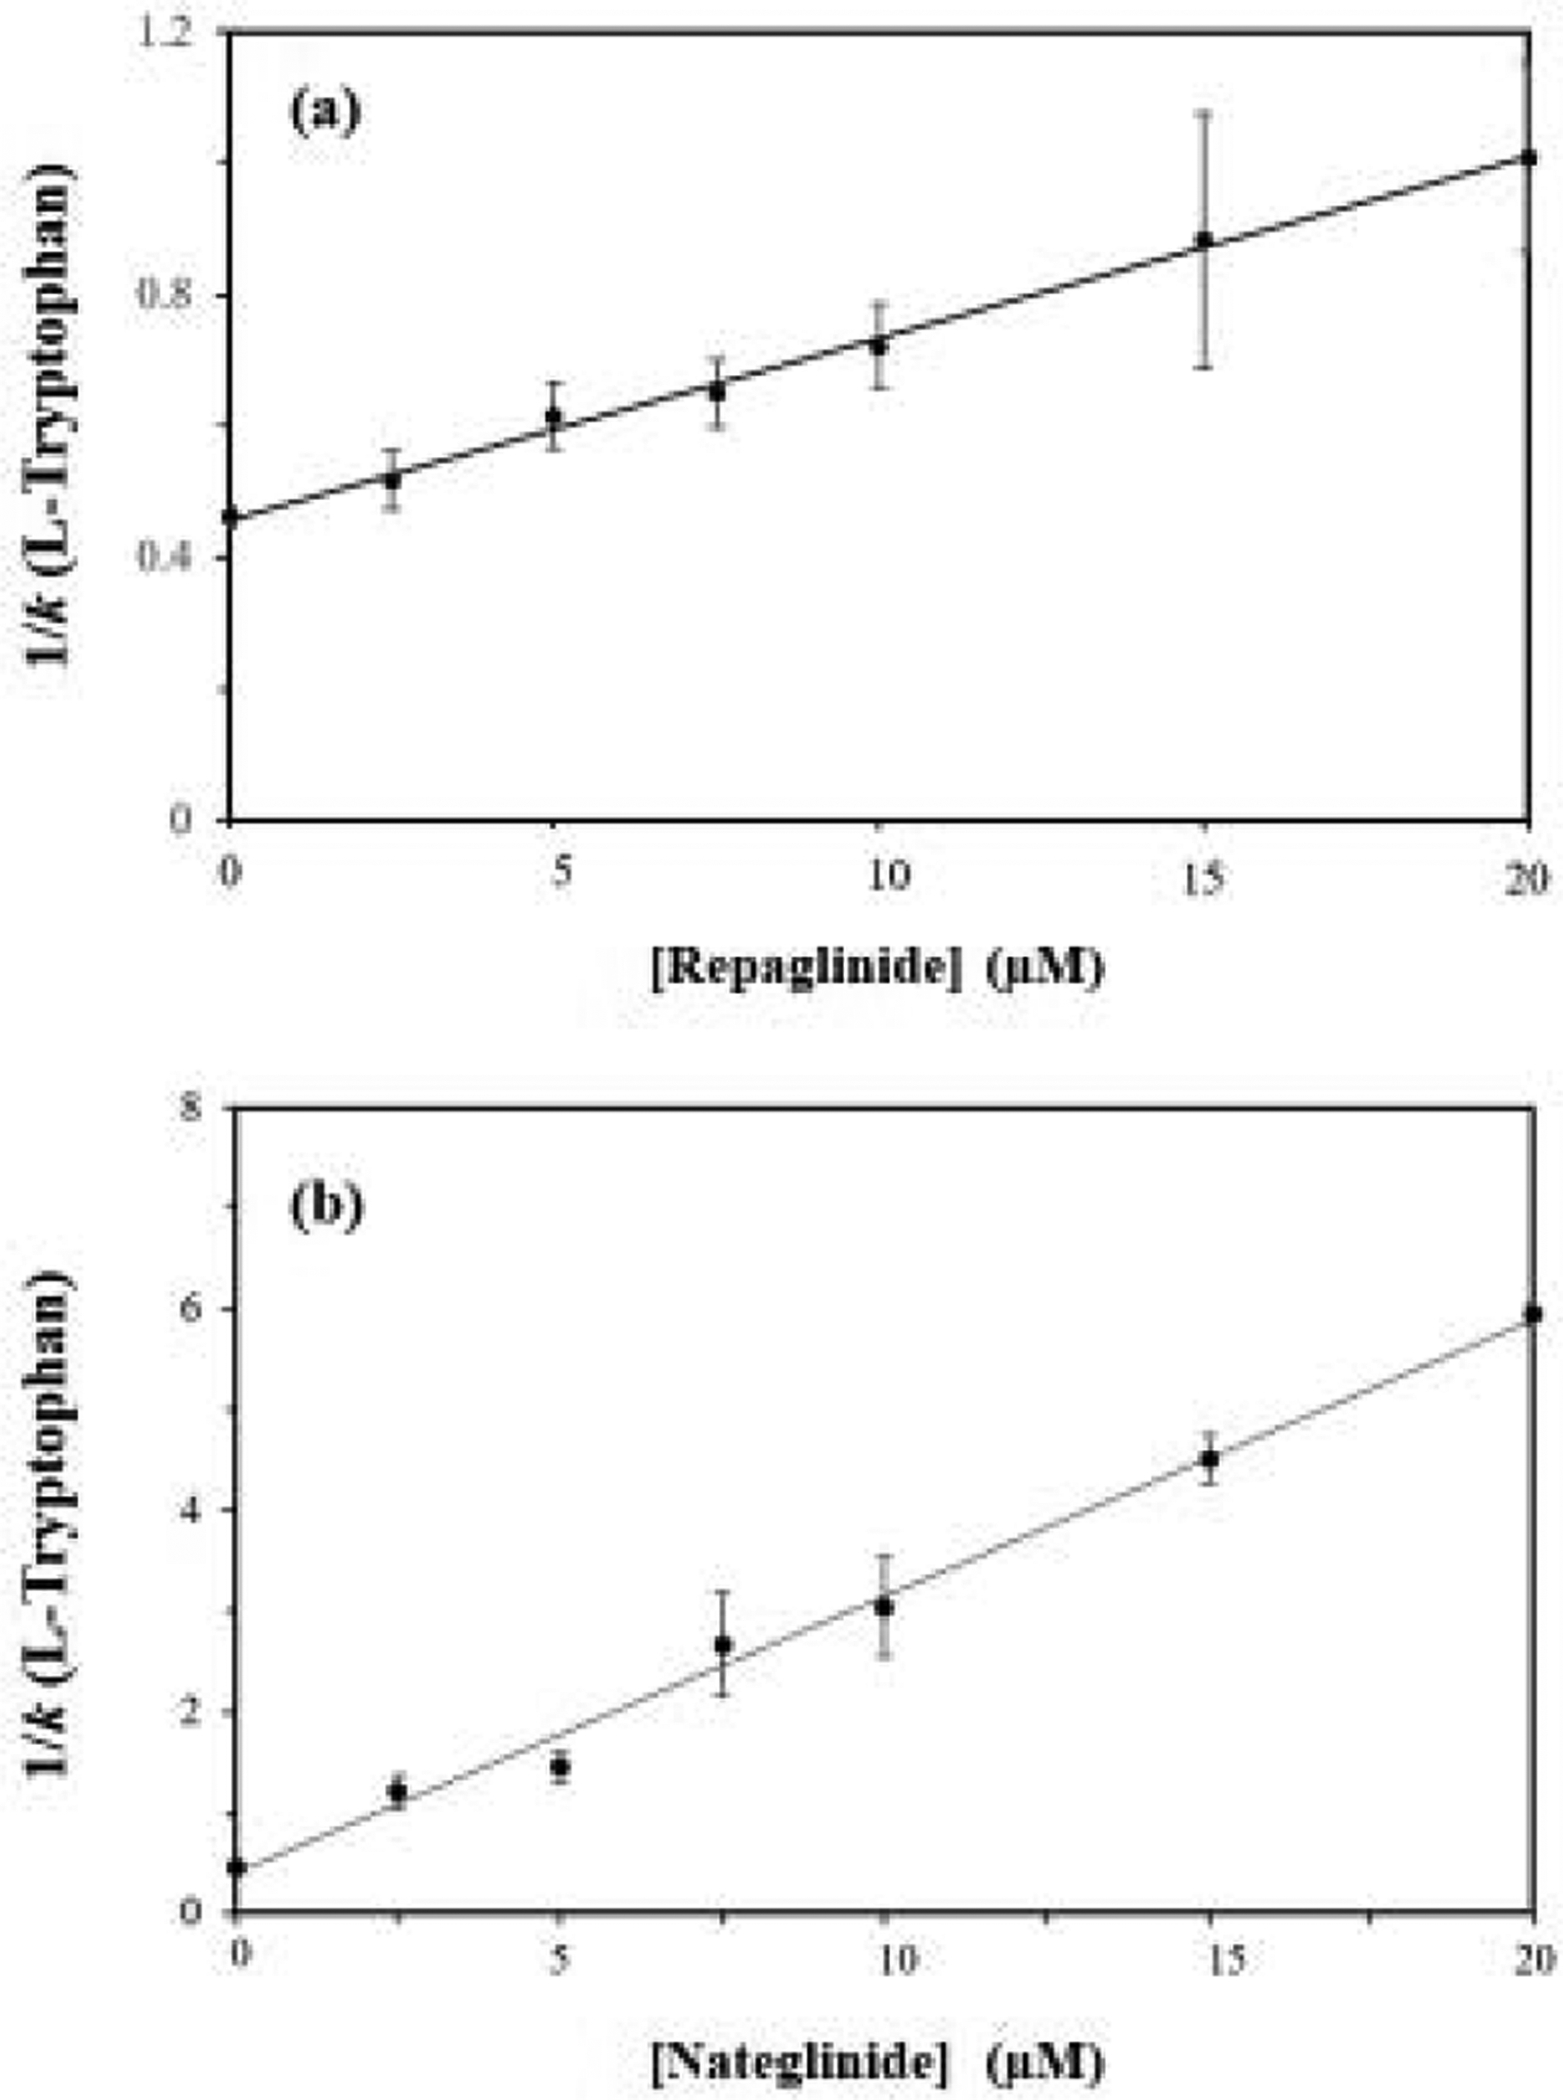
Plots made according to eq. (1) when using L-tryptophan as the injected probe and repaglinide or (b) nateglinide as a competing agent on microcolumns containing normal HSA. The correlation coefficients for these plots were 0.9978 and 0.9953, respectively (n = 7). The error bars represent a range of ± 1 S.D. The precisions of the y-values ranged from (a) ± 3.3–22.0% and (b) ± 1.85–19.5%.
The site-specific association equilibrium constants that were obtained for repaglinide and nateglinide at Sudlow site II are provided in Tables 1 and 2. These binding constants had precisions in the range of ± 3.3–19.0% (average, ± 9.9%) for repaglinide and ± 10.3–15.6% (average, ± 10.1%) for nateglinide. The association equilibrium constant measured at Sudlow site II on normal HSA for repaglinide at pH 7.4 and 37° C was 6.1 (± 0.2) × 104 M−1, with nateglinide have a 12-fold larger value of 7.1 (± 0.8) × 105 M−1 under the same conditions. The general range of these values was consistent with previous overall binding constants reported for these drugs with HSA or BSA [15–17], as well as with preliminary estimates that were obtained for repaglinide with normal HSA by frontal analysis (see Supplementary Material).
Table 1.
Site-specific association equilibrium constants (Ka) measured for repaglinide at Sudlow sites I and II of normal or modified HSAa
| Type of HAS | Sudlow site I Ka (M−1) | Change vs. Normal HSA | Sudlow site II Ka (M−1)c | Change vs. Normal HSA |
|---|---|---|---|---|
| Normal HSA | 4.2 (± 0.3) × 104 | ------ | 6.1 (± 0.2) × 104 | ------ |
| GoHSA1 | 5.4 (± 0.5) × 104 | ↑ 1.29-fold | 1.4 (± 0.1) × 105 | ↑ 2.30-fold |
| GoHSA2 | 7.2 (± 0.3) × 104 | ↑ 1.71-fold | 2.1 (± 0.4) × 105 | ↑ 3.44-fold |
| MGoHSA1 | 3.8 (± 0.4) × 104 | ↓ 9.5% (N.S.)b | 1.8 (± 0.2) × 105 | ↑ 2.95-fold |
| MGoHSA2 | 3.4 (± 0.4) × 104 | ↓ 19% | 2.2 (± 0.2) × 105 | ↑ 3.61-fold |
These results were measured at 37 °C in pH 7.4, 0.067 M potassium phosphate buffer. The values in parentheses represent a range of ± 1 S. D. Except were indicated otherwise, all changes shown for modified HSA vs. normal HSA were significant at the 95% confidence level based on the Student’s t-test.
The result for MGoHSA1 at Sudlow site I was not significantly different (N.S.) from normal HSA at the 95% confidence level but was significantly different at the 90% confidence level.
The listed result for normal HSA is consistent with values obtained for several columns and batches of silica that contained this immobilized binding agent.
Table 2.
Site-specific association equilibrium constants (Ka) measured for nateglinide at Sudlow sites I and II of normal or modified HSAa
| Type of HSA | Sudlow site I Ka (M−1) | Change vs. Normal HSA | Sudlow site II Ka (M−1) | Change vs. Normal HSA |
|---|---|---|---|---|
| Normal HSA | 5.0 (± 0.1) × 104 | ------ | 7.1 (± 0.8) × 105 | ------ |
| GoHSA1 | 4.6 (± 0.2) × 104 | ↓ 8% | 3.9 (± 0.4) × 105 | ↓ 45% |
| GoHSA2 | 5.0 (± 0.2) × 104 | No change | 3.2 (± 0.5) × 105 | ↓ 55% |
| MGoHSA1 | 5.2 (± 0.4) × 104 | ↑ 1.04-fold (N.S.)b | 6.7 (± 1.0) × 105 | ↓ 6% (N.S.)b |
| MGoHSA2 | 5.4 (± 0.4) × 104 | ↑ 1.08-fold | 3.8 (± 0.3) × 105 | ↓ 46% |
These results were measured at 37 °C in pH 7.4, 0.067 M potassium phosphate buffer. The values in parentheses represent a range of ± 1 S.D. Except were indicated otherwise, all changes shown for modified HSA vs. normal HSA were significant at the 95% confidence level based on the Student’s t-test.
The differences between MGoHSA1 and normal HSA at Sudlow sites I and II were not significant (N.S.) at the 95% or 90% confidence levels.
The binding at Sudlow site II by both repaglinide and nateglinide was affected by the modification of HSA with Go or MGo. The Ka values for repaglinide at this site increased by 2.30- to 3.44-fold for the Go-modified samples of HSA but decreased by 45–55% for nateglinide, with all these changes vs normal HSA being significant at the 95% confidence level. For the MGo-modified samples of HSA, repaglinide gave an increase in binding strength of 2.95- to 3.61-fold that was significant at the 95% confidence level. Nateglinide showed either no significant change in binding (MGoHSA1) or a decrease in binding strength (46% for MGoHSA2, which was significant at the 95% confidence level). The fact that changes in binding strength were seen for both of the tested drugs at this site was consistent with the fact that several residues near Sudlow site II are known to be modified by MGo or Go, including R410, K439, K525 [4,25]. The dissimilar directions/magnitudes of these changes for repaglinide and nateglinide indicated that pharmaceuticals even in the same class may be affected quite differently by such modifications.
3.3. Site-specific binding studies at Sudlow site I
Prior results from the literature have suggested repaglinide may interact at or with Sudlow I of HSA [17]. The presence of multiple binding sites for nateglinide with HSA has also been suggested previously [18]. Preliminary work that was conducted by using frontal analysis (see Supplementary Material) confirmed that repaglinide had two moderate-to-high affinity regions on HSA [17] (i.e., Sudlow site II, as shown in the previous section, plus one other region).
The location of this additional, moderate-to-high affinity region was explored by next examining interactions by repaglinide and nateglinide at Sudlow site I of HSA. This region is known to be a major binding site of HSA for many classes of drugs, including sulfonylurea-based anti-diabetics [9,22,23]. Binding at this site was investigated by using R-warfarin as the injected probe [9,22]. The retention factors that were obtained for this probe are provided in Supplementary Material and had precisions of ± 0.10–12.9% (average, ± 6.0%) in the studies with repaglinide and ± 0.1–1.3% (average, ± 0.56%) in the work with nateglinide.
Some typical plots that were acquired in these competition studies are provided in Figure 3. These plots showed good agreement with eq. (1) and a linear response, giving correlation coefficients of 0.9745 to 0.9971 for repaglinide and 0.9813–0.9987 for nateglinide (n = 6). The corresponding residual plots had only random variations in the data about the best-fit lines. It was determined from these plots that repaglinide and nateglinide did have direct interactions at Sudlow site I for normal HSA and for the forms of modified HSA that were examined.
Figure 3.
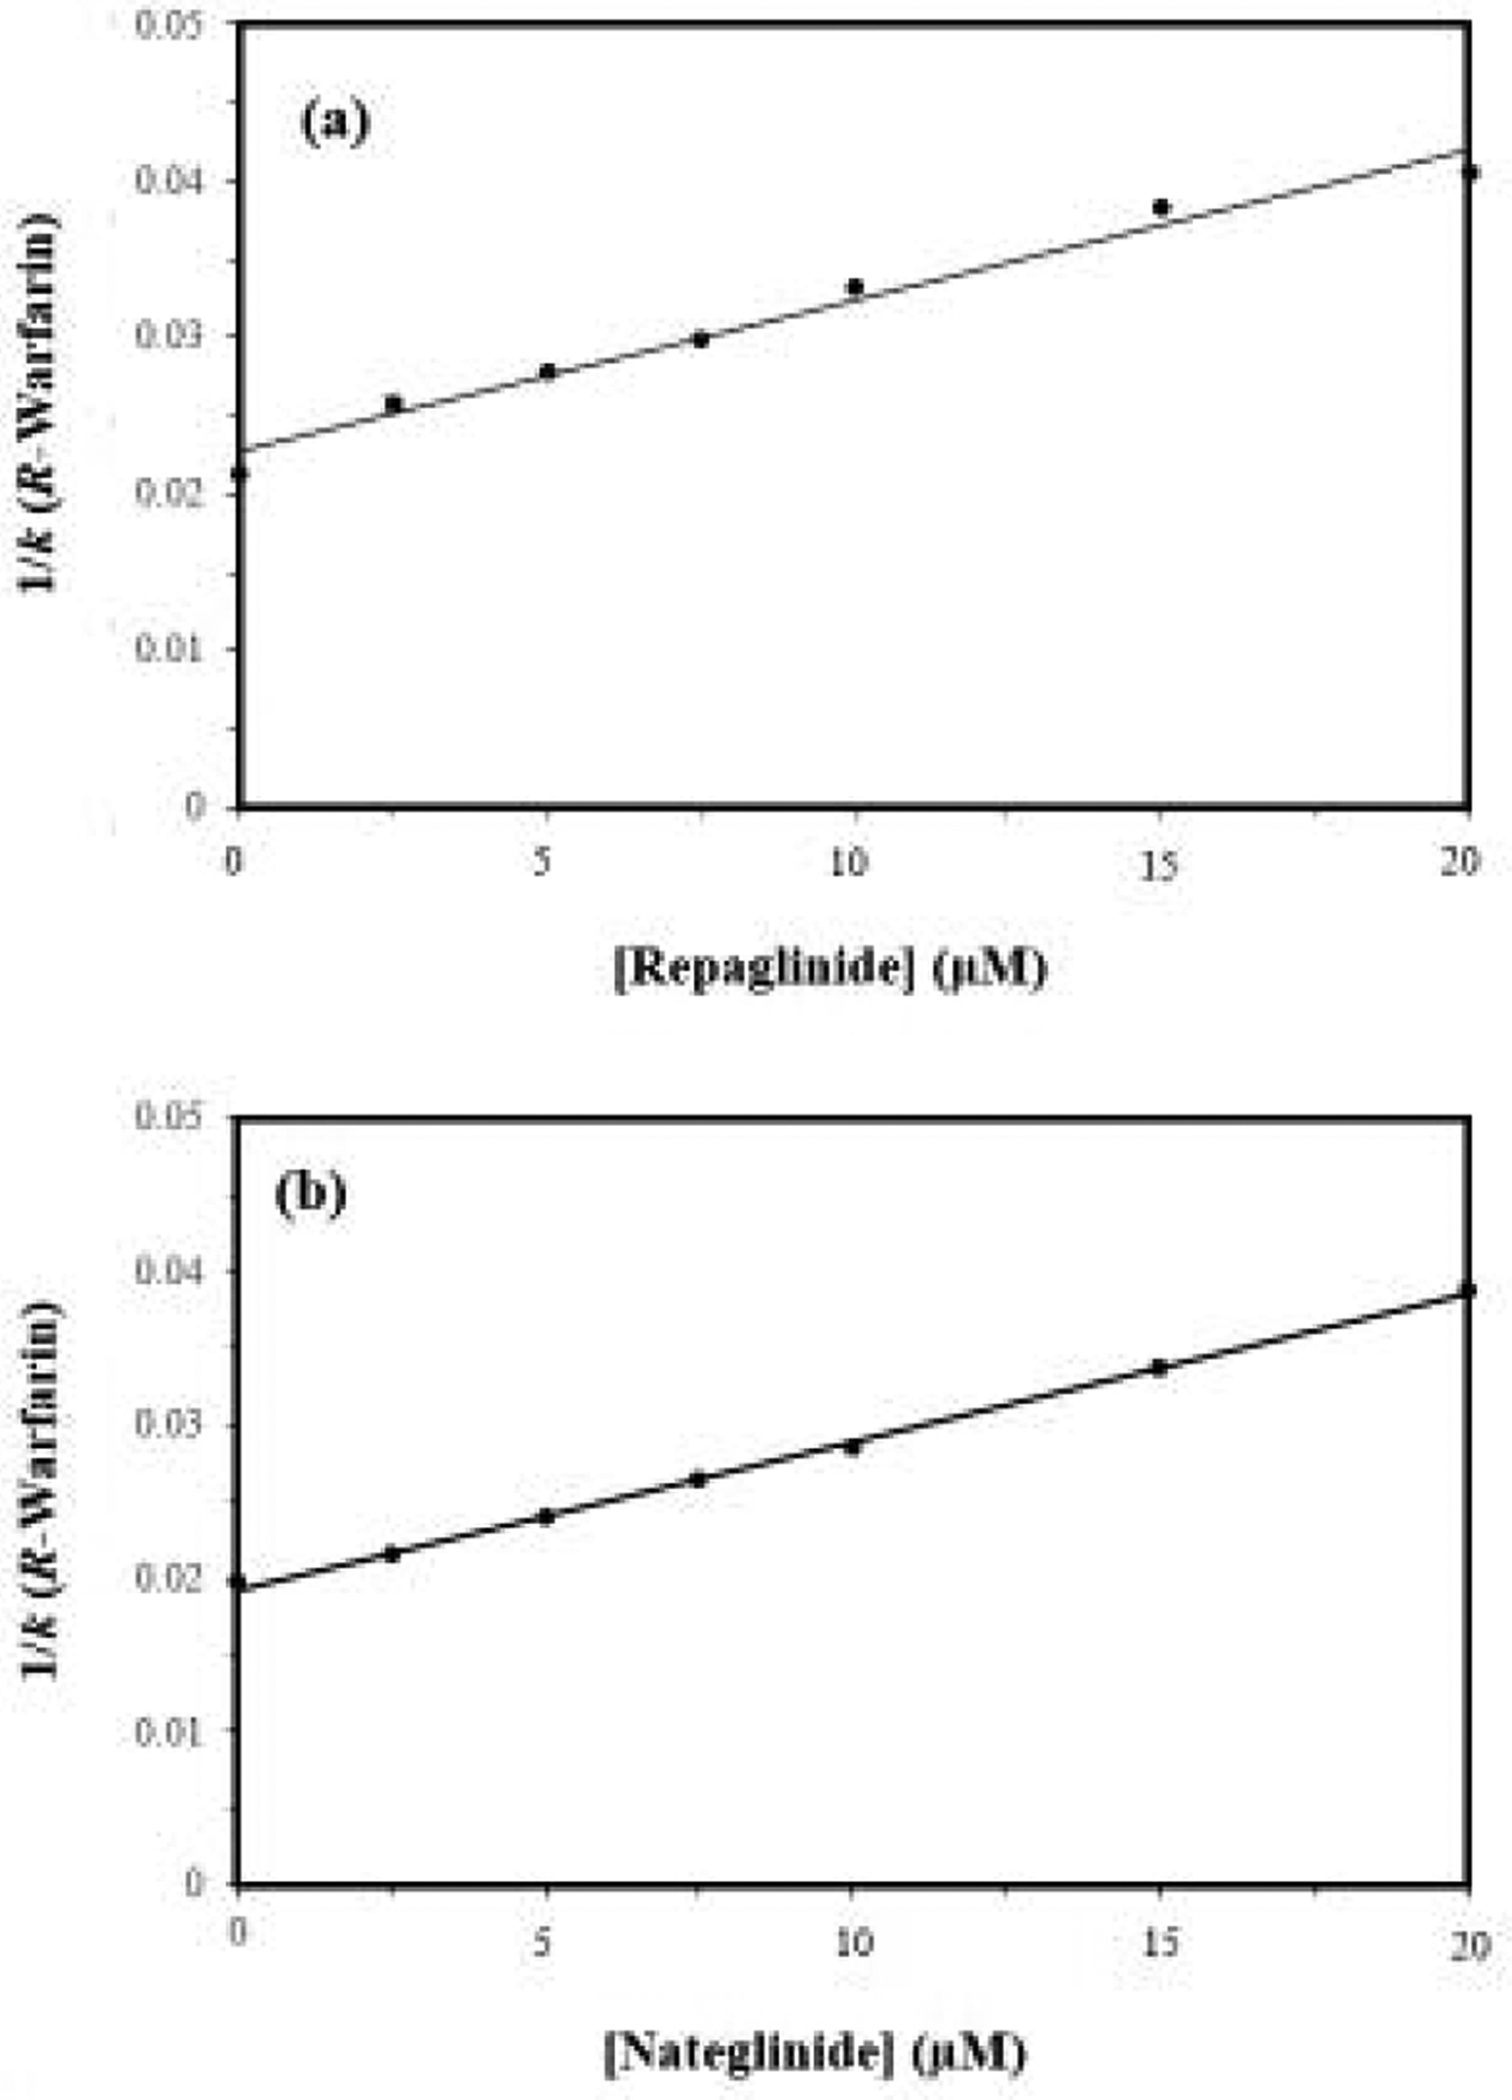
Plots made according to eq. (1) when using R-warfarin as the injected probe and (a) repaglinide or (b) nateglinide as the competing agent on microcolumns containing normal HSA. The correlation coefficients for these plots were 0.9882 and 0.9983, respectively (n = 7). The error bars represent a range of ± 1 S.D. and are often comparable in size to the markers shown in these plots. The precisions of the y-values ranged from (a) ± 0.0–4.2% and (b) ± 0.1–1.3%.
The site-specific binding constants that were estimated for repaglinide and nateglinide at Sudlow site I of HSA are included in Tables 1 and 2. These values had precisions of ± 7.1–11.7% (average, ± 8.9%) for repaglinide and ± 2.0–7.4% (average, ± 5.1%) for nateglinide. The Ka values that were determined for repaglinide and nateglinide at Sudlow site I of normal HSA were 4.2 (± 0.3) × 104 M−1 and 5.0 (± 0.1) × 104 M−1 at pH 7.4 and 37 °C. These values were 1.5- to 14-fold lower than the site-specific Ka values shown in Table 2 for the same drugs at Sudlow site II, but still represented moderate-to-strong interactions with HSA. The results for nateglinide were consistent with the biphasic binding that has been observed in a previous report that examined the overall interactions of this drug with HSA [18]. The fact that similar binding constants for repaglinide were obtained at Sudlow sites I and II of normal HSA suggests these two sites may have been measured together in another prior study that employed a single-site model to describe the overall binding of repaglinide with BSA [15].
The site-specific association equilibrium constants for repaglinide and nateglinide at Sudlow site I were next compared for the normal HSA and modified forms of HSA. For repaglinide, the Go-modified HSA samples had an increase of 1.29- to 1.71-fold (an increase significant at the 95% confidence level); however, nateglinide only had a small decrease (8% for GoHSA1) or no significant change in binding (GoHSA2) at Sudlow site I for the same modified samples. The MGo-modified HSA samples showed a small decrease of up to 19% in Ka at Sudlow site I for repaglinide and no significant change (MGoHSA1) or only a small increase (1.08-fold with MGoHSA2) for nateglinide when compared to normal HSA. The changes in binding constant vs normal HSA that were noted for repaglinide probably reflect the formation of AGEs by Go or MGo at residues at or near Sudlow site I, such as have been observed to occur at R128, R197, K199, and K276 [4,25]. The small or negligible changes seen for nateglinide with the same samples again demonstrates how even drugs in the same class may differ in how such modifications affect their interactions at specific sites on HSA.
4. Conclusion
HPAC and affinity microcolumns were used to examine the binding by repaglinide and nateglinide to normal HSA and Go- or MGo-modified HSA. The good stability and small size of these microcolumns made it possible to quickly conduct (i.e., 5 min or less per injection) many binding studies that required only a small amount of protein (i.e., 24–32 pmol HSA/modified HSA per study over 500 experiments). The good precision of this approach further made it possible to detect even relatively small changes in binding at specific regions on HSA as this protein was modified with clinically-relative levels of Go or MGo.
It was determined in this work that repaglinide and nateglinide both had their strongest binding at Sudlow site II for the normal and modified forms of HSA. The binding constants at this site agreed with previous estimates made for the overall binding constants and/or binding levels of these drugs with HSA or BSA [15–18]. However, it was also found that repaglinide and nateglinide had weaker but still moderate-to-strong interactions at Sudlow site I. In addition, it was found that the modification of HSA by Go or MGo resulted in a significant increase in the binding strength for repaglinide (2.3- to 3.6-fold) and a decrease for nateglinide (up to 45–55%) at Sudlow site II. The samples of Go-modified HSA gave a 1.3- to 1.7-fold increase in affinity at Sudlow site I for repaglinide and no change or only a small decrease (8%) for nateglinide. The MGo-modified HSA gave a non-significant change or only a small decrease (19%, repaglinide) or increase (1.08-fold, nateglinide) in affinity at Sudlow site I.
These results indicate that modifications of HSA by agents such as Go and MGo can lead to a large change in binding for drugs such as repaglinide and nateglinide at Sudlow sites I or II. These effects are thought to be a result of the modification by Go and MGo of residues on HSA that are at or near these binding regions [4,23,25]. These results also show that the size of these changes in binding may differ in both their direction and magnitude for drugs within the same class. These changes are of great potential importance as they may alter the corresponding non-bound fraction of a drug, thereby affecting the drug’s bioavailability and effective dosage in a patient [4,21,23]. The same methods as employed in this work can be extended in the future to related drugs (e.g., mitiglinide) and to further examine how changes in drug structure vs protein modification may affect the interactions of these compounds at specific regions of HSA. As shown in this report, such work can provide valuable information on the binding of drugs in the circulation during a given disease state, as may be used in the future to help improve treatments based on this medications for personalized medicine [2,10,20,24].
Supplementary Material
Acknowledgments
This work was funded by the National Institutes of Health under grant R01 DK069629.
Footnotes
Publisher's Disclaimer: This is a PDF file of an unedited manuscript that has been accepted for publication. As a service to our customers we are providing this early version of the manuscript. The manuscript will undergo copyediting, typesetting, and review of the resulting proof before it is published in its final form. Please note that during the production process errors may be discovered which could affect the content, and all legal disclaimers that apply to the journal pertain.
Declaration of Interest Statement
The authors have no conflicts of interest to declare.
References
- [1].Centers for Disease Control and Prevention, National Diabetes Statistics Report - 2020, Centers for Disease Control and Prevention, Atlanta. [Google Scholar]
- [2].Anguizola J, Joseph KS, Barnaby OS, Matsuda R, Alvarado G, Clarke W, Cerny RL, Hage DS, Development of affinity microcolumns for drug-protein binding studies in personalized medicine: interactions of sulfonylurea drugs with in vivo glycated human serum albumin, Anal. Chem 85 (2013) 4453–4460. [DOI] [PMC free article] [PubMed] [Google Scholar]
- [3].Dhananjayan K, Irrgang F, Raju R, Harman DG, Moran C, Srikanth V, Munch G, Determination of glyoxal and methylglyoxal in serum by UHPLC coupled with fluorescence detection, Anal. Biochem 573 (2019) 51–66. [DOI] [PubMed] [Google Scholar]
- [4].Anguizola J, Matsuda R, Barnaby OS, Hoy KS, Wa C, DeBolt E, Koke M, Hage DS, Review: glycation of human serum albumin, Clin. Chim. Acta 425 (2013) 64–76. [DOI] [PMC free article] [PubMed] [Google Scholar]
- [5].Chen HJC, Chen YC, Hsiao CF, Chen PF, Mass Spectrometric analysis of glyoxal and methylglyoxal induced modifications in human hemoglobin from poorly controlled type 2 diabetes mellitus patients, Chem. Res. Toxicol 28 (2015) 2377–2389. [DOI] [PubMed] [Google Scholar]
- [6].Singh R, Barden A, Mori T, Beilin L, Advanced glycation end-products: a review, Diabetologia 44 (2001)129–146. [DOI] [PubMed] [Google Scholar]
- [7].Han Y, Randell E, Vasdev S, Grill V, Gadag V, Newhook LA, Grant M, Hagerty D, Plasma methylglyoxal and glyoxal are elevated and related to early membrane alteration in young, complication-free patients with type 1 diabetes, Mol. Cell. Biochem 305 (2007)123–131. [DOI] [PubMed] [Google Scholar]
- [8].Voziyan P, Brown KL, Chetyvkin S, Hudson B, Site-specific AGE modification in the ECM; a role for glyoxal in protein damage in diabetes, Clin. Chem. Lab. Med 52 (2014)39–45. [DOI] [PMC free article] [PubMed] [Google Scholar]
- [9].Peters T Jr., All About Albumin: Biochemistry, Genetics and Medical Applications, Academic Press, San Diego, 1996. [Google Scholar]
- [10].Rodriguez EL, Tao P, Woolfork AG, Li Z, Matsuda R, Sun Z, Hage DS, Studies of binding by sulfonylureas with glyoxal- and methylglyoxal-modified albumin by immunoextraction using affinity microcolumns, J. Chromatogr. A 1638 (2021) 461683. [DOI] [PMC free article] [PubMed] [Google Scholar]
- [11].Joseph KS, Hage DS, Characterization of the binding of sulfonylurea drugs to HSA by high-performance affinity chromatography, J. Chromatogr. B 878 (2010) 1590–1598. [DOI] [PMC free article] [PubMed] [Google Scholar]
- [12].Matsuda R, Jobe D, Beyersdorf J, Hage DS, Analysis of drug-protein binding using online immunoextraction and high-performance affinity microcolumns: studies with normal and glycated human serum albumin, J. Chromatogr. A 1416 (2015) 112–120. [DOI] [PMC free article] [PubMed] [Google Scholar]
- [13].Culy CR, Jarvis B, Repaglinide: a review of its therapeutic use in type 2 diabetes mellitus, Drugs 61 (2001) 1625–1660. [DOI] [PubMed] [Google Scholar]
- [14].Rosenstock J, Hassman DR, Madder RD, Brazinsky SA, Farrell J, Khutorgansky N, Hale PM, Repaglinide versus nateglinide monotherapy, Diabetes Care 27 (2004) 1265–1270. [DOI] [PubMed] [Google Scholar]
- [15].Pawar SK, Jaldappagari S, Interaction of repaglinide with bovine serum albumin: spectroscopic and molecular docking approaches, J. Pharm. Anal 9 (2019) 274–283. [DOI] [PMC free article] [PubMed] [Google Scholar]
- [16].Chen Y, The interaction of nateglinide with bovine serum albumin, Fenxi Shiyanshi 34 (2015) 1121. [Google Scholar]
- [17].Seedher N, Kanojia M, Reversible binding of antidiabetic drugs, repaglinide and gliclazide, with human serum albumin, Chem. Biol. Drug Des 72 (2008) 290–296. [DOI] [PubMed] [Google Scholar]
- [18].Maddi S, Scriba G, Yamsani MR, Stereoselective binding of chiral anti-diabetic drug nateglinide to plasma proteins, Drug Metab. Drug Interact 26 (2011) 81–86. [DOI] [PubMed] [Google Scholar]
- [19].Zheng X, Li Z, Beeram S, Podariu M, Matsuda R, Pfaunmiller EL, White II CJ, Carter N, Hage DS, Analysis of biomolecular interactions using affinity microcolumns: a review, J. Chromatogr. B 968 (2014) 49–63. [DOI] [PMC free article] [PubMed] [Google Scholar]
- [20].Matsuda R, Li Z, Zheng X, Hage DS, Analysis of multi-site drug-protein interactions by high-performance affinity chromatography: binding by glimepiride to normal or glycated human serum albumin, J. Chromatogr. A 1408 (2015) 133–144. [DOI] [PMC free article] [PubMed] [Google Scholar]
- [21].Beeram SR, Zheng X, Suh K, Hage DS, Characterization of solution-phase drug-protein interactions by ultrafast affinity extraction, Methods 146 (2018) 46–57. [DOI] [PMC free article] [PubMed] [Google Scholar]
- [22].Joseph KS, Hage DS, The effects of glycation on the binding of human serum albumin to warfarin and L-tryptophan, J. Pharm. Biomed. Anal 53 (2010) 811–818. [DOI] [PMC free article] [PubMed] [Google Scholar]
- [23].Li Z, Beeram SR, Bi C, Suresh D, Zheng X, Hage DS, High-performance affinity chromatography: applications in drug-protein binding studies and personalized medicine, Adv. Prot. Chem. Struct. Biol 102 (2016) 1–39. [DOI] [PubMed] [Google Scholar]
- [24].Joseph KS, Anguizola J, Hage DS, Binding of tolbutamide to glycated human serum albumin, J. Pharm. Biomed. Anal 54 (2011) 426–432. [DOI] [PMC free article] [PubMed] [Google Scholar]
- [25].Barnaby OS, Cerny RL, Clarke W, Hage DS, Comparison of modification sites formed on human serum albumin at various stages of glycation, Clin. Chim. Acta 412 (2011) 277–285. [DOI] [PMC free article] [PubMed] [Google Scholar]
Associated Data
This section collects any data citations, data availability statements, or supplementary materials included in this article.