

Abstract
Purpose:
To characterize optical coherence tomography angiography (OCT-A) macular superficial capillary plexus (SCP) and projection resolved deep capillary plexus (DCP) vessel densities and compare their diagnostic accuracies with ganglion cell complex (GCC) thickness in healthy, glaucoma suspect and glaucoma eyes.
Methods:
Sixty-eight eyes of 44 healthy subjects, 26 eyes of 16 pre-perimetric glaucoma suspects, and 161 eyes of 124 glaucoma patients from the Diagnostics Innovations in Glaucoma Study with good quality high-density (HD) 6x6 mm2 macula OCT-A images were included. The diagnostic accuracy of SCP vessel density, projection resolved DCP vessel density and GCC thickness were compared among groups.
Results:
Mean whole image vessel density (wiVD; % of area occupied by vessels containing flowing blood) in the SCP layer was highest in healthy eyes (49.7%), followed by glaucoma suspect eyes (46.0%), and glaucoma eyes (40.9%) (p < 0.001). Mean wiVD in the DCP layer was similar in healthy (50.6%), glaucoma suspect (47.3%), and glaucoma eyes (45.7%) (p=0.925). Diagnostic accuracy of both GCC thickness and SCP wiVD was significantly higher than DCP wiVD for classifying healthy and glaucoma eyes (Adjusted AUC (95% CI): GCC= 0.86 (0.72,0.94), SCP = 0.80 (0.66, 0.91) and DCP = 0.44 [0.30, 0.57]) (p < 0.001).
Conclusions:
SCP vessel densities have better diagnostic accuracy for detecting glaucoma than DCP vessel densities. Although the diagnostic accuracy of the macula SCP is relatively modest, it is more informative than the DCP.
Keywords: Glaucoma, Superficial capillary plexus, Deep capillary plexus, OCT-A
Précis
Macular superficial capillary plexus vessel density is more informative than deep capillary plexus vessel density for the detection of glaucoma.
INTRODUCTION
Glaucoma is a multifactorial optic neuropathy1 characterized by the loss of retinal ganglion cells (RGC) 2, leading to narrowing of the neuroretinal rim, excavation of the optic nerve head (ONH), and structural damage to the inner retina.3 About half of these RGCs are located within the center of the macula4-11 Although the pathophysiology of glaucoma remains undetermined, it is hypothesized that vascular factors have a significant role in its pathogenesis.2,12,13
Optical Coherence Tomography Angiography (OCT-A) is a non-invasive imaging technology that facilitates the visualization of retinal microvasculature using the dynamic motion of red blood cells.14-17 OCT-A has been used to investigate vessel density measurements defined as the percentage of area occupied by vessels containing measurable flowing blood. Recent studies involving glaucoma patients have shown that vessel density has similar diagnostic accuracy and is strongly correlated with retinal nerve fiber layer (RNFL) thickness measurements.18,19 It has also been demonstrated that vessel density is significantly correlated with the severity of visual field (VF) damage defined by VF mean deviation (MD).20,21 Furthermore, OCT-A reportedly can detect retinal microvasculature dropout in eyes with no detectable VF damage.22,23 Macula and ONH vessel density measurements are also lower in eyes with focal LC defects.24,25
OCT-A has effectively been used to non-invasively visualize the different capillary layers in the perifoveal retina, leading to a better understanding of their connectivity, structure, and function,26-30 which has not previously been feasible without a histological approach.31,32 Macular superficial capillary plexus vessel density (SCPVD) measurements are commonly assessed and visualized using OCT-A. SCPVD has been shown to decrease in patients with glaucoma.22,23,33,34 Furthermore, SCPVD reportedly is positively correlated with retinal thickness.35 Few OCT-A studies have focused on DCPVD measurements in glaucoma, in part due to the presence of projection artifacts, which arise from superficial retinal vessels and reflect in deeper layers. Fortunately, there are now automated methods for projection artifact removal that facilitate the assessment of the deeper layers by removing most of the SCP flow projections while maintaining the DCP density.27,36-38
The SCP, which includes vasculature from the RNFL and GCL and consists of ILM and IPL, freely interrelates with the deep capillary plexus (DCP), which comprises the inner nuclear (INL) and outer plexiform (OPL) layers, resulting in a complex vascular network of the macula38 that often is affected in glaucoma patients. It is therefore important to investigate the deeper retinal changes in glaucoma, as RGC dendrites form synapses to the different glial cells located in the INL, which in turn connect to the cell bodies of the photoreceptors in the outer nuclear layer (ONL) and OPL. Moreover, these neurons can directly or indirectly affect other synapsed neurons by retrograde or anterograde degeneration.39,40
In glaucoma patients with central VF loss, lower macular DCP vessel density (DCPVD) was found to be associated with worse visual function (e.g. VF central scotomas), but without significant correlation with structural tissue thinning.41 Eyes with relatively better visual function had denser DCP when compared to functionally worse eyes. Moreover, macular DCPVD was independently associated with central VF deterioration in normal-tension glaucoma patients even when macular ganglion cell layer thickness was included in the model.
Given that the SCP and DCP are anatomically anastomosed to form the macular vascular supply, it is important to understand how DCP is affected in healthy and glaucomatous eyes. To the best of our knowledge, however, most glaucoma studies have focused on the SCP while paying little attention to the DCP. The purpose of this study is to characterize macular SCP and projection-resolved DCPVD measurements using HD 6x6 mm2 macular OCT-A scans and compare their diagnostic accuracies with ganglion cell complex (GCC) thickness in healthy, glaucoma suspect, and glaucoma eyes.
MATERIALS AND METHODS
Participants enrolled in the longitudinal Diagnostics Innovations in Glaucoma Study (DIGS)42-44, who underwent macular OCT-A (Angiovue; Optovue Inc., Fremont, CA) imaging were included in this cross-sectional study. The research protocol adhered to the tenets of the Declaration of Helsinki and was approved by the Institutional Review Board of the University of California, San Diego. Informed consent was obtained from all participants.
Participants
All participants underwent a comprehensive ophthalmic examination, including best-corrected visual acuity (BCVA), slit-lamp biomicroscopy, intraocular pressure (IOP) using Goldmann applanation tonometry, gonioscopy, pachymetry, dilated fundus examination, stereophotography of the optic disc and macula, and VF testing.
Inclusion criteria at study entry were greater than 18 years of age, BCVA of 20/40 or better, and open angles on gonioscopy. Patients with a history of ocular trauma or intraocular surgeries (except for uncomplicated cataract and uncomplicated glaucoma procedures), coexisting retinal diseases, non-glaucomatous optic neuropathy, uveitis, or high myopia (axial length >26.5 mm) were excluded from this study.
Participant eyes were divided into three diagnostic groups: healthy, glaucoma suspects, and glaucoma. Eyes from healthy individuals had IOP ≤ 21 mmHg with no history of elevated IOP, normal-appearing optic discs with intact neuroretinal rim, and normal VF test results with the Humphrey Field Analyzer SITA standard 24-2 (Carl Zeiss Meditec, Dublin, CA) Swedish Interactive Thresholding Algorithm [pattern standard deviation (PSD) within the 95% confidence limits and Glaucoma Hemifield Test (GHT) results within normal limits]. To be classified as a healthy subject, both eyes were required to meet the same criteria. The glaucoma suspect group included eyes with glaucomatous optic neuropathy (pre-perimetric glaucoma) or suspicious appearing optic nerves based on the review of stereoscopic ONH photographs, with or without high IOP (>21 mmHg), and no evidence of repeatable glaucomatous VF damage. Eyes were classified as glaucomatous if they had at least 2 repeatable and reliable (≤33% fixation losses and false-negatives, and ≤33% false-positives) abnormal VF results with GHT outside normal limits or PSD outside 95% normal limits with similar patterns of glaucomatous defect as assessed by study investigators. A subject could have one eye in the glaucoma suspect group and the fellow eye in the glaucoma group. Glaucoma eyes were stratified into three severity groups based on 24-2 VF MD: (1) mild glaucoma: VF MD > −6 dB, (2) moderate glaucoma: VF MD between −6 dB and −12 dB, and (3) severe glaucoma: VF MD ≤ −12 dB.45
OCT-A Image Acquisition
The Avanti AngioVue (OptoVue Inc., Fremont, CA; software version 2017.1.0.151) was utilized to acquire High Density (HD) 6x6 mm2 macula OCT-A scans. The scans consisted of merged Fast-X volume of 304 horizontal B-scans of 304 A-scans per B-scan and Fast-Y volume of 304 vertical B-scans of 304 A-scans per B-scan to minimize motion artifacts.
All vessel density measurements were acquired from the SCP (measured from the internal limiting membrane (ILM) to 10 μm below the inner plexiform layer (IPL)) and DCP (DCPVD) (measured from the INL to the OPL). Vessel density of the inner ring was measured in an annular region with an inner diameter of 1 mm and an outer diameter of 3 mm centered on the fovea for HD 6x6 mm2 scan size. Vessel density of the outer ring was measured in an annular region with inner and outer diameters of 3 mm and 6 mm, respectively for the larger scan.46,47 These measurements were automatically exported from the instrument. Ganglion cell complex (GCC; = RNFL + GCIPL) thickness measurements derived from the same scans were also included in the analysis.
All images included in this study were of good quality, based on qualitative review based on a standard protocol established by the University of California San Diego Image Data Evaluation and Analysis (IDEA) Reading Center. Images were considered of poor quality and excluded if they had a scan quality index (SQI) of < 4, signal strength index less than 48, poor clarity, motion artifacts, local weak signals due to floaters, off-centered fovea, and uncorrectable segmentation errors. In eyes with advanced glaucoma, a lower SQI score (SQI ≥ 3) was allowable as these patients tend to have worse visual function within 10 degrees of fixation.48,49 In this study, 17 (20.0%) healthy eyes, 13 (33.3%) glaucoma suspect eyes, and 79 (32.9%) glaucoma eyes were excluded due to poor quality.
Projection Artifact Removal
Projection-resolved OCT-A DCP measurements has been described previously.27,36-38,50-52 In brief, projection artifacts from the DCP are automatically removed using OptoVue standard software, which is attained based on normalized OCTA intensity (voxel-based) divided by OCT intensity. Depth cumulative OCT-A gradient intensity along the Z-axis was used to differentiate in situ OCT-A non-projection artifacts from projection artifacts by suppressing the projection artifacts to the background noise level.37,51 Only projection resolved DCPVD measurements are reported.
Statistical Analysis
Patient and eye characteristics are presented as mean (95% confidence interval) for continuous data and count (percentage) for categorical data. Significance across groups was determined by ANOVA and chi-squared tests for continuous and categorical patient-level variables, with two-sample t-tests and chi-squared tests used for pairwise comparisons. Linear mixed-effects models were used for continuous eye-level variables, with a random intercept included to account for within-patient correlation between eyes. A conditional F-test was applied to these models to determine whether variation across the 3 disease groups was significant. To determine the significance of pairwise comparisons derived from the same models, t-tests of the regression parameters and Satterthwaite’s approximation for degrees of freedom were used. Regression estimates for univariable and multivariable mixed models were calculated for whole image SCP and DCP from HD 6x6 mm2 scans. Variables in the univariable analysis with significance at p<0.1 were included in the multivariable models.
Diagnostic accuracies for classifying healthy, glaucoma suspect, and glaucoma eyes were compared between SCPVD and DCPVD using age and overall SQI-adjusted area under the receiver operating characteristic curve (AUC) for HD 6x6 mm2 scans, with confidence intervals and hypothesis tests determined via a clustered bootstrap approach.53 We considered p-values less than 0.05 to indicate statistical significance. All statistical analyses were performed using the R statistical software (version 3.5.2).
RESULTS
Two hundred and fifty-five eyes of 184 subjects consisting of 68 eyes from 44 healthy subjects, 26 eyes from 16 glaucoma suspects, and 161 eyes from 124 glaucoma patients were included. Of the 161 glaucoma eyes, 103 eyes had mild glaucoma, 33 eyes had moderate glaucoma, and 25 eyes had severe glaucoma. The healthy subjects were significantly younger [mean (95% CI): 53.3 (48.4, 58.2)] than the glaucoma suspect [60.8 (54.2, 67.3)] and glaucoma patients [70.2 (68.3, 72.1)] (p<0.001). Diabetes (DM) and hypertension (HTN) prevalence were significantly lower in healthy [DM: 0.0%, HTN: 34.1%] and glaucoma suspects [DM: 6.2%, HTN: 25.0%] compared with glaucoma patients [DM: 12.9%, HTN: 50.8%] (DM: p=0.036, HTN: p=0.041). Mean (95% CI) VF MD was significantly different among the diagnostic groups with higher values in healthy eyes [−0.66 (−2.15, 0.83)] and lower values in glaucomatous eyes [−6.18 (−7.09, −5.27)] (p<0.001). Race, IOP, CCT, and axial length did not differ among the three groups (Table 1).
Table 1:
Patient and Eye Characteristics
| Healthy | Glaucoma suspect | Glaucoma | P value | |
|---|---|---|---|---|
| n patient (eye) | 44 (68) | 16 (26) | 124 (161) | -- |
| Age (years) | 53.3 (48.4, 58.2) | 60.8 (54.2, 67.3) | 70.2 (68.3, 72.1) | <0.001+, ⍰ |
| Gender | 29 (65.9%) | 11 (68.8%) | 62 (50.0%) | 0.101 |
| n (%) female | ||||
| Race | ||||
| Caucasian n (%) | 19 (43.2%) | 9 (56.2%) | 62 (50.0%) | 0.430 |
| African n (%) | 12 (27.3%) | 2 (12.5%) | 38 (30.6%) | |
| Asian n (%) | 8 (18.2%) | 4 (25.0%) | 19 (15.3%) | |
| Others n (%) | 5 (11.4%) | 1 (6.2%) | 5 (4.0%) | |
| Visual Field 24-2 MD (dB) | −0.66 (−2.15, 0.83) | −0.91 (−3.37,1.54) | −6.18 (−7.09, −5.27) | <0.001+, ⍰ |
| Visual Field 24-2 PSD (dB) | 1.6 (0.8, 2.5) | 1.9 (0.5, 3.3) | 6.0 (5.5, 5.5) | <0.001+, ⍰ |
| IOP (mmHg) | 16.1 (14.9, 17.4) | 15.0 (13.0, 17.1) | 15.5 (14.7, 16.3) | 0.603 |
| CCT | 541.6 (527.2, 556.0) | 533.9 (510.4, 557.4) | 542.4 (533.4, 551.3) | 0.804 |
| Axial Length | 24.5 (24.1, 24.9) | 24.6 (23.9, 25.2) | 24.6 (24.3, 24.8) | 0.966 |
| Diabetes | 0 (0.0%) | 1 (6.2%) | 16 (12.9%) | 0.036+ |
| Hypertension | 15 (34.1%) | 4 (25.0%) | 63 (50.8%) | 0.041 |
| Scan Quality Index (SQI) | 8.0 (7.7, 8.4) | 7.3 (6.8, 7.8) | 7.0 (6.8, 7.2) | <0.001*, +, ⍰ |
Pairwise statistical significance (p<0.05)
Healthy vs. Suspect
Healthy vs. Glaucoma
Suspect vs. Glaucoma
MD: mean deviation, PSD: pattern standard deviation, dB: decibels, IOP: intraocular pressure, CCT: central corneal thickness.
Mean (95% CI) HD 6x6 mm2 SCPVD for all sectors were significantly greater in healthy eyes (eg: wiVD: 49.7% [48.3%, 51.2%]) and glaucoma suspect eyes (wiVD: 46.0% [43.6%, 48.4%]) than in glaucoma eyes (wiVD: 40.9% [40.0%,41.8%]). After adjusting for age and SQI, mean SCPVD measurements were not statistically significant between healthy and suspect eyes. Whereas differences in SCPVD measurements between suspect and glaucoma eyes, as well as healthy and glaucoma eyes reached statistical significance (Table 2, Figures 1 and 2).
Table 2:
Mean (95% CI) vessel density by classification from high density 6x6 mm2 scans. Significance is determined by linear mixed-effects models.
| Vessel Density (%) | |||||
|---|---|---|---|---|---|
| Scan Layer | Sector | Healthy eyes | Glaucoma Suspect eyes |
Glaucoma eyes | Adjusted P-value |
| Superficial Capillary Plexus | Whole Image (wivD) | 49.7 (48.3, 51.2) | 46.0 (43.6, 48.4) | 40.9 (40.0,41.8) | <0.001 +, ⍰ |
| Superior Hemifield | 49.9 (48.4,51.4) | 46.1 (43.7,48.6) | 41.5 (40.6,42.4) | <0.001 +, ⍰ | |
| Inferior Hemifield | 49.6 (48.0,51.1) | 45.8 (43.2,48.4) | 40.3 (39.4,41.3) | <0.001 +, ⍰ | |
| Inner parafovea | 52.2 (50.6,53.8) | 49.5 (46.8,52.1) | 45.0 (44.0,46.0) | <0.001 +, ⍰ | |
| Outer parafovea | 50.2 (48.7,51.7) | 46.1 (43.6,48.6) | 41.2 (40.2,42.1) | <0.001 +, ⍰ | |
| Deep Capillary Plexus | Whole Image (wivD) | 50.6 (48.9,52.4) | 47.3 (44.4, 50.1) | 45.7 (44.6,46.7) | 0.916 |
| Superior Hemifield | 50.8 (49.1,52.5) | 47.6 (44.8,50.4) | 46.0 (45.0,47.1) | 0.970 | |
| Inferior Hemifield | 50.4 (48.6,52.3) | 46.9 (43.9,50.0) | 45.3 (44.2,46.4) | 0.824 | |
| Inner parafovea | 54.9 (53.6,56.3) | 53.0 (50.8,55.2) | 51.6 (50.8,52.4) | 0.968 | |
| Outer parafovea | 51.8 (49.9,53.7) | 48.2 (45.1,51.4) | 46.4 (45.2,47.5) | 0.929 | |
Mixed model statistical significance (p<0.05)
Healthy vs. Suspect
Healthy vs. Glaucoma
Suspect vs. Glaucoma
wivD: whole image vessel density
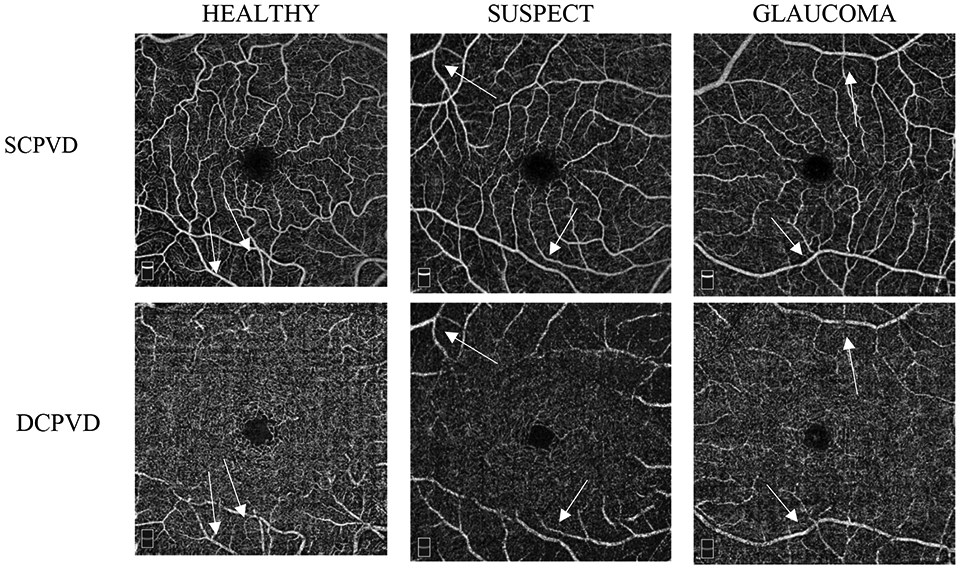
Figure 1:

Examples of OCT-A vessel density maps for superficial capillary plexus (SCP) and deep capillary plexus (DCP) high density 6x6 mm2 scans in healthy, suspect, and glaucoma eyes showing the inner and outer sectors (inner ring: inner diameter of 1 mm and outer diameter of 3 mm centered on the fovea. Outer ring: annular region with inner and outer diameters of 3 mm and 6 mm).
Figure 2:
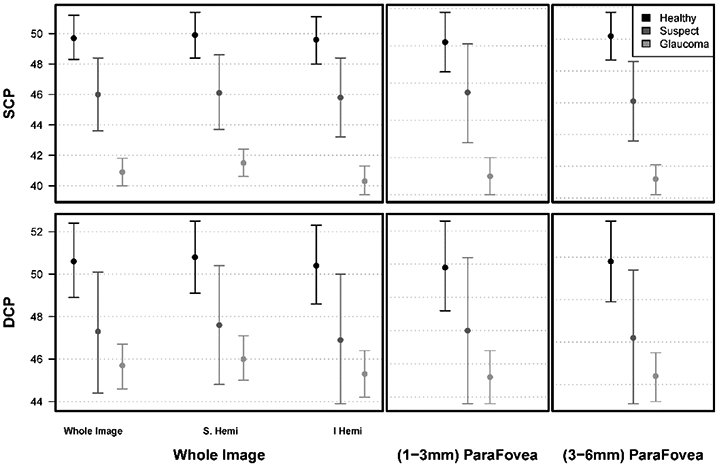
Comparison of mean macula superficial capillary plexus (SCP) and projection artifact-resolved deep capillary plexus (DCP) HD 6x6 mm2 vessel density measurements in healthy, suspect, and glaucoma eyes.
When comparing mean SCPVD and DCPVD values, the DCPVD values were generally higher than SCPVD for each of the three diagnostic groups. However, there were no significant differences in DCPVD among the diagnostic groups for the HD 6x6 mm2 macula scan (all sectors p >0.824). The hemifield and parafoveal vessel densities had similar trends as the whole image vessel density (Table 2, Figures 1 and 2).
Mean GCC thickness obtained from the HD 6x6 mm2 scans was significantly greater in healthy eyes [All: 99.5 μm (96.3 μm, 102.7 μm)] compared to glaucoma eyes [79.9 μm (78.0 μm, 81.8 μm)] (P<0.001). Mean GCC thickness was also significantly greater in glaucoma suspect [92.9 μm (87.6 μm, 98.1 μm)] compared to glaucoma eyes [79.9 μm (78.0 μm, 81.8 μm)] (P<0.001). No statistically significant GCC thickness difference was found between healthy and glaucoma suspect eyes for the HD 6x6 mm2 scans. This trend applies to all HD 6x6 mm2 sectors (Table 3).
Table 3:
Mean (95% CI) Ganglion Cell Complex thickness by classification from high density 6x6 mm2 scans. Significance is determined by linear mixed-effects models.
| Ganglion Cell Complex Thickness (μm) | ||||
|---|---|---|---|---|
| Sector | Healthy eyes | Glaucoma Suspect eyes |
Glaucoma eyes | Adjusted P-value |
| All (Field) | 99.5 (96.3, 102.7) | 92.9 (87.6, 98.1) | 79.9 (78.0, 81.8) | <0.001 +, ⍰ |
| Superior Hemifield | 98.8 (95.3,102.2) | 91.7(86.0,97.4) | 80.9(78.8,82.9) | <0.001 +, ⍰ |
| Inferior Hemifield | 100.2 (96.7,103.7) | 94.1(88.3,99.8) | 78.7(76.6,80.9) | <0.001 +, ⍰ |
| All (inner ring) | 107.4(103.3,111.5) | 100.7(94.0,107.5) | 88.3(85.8,90.8) | <0.001 +, ⍰ |
| All (outer ring) | 99.1(95.8,102.3) | 92.5(87.1,97.9) | 79.3(77.3,81.2) | <0.001 +, ⍰ |
Mixed model statistical significance (p<0.05): Statistical significance
Healthy vs. Suspect
Healthy vs. Glaucoma
Suspect vs. Glaucoma
Univariable and multivariable regression analysis were completed to evaluate the association of SCP, DCP wiVD, and GCC measures with age, VF MD, IOP, overall SQI, hypertension, and diabetes. In univariable analysis, SCP wiVD decreased with age, worsening VF MD, lower QI, and diabetes. VF MD had the strongest correlation with SCP wiVD (R2=36.0) followed by age (R2=22.6). A 1% decrease in HD 6x6 mm2 SCP wiVD was associated with 1.61 dB (reciprocal of 0.62 from table 4) decrease in MD. In contrast, a 1% decrease in HD 6x6 mm2 DCP wiVD was associated with a 3.33 dB (reciprocal of 0.30 from table 4) decrease in MD. Univariable analysis for GCC had similar trends to SCP. Multivariable analysis showed a significant association between SCP wiVD, DCP wiVD, and GCC measurements and age, VF MD, and SQI (Table 4).
Table 4:
Regression estimates for univariable and multivariable mixed models for whole image superficial capillary plexus, deep capillary plexus, and ganglion cell complex from high density 6x6 mm 2 scans.
| Univariable analysis | Multivariable analysis | ||||||
|---|---|---|---|---|---|---|---|
| Dependent Variable |
Variable | Estimate | p-value | R2 | Estimate | p-value | R2 |
| Superficial Capillary Plexus | Age (years) | −0.23 (−0.28, −0.17) | <0.001 | 28.1 (19.6, 36.9) | −0.14 (−0.18, −0.09) | <0.001 | 16.1 (8.9, 24.6) |
| MD (dB) | 0.62 (0.51, 0.72) | <0.001 | 36.0 (27.5, 44.5) | 0.51 (0.43, 0.60) | <0.001 | 35.7 (27.2, 44.3) | |
| IOP (mmHg) | −0.03 (−0.17, 0.10) | 0.634 | 0.1 (0.0, 2.4) | - | - | - | |
| Overall SQI | 2.17 (1.68, 2.66) | <0.001 | 22.6 (14.5, 31.5) | 1.53 (1.13, 1.93) | <0.001 | 18.5 (10.9, 27.2) | |
| Hypertension | −1.62 (−3.45, 0.21) | 0.085 | 1.8 (0.0, 6.4) | 0.51 (−0.74, 1.75) | 0.424 | 0.3 (0.0, 3.2) | |
| Diabetes | −3.84 (−6.94, −0.74) | 0.016 | 3.7 (0.5, 9.5) | −1.71 (−3.65, 0.23) | 0.087 | 1.6 (0.0, 6.0) | |
| Deep Capillary Plexus | Age (years) | −0.17 (−0.23, −0.11) | <0.001 | 14.1 (7.2, 22.4) | −0.06 (−0.11, −0.00) | 0.040 | 2.1 (0.1, 6.8) |
| MD (dB) | 0.30 (0.16, 0.44) | <0.001 | 7.1 (2.3, 14.1) | 0.15 (0.04, 0.26) | 0.008 | 2.9 (0.3, 8.2) | |
| IOP (mmHg) | −0.05 (−0.21, 0.12) | 0.596 | 0.1 (0.0, 2.5) | - | - | - | |
| Overall SQI | 3.32 (2.83, 3.82) | <0.001 | 42.6 (34.4, 50.7) | 3.02 (2.51, 3.53) | <0.001 | 35.6 (27.1, 44.2) | |
| Hypertension | −1.70 (−3.55, 0.14) | 0.072 | 1.7 (0.0, 6.2) | −0.69 (−2.18, 0.80) | 0.364 | 0.4 (0.0, 3.4) | |
| Diabetes | −2.21 (−5.35, 0.94) | 0.171 | 1.0 (0.0, 4.9) | - | - | - | |
| Ganglion Cell Complex | Age (years) | −0.43 (−0.56, −0.31) | <0.001 | 24.1 (15.9, 33.0) | −0.30 (−0.42, −0.19) | <0.001 | 14.4 (7.5, 22.7) |
| MD (dB) | 1.18 (0.98, 1.38) | <0.001 | 33.3 (24.8, 42.0) | 1.07 (0.88, 1.26) | <0.001 | 31.1 (22.6, 39.9) | |
| IOP (mmHg) | 0.07 (−0.17, 0.31) | 0.567 | 0.1 (0.0, 2.4) | - | - | - | |
| Overall SQI | 1.98 (1.00, 2.95) | <0.001 | 4.6 (0.9, 10.7) | 0.98 (0.18, 1.78) | 0.018 | 1.7 (0.0, 6.2) | |
| Hypertension | −3.94 (−7.93, 0.04) | 0.054 | 2.6 (0.2, 7.8) | 0.64 (−2.61, 3.88) | 0.701 | 0.1 (0.0, 2.4) | |
| Diabetes | −8.81 (−15.58, −2.04) | 0.012 | 4.7 (1.0, 10.9) | −4.85 (−9.97, 0.26) | 0.065 | 2.4 (0.1, 7.3) | |
MD: mean deviation, dB: decibels, IOP: intraocular pressure, SQI: scan quality index
As diabetes can influence SCP VD in glaucoma and GCC decreased with diabetes in the univariable analysis, we repeated the statistical analysis after excluding diabetic patients (data not shown). These results were very similar to those that included the diabetic patients.
Age and SQI-adjusted diagnostic accuracies were higher for GCC and SCPVD than DCPVD measurements. Specifically, the diagnostic accuracy for differentiating between healthy and glaucoma eyes was best for GCC (0.86 [0.73, 0.94]), followed by SCPVD (0.80 [0.66, 0.91]) and DCPVD (0.44 [0.30, 0.57]). Both GCC and SCPVD had significantly better diagnostic accuracy than DCPVD (both P<0.001) while no significant difference in AUC was found between GCC vs. SCPVD (P= 0.21) (Table 5, Figure 3). The inner and outer sectors had similar patterns to the whole image. For the inner sector, the diagnostic accuracy for differentiating between healthy and glaucoma eyes was best for GCC (0.79 [0.65, 0.89]), followed by SCPVD (0.70 [0.53, 0.85]) and DCPVD (0.43 [0.30, 0.57]). Both GCC and SCPVD had significantly better diagnostic accuracy than DCPVD (both P<0.001). No significant difference in AUC was found between GCC vs. SCPVD (P= 0.26). For the outer sector, the diagnostic accuracy for GCC (0.86 [0.73, 0.93]), SCPVD (0.79 [0.64, 0.91]) and DCPVD (0.45 [0.30, 0.59]). Both GCC and SCPVD had significantly better diagnostic accuracy than DCPVD (both P<0.001). No significant difference in AUC was found between GCC and SCPVD (P= 0.20) (Table 5, Figures 1 and 3).
Table 5:
Age and scan quality index adjusted Diagnostic Accuracy (AUC (95% bootstrap bias-corrected confidence intervals) for classifying healthy vs. glaucoma, healthy vs. glaucoma suspect, and suspect vs. glaucoma eyes using high density 6x6 mm2 scans.
| AUC (95% CI) | ||||
|---|---|---|---|---|
| Scan Layer | Sector | Healthy vs. Glaucoma |
Healthy vs. Suspect | Suspect vs. Glaucoma |
| Superficial Capillary Plexus | Whole image | 0.80 (0.66, 0.91) | 0.64 (0.42, 0.81) | 0.71 (0.57, 0.89) |
| Inner Parafovea | 0.70 (0.53, 0.85) | 0.57 (0.40, 0.74) | 0.66 (0.53, 0.85) | |
| Outer Parafovea | 0.79 (0.64, 0.91) | 0.64 (0.41, 0.80) | 0.69 (0.54, 0.88) | |
| Deep Capillary Plexus | Whole image | 0.44 (0.30, 0.57) | 0.49 (0.32, 0.65) | 0.54 (0.34, 0.80) |
| Inner Parafovea | 0.43 (0.30, 0.57) | 0.45 (0.28, 0.61) | 0.55 (0.34, 0.78) | |
| Outer Parafovea | 0.45 (0.30, 0.59) | 0.48 (0.31, 0.65) | 0.55 (0.33, 0.81) | |
| Ganglion Cell Complex | Whole image | 0.86 (0.73, 0.94) | 0.61 (0.39, 0.78) | 0.77 (0.57, 0.91) |
| Inner Parafovea | 0.79 (0.65, 0.89) | 0.55 (0.32, 0.70) | 0.74 (0.57, 0.90) | |
| Outer Parafovea | 0.86 (0.73, 0.93) | 0.60 (0.41, 0.78) | 0.76 (0.58, 0.91) | |
Figure 3:
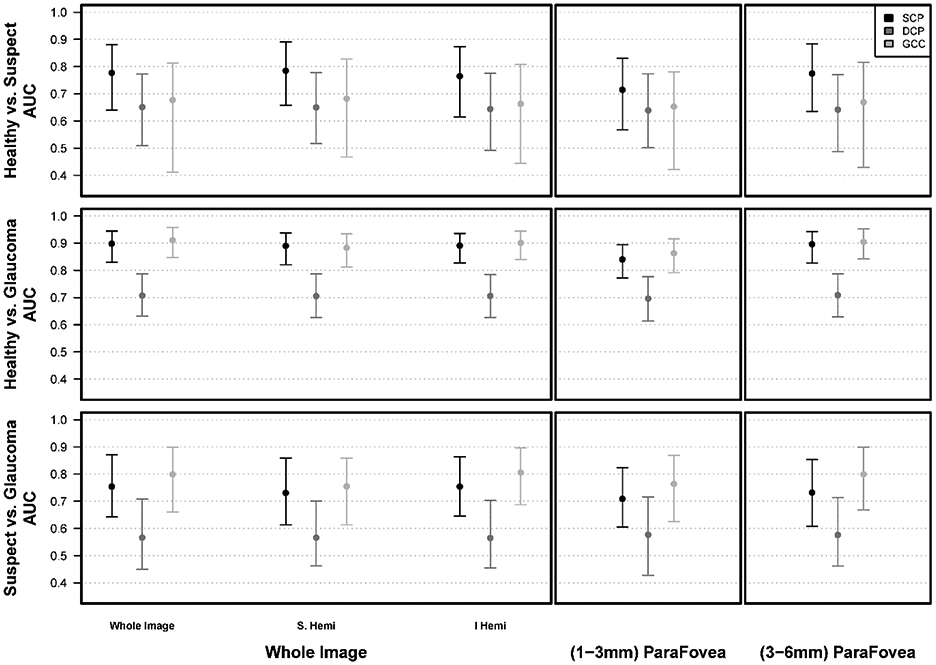
Age- and image scan quality index (SQI)-adjusted area under the receiver operating characteristic curves (AUC) comparing superficial capillary plexus (SCP) and projection artifact-resolved deep capillary plexus (DCP) HD 6 mm2 vessel density measurements in healthy, suspect, and glaucoma eyes
The diagnostic accuracy for differentiating between glaucoma suspects and glaucoma was not significantly better for GCC (AUC: 0.77 [0.57,0.91] or SCPVD (AUC: 0.71 [0.57, 0.89]) than DCPVD (AUC: 0.54 [0.34, 0.80]) (P= 0.46 GCC vs. SCPVD; P= 0.12 GCC vs. DCPVD; P= 0.09 SCPVD vs. DCPVD) (Table 5, Figure 3). AUCs for GCC and SCPVD were also similar to DCPVD measurements for differentiating suspect from healthy eyes (Table 5, Figure 3). The inner and outer sectors had similar patterns to the whole image (Table 5, Figures 1 and 3)
DISCUSSION
The present study evaluated the diagnostic accuracy of SCPVD and projection-resolved DCPVD measurements of the HD 6x6 mm2 macular OCT-A scans in normal, glaucoma suspect, and glaucomatous eyes. Our results, consistent with previous reports,54,55 suggest that SCPVD has similar diagnostic accuracy to GCC and both have better diagnostic accuracy than DCPVD for differentiating between healthy and glaucoma eyes.
Most OCT-A studies have focused on visualizing SCPVD without putting much emphasis on calculating DCPVD measurements in glaucoma, in part due to the existence of projection artifacts, which now can largely be removed using automated algorithms while maintaining the DCP vessel density. However, several studies demonstrate as we illustrate in Figure 4, the persistent presence of these artifacts even with the use of the projection artifact removal software and show that the likelihood of these artifacts is higher in eyes with pathologies.52,56
Figure 4:
Examples of OCT-A images for superficial capillary plexus (SCP) and deep capillary plexus (DCP) HD 6x6 mm2 scans in healthy, suspect, and glaucoma eyes showing the presence of remaining projection artifacts in DCP slabs (arrows).
To date, few studies have compared the diagnostic accuracies of SCPVD and projection artifact-resolved DCPVDs in glaucoma and healthy eyes.54,55,57-59 Specifically, Shin et al. compared SCPVD and DCPVDs using the AngioPlex OCT-A device (Carl Zeiss Meditec, Dublin, CA) and a large scan size (6x6 mm2) in 51 healthy and 41 glaucoma eyes and concluded that SCPVD measurements were better than DCPVD (AUC 0.78 vs. 0.67) for classifying healthy and glaucoma eyes.55 Lommatzsch et al., utilized the AngioVue and a 3x3 mm2 scan size in 50 healthy and 85 glaucoma eye and also found that SCPVD measurements were better than DCPVD when comparing healthy and glaucoma eyes (AUC = 0.78 vs. 0.70).54 Takusagawa et al. analyzed an additional layer (Intermediate capillary plexus) in addition to the SCP and DCP and concluded that SCPVD has the highest accuracy in detecting glaucoma.57 Our study confirms these results in HD scans and is unique in that it also compares these measurements in healthy and glaucoma eyes with the HD scan measurements in glaucoma suspect eyes.
SCPVD and macular GCC thickness measurements, which both decrease over time in healthy and glaucomatous eyes60,61, are obtained from the ILM to the IPL. In contrast, the DCPVD is measured from the INL to the OPL, and whether the deeper retinal changes in glaucoma remain controversial. A recent SD-OCT study investigated the deeper retinal changes in glaucoma and found that INL thickness was negatively correlated with visual field severity as defined by MD, which was thought to be due to reactive response of the glial or neuronal cells in the INL during the progression of glaucoma.40
Consistent with previous studies,54,62,63 vessel density was found to be lower, especially in SCP in glaucoma patients and glaucoma suspects than healthy subjects. Furthermore, SCPVD was consistently lower than the DCPVD in all eyes, notably in glaucomatous eyes. This finding is expected because the RNFL and GCL, which are structurally damaged in glaucomatous eyes, receive blood from the SCP. 57,64 In addition, the SCP is believed to have more vascular changes (i.e. blood flow regulation) than the DCP in glaucoma.65 Alternatively, more advanced glaucoma with less perfusion to the SCP may allow more vessels to be visible in the DCP, which creates a paradoxical trend showing a higher perfusion in the deeper layers as the disease progresses. We also know that DCP microvasculature dropout detected qualitatively was associated with the disease severity in glaucoma suspects,66 and the presence of gamma zone peripapillary atrophy67,68 and a higher VF progression rates in glaucoma patients.69
The vessel density of the outer sector had a trend of higher diagnostic accuracy compared with the vessel density of the inner sector of the HD 6x6 mm2 when differentiating the three different groups. A previous study by our research group compared the diagnostic accuracy of the inner area of the 3x3 mm2 with the outer area of non-HD 6x6 mm2 and concluded that the outer area was better than the inner area when classifying healthy and mild glaucoma eyes whereas classification was similar when classifying healthy and moderate to severe glaucoma eyes.47
Our study has several limitations. First, the projection artifact removal algorithm does not remove all artifacts. Several eyes showed remaining artifacts in the deeper layer after projection artifact removal (Figure 4). As different projection artifact removal algorithms are implemented, it is important to understand the strengths and limitations of the various algorithms and how they differ in their ability to remove these artifacts. Second, the sample size of the glaucoma suspect was smaller than the healthy and glaucoma groups and may limit our ability to detect significant differences. Third, a relatively larger proportion of glaucoma and suspect eyes were excluded due to poor quality scans which may reduce the generalizability of the results. We also did not compare the GCC/ SCP thickness to the DCP due to lack of deep layer thickness data using the current software. In addition, topical glaucoma and systemic medications might have an influence on the vessel density and the effects of different medications and possible changes in medications are not easily evaluated in a cross-sectional study design. Longitudinal studies are needed to test the influence of changes in medications on SCPVD and DCPVD measurements.
In conclusion, deep capillary plexus vessel density measurements may not provide critical diagnostic information for glaucoma management as these measurements performed relatively poorly at differentiating between healthy, glaucoma suspect and glaucoma eyes compared to SCPVD and GCC. The deep capillary plexus vessel density results may be influenced by the imperfect ability of the algorithm to remove all the artifacts. These results suggest that superficial capillary plexus vessel density and GCC measurements are more informative than deep capillary plexus vessel density for the detection and management of glaucoma.
Acknowledgments
Grant Support: National Institutes of Health/National Eye Institute Grants R01EY029058, R01EY011008, U10EY014267, R01EY027510, and Core Grant P30EY022589; an unrestricted grant from Research to Prevent Blindness (New York, NY).
Footnotes
- Nevin W. El-Nimri: None
- Patricia Isabel C. Manalastas: Previous employment at Heidelberg Engineering, Alcon
- Linda M. Zangwill: F: National Eye Institute, Carl Zeiss Meditec Inc., Heidelberg Engineering, GmbH, Optovue Inc., Topcon Medical Systems Inc.
- James A. Proudfoot: None
- Christopher Bowd: None
- Huiyuan Hou: None
- Sasan Moghimi: None
- Rafaella C. Penteado: None
- Jasmin Rezapour: None
- Eren Ekici: None
- Takuhei Shoji: R - Alcon
- Elham Ghahari: None
- Adeleh Yarmohammadi: None
- Robert N. Weinreb: F: National Eye Institute, Heidelberg Engineering, Carl Zeiss Meditec, Konan, Optovue, Topcon, Centervue. C: Aerie Pharmaceuticals, Alcon, Allergan, Bausch & Lomb, Eyenovia.
Bibliography
- 1.Halpern DL, Grosskreutz CL. Glaucomatous optic neuropathy: mechanisms of disease. Ophthalmol Clin North Am. 2002;15(1):61–68. [DOI] [PubMed] [Google Scholar]
- 2.Flammer J, Orgül S, Costa VP, et al. The impact of ocular blood flow in glaucoma. Prog Retin Eye Res. 2002;21(4):359–393. [DOI] [PubMed] [Google Scholar]
- 3.Weinreb RN, Aung T, Medeiros FA. The pathophysiology and treatment of glaucoma: a review. JAMA. 2014;311(18):1901–1911. [DOI] [PMC free article] [PubMed] [Google Scholar]
- 4.Curcio CA, Allen KA. Topography of ganglion cells in human retina. J Comp Neurol. 1990;300(1):5–25. [DOI] [PubMed] [Google Scholar]
- 5.Hood DC, Raza AS, de Moraes CGV., Liebmann JM, Ritch R. Glaucomatous damage of the macula. Prog Retin Eye Res. 2013;32:1–21. [DOI] [PMC free article] [PubMed] [Google Scholar]
- 6.Hood DC. Improving our understanding, and detection, of glaucomatous damage: An approach based upon optical coherence tomography (OCT). Prog Retin Eye Res. 2017;57:46–75. [DOI] [PMC free article] [PubMed] [Google Scholar]
- 7.Alhadeff PA, De Moraes CG, Chen M, Raza AS, Ritch R, Hood DC. The Association between Clinical Features Seen on Fundus Photographs and Glaucomatous Damage Detected on Visual Fields and Optical Coherence Tomography Scans. J Glaucoma. 2017;26(5): 498–504. [DOI] [PMC free article] [PubMed] [Google Scholar]
- 8.Kim KE, Kim SH, Oh S, et al. Additive Diagnostic Role of Imaging in Glaucoma: Optical Coherence Tomography and Retinal Nerve Fiber Layer Photography. Invest Ophthalmol Vis Sci. 2014;55(12):8024–8030. [DOI] [PubMed] [Google Scholar]
- 9.Seo JH, Kim T-W, Weinreb RN, Park KH, Kim SH, Kim DM. Detection of Localized Retinal Nerve Fiber Layer Defects with Posterior Pole Asymmetry Analysis of Spectral Domain Optical Coherence Tomography. Investig Opthalmology Vis Sci. 2012;53(8):4347. [DOI] [PubMed] [Google Scholar]
- 10.Na JH, Kook MS, Lee Y, Yu SJ, Choi J. Detection of macular and circumpapillary structural loss in normal hemifield areas of glaucomatous eyes with localized visual field defects using spectral-domain optical coherence tomography. Graefe’s Arch Clin Exp Ophthalmol. 2012;250(4):595–602. [DOI] [PubMed] [Google Scholar]
- 11.Zhang C, Tatham AJ, Abe RY, et al. Macular Ganglion Cell Inner Plexiform Layer Thickness in Glaucomatous Eyes with Localized Retinal Nerve Fiber Layer Defects. Linden R, ed. PLoS One. 2016;11(8):e0160549. [DOI] [PMC free article] [PubMed] [Google Scholar]
- 12.Weinreb RN. Ocular blood flow in glaucoma. Can J Ophthalmol. 2008. [DOI] [PubMed] [Google Scholar]
- 13.Schmidl D, Garhofer G, Schmetterer L. The complex interaction between ocular perfusion pressure and ocular blood flow – Relevance for glaucoma. Exp Eye Res. 2011;93(2):141–155. [DOI] [PubMed] [Google Scholar]
- 14.Shahlaee A, Samara WA, Hsu J, et al. In Vivo Assessment of Macular Vascular Density in Healthy Human Eyes Using Optical Coherence Tomography Angiography. Am J Ophthalmol. 2016;165:39–46. [DOI] [PubMed] [Google Scholar]
- 15.You Q, Freeman WR, Weinreb RN, et al. Reproducibility of vessel density measurement with optical coherence tomography angiography in eyes with and without retinopathy. Retina. 2017;37(8):1475–1482. [DOI] [PMC free article] [PubMed] [Google Scholar]
- 16.Venugopal JP, Rao HL, Weinreb RN, et al. Repeatability of vessel density measurements of optical coherence tomography angiography in normal and glaucoma eyes. Br J Ophthalmol. 2018;102(3):352–357. [DOI] [PubMed] [Google Scholar]
- 17.Liu L, Jia Y, Takusagawa HL, et al. Optical Coherence Tomography Angiography of the Peripapillary Retina in Glaucoma. JAMA Ophthalmol. 2015;133(9):1045. [DOI] [PMC free article] [PubMed] [Google Scholar]
- 18.Yarmohammadi A, Zangwill LM, Diniz-Filho A, et al. Optical Coherence Tomography Angiography Vessel Density in Healthy, Glaucoma Suspect, and Glaucoma Eyes. Investig Opthalmology Vis Sci. 2016;57(9):OCT451. [DOI] [PMC free article] [PubMed] [Google Scholar]
- 19.Mammo Z, Heisler M, Balaratnasingam C, et al. Quantitative Optical Coherence Tomography Angiography of Radial Peripapillary Capillaries in Glaucoma, Glaucoma Suspect, and Normal Eyes. Am J Ophthalmol. 2016;170:41–49. [DOI] [PubMed] [Google Scholar]
- 20.Yarmohammadi A, Zangwill LM, Diniz-Filho A, et al. Relationship between Optical Coherence Tomography Angiography Vessel Density and Severity of Visual Field Loss in Glaucoma. Ophthalmology. 2016;123(12):2498–2508. [DOI] [PMC free article] [PubMed] [Google Scholar]
- 21.Wang X, Jiang C, Ko T, et al. Correlation between optic disc perfusion and glaucomatous severity in patients with open-angle glaucoma: an optical coherence tomography angiography study. Graefe’s Arch Clin Exp Ophthalmol. 2015;253(9):1557–1564. [DOI] [PubMed] [Google Scholar]
- 22.Yarmohammadi A, Zangwill LM, Manalastas PIC, et al. Peripapillary and Macular Vessel Density in Patients with Primary Open-Angle Glaucoma and Unilateral Visual Field Loss. Ophthalmology. 2018; 125(4):578–587. [DOI] [PMC free article] [PubMed] [Google Scholar]
- 23.Yarmohammadi A, Zangwill LM, Diniz-Filho A, et al. Peripapillary and Macular Vessel Density in Patients with Glaucoma and Single-Hemifield Visual Field Defect. Ophthalmology. 2017;124(5):709–719. [DOI] [PMC free article] [PubMed] [Google Scholar]
- 24.Suh MH, Zangwill LM, Manalastas PIC, et al. Optical Coherence Tomography Angiography Vessel Density in Glaucomatous Eyes with Focal Lamina Cribrosa Defects. Ophthalmology. 2016;27(4): 342–349. [DOI] [PMC free article] [PubMed] [Google Scholar]
- 25.Ghahari E, Bowd C, Zangwill LM, et al. Macular Vessel Density in Glaucomatous Eyes With Focal Lamina Cribrosa Defects. J Glaucoma. 2018;27(4): 342–349. [DOI] [PMC free article] [PubMed] [Google Scholar]
- 26.Park JJ, Soetikno BT, Fawzi AA. Characterization of the middle capillary plexus using optical coherence tomography angiography in healthy and diabetic eyes. Retina. 2016;36(11):2039–2050. [DOI] [PMC free article] [PubMed] [Google Scholar]
- 27.Hwang TS, Zhang M, Bhavsar K, et al. Visualization of 3 Distinct Retinal Plexuses by Projection-Resolved Optical Coherence Tomography Angiography in Diabetic Retinopathy. JAMA Ophthalmol. 2016;134(12):1411. [DOI] [PMC free article] [PubMed] [Google Scholar]
- 28.Garrity ST, Iafe NA, Phasukkijwatana N, Chen X, Sarraf D. Quantitative analysis of three distinct retinal capillary plexuses in healthy eyes using optical coherence tomography angiography. Investig Ophthalmol Vis Sci. 2017;58(12):5548–5555. [DOI] [PubMed] [Google Scholar]
- 29.Chung CS, Nesper PL, Park JJ, Fawzi AA. Comparison of Zeiss Cirrus and Optovue RTVue OCT Angiography Systems: A Quantitative and Qualitative Approach Examining the Three Capillary Networks in Diabetic Retinopathy. Ophthalmic Surgery, Lasers Imaging Retin. 2018;49(11):e198–e205. [DOI] [PMC free article] [PubMed] [Google Scholar]
- 30.Onishi AC, Fawzi AA. An overview of optical coherence tomography angiography and the posterior pole. Ther Adv Ophthalmol. 2019;11:251584141984024. [DOI] [PMC free article] [PubMed] [Google Scholar]
- 31.Chan G, Balaratnasingam C, Yu PK, et al. Quantitative Morphometry of Perifoveal Capillary Networks in the Human Retina. Investig Opthalmology Vis Sci. 2012;53(9):5502. [DOI] [PubMed] [Google Scholar]
- 32.Yu PK, Mammo Z, Balaratnasingam C, Yu D-Y. Quantitative Study of the Macular Microvasculature in Human Donor Eyes. Investig Opthalmology Vis Sci. 2018;59(1):108. [DOI] [PubMed] [Google Scholar]
- 33.Penteado RC, Zangwill LM, Daga FB, et al. Optical Coherence Tomography Angiography Macular Vascular Density Measurements and the Central 10-2 Visual Field in Glaucoma. J Glaucoma. 2018;27(6):481–489. [DOI] [PMC free article] [PubMed] [Google Scholar]
- 34.Shoji T, Zangwill LM, Akagi T, et al. Progressive Macula Vessel Density Loss in Primary Open-Angle Glaucoma: A Longitudinal Study. Am J Ophthalmol. 2017; 182:107–117. [DOI] [PMC free article] [PubMed] [Google Scholar]
- 35.Yu J, Gu R, Zong Y, et al. Relationship between retinal perfusion and retinal thickness in healthy subjects: An optical coherence tomography angiography study. Investig Ophthalmol Vis Sci. 2016;57(9):OCT204–10. [DOI] [PMC free article] [PubMed] [Google Scholar]
- 36.Zhang A, Zhang Q, Wang RK. Minimizing projection artifacts for accurate presentation of choroidal neovascularization in OCT micro-angiography. Biomed Opt Express. 2015;6(10):4130. [DOI] [PMC free article] [PubMed] [Google Scholar]
- 37.Zhang M, Hwang TS, Campbell JP, et al. Projection-resolved optical coherence tomographic angiography. Biomed Opt Express. 2016;7(3):816. [DOI] [PMC free article] [PubMed] [Google Scholar]
- 38.Campbell JP, Zhang M, Hwang TS, et al. Detailed Vascular Anatomy of the Human Retina by Projection-Resolved Optical Coherence Tomography Angiography. Sci Rep. 2017;7(1):42201. [DOI] [PMC free article] [PubMed] [Google Scholar]
- 39.Jindahra P, Petrie A, Plant GT. Retrograde trans-synaptic retinal ganglion cell loss identified by optical coherence tomography. Brain. 2009;132(Pt 3):628–34. [DOI] [PubMed] [Google Scholar]
- 40.Kim EK, Park HYL, Park CK. Relationship between Retinal Inner Nuclear Layer Thickness and Severity of Visual Field Loss in Glaucoma. Sci Rep. 2017;7: 5543. [DOI] [PMC free article] [PubMed] [Google Scholar]
- 41.Jeon SJ, Park H-YL, Park CK. Effect of Macular Vascular Density on Central Visual Function and Macular Structure in Glaucoma Patients. Sci Rep. 2018;8(1):16009. [DOI] [PMC free article] [PubMed] [Google Scholar]
- 42.Medeiros FA. Comparison of the GDx VCC Scanning Laser Polarimeter, HRT II ConfocalScanning Laser Ophthalmoscope, and Stratus OCT Optical Coherence Tomographfor the Detection of Glaucoma. Arch Ophthalmol. 2004;122(6):827. [DOI] [PubMed] [Google Scholar]
- 43.Sample PA, Medeiros FA, Racette L, et al. Identifying glaucomatous vision loss with visual-function-specific perimetry in the diagnostic innovations in glaucoma study. Investig Ophthalmol Vis Sci. 2006;47(8):3381–9. [DOI] [PubMed] [Google Scholar]
- 44.Sample PA, Girkin CA, Zangwill LM, et al. The African descent and glaucoma evaluation study (ADAGES): Design and baseline data. Arch Ophthalmol. 2009; 127(9):1136–45. [DOI] [PMC free article] [PubMed] [Google Scholar]
- 45.Hodapp E, Parrish RAD. Clinical Decisions in Glaucoma. St Louis, MO CV Mosby Co. 1993:52–61. [Google Scholar]
- 46.Manalastas PIC, Zangwill LM, Daga FB, et al. The Association Between Macula and ONH Optical Coherence Tomography Angiography (OCT-A) Vessel Densities in Glaucoma, Glaucoma Suspect, and Healthy Eyes. J Glaucoma. 2018;27(3):227–232. [DOI] [PMC free article] [PubMed] [Google Scholar]
- 47.Penteado RC, Bowd C, Proudfoot JA, et al. Diagnostic Ability of Optical Coherence Tomography Angiography Macula Vessel Density for the Diagnosis of Glaucoma Using Difference Scan Sizes. J Glaucoma. 2020;29(4):245–251. [DOI] [PubMed] [Google Scholar]
- 48.Damji KF, Behki R, Wang L. Canadian perspectives in glaucoma management: Setting target intraocular pressure range. Can J Ophthalmol. 2003;38(3):189–97. [DOI] [PubMed] [Google Scholar]
- 49.Hood DC, Raza AS, de Moraes CGV., et al. Initial arcuate defects within the central 10 degrees in glaucoma. Investig Ophthalmol Vis Sci. 2011;52(2):940–6. [DOI] [PMC free article] [PubMed] [Google Scholar]
- 50.Hagag AM, Wang J, Lu K, et al. Projection-Resolved Optical Coherence Tomographic Angiography of Retinal Plexuses in Retinitis Pigmentosa. Am J Ophthalmol. 2019;204:70–79. [DOI] [PMC free article] [PubMed] [Google Scholar]
- 51.Wang J, Zhang M, Hwang TS, et al. Reflectance-based projection-resolved optical coherence tomography angiography [Invited]. Biomed Opt Express. 2017;8(3):1536. [DOI] [PMC free article] [PubMed] [Google Scholar]
- 52.Spaide RF, Fujimoto JG, Waheed NK. IMAGE ARTIFACTS IN OPTICAL COHERENCE TOMOGRAPHY ANGIOGRAPHY. Retina. 2015;35(11):2163–2180. [DOI] [PMC free article] [PubMed] [Google Scholar]
- 53.Sullivan Pepe M, Cai T. The Analysis of Placement Values for Evaluating Discriminatory Measures. Biometrics. 2004;60(2):528–535. [DOI] [PubMed] [Google Scholar]
- 54.Lommatzsch C, Rothaus K, Koch JM, Heinz C, Grisanti S. OCTA vessel density changes in the macular zone in glaucomatous eyes. Graefe’s Arch Clin Exp Ophthalmol. 2018;256(8):1499–1508. [DOI] [PubMed] [Google Scholar]
- 55.Shin JW, Sung KR, Lee JY, Kwon J, Seong M. Optical coherence tomography angiography vessel density mapping at various retinal layers in healthy and normal tension glaucoma eyes. Graefe’s Arch Clin Exp Ophthalmol. 2017;255(6):1193–1202. [DOI] [PubMed] [Google Scholar]
- 56.Ghasemi Falavarjani K, Al-Sheikh M, Akil H, Sadda SR. Image artefacts in swept-source optical coherence tomography angiography. Br J Ophthalmol. 2017;101(5):564–568. [DOI] [PubMed] [Google Scholar]
- 57.Takusagawa HL, Liu L, Ma KN, et al. Projection-Resolved Optical Coherence Tomography Angiography of Macular Retinal Circulation in Glaucoma. In: Ophthalmology. ; 2017;124(11):1589–1599. [DOI] [PMC free article] [PubMed] [Google Scholar]
- 58.Rabiolo A, Gelormini F, Sacconi R, et al. Comparison of methods to quantify macular and peripapillary vessel density in optical coherence tomography angiography. Cheung G, ed. PLoS One. 2018;13(10):e0205773. [DOI] [PMC free article] [PubMed] [Google Scholar]
- 59.Lavia C, Bonnin S, Maule M, Erginay A, Tadayoni R, Gaudric A. Vessel density of superficial, intermediate, and deep capillary plexuses using optical coherence tomography angiography. Retina. 2019;39(2):247–258. [DOI] [PMC free article] [PubMed] [Google Scholar]
- 60.Hou H, Moghimi S, Proudfoot JA, et al. Ganglion Cell Complex Thickness and Macular Vessel Density Loss in Primary Open-Angle Glaucoma. In: Ophthalmology. 2020;127(8):1043–1052. [DOI] [PMC free article] [PubMed] [Google Scholar]
- 61.Wang Y, Xin C, Li M, et al. Macular vessel density versus ganglion cell complex thickness for detection of early primary open-angle glaucoma. BMC Ophthalmol. 2020;20(1):17. [DOI] [PMC free article] [PubMed] [Google Scholar]
- 62.Kurysheva NI, Maslova EV., Trubilina AV., Ardzhevnishvili TD, Fomin AV Macular blood flow in glaucoma. Vestn oftal’mologii. 2017;133(2):29. [DOI] [PubMed] [Google Scholar]
- 63.Akil H, Chopra V, Al-Sheikh M, et al. Swept-source OCT angiography imaging of the macular capillary network in glaucoma. Br J Ophthalmol. 2018;102(4):515–519. [DOI] [PubMed] [Google Scholar]
- 64.Greenfield DS, Bagga H, Knighton RW. Macular thickness changes in glaucomatous optic neuropathy detected using optical coherence tomography. Arch Ophthalmol. 2003;121(1):41–46. [DOI] [PubMed] [Google Scholar]
- 65.Kur J, Newman EA, Chan-Ling T. Cellular and physiological mechanisms underlying blood flow regulation in the retina and choroid in health and disease. Prog Retin Eye Res. 2012;31(5):377–406. [DOI] [PMC free article] [PubMed] [Google Scholar]
- 66.Suh MH, Na JH, Zangwill LM, Weinreb RN. Deep-layer Microvasculature Dropout in Preperimetric Glaucoma Patients. J Glaucoma.2020;29(6):423–428. [DOI] [PMC free article] [PubMed] [Google Scholar]
- 67.Suh MH, Zangwill LM, Manalastas PIC, et al. Deep-layer microvasculature dropout by optical coherence tomography angiography and microstructure of parapapillary atrophy. Investig Ophthalmol Vis Sci. 2018;59(5): 1995–2004. [DOI] [PMC free article] [PubMed] [Google Scholar]
- 68.Kim HR, Weinreb RN, Zangwill LM, Suh MH. Characteristics of Focal Gamma Zone Parapapillary Atrophy. Investig Opthalmology Vis Sci. 2020;61(3):17. [DOI] [PMC free article] [PubMed] [Google Scholar]
- 69.Kwon JM, Weinreb RN, Zangwill LM, Suh MH. Parapapillary Deep-Layer Microvasculature Dropout and Visual Field Progression in Glaucoma. Am J Ophthalmol. 2019;200:65–75. [DOI] [PubMed] [Google Scholar]