

Abstract
Background:
Arrhythmogenic cardiomyopathy (ACM) manifests with sudden death, arrhythmias, heart failure, apoptosis, and myocardial fibro-adipogenesis. The phenotype typically starts at the epicardium and advances transmurally. Mutations in genes encoding desmosome proteins, including DSP (desmoplakin), are major causes of ACM.
Methods:
To delineate contributions of the epicardium to the pathogenesis of ACM, the Dsp allele was conditionally deleted in the epicardial cells in mice upon expression of tamoxifen-inducible Cre from the Wt1 locus. Wild type (WT) and Wt1-CreERT2:DspW/F were crossed to Rosa26mT/mG (R26mT/mG) dual reporter mice to tag the epicardial-derived cells (EDCs) with the EGFP reporter protein. Tagged EDCs from adult Wt1-CreERT2:R26mT/mG and Wt1-CreERT2: R26mT/mG:DspW/F mouse hearts were isolated by FACS and sequenced by single cell RNA-sequencing (scRNA-Seq).
Results:
WT1 expression was progressively restricted postnatally and was exclusive to the epicardium by postnatal day 21. Expression of Dsp was reduced in the epicardial cells but not in cardiac myocytes in the Wt1-CreERT2:DspW/F mice. The Wt1-CreERT2:DspW/F mice exhibited premature death, cardiac dysfunction, arrhythmias, myocardial fibro-adipogenesis, and apoptosis. ScRNA-Seq of ~ 18,000 EGFP-tagged EDCs identified genotype-independent clusters of endothelial cells (ECs), fibroblasts, epithelial cells, and a very small cluster of cardiac myocytes, which were confirmed upon co-immunofluorescence staining of the myocardial sections. Differentially expressed genes (DEGs) between the paired clusters in the two genotypes predicted activation of the inflammatory and mitotic pathways, including the TGFβ1 and fibroblast growth factors (FGFs), in the epicardial-derived fibroblast and epithelial clusters but their suppression in the EC cluster. The findings were corroborated by analysis of gene expression in the pooled RNA-Seq data, which identified predominant dysregulation of genes involved in epithelial-mesenchymal transition (EMT), and dysregulation of 146 genes encoding the secreted proteins (secretome), including genes in the TGFβ1 pathway. Activation of the TGFβ1 and its co-localization with fibrosis in the Wt1-CreERT2:R26mT/mG:DspW/F mouse heart was validated by complementary methods.
Conclusions:
Epicardial-derived cardiac fibroblasts and epithelial cells express paracrine factors, including TGFβ1 and FGFs, which mediate EMT, and contribute to the pathogenesis of myocardial fibrosis, apoptosis, arrhythmias, and cardiac dysfunction in a mouse model of ACM. The findings uncover contributions of the EDCs to the pathogenesis of ACM.
Keywords: Arrhythmogenic cardiomyopathy, single cell RNA sequencing, epicardial cells, paracrine factors
INTRODUCTION
Arrhythmogenic cardiomyopathy (ACM) is a primary myocardial disease whose cardinal manifestations are ventricular arrhythmias, heart failure, and premature death. 1, 2 ACM is an uncommon, albeit important cause of sudden cardiac death in the young. 3–5 The classic form of ACM predominantly involves the right ventricle and is referred to as arrhythmogenic right ventricular cardiomyopathy (ARVC). Both ventricles are commonly involved in advanced ACM. 5 The pathological hallmark of ACM is a gradual replacement of cardiac myocytes by fibro-adipocytes. 6
Genes encoding protein constituents of the desmosomes are the main causes of ACM, especially the subtype of ARVC. 1, 2 Mutations in DSP, encoding desmoplakin are often responsible for a left-dominant or biventricular ACM. 7–12,13 A prominent feature of ACM caused by the DSP mutations is the presence of myocardial fibrosis, which precedes cardiac dysfunction.10 Mutations in the PKP2 (plakophilin 2), DSC2 (desmocollin 2), and DSG2 (desmoglein 2) genes are also major causes of ACM. 14,2, 15
Desmosome proteins are also expressed, albeit at low levels, in other cardiac cell types, including the epicardial cells.16–18 Desmosome maintain mechanical integrity of the myocardium and are signaling hubs for mechano-sensing pathways, including the Hippo and the canonical WNT pathways, which are implicated in the pathogenesis of ACM. 17–22
The epicardium is typically the initial site of manifestation of the classic ACM. 1, 23–25 The epicardium is a source of multiple cardiac cell types, including fibroblasts, typically during cardiac development and remodeling. 26–29 The epicardial cells express and secret a number of paracrine factors that impart functional effects on resident myocardial cells. 26, 27, 29, 30 Thus, these studies were performed to investigate the role of the epicardial-derived cells (EDCs) in the pathogenesis of ACM.
METHODS
A detailed methods section is provided as Online Supplement. A timetable of the experiments is presented in Figure I in the Supplement.
Regulatory approval:
The studies conformed to the Guide for the Care and Use of Laboratory Animals published by the US National Institutes of Health and were approved by the Animal Care and Use Committee of the UTHealth, Houston.
Data sharing:
RNA-Seq data has been deposited in the public database GEO (accession: GSE151084). All data are available upon request.
Isolation of mouse epicardial cells:
Epicardial cells were isolated from the explanted hearts upon treatment with collagenase II.
Deletion of Dsp gene in the epicardial cells:
The Dsp gene was exclusively deleted in the epicardial cells upon administration of tamoxifen (30 mg/Kg/d) from postnatal day 2 (P2) to P7 in crosses of Wt1-CreERT2 deleter and Dsp floxed mice (Figure II in the Supplement). 20, 31, 32 The Wt1-CreERT2 and wild type (WT) littermates, age- and sex-matched, were included as controls. The list of the oligonucleotide primers is provided in Table I in the Supplement.
Lineage tracing using dual reporter R26mT/mG mice:
Gt(ROSA)26Sortm4(ACTB-tdTomato,-EGFP), simplified as R26mT/mG mice, were crossed to Wt1-CreERT2:DspW/F mice to simultaneously delete the Dsp gene and induce expression of the membrane-targeted enhanced green fluorescent protein (EGFP), upon injection of tamoxifen, specifically in the epicardial cells. 33 (Figure III in the Supplement).
Cre-mediated recombination:
Percent of myocardial cells expressing EGFP was calculated in a total of 18,848±5,317 cells per mouse heart.
Survival:
Survival rates were compared using Kaplan-Meier survival plots.
Echocardiography:
Cardiac size and function were assessed by echocardiography, as published. 18, 34–36
Electrocardiography (ECG):
Surface 2-lead ECG was recorded, as published. 37
Myocardial histology:
Collagen volume fraction (CVF) was quantified in picrosirius red stained myocardial sections, as published. 18, 34–36 Adipocytes were identified by expression of CEBPA or PLIN1 or detection of Oil Red O (ORO) and counted in ~15,000 to 25,000 cells per heart, as published. 17, 18, 34–36, 38
TUNEL assay:
Apoptosis was detected by terminal deoxynucleotidyl transferase dUTP nick end labeling (TUNEL) assay, using a commercial kit, in a total of 15,000 to 25,000 cells in each heart, as published. 17, 18, 34–36, 38
Immunofluorescence and immunohistochemistry:
Staining was performed, as described. 17, 18, 34–36, 38 The antibodies are listed in Table I in the Supplement.
Reverse transcription-polymerase chain reaction (RT-PCR):
Transcript levels of selected genes were quantified by RT-PCR, as published. 17, 18, 34–36, 38 The TaqMan probes and oligonucleotide primers are listed in Table I in the Supplement.
Isolation of myocytes and non-myocytes cells from adult mouse hearts:
Cardiac myocytes and non-cardiac myocyte cells were isolated, as published. 34–36
Fluorescence Activated Cell Sorting (FACS):
Non-myocyte cells were isolated from age- and sex-matched mice and analyzed for the expression of EGFP and tdTomato by FACS. Two sex-matched hearts per genotype were pooled. Cells were sorted using a commercial flow cytometer and data were analyzed using the Flow Jo software.
Single cell RNA-Seq (scRNA-Seq):
FACS-isolated EDCs were individually loaded onto the 10X Genomics Chromium Single cell Gene expression Solution. Barcoded samples were pooled into a single library prior to in vitro transcription, cDNA libraries were generated, and sequenced using paired-end 75 bp sequencing reads. Egfp and tdTomato sequences were added to the mouse reference genome (GRCm38.p6), before aligning the sequencing reads by the cellranger software. Single cell expression count matrices were analyzed using the Seurat R package. 39 Count matrices were merged and the merged data was normalized using the SCTransform function from the sctransform R package. 40 Mitochondrial RNA expression was regressed out before calculating the principal components. 41 Cell clustering was performed using the Uniform Manifold Approximation and Projection (UMAP) and t-distributed stochastic neighborhood embedding (t-SNE). 42, 43 Differentially expressed genes (DEGs) were calculated within each cell type using the FindAllMarkers function. 39 DEGs were also obtained using pooled counts of all cells per sample and analyzed using DeSeq2. 44. Pathway analysis for the transcriptional regulators (TRs) and growth factors was performed using Ingenuity Pathway Analysis (IPA). Gene ontology (GO) analysis was performed using the Enrichr. 45
Statistical methods:
Gaussian distribution was tested by the Shapiro-Wilk’s test. Normally distributed data were compared by unpaired t-test or one-way ANOVA, followed by Bonferroni multiple comparison tests. 46 Data that departed from a Gaussian distribution were compared by Kruskal-Wallis test. Survival rates were analyzed by Log-rank (Mantel-Cox) test.
RESULTS
Expression of WT1 in the postnatal and adult hearts:
Temporal expression of WT1 in the postnatal heart was analyzed at P2, P7, and P21 upon staining of myocardial sections for WT1 expression, which tags the epicardial cells. 31, 32 WT1 expression was progressively restricted to the epicardial cells during the postnatal period. 31 At P 2, ~7.34±0.97 % of the myocardial cells, located in the epicardium and the myocardium, expressed WT1 (Figure 1, A–C). By P7, WT1 expression was restricted mostly to the epicardial region and to a smaller fraction of intra-myocardial cells. By P21, however, WT1 expression was predominantly, if not exclusively, restricted to epicardial cells (Figure 1, A–C). Control panels for all the secondary antibodies are depicted in Figure IV in the Supplement.
Figure 1. Expression of WT1 and DSP in a subset of cardiac cells;
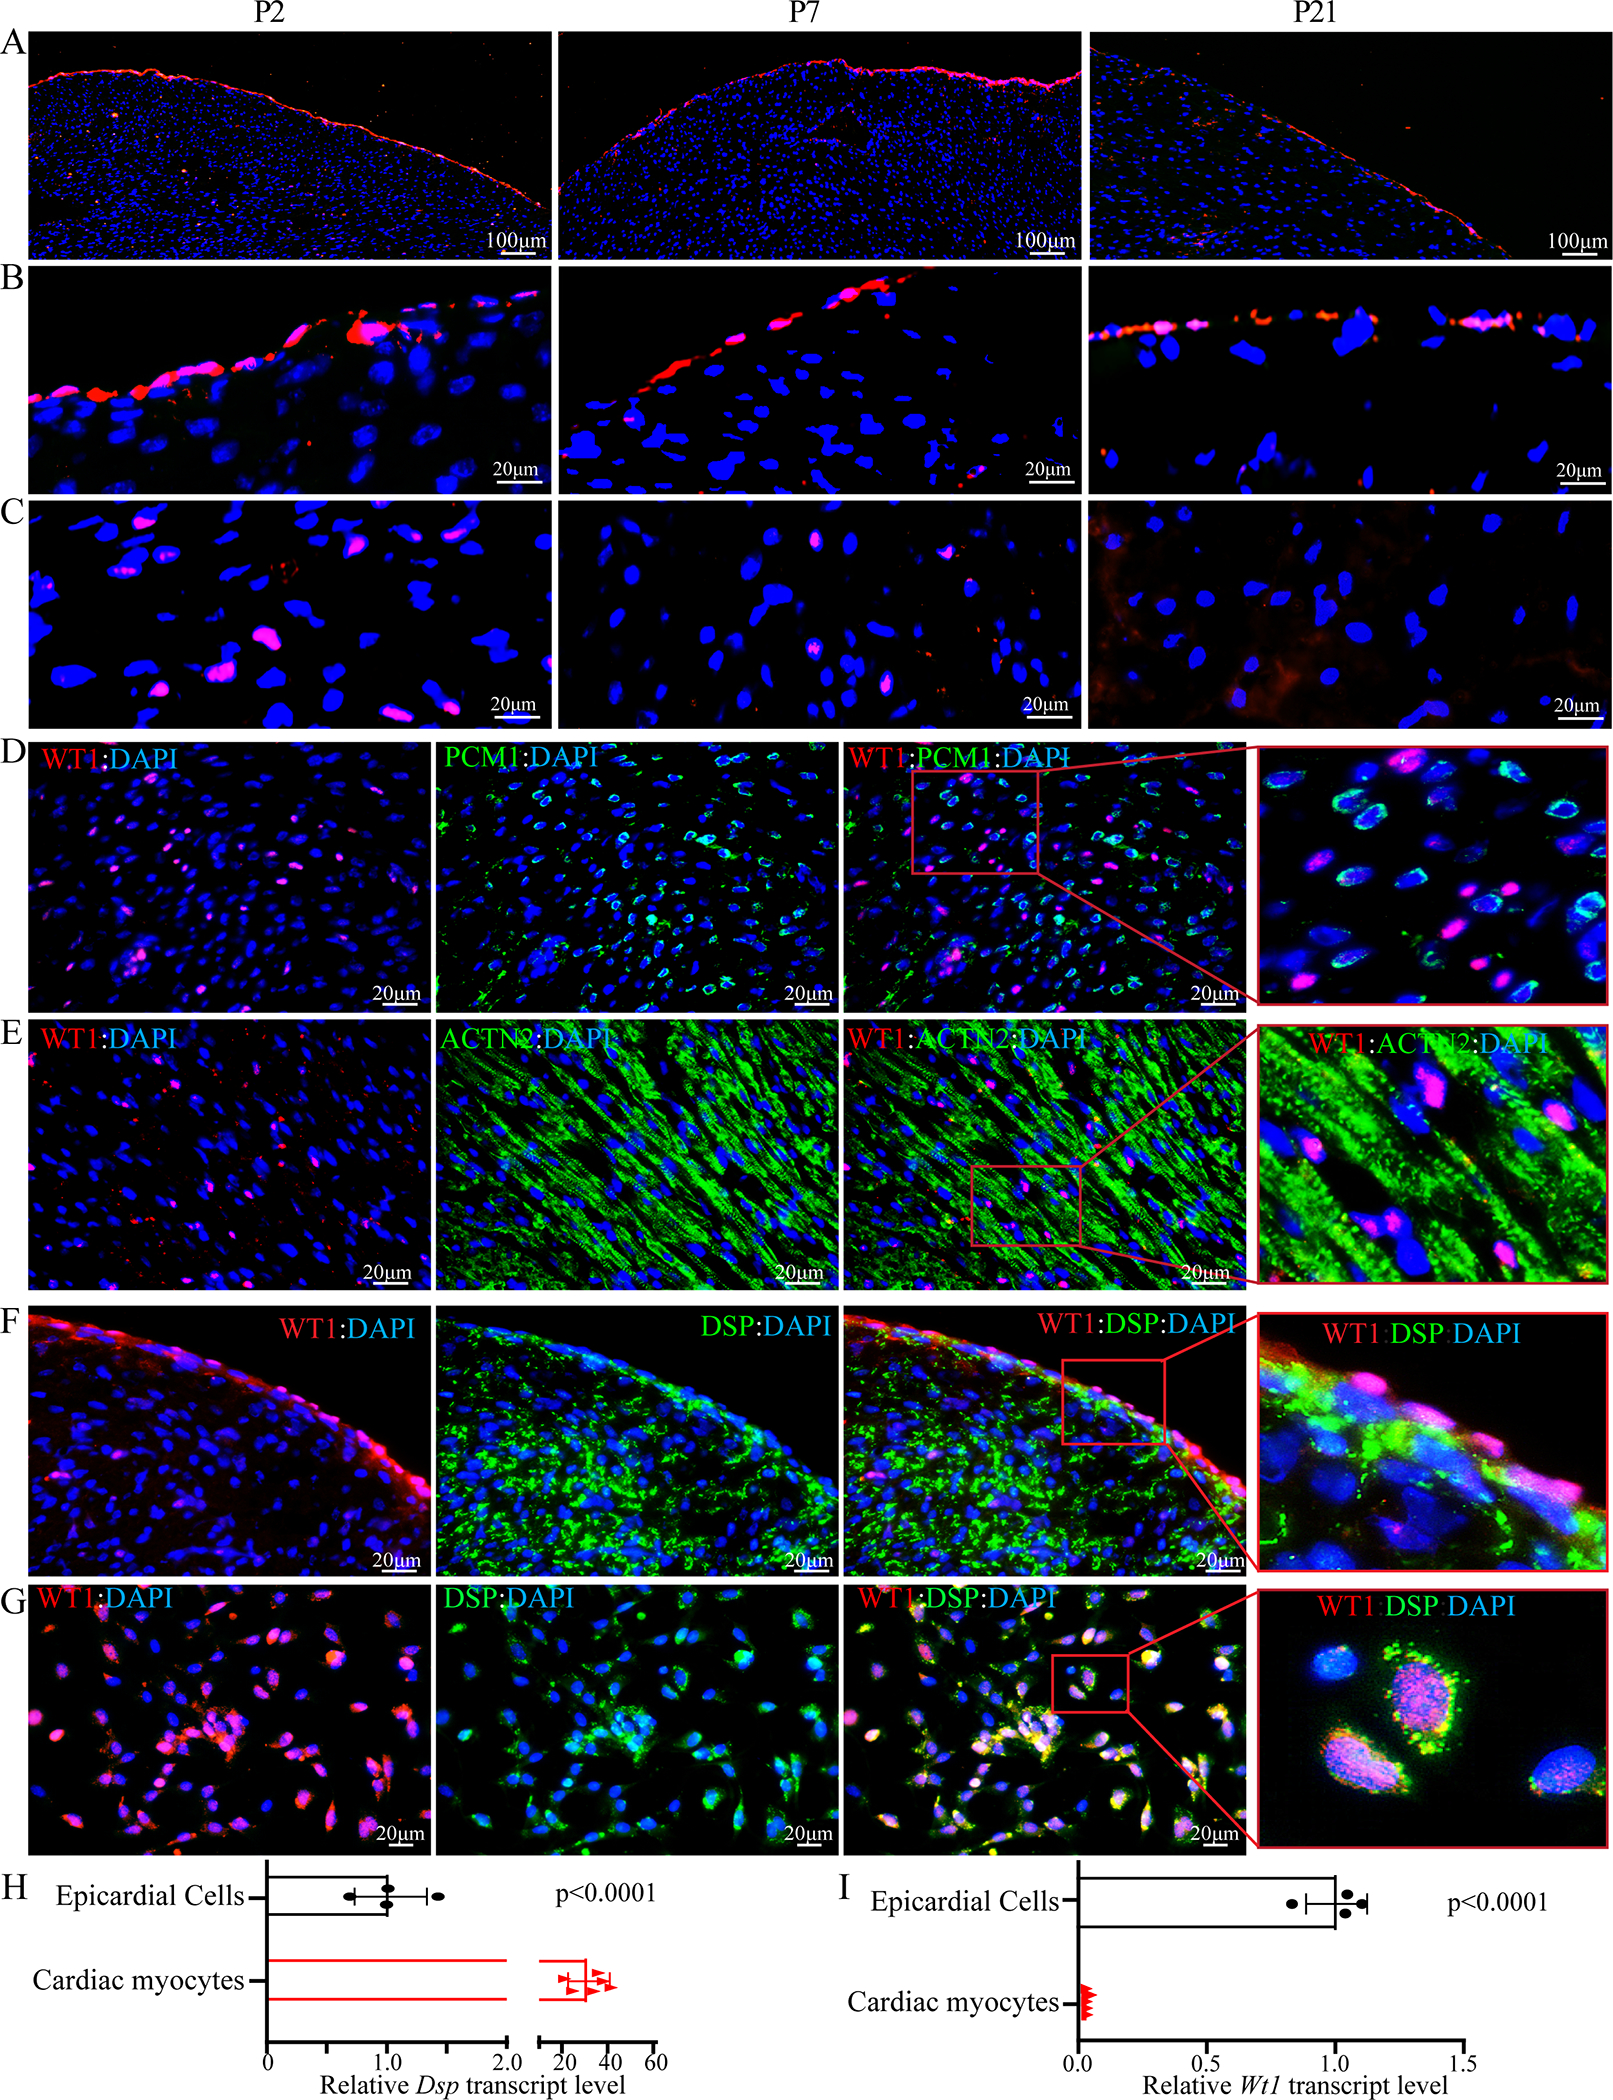
A. Low magnification immunofluorescence images depicting expression of WT1 (red), a marker of epicardial cells, in the postnatal day 2 (P2), day 7 (P7) and day 21 (P21) in the wild type (WT) mouse hearts. WT1 expression is progressively restricted with age, showing highest expression at P2 both in epicardium and myocardium. At P7, WT1 is predominantly expressed in the epicardium with few cells showing expression in the myocardium. However, at P21, WT1 expression is confined to few cells in the epicardium. Nuclei were counter stained with DAPI (blue).
B. High magnification immunofluorescence images depicting the expression of WT1 (red) protein in the epicardial region of thin myocardial sections obtained from P2, P7 and P21 mice (N=3 per group). Nuclei were stained with DAPI (blue).
C. High magnification immunofluorescence panels showing expression of WT1 in the intra myocardial cells (shown in red) at P2, P7 and P21. Nuclei were counterstained with DAPI (blue).
D. Co-staining of WT1 (red) and PCM1 (green), a marker of cardiac myocytes, in the myocardial sections obtained from P2 mouse hearts. An enlarged panel on the right side showing exclusive expression of PCM1 and WT1.
E. Immunofluorescence staining of myocardial sections from P2 mouse hearts with an antibody against WT1 (red) and ACTN2 (green), the latter also a marker of cardiac myocytes. Nuclei were stained with DAPI (blue). An enlarged panel shown on the right depicting absence of expression of WT1 in the cardiac myocytes.
F. Co-expression of WT1 (red) and DSP (green) in the epicardium and subepicardial regions of P2 mouse hearts. An enlarged panel is shown to the right, which illustrates expression of both proteins in the epicardial region. Nuclei were counterstained with DAPI (blue).
G. Co-Expression of WT1 (red) and DSP (green) proteins in the isolated epicardial cells, as detected by immunostaining with antibodies against WT1 and DSP proteins. Nuclei were counter stained with DAPI (blue). An enlarged panel is shown on the right side, which illustrates expression of DSP in the isolated epicardial cells, marked by the expression of WT1.
H. RT-PCR data depicting relative transcript levels of Dsp in the epicardial cells and cardiac myocytes (N=4 to 6 per group).
I. RT-PCR data depicting relative transcript levels of Wt1 in the epicardial cells and cardiac myocytes (N=4 to 6 per group).
To identify the cell types that expressed WT1, co-expression of WT1 with pericentriolar material 1 (PCM1) or α-actinin (ACTN2), to tag cardiac myocytes; platelet-derived growth factor receptor alpha (PDGFRA), a marker of fibroblasts; platelet and endothelial cell adhesion molecule 1 (PECAM1), to mark the endothelial cells (ECs); or myosin heavy chain 11 (MYH11) to identify smooth muscle cells (SMCs) was analyzed. WT1 was not expressed in cardiac myocytes at P2, P7 or P21 (Figure 1, D and E). At P2, ~74.7±2.9% and ~24.3±1.3% of cells expressing WT1 also expressed markers of the ECs and fibroblasts, respectively, whereas WT1 was rarely expressed in the SMCs (<1%, Figure V in the Supplement). At P7, expression of WT1 was reduced markedly and detected mostly in the ECs and fibroblasts located at the epicardium and sub-epicardium and rarely in the SMCs (Figure VI in the Supplement).
Expression of desmosome proteins in the mouse epicardial cells:
Co-expression of WT1 and DSP was detected in the epicardial region and EDCs located in the sub-epicardial regions (Figure 1F). Likewise, co-expression of WT1 and DSP was corroborated in isolated mouse epicardial cells, showing expression of DSP in ~68% of the epicardial cells (Figure 1G). Expression of Dsp mRNA was analyzed by RT-PCR in isolated mouse epicardial cells, which was ~3.25±0.95% of the corresponding level in adult cardiac myocytes (Figure 1H). In contrast, Wt1 was predominantly expressed in the epicardial cells and was undetectable in isolated adult cardiac myocytes (Figure 1I).
Co-expression of DSP and PECAM1 or PDGFRA was also analyzed in myocardial sections from P2 mice. Whereas PECAM1 and DSP as well as PDGFRA and DSP were co-expressed at the sub-epicardial region, DSP was not expressed in intra-myocardial ECs or fibroblasts (Figure VII in the Supplement). DSC2, DSG2, and PKP2 were also expressed in ~ 46%, 44%, and 37% of the isolated mouse epicardial cells, respectively (Figure VIII in the Supplement, A–C). In addition, Dsc2, Dsg2, and Pkp2 mRNA levels were quantified in isolated epicardial cells, which comprised ~ 6.5±1.9%, 8.7±3.6%, and 37.1±3.9% of the corresponding levels in adult cardiac myocytes, respectively (Figure VIII in the Supplement, D–F).
Conditional deletion of Dsp in the epicardial cells:
The Dsp gene in the epicardial cells was deleted upon administration of tamoxifen to the Wt1-CreERT2:DspW/F mice (Figure II in the Supplement). Transcript levels of the Dsp gene were reduced by ~45% in the Wt1-CreERT2:DspW/F as compared to the WT epicardial cells (Figure 2A). Dsp transcript levels in the WT and Wt1-CreERT2:DspW/F cardiac myocytes were unchanged, indicating fidelity of the system (Figure 2B). Staining of thin myocardial sections also showed intact expression and localization of the DSP protein in the myocardium (Figure 2C).
Figure 2. Conditional deletion of Dsp in epicardial cells phenocopies ACM.
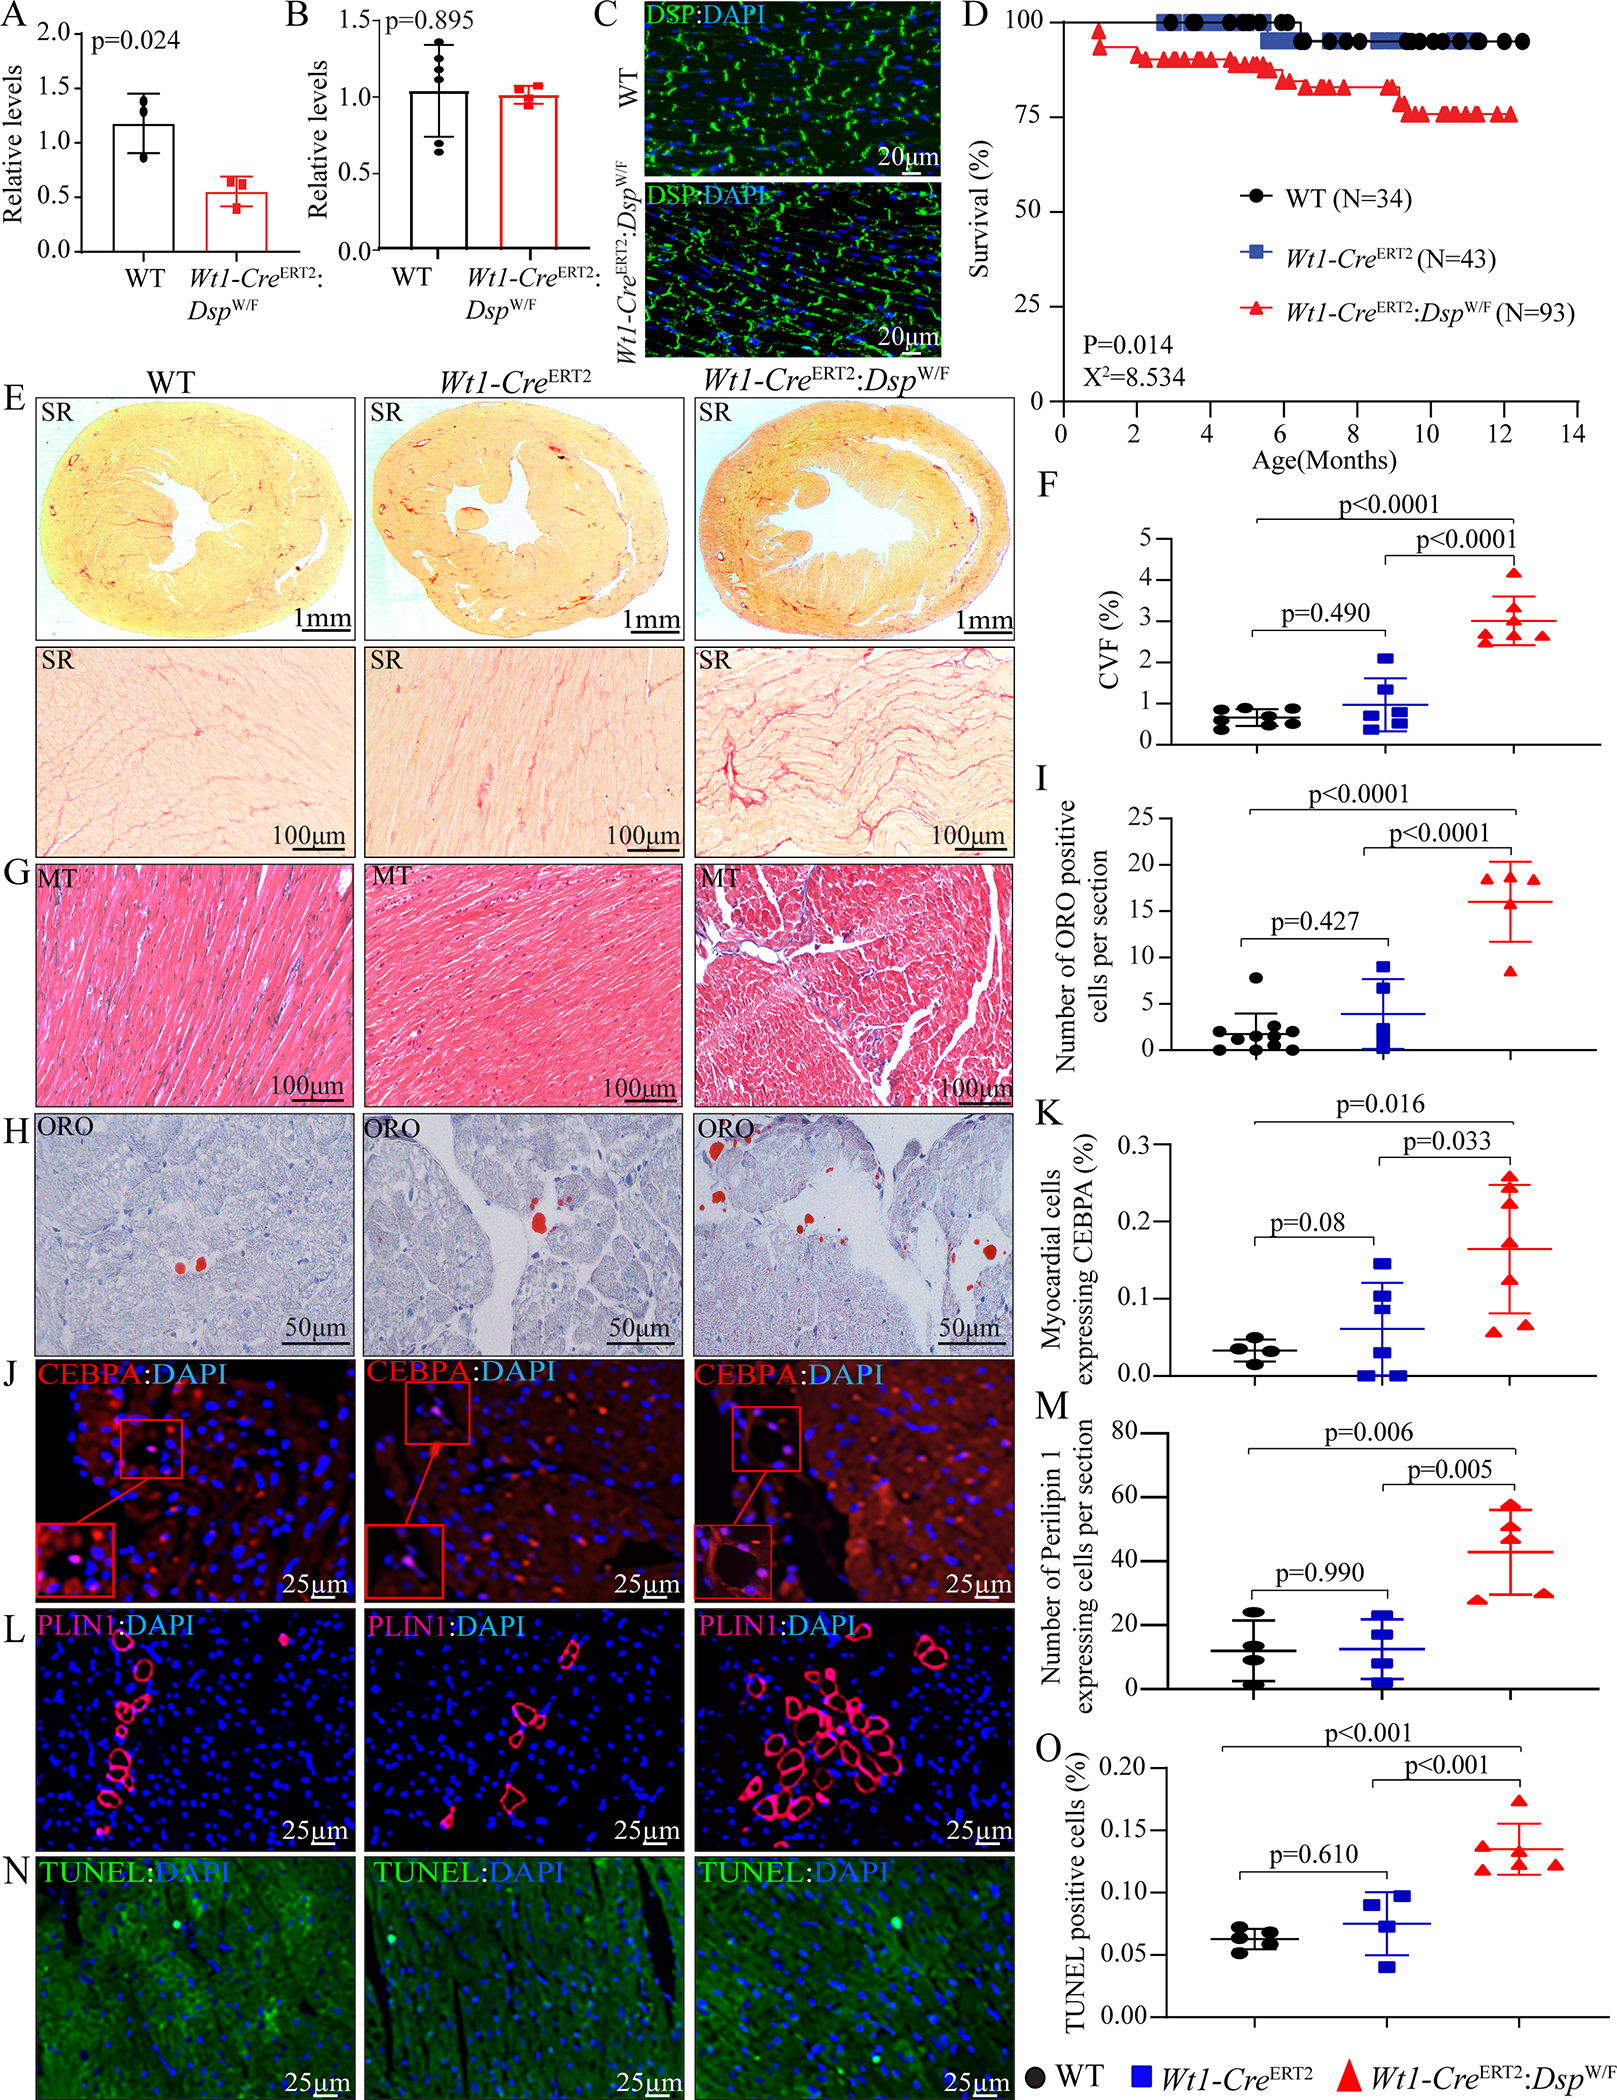
A. Relative mRNA expression levels of Dsp in epicardial cells isolated from wild type (WT) and Wt1-CreERT2: DspW/F mice at 3 months of age (N=3).
B. RT-PCR analysis of the Dsp transcripts in isolated cardiac myocytes of Wt1-CreERT2: DspW/F mice compared to the WT group at 3 months of age (N=4–6).
C. Immunofluorescence (IF) staining of thin myocardial sections showing intact DSP protein expression and localization at the intercalated discs in WT and Wt1-CreERT2: DspW/F groups.
D. Kaplan–Meier survival plot of WT (N=34), Wt1-CreERT2 (N=43), and Wt1-CreERT2:DspW/F (N=93) mice, the latter two groups treated with tamoxifen (30 mg/Kg/d) from P2 to P7.
E. Representative Picrosirius Red (SR) stained myocardial sections from 6-month-old WT, Wt1-CreERT2, and Wt1-CreERT2: DspW/F mice, the upper panel represents low magnification and the lower panel represents higher magnification.
F. Quantification of SR stained sections represented as collagen volume fraction (CVF) in WT (N=8), Wt1-CreERT2 (N=6), and Wt1-CreERT2:DspW/F(N=7) mice.
G. Representative Masson’s trichrome (MT)-stained myocardial sections from 6-month-old WT, Wt1-CreERT2, and Wt1-CreERT2: DspW/F mice.
H. Representative Oil Red O (ORO)-stained thin myocardial sections from 6-month-old WT, Wt1-CreERT2, and Wt1-CreERT2: DspW/F mice.
I. Quantitative data showing the number of Oil Red-O positive cells per section in WT (N=11), Wt1-CreERT2 (N=5), and Wt1-CreERT2: DspW/F (N=5) mice.
J. IF staining of thin myocardial sections for CEBPA (in red) in 6-month-old WT, Wt1-CreERT2, and Wt1-CreERT2: DspW/F mice. Nuclei were counterstained with DAPI (blue).
K. Quantitation of CEBPA positive myocardial cells in WT (N=4), Wt1-CreERT2(N=6), and Wt1-CreERT2:DspW/F(N=7) mice.
L. Representative IF staining of thin myocardial sections showing PLIN1 (far red color) in 6-month-old WT, Wt1-CreERT2, and Wt1-CreERT2: DspW/F. Nuclei were counterstained with DAPI (blue).
M. Quantitation of PLIN1 expressing cells in the myocardial section of WT (N=4), Wt1-CreERT2(N=4), and Wt1-CreERT2:DspW/F(N=5) mice.
N. IF staining of thin myocardial sections showing TUNEL positive cells (in green) in 6-month-old WT, Wt1-CreERT2, and Wt1-CreERT2: Dsp W/F mice. Nuclei were counterstained with DAPI (blue).
O. TUNEL positive cells in the myocardium of WT (N=5), Wt1-CreERT2 (N=4), and Wt1-CreERT2:DspW/F (N=6) mice.
Statistical significance was determined by unpaired student t-test in two-group comparisons and One- way ANOVA followed by Bonferroni pairwise comparison test in multiple groups. All ANOVA p values were < 0.001.
Survival:
The Wt1-CreERT2:DspW/F mice were born per the expected Mendelian ratio and survived normally within the first month of life. The mice showed a 22% mortality at 12 months of age, as compared to ~5% in the WT mice and tamoxifen-treated Wt1-CreERT2 mice (Figure 2D).
Gross morphology:
Gross heart morphology was normal and the heart weight/body weight ratios were similar among the groups (Figure IX in the Supplement).
Cardiac function:
The Wt1-CreERT2:DspW/F mice showed cardiac dilatation and dysfunction at ~6 months of age (Table II in the Supplement). Accordingly, left ventricular (LV) wall thickness was reduced and LV end diastolic diameter and end systolic diameter were increased. LV fractional shortening and ejection fraction were reduced.
Cardiac arrhythmias:
The Wt1-CreERT2:DspW/F mice exhibited paroxysmal supraventricular tachycardia, ventricular trigeminal rhythm, and second-degree atrioventricular blocks on surface electrocardiogram (Figure X in the Supplement).
Myocardial fibro-adipogenesis:
CVF comprised <1% of the myocardium in the WT and Wt1-CreERT2 mice, whereas it was increased to 3.00±0.59% in the Wt1-CreERT2:DspW/F mice (Figure 2, E-G).
Nomanski digital interference contrast (DIC) microscopy was used to define adipocyte silhouette (Figure XI in the Supplement, panel A). The number of ORO stained cells was increased in the Wt1-CreERT2:DspW/F mouse myocardium, as compared to WT and Wt1-CreERT2 mice (Figure 2, H and I). Similarly, the percent of cells expressing nuclear CEBPA or PLIN1 was increased in the Wt1-CreERT2:DspW/F mouse hearts (Figure 2, J-M). Adipocytes were located predominantly within the myocardium and seemed to be more common in the sub-endocardial region (Figure XI in the Supplement, panel B). Cardiac cells expressing CEBPA did not express F4/80, the latter a marker for macrophages, effectively excluding erroneous counting of macrophages as adipocytes (Figure XI in the Supplement, panels C–E).
Apoptosis:
The number of TUNEL stained nuclei was increased significantly in the Wt1-CreERT2:DspW/F mice, as compared to WT and Wt1-CreERT2 mice (Figure 2, N and O).
Phenotype in the Wt1-CreERT2:DspF/F mice:
Tamoxifen-induced postnatal homozygous deletion of the Dsp gene exclusively in the epicardial cells led to a phenotype similar to that in the heterozygous mice, albeit cardiac dysfunction, myocardial apoptosis, and fibrosis were more pronounced (Figure XII in the Supplement).
Fate mapping of the Dsp haplo-insufficient epicardial cells:
Recombination in the epicardial cells was induced upon tamoxifen injection to the Wt1-CreERT2-R26mT/mG:DspW/F mice from P2 to P7 (Figure III in the Supplement). Fidelity of the approach was assessed by detecting expression of the EGFP protein, which was detected only in the tamoxifen-treated group but not in the vehicle-treated mice, excluding potential leaky expression of the EGFP (Figure XIII in the Supplement). Likewise, potential fortuitous deletion of Dsp in cardiac myocytes was assessed by analyzing expression of the DSP protein in cardiac myocytes. There were no discernible changes on expression of the DSP protein and its localization to the IDs (Figure XIV in the Supplement). This finding is consistent with the data in the Wt1-CreERT2:DspW/F mice, showing normal levels of the Dsp transcripts and localization of DSP protein to the IDs (Figure 2, B and C).
The number of cells expressing EGFP was determined in 18,848 ± 5,317 cardiac cells. Expression of EGFP was detected in ~7.43±0.75% of the myocardial cells, identifying them as the EDCs (Figure 3, A and B). The number of EDCs was modestly increased in the Wt1-CreERT2:R26mT/mG:DspW/F as compared to the Wt1-CreERT2:R26mT/mG mouse hearts (7.43±0.75% vs 4.94±0.84, p=0.036 by Mann Whitney U test, Figure 3B). The EDCs were distributed throughout the myocardium and seemed to show a propensity to localize to mid-myocardial and sub-endocardial regions (Figure 3, C and D). The in vivo findings were corroborated upon staining of the isolated non-myocyte cell fraction from the Wt1-CreERT2:R26mT/mG mice for the expression of tdTomato and EGFP. Approximately ~3.6% of the cells in the non-myocyte fraction expressed EGFP, whereas 91.4% of the isolated cells in the non-myocyte cells expressed tdTomato (Figure 3, E and F).
Figure 3. Detection of membrane-bound EGFP positive epicardial derived cells (EDCs) under the control of Wt1 locus.
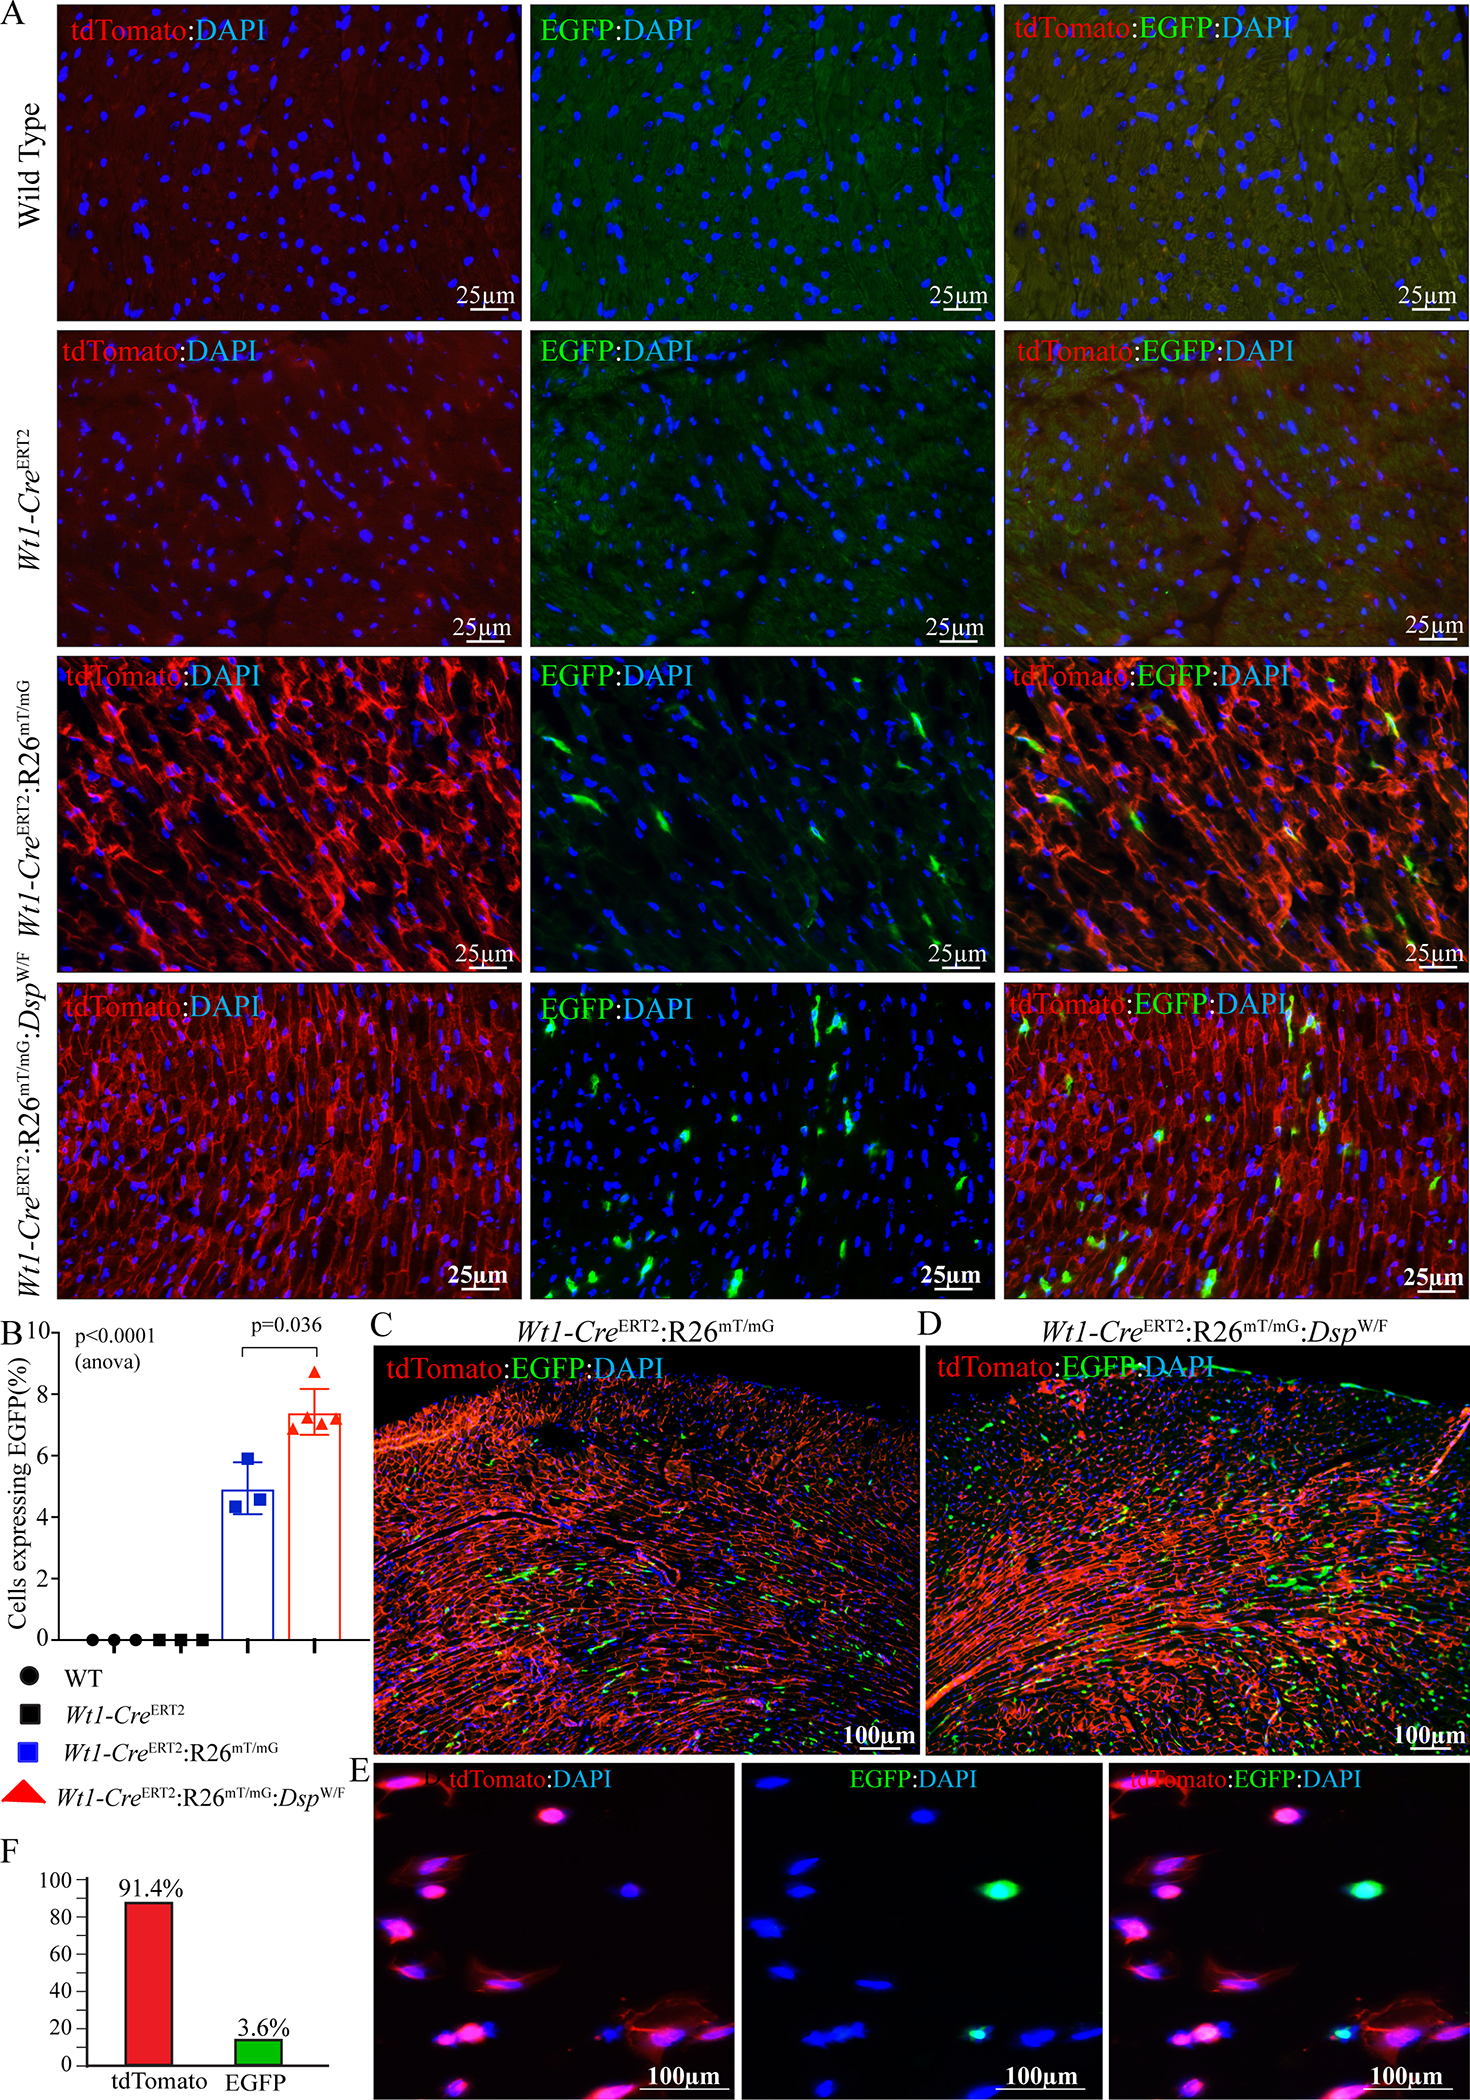
A. IF staining of thin myocardial sections showing membrane-bound td-Tomato (in red) and EGFP (in green) positive cells in 3–6 months old WT, Wt1-CreERT2, Wt1-CreERT2:R26mTmG, and Wt1-CreERT2:R26mTmG:DspW/F mice. Nuclei were counterstained with DAPI (blue). Mice were matched for the mean age and sex in all experiments.
B. EGFP positive cells quantified in the myocardium of WT (n=3), Wt1-CreERT2 (N=3), Wt1-CreERT2:R26mTmG (n=3), and Wt1-CreERT2:R26mTmG:DspW/F (N=5) mice.
C. Low magnification immunofluorescence panel showing distribution of the EGFP expressing cells within the Wt1-CreERT2:R26mTmG mouse heart.
D. Low magnification immunofluorescence panel showing distribution of the EGFP expressing cells within the Wt1-CreERT2:R26mTmG:DspW/F mouse heart.
E. IF staining of td-Tomato (in red) and EGFP (in green) positive cells in the non-myocyte fraction of 3–6 months old Wt1-CreERT2:R26mTmG:DspW/F hearts. Nuclei were counterstained with DAPI (blue).
F. Bar graph depicting percentage of the isolated epicardial cells from the Wt1-CreERT2:R26mTmG:DspW/F mouse hearts expressing only EGFP and tdTomato.
P values were determined by One-way ANOVA (shown) followed by Bonferroni pairwise comparison test (only those p<0.05 are shown).
The Wt1 locus is predominantly active during cardiac development. 31 To determine whether Wt1-Cre-mediated recombination also occurred in the adult hearts, tamoxifen (30mg/Kg/d x 5 days) was injected subcutaneously to 3–4 months old Wt1-CreERT2:R26mT/mG and Wt1-CreERT2:R26mT/mG:DspW/F mice followed by analysis of EGFP expression two months later. Rare cells expressing EGFP, located predominantly at the epicardium, were detected in the Wt1-CreERT2:R26mT/mG mouse hearts, indicating transcriptional activity of the Wt1 locus in a small fraction of the epicardial cells in the adult mouse hearts (Figure XV in the Supplement, Panel A). The number of EGFP expressing cells in the heart were not different between the two groups (Figure XV in the Supplement, Panel B).
ScRNA-Seq of EDCs:
EDCs were isolated by FACS from 4 months old Wt1-CreERT2:R26mT/mG and Wt1-CreERT2:R26mT/mG:DspW/F mouse hearts and analyzed by scRNA-Seq. Approximately, 1.1±0.39% and 1.6±2.6 of the sorted cells expressed EGFP in Wt1-CreERT2:R26mT/mG and Wt1-CreERT2:R26mT/mG:DspW/F groups, respectively (p=0.29 by Mann Whitney test). A representative FACS display is shown in Figure 4A. To avoid potential cellular impurity, resulting from the known overlap in the fluorescence signals of EGFP and tdTomato, only cells emitting EGFP but not tdTomato were collected for scRNA-Seq, which constituted 0.13%±0.03 and 0.20±0.07 of all sorted cells in the Wt1-CreERT2:R26mT/mG and Wt1-CreERT2:R26mT/mG:DspW/F mice, respectively (p=0.10. Figure 4B).
Figure 4. Isolation of tagged EDCs and single cell RNA-sequencing (scRNA-Seq).
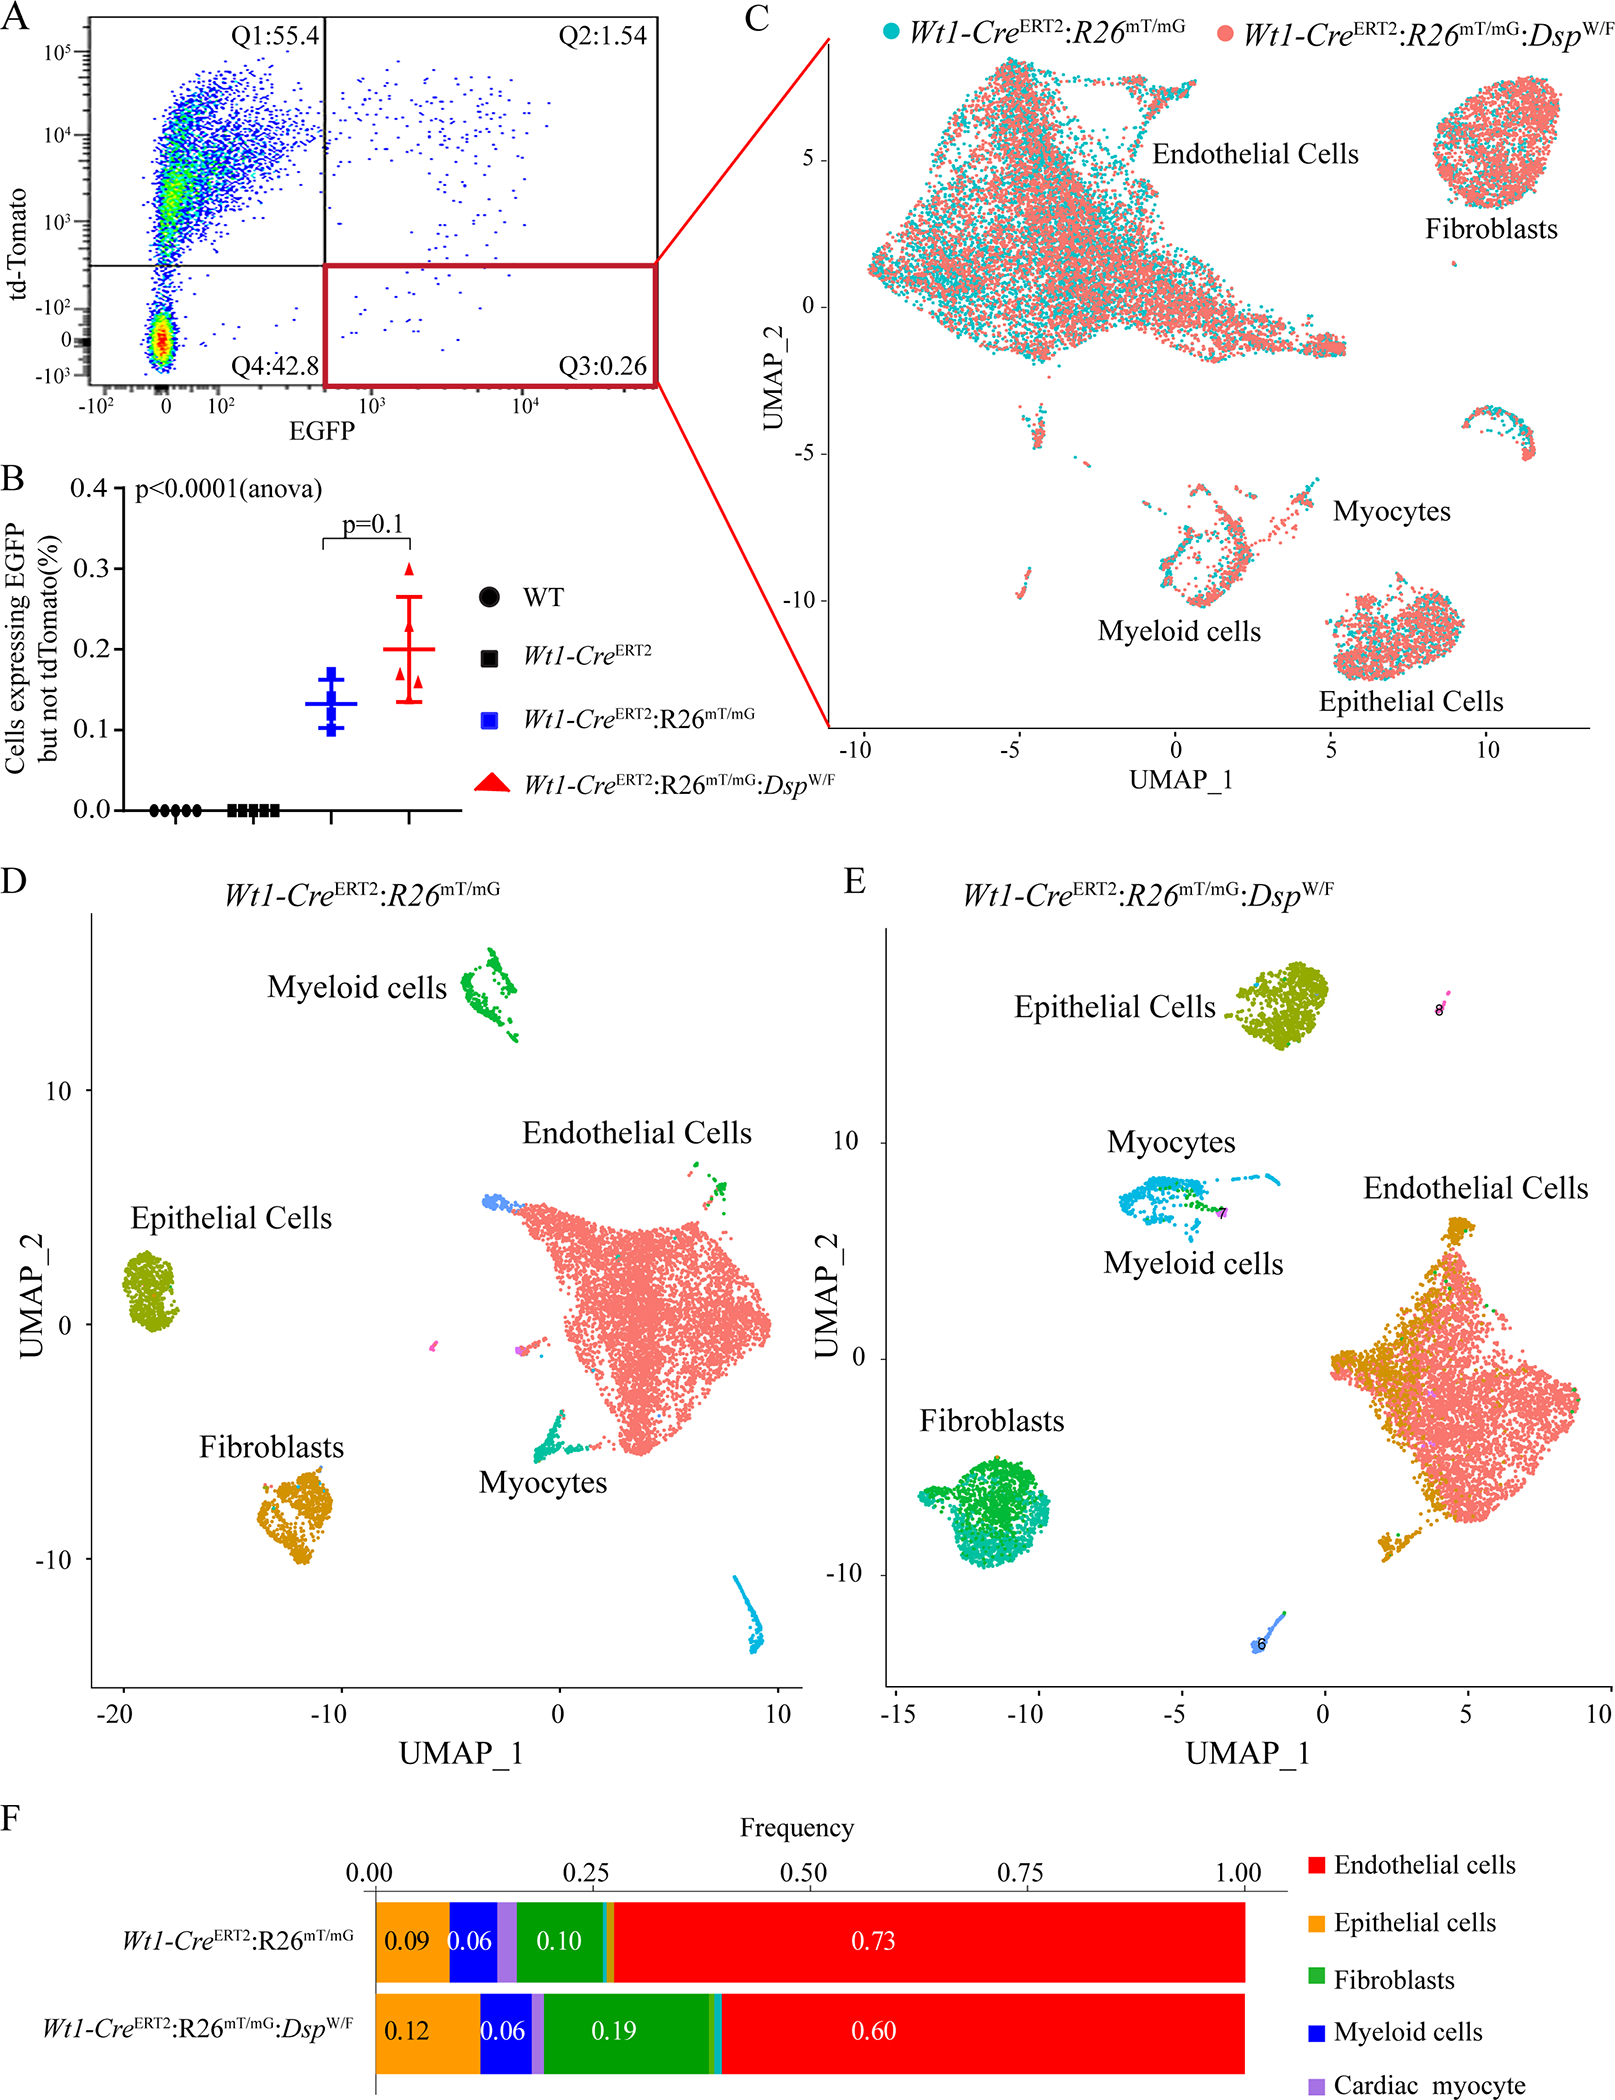
A. Fluorescent activated cell sorting (FACS) analysis of EGFP positive cells from the non-myocytes fraction of 3–6 months old Wt1-CreERT2:R26mTmG:DspW/F mice. Q1: td-Tomato positive cells; Q2: both td-Tomato and EGFP positive cells, which reflects the overlap of the fluorescence signals of EGFP and tdTomato; Q3: EGFP positive cells; Q4: td-Tomato and EGFP negative cells. Only cells in the Q3, which likely reflects a fraction of all recombined cells, were used for single cell RNA-Seq.
B. Quantitation of FACS data showing % EGFP positive cells sorted from WT (n=5), Wt1-CreERT2 (n=5), Wt1-CreERT2:R26mTmG (n=4), and Wt1-CreERT2:R26mTmG:DspW/F(n=5) mice.
C. Aggregated UMAP plot showing cell clusters from FACS sorted EGFP positive EDCs generated from Wt1-CreERT2: R26mTmG (n=3, shown in blue), and Wt1-CreERT2:R26mTmG:DspW/F (n=3, shown in red) mice. Three major clusters were identified after removal of the mitochondrial enriched cluster, includes endothelial cells, fibroblast, and epithelial cells. A very small cluster of cardiac myocytes in combination with various myeloid cells was also detected.
D. and E: UMAP plots of genotype-dependent cell clusters generated from Wt1-CreERT2:R26mTmG (N=3) and Wt1-CreERT2:R26mTmG:DspW/F (N=3) mice.
F. Column graph representing the frequency of cells in different cell clusters obtained from scRNA seq in EDCs derived from Wt1-CreERT2:R26mT/mG and Wt1-CreERT2:R26mT/mG:DspW/F mice.
A total of 18,283 EDCs was analyzed by scRNA-Seq from 6 hearts per genotype, comprised of 9,193 cells in the Wt1-CreERT2:R26mTmG and 9,090 cells in the Wt1-CreERT2:R26mT/mG:DspW/F mice (Table III in Supplement). The median sequencing depth was 95,342 (mean 106,574±25,237) reads per cell and the median alignment rate was 83.6±2.5% of the reads per cell. On average, transcripts of 1,297±355 genes were detected in each cell. Approximately 87.0±4.1% of the sequenced cells expressed the Egfp transcript whereas only 1.38±1.5% of the cells expressed the tdTomato transcript, indicating fidelity of the isolated cells for being bona fide EGFP expressing cells (Figure XVI in the Supplement). Following unsupervised dimension reduction using UMAP, good overlap across mouse replicates was observed (Figure XVII in the Supplement, Panel A). Moreover, additional quality metrics, including the number of cells sequenced, total unique molecular identifiers (UMI) counts, and the number of transcripts detected were comparable across the samples (Figure XVII in the Supplement, B–D). UMI counts did not affect the UMAP embedding, which excluded a confounding effect of the total UMI counts (Figure XVIII in the Supplement, panel A). Finally, cells with high levels of mitochondrial reads were excluded from further analysis (Figure XVIII in the Supplement, panel B).
The sequenced cells were clustered in aggregate according to the UMIs and the cell populations were visualized in the UMAP as well as in the tSNE plots. There was a near complete overlap in the cell clusters between the Wt1-CreERT2:R26mTmG and Wt1-CreERT2:R26mT/mG:DspW/F genotypes, indicating the absence of a unique genotype-specific cell cluster in the pooled data (Figure 4C). A similar pattern was observed when the data were visualized in the tSNE (Figure XIX in the Supplement).
Cell clusters were analyzed separately in each genotype, which also illustrated a similar set of clusters between the two genotypes, comprised of clusters of ECs, fibroblasts, epithelial cells, myeloid cells and cardiac myocytes (Figure 4, D-F). The most frequent cell type in each genotype was the ECs, marked by the expression of Pecam1, Tie1, Vwf, and Icam2 among others. The fibroblast cluster was characterized by the expression of Col1a1, Col3a1, Gsn, Tcf21, and Pdgfra among others and the epithelial cells by the expression of Wt1, Tbx18 and Krt19 genes among others (Figure 4, D-F). Despite identical cell clusters between the two genotypes, distribution frequencies of the cells in the clusters between the two genotypes differed (Figure 4F, p<0.0001). ECs constituted ~72.3±0.02% % and 59.2±0.07% of the cells in the Wt1-CreERT2:R26mTmG and Wt1-CreERT2:R26mT/mG:DspW/F genotypes, respectively (p=0.046, Figure 4F). Fibroblasts represented a higher percentages of cells in the Wt1-CreERT2:R26mT/mG:DspW/F mice as compared to the Wt1-CreERT2:R26mT/mG mice (19.0±0.02% vs. 9.9±0.01%, respectively, p=0.003, Figure 4F). The epithelial cells constituted about 10% of the cells sequenced in each genotype (Figure 4F). In the subsequent analyses of gene expression, the transcript levels were corrected for the number of cells to account for the differences in the number of cells between the genotypes.
A small sub-cluster of sequenced cells (0.40±0.1%) expressed the transcriptomic signature of cardiac myocytes, such as Ttn, Myh6, Actc1, Myl2, Pln, Myl3, Tnni3, Tnnc1, Ctnnt2, Fabp3, Tpm1, Atp2a2, and Nppa, among others (Figure XX in the Supplement, A–C). The gene expression profiles of these cardiac myocytes between the Wt1-CreERT2:R26mTmG and Wt1-CreERT2:R26mT/mG:DspW/F mice were not different. Further analysis of the myocyte clusters illustrated a distinct small sub-cluster of cells that expressed the majority of the cardiac myocyte-specific markers, including the top marker genes (Figure XX in the Supplement, panel D). Rare myocytes expressing EGFP, indicating an origin from cells transcriptionally regulated by the Wt1 locus, were also detected by immunofluorescence staining of cardiac myocytes isolated from the hearts of Wt1-CreERT2:R26mT/mG:DspW/F mice, further corroborating the scRNA-Seq data (Figure XX in the Supplement, panel E). The DEGs in the cardiac myocyte sub-cluster were enriched for the targets of NFE2L2, GATA4, and NKX2.5 TRs, among others (Figure XXI in the Supplement, panel A). Likewise, GO pathway analysis depicted active mitochondrial pathways involved in oxidative phosphorylation, electron chain transport, and metabolism (Figure XXI in the Supplement, panel B). Overall, the number of cells in the myocyte cluster was too small to make firm conclusions.
A small subset of cells (mean: 1.02 ± 0.48 %, range: 0.34 to 1.55%) expressed markers of SMCs, such as Acta2 (smooth muscle actin α2), Myh11 (myosin heavy chain 11), and Tagln (transgelin), which were distributed throughout the myocardium. Similarly, co-expression of EGFP and MYH11, the latter a smooth muscle marker, was in rare cells, located in the blood vessel walls (Figure XXII in the Supplement).
DEGs in the EC clusters:
Approximately 82.4±5.5% of the cells in the EC cluster expressed the Egfp transcript, indicating an origin from the epicardium (Figure 5A). Likewise, co-expression of EGFP and PECAM1 was detected in ~2/3rd of the ECs, which were localized throughout the myocardium (Figure 5B). Furthermore, transcripts of several bona fide markers of the ECs were mapped mainly to the EC clusters (Figure 5C). These data were in accord with immunofluorescence data showing that ~2/3rd of the cells expressing WT1 also expressed the EC marker PECAM1 at P2 (Figure V in the Supplement).
Figure 5. Differentially expressed genes (DEGs) in the EC cluster.

A. UMAP depicting Egfp transcript levels in cells mapped to the EC cluster, showing Egfp transcripts in the vast majority of the ECs.
B. Immunofluorescence panels showing co-expression of PECAM1 (blue), an EC marker, and EGFP (green), which identified the EDCs, showing co-expression of PECAM1 and EGFP in the myocardial section of Wt1-CreERT2:R26mT/mG:DspW/F mice. Nuclei were counterstained with DRAQ5 (far red)
C. Feature plot showing expression of selected endothelial cell-specific genes visualized on the UMAP plots, depicting their expression in the largest cluster.
D. Volcano plot showing upregulated and down-regulated transcript levels of DEGs in the endothelial cell clusters between Wt1-CreERT2:R26mT/mG and Wt1-CreERT2:R26mT/mG:DspW/F genotypes. Plots were constructed for DEGs that showed a log(2) fold change of 0.05 or greater in their transcript levels.
E. Violin plots of a dozen DEGs between the two genotypes depicting transcript levels as well as distribution of gene transcripts.
F. Dysregulated TRs as predicted by IPA in the endothelial cell cluster in the Wt1-CreERT2:R26mT/mG:DspW/F genotype.
G. Dysregulated trophic and mitotic factors in the endothelial cell cluster in the Wt1-CreERT2:R26mT/mG:DspW/F showing suppression of TGFβ1, FGF2 and TGFβ2.
Pairwise analysis of gene expression between the EC clusters in the two genotypes identified 222 DEGs (q<0.05), which included 61 upregulated and 161 downregulated genes in the Wt1-CreERT2:R26mT/mG:DspW/F genotype (Figure 5D). Differences in the transcript levels of a dozen selected DEGs are depicted as violin plots (Figure 5E). The DEGs were enriched for targets of TRIM24 as the top activated and were depleted for GATA6, as the most suppressed TRs (Figure 5F). Likewise, the DEGs predicted suppression of TGFβ1, FGF2, and TGFβ2 (Figure 5G). The predicted dysregulated biological pathways are depicted in Figure XXIII in the Supplement.
DEGs in the fibroblast clusters:
Approximately 83.0±5.6% of the cells in the fibroblast cluster expressed the Egfp transcript (Figure 6A). Co-expression of EGFP and PDGFRA was detected in ~24% of the myocardial cells, indicating an origin of this subset of the fibroblasts from the epicardium (Figure 6B), which is consistent with detection of expression of the WT1 in ~25% of the cardiac fibroblasts (Figure V in the Supplement). Transcript levels of several known makers of fibroblasts, such as Pdgfra, Tcf21, and Col1a1 showed predominant localization to the fibroblast clusters (Figure 6C).
Figure 6. DEGs in the fibroblast cluster.

A. UMAP depicting Egfp transcript levels in cells mapped to the fibroblast cluster, showing Egfp transcripts in the vast majority of the fibroblasts.
B. Immunofluorescence panels showing co-expression of PDGFRA (blue), a fibroblast marker, and EGFP (green), which identifies the EDCs, showing co-expression of PDGFRA and EGFP in the myocardial sections of Wt1-CreERT2:R26mT/mG:DspW/F mice. Nuclei were counterstained with DRAQ5 (far red).
C. Feature plot showing expression of selected fibroblast-specific genes visualized on the UMAP plots, depicting their expression in the epithelial cluster.
D. Volcano plot showing upregulated and down-regulated transcript levels of DEGs in the fibroblast clusters between Wt1-CreERT2:R26mT/mG and Wt1-CreERT2:R26mT/mG:DspW/F genotypes. Plots were constructed for DEGs that showed a log(2) fold change of 0.05 or greater in their transcript levels.
E. Violin plots of a dozen DEGs between the two genotypes depicting transcript levels as well as distribution.
F. Dysregulated TRs as predicted by IPA in the fibroblast cluster in the Wt1-CreERT2:R26mT/mG:DspW/F genotype.
G. Dysregulated trophic and mitotic factors in the fibroblast cluster in the Wt1-CreERT2:R26mT/mG:DspW/F showing activation of the TGFβ1 pathway.
Pairwise analysis of gene expression in the fibroblast clusters between the two genotypes identified 58 DEGs (50 upregulated and 8 downregulated) in the Wt1-CreERT2:R26mT/mG:DspW/F mice (Figure 6D). Transcript levels of several selected DEGs are plotted as violin plots (Figure 6E). IPA analysis showed reduced transcript levels of PPARGC1A targets whereas those of NFKB1A and ATF4 were increased (Figure 6F). The DEGs predicted activation of the TGFβ1 as the top trophic and mitotic factor in the Wt1-CreERT2:R26mT/mG:DspW/F genotype (Figure 6G).
DEGs in the epithelial clusters:
Approximately 92.2±3.7% of the cells mapped to the epithelial clusters expressed the Egfp transcript (Figure 7A). Expression of EGFP was detected in a subset of the epithelial cells, identified by the expression of MSLN, which were localized at the epicardium (Figure 7B). Several markers of the epithelial cells, such as Upk3b, Wt1 and Krt8, were mapped exclusively to the epithelial cluster (Figure 7C). Pairwise analysis showed differential expression of 70 genes (40 upregulated and 30 downregulated) in the Wt1-CreERT2:R26mT/mG:DspW/F genotype (Figure 7D). Transcript levels of selected DEGs are depicted in the violin plots (Figure 7E). IPA analysis predicted activation of XBP1 and suppression of SATB2 TRs as well as activation of TGFβ1 and FGFs, as the paracrine factors (Figure 7, F and G).
Figure 7. DEGs in the epithelial cell clusters.
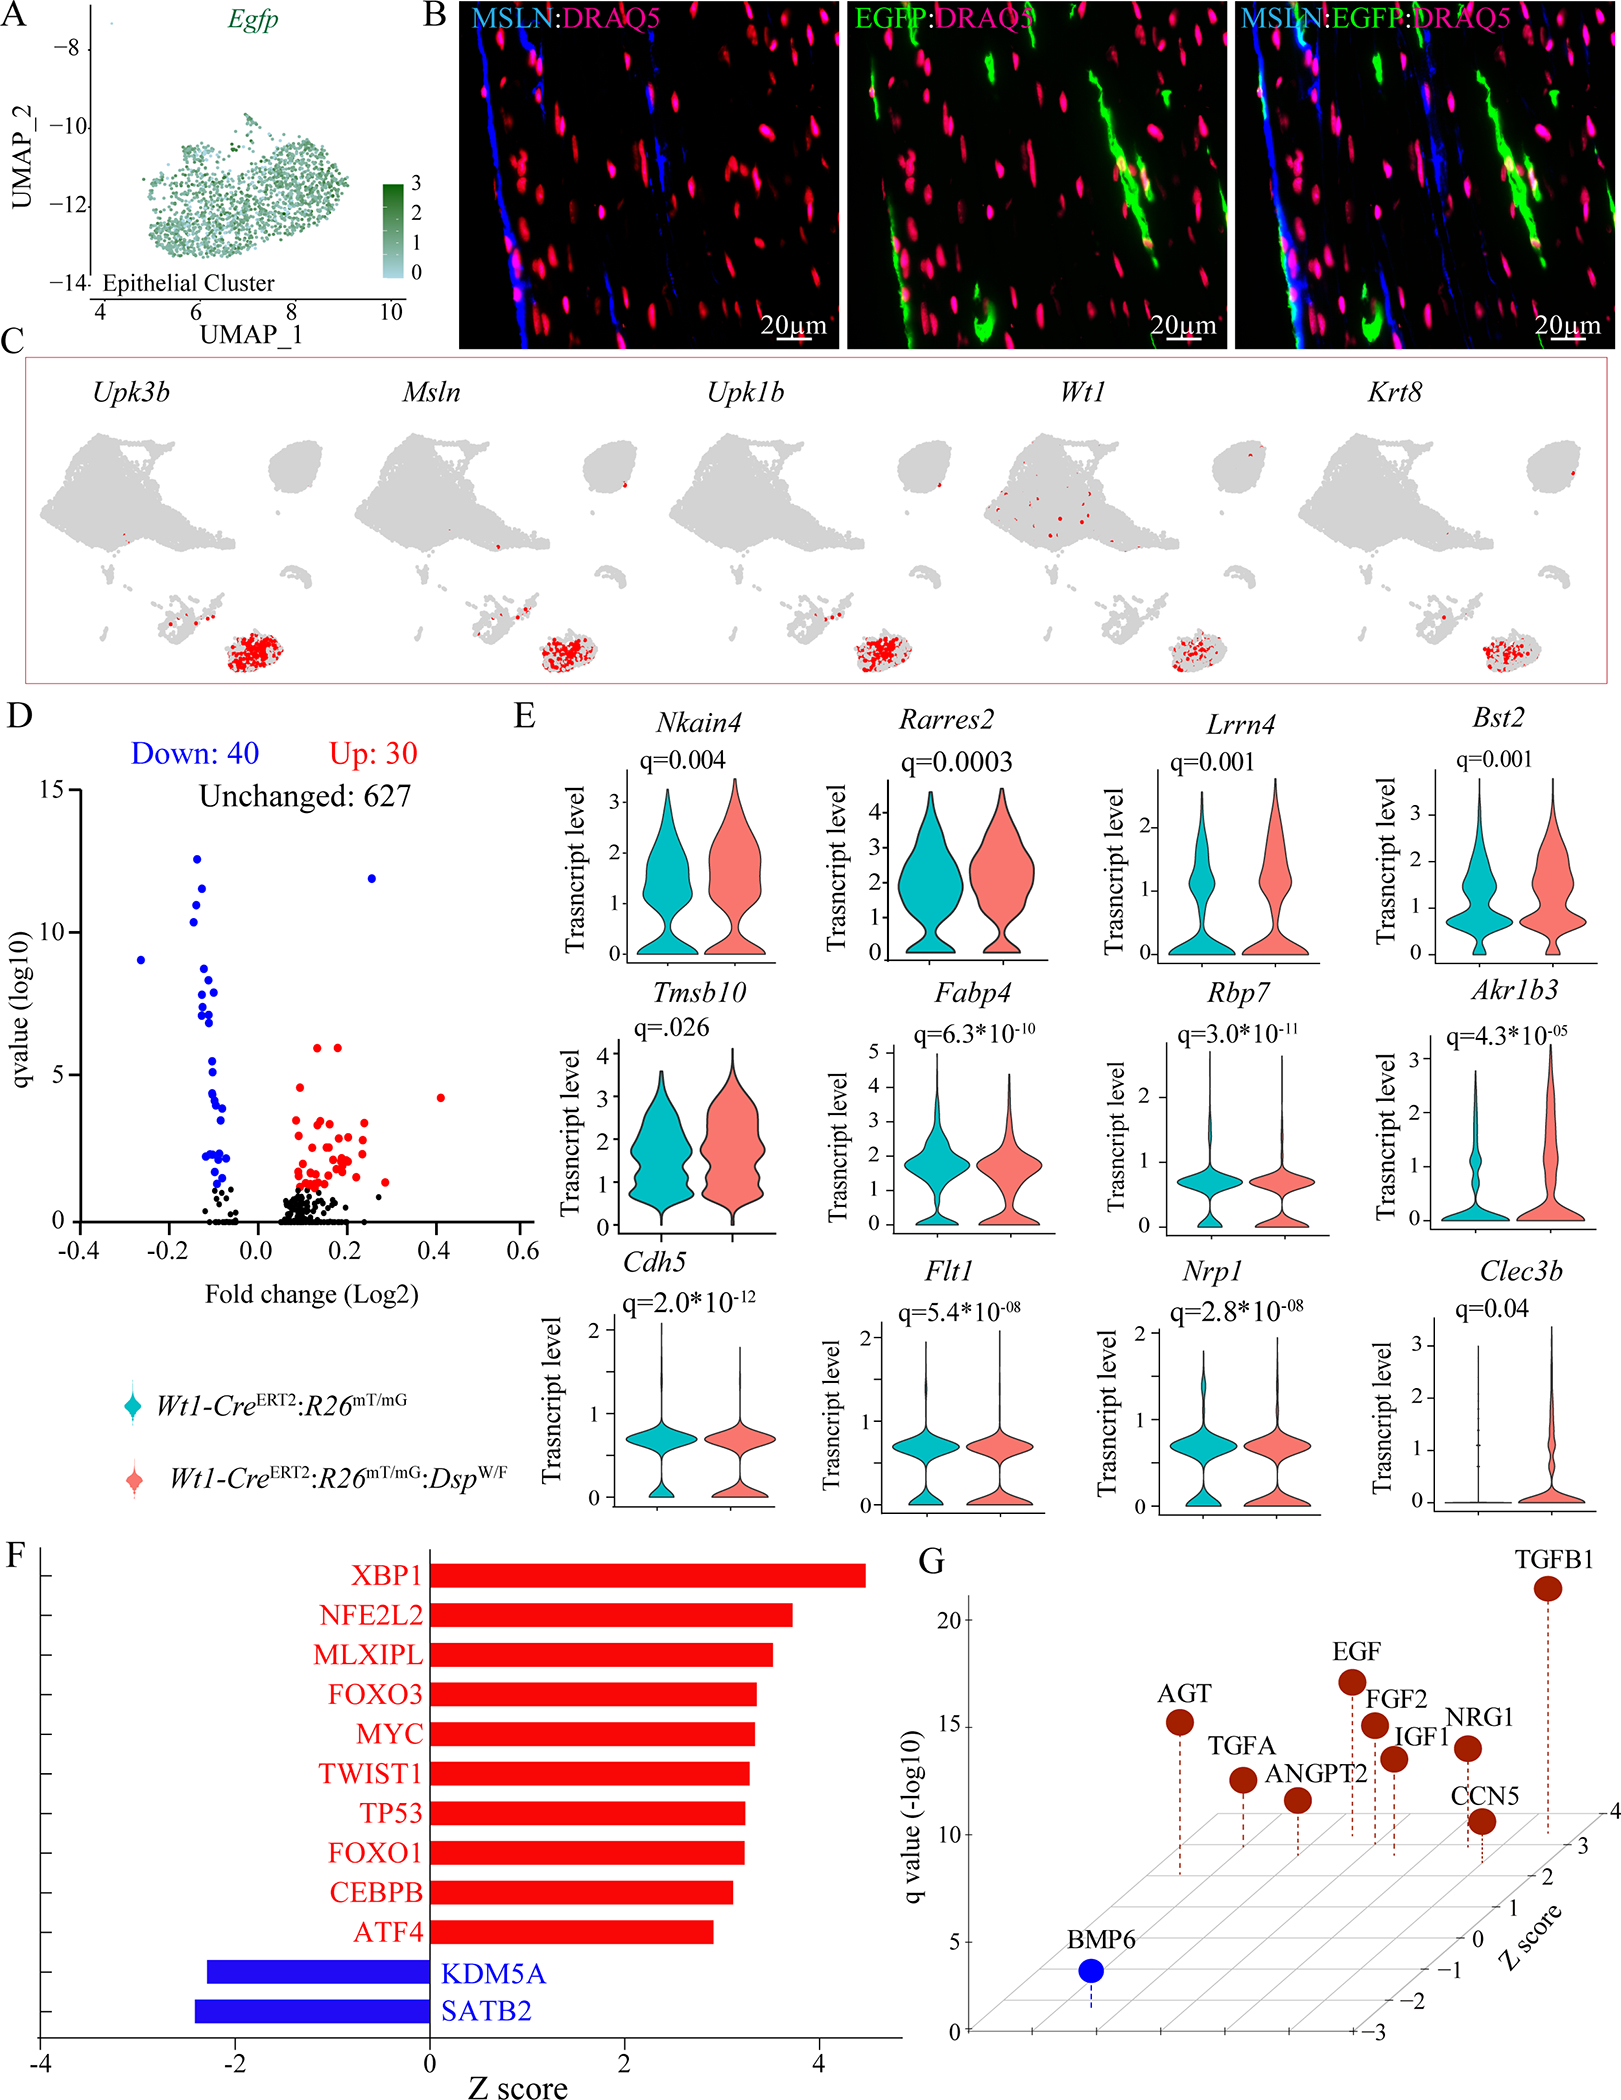
A. UMAP depicting Egfp transcript levels in cells mapped to the epithelial cell cluster, showing Egfp transcripts in the vast majority of the epithelial cells.
B. Immunofluorescence panels showing co-expression of MSLN (blue) tagging epithelial cells and EGFP (green), which identified EDCs in the epicardium of Wt1-CreERT2:R26mT/mG:DspW/F mice.
C. Feature plot showing expression of selected epithelial cell specific genes visualized on the UMAP plots depicting their expression in the epithelial cell cluster.
D. Volcano plot showing DEGs in the epithelial cell clusters between Wt1-CreERT2:R26mT/mG and Wt1-CreERT2:R26mT/mG:DspW/F genotypes.
E. Violin plots of a dozen DEGs between the two genotypes depicting transcript levels as well as the number of cells expressing the transcripts.
F. Dysregulated TRs as predicted by IPA from the DEGs (p<0.05) in the epithelial cell cluster in the Wt1-CreERT2:R26mT/mG:DspW/F genotype.
G. Dysregulated trophic and mitotic factors in the epithelial cell cluster in the Wt1-CreERT2:R26mT/mG:DspW/F predicting activation of the TGFβ1 pathway.
Analysis of the pooled scRNA-Seq data:
The RNA-Seq data from all cells within a sample were pooled and analyzed to identify the DEGs between the genotypes. Principle Component Analysis (PCA) showed distinct genotype-dependent segregation of the samples (Figure XIV in the Supplement). The DEGs included 124 downregulated and 648 upregulated transcripts in the Wt1-CreERT2:R26mT/mG:DspW/F as compared to the Wt1-CreERT2:R26mT/mG mice (Figure XXV in the Supplement, panel A). The DEGs predicted activation of TGFB1, TWIST1, and STAT4 and suppression of NOTCH1, SMAD7, and PPARGC1A TRs (Figure XXV in the Supplement, panel B). The DEGs were predominantly involved in epithelial-mesenchymal transition (EMT), as reflected in their enrichment in pathways pertaining to extracellular matrix organization and deposition (Figure XXV in the Supplement, panel C). A heat map of DEGs involved in EMT is presented in Figure XXV in the Supplement, panel D. Transcript levels of 10 genes involved in EMT were quantified by RT-PCR in an independent set of EDCs, which showed increased levels, concordant with the scRNA-Seq data (Figure XXV in the Supplement, panel E). To determine activation of the EMT program in the fibroblasts, transcript levels of the DEGs involved in EMT were depicted in each cell in the cluster per genotype, which identified a subset of epicardial-derived fibroblasts as the main cell source of expression of the EMT markers in the Wt1-CreERT2:R26mT/mG:DspW/F mice (Figure XXVI in the Supplement).
The epicardium is known to express secreted paracrine factors. 30, 47 Therefore, DEGs were analyzed for genes whose encoded proteins are expected to be secreted (secretome). A total of 146/772 (18.9%) of the DEGs encoded secretome, indicating a significant enrichment as compared to the estimated genome wide prevalence of 6.9% (2,334/33,389, p<0.0001). A heat map of the DEGs encoding the secretome is shown in Figure 8A. To delineate the cell source of the secretome, the DEGs were mapped to the cell clusters, which showed increased expression in the fibroblast and epithelial clusters but suppressed expression in the EC cluster, largely concordant with those observed for the EMT (Figure 8B). The DEGs encoding secretome were enriched for targets of TGFβ1, AGT, and CTNNB1 among others, whereas they were depleted for PPARGC1A, TAF2, and NEUROG1 targets (Figure 8C).
Figure 8. Identification and validation of secretome related DEGs in the EDCs.

A. Heat map of DEGs encoding secreted proteins (secretome) from EDCs of Wt1-CreERT2: R26mT/mG and Wt1-CreERT2: R26mT/mG: DspW/F mice obtained from analysis of pooled scRNA-Seq samples.
B. Circos map of DEGs encoding secretome in the major clusters showing activation of a subset of the DEGs in the fibroblast and epithelial clusters and their suppression in the endothelial cluster.
C. Predicted activation and suppression of the TRs and trophic/mitotic factors based on the DEGs encoding secretome
D. RT-PCR validation of TGFβ1 target genes in the whole heart tissue of 6 month old WT (n=4), Wt1-CreERT2 (n=4), and Wt1-CreERT2:DspW/F (n=4) mice. p-values were determined by One-way ANOVA followed by Bonferroni pairwise comparison test.
E. Representative Immunohistochemistry panels showing the expression of TGFβ proteins in the myocardium of 6 month old WT, Wt1-CreERT2, and Wt1-CreERT2:DspW/F mice.
F. Immunofluorescence panels showing thin myocardial sections stained for the co-expression of TGFβ (blue) and EGFP (green), showing expression of the TGFβ1 in cells expressing EGFP in the myocardial sections from the Wt1-CreERT2:R26mT/mG:DspW/F mice. Nuclei were counterstained with DRAQ5 (far red)
G. Thin myocardial sections immune-stained for the expression of COL1A1 (blue), a maker for fibroblasts/fibrosis and EGFP (green), showing partial co-expression in the myocardial sections from the Wt1-CreERT2:Rosa26mT/mG:DspW/F mice. Nuclei were counterstained with DRAQ5 (far red).
Given the predominance of the TGFβ1 pathway in multiple sets of analyses and in view of involvement of the DEGs in the secretome and EMT, transcript levels of selected genes in the TGFβ1 pathway were quantified by RT-PCR in an independent set of EDCs, which confirmed increased transcript levels of over a dozen genes (Figure 8D). Likewise, genes in the TGFβ1 network were predominantly upregulated (Figure XXVII in the Supplement). Furthermore, activation of the TGFβ1 pathway was verified upon staining of thin myocardial sections with an anti TGFβ antibody (Figure 8E and Figure XXVIII in the Supplement). To determine contributions of the EDCs to myocardial fibrosis, myocardial sections were co-stained for the expression of EGFP and markers of fibrosis. A subset of EDCs, identified by the expression of EGFP, also expressed TGFβ (Figure 8F). Likewise, expression of EGFP was detected in cells that expressed COL1A1, depicting areas of myocardial fibrosis (Figure 8G). The data, collectively, indicated increased expression levels of the paracrine factors, such as TGFβ1 from the epicardial-derived fibroblasts in the Wt1-CreERT2:R26mT/mG:DspW/F mouse hearts.
DISCUSSION
The findings delineate the enigmatic role of the epicardium in the pathogenesis of cardiac phenotype in a mouse model of ACM, generated upon heterozygous deletion of the Dsp gene specifically in the epicardial cells. Accordingly, a subset of the epicardial-derived fibroblasts and epithelial cells express and secret trophic and mitotic factors, such as TGFβ1, which induce EMT and contribute to the pathogenesis of myocardial fibrosis, apoptosis, and cardiac dysfunction.
The findings of scRNA-Seq were compelling for the number of cells that were sequenced and the depth of the sequencing reads. Cell clustering, analyzed by two different computational platforms, was consistent among mice and was not platform-specific. The findings on the origin of a subset of ECs and fibroblasts from the epicardial cells are consistent with the previous data. 48 The preponderance of the ECs in the scRNA-Seq data partly reflects their origin from the epicardium and partly the process of sorting and selecting the single cells for sequencing. 49 Clustering of the EDCs was not distinct between the two genotypes, however, the cell composition differed, as the number of epicardial derived-fibroblasts was two-fold higher in the Wt1-CreERT2:R26mT/mG:DspW/F mice. The findings are also in accord with the well-established role of the epicardium in expressing paracrine factors in response to myocardial injury and with the clinical observation on initiation of fibro-adipogenesis in the epicardium in ACM 30, 47 Furthermore, increased TGFβ1 activity, enhanced EMT, excess myocardial fibrosis and increased apoptosis in the Wt1-CreERT2:R26mT/mG:DspW/F mice are also in accord with the pro-fibrotic myocardial phenotype observed in ACM caused by the DSP mutations. 10
Stringent criteria were applied in selecting cells for scRNA-Seq, which might have skewed the findings. Given that the EGFP and tdTomato fluorescence emittance partially overlap, only a subset of cells that expressed only EGFP but not tdTomato were selected for the scRNA-Seq. Consequently, a significant portion of the EDCs were excluded, which might have influenced the findings. Overall, EDCs constituted approximately 5 to 10% of the myocardial cells per immunofluorescence staining of thin myocardial sections.
An unexpected finding of the scRNA-Seq data was identification of a small subset of EDCs that expressed molecular markers of cardiac myocytes. The true number of epicardial-derived cardiac myocytes might be under-estimated, because the large size of mature myocytes hinders their isolation by the current microfluidic techniques. Nevertheless, the number of epicardial-derived myocytes was too small, both in the scRNA-Seq data and in immunofluorescence staining of myocardial sections, to infer their contributions to the phenotype. In general, clinical data suggest that cardiac remodeling post-myocardial infarction is negligible, when infarct size is small. 50, 51 Therefore, the scant number of epicardial-derived myocytes is not expected to contribute significantly to cardiac phenotype in the Wt1-CreERT2:R26mT/mG:DspW/F mice.
The desmosome proteins, including DSP, are predominantly and abundantly expressed in cardiac myocytes and, at much lower levels, in the epicardial cells, conduction system cells, and the progenitor cells. 17, 18, 38, 52 In contrast, desmosome proteins are not expressed in differentiated cardiac fibroblasts, smooth muscle cells, or the endothelial cells. 17 Consequently, the phenotype of cardiac dysfunction and arrhythmias in the human ACM mainly results from cardiac myocytes harboring the causal mutation. 20 Deletion of the Dsp gene exclusively in the epicardial cells by design would not be expected to fully recapitulate the phenotype of ACM but provide insights into the specific role of the epicardium in the pathogenesis of ACM phenotype.
In general, the mouse models do not fully recapitulate the human phenotype of ACM, particularly the fibro-adipogenesis, which is the pathological hallmark of a subset of human ACM. The Wt1-CreERT2:DspW/F mice showed increased fibrosis as well as an increased number of intra-myocardial adipocytes. Whereas the scRNA-Seq identified an epicardial origin of fibroblasts, it did not indicate an epicardial origin of the adipocytes. Excess adipocytes in the hearts of Wt1-CreERT2:DspW/F mice might be a consequence of increased expression of the paracrine factors. The Wt1-CreERT2:DspW/F mice showed cardiac arrhythmias and atrioventricular blocks during ECG monitoring but not malignant arrhythmias. The absence of malignant arrhythmias is not unexpected and might reflect limited rhythm monitoring. The findings are in accord with the current understanding that cardiac myocytes and conduction cells are the main cell sources of serious cardiac arrhythmias in ACM. 17,18, 20 Changes in the myocardial architecture due to fibrosis in conjunction with the expression and secretion of the paracrine factors from the EDCs might also contribute to cardiac arrhythmias and dysfunction in ACM. Overall, as would be expected, the phenotype in the Wt1-CreERT2:DspW/F mice is milder than that observed upon heterozygous deletion of Dsp in cardiac myocytes. 20, 35
The mechanism(s) by which heterozygous deletion of Dsp in the epicardial cells, which affected ~7% of the myocardial cells, led to the cardiac phenotype in the Wt1-CreERT2:DspW/F mice was not elucidated. It is plausible that haploinsufficiency of Dsp in the epicardial cells, through yet-to-be-defined mechanisms, imparts a biological signature(s) in the EDCs, such as altered mechanical stress, intra-cellular signaling, and/or chromatin conformation, which leads to differential expression of several hundred genes, including those encoding mitotic and trophic paracrine factors, such as the TGFβ1 and FGFs, which have well-established roles in the pathogenesis of myocardial pathology, including hereditary cardiomyopathies. 53–55
In conclusion, epicardial cells express desmosome proteins and deletion of Dsp, encoding desmoplakin, in the epicardial cells leads to myocardial fibro-adipogenesis, apoptosis, cardiac dysfunction, and premature death. Dsp haplo-insufficient epicardial cells give rise to ECs, fibroblasts, epithelial cells that express and secret paracrine factors, such as TGFβ1, which mediate EMT and contribute to the pathogenesis of cardiac phenotype in ACM.
Supplementary Material
CLINICAL PERSPECTIVE.
What is new?
Heterozygous deletion of the Dsp gene, encoding desmoplakin, in mice leads to premature death, cardiac dysfunction, myocardial apoptosis and fibrosis, albeit the phenotype is milder than the heterozygous deletion of the Dsp gene in cardiac myocytes.
Single cell RNA sequencing showed that haplo-insufficient epicardial-derived cells give rise to endothelial cells, fibroblasts, epithelial cells and a small fraction of cardiac myocytes.
Haplo-insufficient epicardial-derived cells express and secrete mitotic and trophic paracrine factors (secretome) that contribute to the pathogenesis of the cardiac phenotype in arrhythmogenic cardiomyopathy.
What are the clinical implications?
The findings provide insights into the enigmatic role of the epicardium in the pathogenesis of arrhythmogenic cardiomyopathy.
The differentially expressed secretome might serve as biomarkers and therapeutic targets in arrhythmogenic cardiomyopathy.
Acknowledgments
Dr. Ping Yuan is a PhD candidate from the Second Affiliated Hospital of Nanchang University, China. She was financially supported in part by grants from the National Key R&D Program of China (2017YFC1307804) to Kui Hong, and the China Scholarship Council/CSC.
Funding Sources
This work was supported in part by grants from NIH, National Heart, Lung and Blood Institute (NHLBI, 1R01HL132401, R01HL151737, and S10 OD018135), Leducq Foundation (14 CVD 03), NIA (R21 AG060413-01), The Ewing Halsell Foundation, George and Mary Josephine Hamman Foundation, TexGen Fund from Greater Houston Community Foundation. Dr. Simon and Dr. Zhao were partially supported by the Cancer Prevention and Research Institute of Texas (CPRIT RP180734).
Nonstandard abbreviations and acronyms;
- ACM
Arrhythmogenic cardiomyopathy
- ACTN2
α-actinin
- ARVC
Arrhythmogenic right ventricular cardiomyopathy
- CEBPA
CCAAT enhancer-binding protein alpha
- CVF
Collagen volume fraction
- DEGs
Differentially expressed genes
- DSC2
Desmocollin 2
- DSG2
Desmoglein 2
- DSP
Desmoplakin
- ECs
Endothelial cells
- EDCs
Epicardial-derived cells
- EMT
Epithelial-mesenchymal transition
- LV
Left ventricle
- MYH11
Myosin heavy chain 11
- ORO
Oil red O
- PCM1
Pericentriolar material 1
- PDGFRA
Platelet-derived growth factor receptor alpha
- PECAM1
Platelet and endothelial cell adhesion molecule 1
- PKP2
Plakophilin 2
- PLIN1
Perilipin 1
- RNA-Seq
RNA sequencing
- scRNA-Seq
Single cell RNA-sequencing
- SMC
Smooth muscle cells
- TRs
Transcriptional regulators
- TUNEL
Terminal deoxynucleotidyl transferase dUTP nick end labeling
- UMI
Unique molecular identifiers
- WT
Wild type
- WT1
Wilms tumor 1
Footnotes
Disclosure
The authors declare that there is no actual or perceived potential conflict of interest and there has been none during the last two years.
REFERENCES
- 1.Corrado D, Basso C and Judge DP. Arrhythmogenic Cardiomyopathy. Circ Res. 2017;121:784–802. [DOI] [PubMed] [Google Scholar]
- 2.Gandjbakhch E, Redheuil A, Pousset F, Charron P and Frank R. Clinical Diagnosis, Imaging, and Genetics of Arrhythmogenic Right Ventricular Cardiomyopathy/Dysplasia: JACC State-of-the-Art Review. J Am Coll Cardiol. 2018;72:784–804. [DOI] [PubMed] [Google Scholar]
- 3.Finocchiaro G, Papadakis M, Robertus JL, Dhutia H, Steriotis AK, Tome M, Mellor G, Merghani A, Malhotra A, Behr E, et al. Etiology of Sudden Death in Sports: Insights From a United Kingdom Regional Registry. J Am Coll Cardiol. 2016;67:2108–2115. [DOI] [PubMed] [Google Scholar]
- 4.Thiene G, Nava A, Corrado D, Rossi L and Pennelli N. Right ventricular cardiomyopathy and sudden death in young people. N Engl J Med. 1988;318:129–133. [DOI] [PubMed] [Google Scholar]
- 5.Corrado D, Basso C, Thiene G, McKenna WJ, Davies MJ, Fontaliran F, Nava A, Silvestri F, Blomstrom-Lundqvist C, Wlodarska EK, et al. Spectrum of clinicopathologic manifestations of arrhythmogenic right ventricular cardiomyopathy/dysplasia: a multicenter study. J Am Coll Cardiol. 1997;30:1512–1520. [DOI] [PubMed] [Google Scholar]
- 6.Basso C, Thiene G, Corrado D, Angelini A, Nava A and Valente M. Arrhythmogenic right ventricular cardiomyopathy. Dysplasia, dystrophy, or myocarditis? Circulation. 1996;94:983–991. [DOI] [PubMed] [Google Scholar]
- 7.Bhonsale A, Groeneweg JA, James CA, Dooijes D, Tichnell C, Jongbloed JD, Murray B, te Riele AS, van den Berg MP, Bikker H, et al. Impact of genotype on clinical course in arrhythmogenic right ventricular dysplasia/cardiomyopathy-associated mutation carriers. Eur Heart J. 2015;36:847–855. [DOI] [PubMed] [Google Scholar]
- 8.Castelletti S, Vischer AS, Syrris P, Crotti L, Spazzolini C, Ghidoni A, Parati G, Jenkins S, Kotta MC, McKenna WJ, et al. Desmoplakin missense and non-missense mutations in arrhythmogenic right ventricular cardiomyopathy: Genotype-phenotype correlation. Int J Cardiol. 2017;249:268–273. [DOI] [PubMed] [Google Scholar]
- 9.Augusto JB, Eiros R, Nakou E, Moura-Ferreira S, Treibel TA, Captur G, Akhtar MM, Protonotarios A, Gossios TD, Savvatis K, et al. Dilated cardiomyopathy and arrhythmogenic left ventricular cardiomyopathy: a comprehensive genotype-imaging phenotype study. Eur Heart J Cardiovasc Imaging. 2020;21:326–336. [DOI] [PubMed] [Google Scholar]
- 10.Smith ED, Lakdawala NK, Papoutsidakis N, Aubert G, Mazzanti A, McCanta AC, Agarwal PP, Arscott P, Dellefave-Castillo LM, Vorovich EE, et al. Desmoplakin Cardiomyopathy, a Fibrotic and Inflammatory Form of Cardiomyopathy Distinct From Typical Dilated or Arrhythmogenic Right Ventricular Cardiomyopathy. Circulation. 2020;141:1872–1884. [DOI] [PMC free article] [PubMed] [Google Scholar]
- 11.Cipriani A, Bauce B, De Lazzari M, Rigato I, Bariani R, Meneghin S, Pilichou K, Motta R, Aliberti C, Thiene G, et al. Arrhythmogenic Right Ventricular Cardiomyopathy: Characterization of Left Ventricular Phenotype and Differential Diagnosis With Dilated Cardiomyopathy. J Am Heart Assoc. 2020;9:e014628. [DOI] [PMC free article] [PubMed] [Google Scholar]
- 12.Haas J, Frese KS, Peil B, Kloos W, Keller A, Nietsch R, Feng Z, Muller S, Kayvanpour E, Vogel B, et al. Atlas of the clinical genetics of human dilated cardiomyopathy. Eur Heart J. 2015;36:1123–1135a. [DOI] [PubMed] [Google Scholar]
- 13.Fressart V, Duthoit G, Donal E, Probst V, Deharo JC, Chevalier P, Klug D, Dubourg O, Delacretaz E, Cosnay P, et al. Desmosomal gene analysis in arrhythmogenic right ventricular dysplasia/cardiomyopathy: spectrum of mutations and clinical impact in practice. Europace. 2010;12:861–868. [DOI] [PubMed] [Google Scholar]
- 14.Gerull B, Heuser A, Wichter T, Paul M, Basson CT, McDermott DA, Lerman BB, Markowitz SM, Ellinor PT, MacRae CA, et al. Mutations in the desmosomal protein plakophilin-2 are common in arrhythmogenic right ventricular cardiomyopathy. Nat Genet. 2004;36:1162–1164. [DOI] [PubMed] [Google Scholar]
- 15.Corrado D, Link MS and Calkins H. Arrhythmogenic Right Ventricular Cardiomyopathy. N Engl J Med. 2017;376:61–72. [DOI] [PubMed] [Google Scholar]
- 16.Matthes SA, Taffet S and Delmar M. Plakophilin-2 and the migration, differentiation and transformation of cells derived from the epicardium of neonatal rat hearts. Cell Commun Adhes. 2011;18:73–84. [DOI] [PMC free article] [PubMed] [Google Scholar]
- 17.Lombardi R, Chen SN, Ruggiero A, Gurha P, Czernuszewicz GZ, Willerson JT and Marian AJ. Cardiac Fibro-Adipocyte Progenitors Express Desmosome Proteins and Preferentially Differentiate to Adipocytes Upon Deletion of the Desmoplakin Gene. Circ Res. 2016;119:41–54. [DOI] [PMC free article] [PubMed] [Google Scholar]
- 18.Karmouch J, Zhou QQ, Miyake CY, Lombardi R, Kretzschmar K, Bannier-Helaouet M, Clevers H, Wehrens XHT, Willerson JT and Marian AJ. Distinct Cellular Basis for Early Cardiac Arrhythmias, the Cardinal Manifestation of Arrhythmogenic Cardiomyopathy, and the Skin Phenotype of Cardiocutaneous Syndromes. Circ Res. 2017;121:1346–1359. [DOI] [PMC free article] [PubMed] [Google Scholar]
- 19.Broussard JA, Getsios S and Green KJ. Desmosome regulation and signaling in disease. Cell Tissue Res. 2015;360:501–512. [DOI] [PMC free article] [PubMed] [Google Scholar]
- 20.Garcia-Gras E, Lombardi R, Giocondo MJ, Willerson JT, Schneider MD, Khoury DS and Marian AJ. Suppression of canonical Wnt/beta-catenin signaling by nuclear plakoglobin recapitulates phenotype of arrhythmogenic right ventricular cardiomyopathy. J Clin Invest. 2006;116:2012–2021. [DOI] [PMC free article] [PubMed] [Google Scholar]
- 21.Chen SN, Gurha P, Lombardi R, Ruggiero A, Willerson JT and Marian AJ. The hippo pathway is activated and is a causal mechanism for adipogenesis in arrhythmogenic cardiomyopathy. Circ Res. 2014;114:454–468. [DOI] [PMC free article] [PubMed] [Google Scholar]
- 22.Karaman R and Halder G. Cell Junctions in Hippo Signaling. Cold Spring Harb Perspect Biol. 2018;10:a028753. [DOI] [PMC free article] [PubMed] [Google Scholar]
- 23.von Gise A, Zhou B, Honor LB, Ma Q, Petryk A and Pu WT. WT1 regulates epicardial epithelial to mesenchymal transition through beta-catenin and retinoic acid signaling pathways. Dev Biol. 2011;356:421–431. [DOI] [PMC free article] [PubMed] [Google Scholar]
- 24.Phillips MD, Mukhopadhyay M, Poscablo C and Westphal H. Dkk1 and Dkk2 regulate epicardial specification during mouse heart development. Int J Cardiol. 2011;150:186–92. [DOI] [PMC free article] [PubMed] [Google Scholar]
- 25.Cortes C, Francou A, De Bono C and Kelly RG. Epithelial Properties of the Second Heart Field. Circ Res. 2018;122:142–154. [DOI] [PubMed] [Google Scholar]
- 26.Smart N, Bollini S, Dube KN, Vieira JM, Zhou B, Riegler J, Price AN, Lythgoe MF, Davidson S, Yellon D, et al. Myocardial regeneration: expanding the repertoire of thymosin beta4 in the ischemic heart. Ann N Y Acad Sci. 2012;1269:92–101. [DOI] [PMC free article] [PubMed] [Google Scholar]
- 27.Wei K, Serpooshan V, Hurtado C, Diez-Cunado M, Zhao M, Maruyama S, Zhu W, Fajardo G, Noseda M, Nakamura K, et al. Epicardial FSTL1 reconstitution regenerates the adult mammalian heart. Nature. 2015;525:479–485. [DOI] [PMC free article] [PubMed] [Google Scholar]
- 28.Zhou B, von Gise A, Ma Q, Hu YW and Pu WT. Genetic fate mapping demonstrates contribution of epicardium-derived cells to the annulus fibrosis of the mammalian heart. Dev Biol. 2010;338:251–261. [DOI] [PMC free article] [PubMed] [Google Scholar]
- 29.Kikuchi K, Gupta V, Wang J, Holdway JE, Wills AA, Fang Y and Poss KD. tcf21+ epicardial cells adopt non-myocardial fates during zebrafish heart development and regeneration. Development. 2011;138:2895–2902. [DOI] [PMC free article] [PubMed] [Google Scholar]
- 30.Zhou B, Honor LB, He H, Ma Q, Oh JH, Butterfield C, Lin RZ, Melero-Martin JM, Dolmatova E, Duffy HS, Gise A, et al. Adult mouse epicardium modulates myocardial injury by secreting paracrine factors. J Clin Invest. 2011;121:1894–1904. [DOI] [PMC free article] [PubMed] [Google Scholar]
- 31.Zhou B and Pu WT. Genetic Cre-loxP assessment of epicardial cell fate using Wt1-driven Cre alleles. Circ Res. 2012;111:e276–80. [DOI] [PMC free article] [PubMed] [Google Scholar]
- 32.Vieira JM, Howard S, Villa Del Campo C, Bollini S, Dube KN, Masters M, Barnette DN, Rohling M, Sun X, Hankins LE, et al. BRG1-SWI/SNF-dependent regulation of the Wt1 transcriptional landscape mediates epicardial activity during heart development and disease. Nat Commun. 2017;8:16034. [DOI] [PMC free article] [PubMed] [Google Scholar]
- 33.Muzumdar MD, Tasic B, Miyamichi K, Li L and Luo L. A global double-fluorescent Cre reporter mouse. Genesis. 2007;45:593–605. [DOI] [PubMed] [Google Scholar]
- 34.Chen SN, Lombardi R, Karmouch J, Tsai JY, Czernuszewicz G, Taylor MRG, Mestroni L, Coarfa C, Gurha P and Marian AJ. DNA Damage Response/TP53 Pathway Is Activated and Contributes to the Pathogenesis of Dilated Cardiomyopathy Associated With LMNA (Lamin A/C) Mutations. Circ Res. 2019;124:856–873. [DOI] [PMC free article] [PubMed] [Google Scholar]
- 35.Cheedipudi SM, Hu J, Fan S, Yuan P, Karmouch J, Czernuszewicz G, Robertson MJ, Coarfa C, Hong K, Yao Y, Campbell H, Wehrens X, Gurha P and Marian AJ. Exercise restores dysregulated gene expression in a mouse model of arrhythmogenic cardiomyopathy. Cardiovasc Res. 2020;116:1199–1213. [DOI] [PMC free article] [PubMed] [Google Scholar]
- 36.Auguste G, Gurha P, Lombardi R, Coarfa C, Willerson JT and Marian AJ. Suppression of Activated FOXO Transcription Factors in the Heart Prolongs Survival in a Mouse Model of Laminopathies. Circ Res. 2018;122:678–692. [DOI] [PMC free article] [PubMed] [Google Scholar]
- 37.Auguste G, Rouhi L, Matkovich SJ, Coarfa C, Robertson MJ, Czernuszewicz G, Gurha P and Marian AJ. BET bromodomain inhibition attenuates cardiac phenotype in myocyte-specific lamin A/C-deficient mice. J Clin Invest. 2020;130:4740–4758. [DOI] [PMC free article] [PubMed] [Google Scholar]
- 38.Lombardi R, Dong J, Rodriguez G, Bell A, Leung TK, Schwartz RJ, Willerson JT, Brugada R and Marian AJ. Genetic fate mapping identifies second heart field progenitor cells as a source of adipocytes in arrhythmogenic right ventricular cardiomyopathy. Circ Res. 2009;104:1076–1084. [DOI] [PMC free article] [PubMed] [Google Scholar]
- 39.Stuart T, Butler A, Hoffman P, Hafemeister C, Papalexi E, Mauck WM 3rd, Hao Y, Stoeckius M, Smibert P and Satija R. Comprehensive Integration of Single-Cell Data. Cell. 2019;177:1888–1902 e21. [DOI] [PMC free article] [PubMed] [Google Scholar]
- 40.Hafemeister C and Satija R. Normalization and variance stabilization of single-cell RNA-seq data using regularized negative binomial regression. Genome Biol. 2019;20:296. [DOI] [PMC free article] [PubMed] [Google Scholar]
- 41.Grun D, Lyubimova A, Kester L, Wiebrands K, Basak O, Sasaki N, Clevers H and van Oudenaarden A. Single-cell messenger RNA sequencing reveals rare intestinal cell types. Nature. 2015;525:251–255. [DOI] [PubMed] [Google Scholar]
- 42.Becht E, McInnes L, Healy J, Dutertre CA, Kwok IWH, Ng LG, Ginhoux F and Newell EW. Dimensionality reduction for visualizing single-cell data using UMAP. Nat Biotechnol. 2018. December 3. doi: 10.1038/nbt.4314. [DOI] [PubMed] [Google Scholar]
- 43.Butler A, Hoffman P, Smibert P, Papalexi E and Satija R. Integrating single-cell transcriptomic data across different conditions, technologies, and species. Nat Biotechnol. 2018;36:411–420. [DOI] [PMC free article] [PubMed] [Google Scholar]
- 44.Love MI, Huber W and Anders S. Moderated estimation of fold change and dispersion for RNA-seq data with DESeq2. Genome Biol. 2014;15:550. [DOI] [PMC free article] [PubMed] [Google Scholar]
- 45.Kuleshov MV, Jones MR, Rouillard AD, Fernandez NF, Duan Q, Wang Z, Koplev S, Jenkins SL, Jagodnik KM, Lachmann A, et al. Enrichr: a comprehensive gene set enrichment analysis web server 2016 update. Nucleic Acids Res. 2016;44:W90–7. [DOI] [PMC free article] [PubMed] [Google Scholar]
- 46.Rouhi L, Cheedipudi SM, Chen SN, Fan S, Lombardi R, Chen X, Coarfa C, Robertson MJ, Gurha P and Marian AJ. Haplo-insufficiency of Tmem43 in cardiac myocytes activates the DNA damage response pathway leading to a Late-Onset Senescence-Associated pro-fibrotic cardiomyopathy. Cardiovasc Res. 2020, October 18;cvaa300. doi: 10.1093/cvr/cvaa300. [DOI] [PMC free article] [PubMed] [Google Scholar]
- 47.Masters M and Riley PR. The epicardium signals the way towards heart regeneration. Stem Cell Res. 2014;13:683–92. [DOI] [PMC free article] [PubMed] [Google Scholar]
- 48.Simoes FC and Riley PR. The ontogeny, activation and function of the epicardium during heart development and regeneration. Development. 2018; March 28;145(7):dev155994. [DOI] [PubMed] [Google Scholar]
- 49.Duim SN, Kurakula K, Goumans MJ and Kruithof BP. Cardiac endothelial cells express Wilms’ tumor-1: Wt1 expression in the developing, adult and infarcted heart. J Mol Cell Cardiol. 2015;81:127–135. [DOI] [PubMed] [Google Scholar]
- 50.Masci PG, Ganame J, Francone M, Desmet W, Lorenzoni V, Iacucci I, Barison A, Carbone I, Lombardi M, Agati L, et al. Relationship between location and size of myocardial infarction and their reciprocal influences on post-infarction left ventricular remodelling. Eur Heart J. 2011;32:1640–1648. [DOI] [PubMed] [Google Scholar]
- 51.Orn S, Manhenke C, Anand IS, Squire I, Nagel E, Edvardsen T and Dickstein K. Effect of left ventricular scar size, location, and transmurality on left ventricular remodeling with healed myocardial infarction. Am J Cardiol. 2007;99:1109–1114. [DOI] [PubMed] [Google Scholar]
- 52.Lombardi R, da Graca Cabreira-Hansen M, Bell A, Fromm RR, Willerson JT and Marian AJ. Nuclear plakoglobin is essential for differentiation of cardiac progenitor cells to adipocytes in arrhythmogenic right ventricular cardiomyopathy. Circ Res. 2011;109:1342–1353. [DOI] [PMC free article] [PubMed] [Google Scholar]
- 53.Teekakirikul P, Eminaga S, Toka O, Alcalai R, Wang L, Wakimoto H, Nayor M, Konno T, Gorham JM, Wolf CM, et al. Cardiac fibrosis in mice with hypertrophic cardiomyopathy is mediated by non-myocyte proliferation and requires Tgf-beta. J Clin Invest. 2010;120:3520–3529. [DOI] [PMC free article] [PubMed] [Google Scholar]
- 54.Austin KM, Trembley MA, Chandler SF, Sanders SP, Saffitz JE, Abrams DJ and Pu WT. Molecular mechanisms of arrhythmogenic cardiomyopathy. Nat Rev Cardiol. 2019;16:519–537. [DOI] [PMC free article] [PubMed] [Google Scholar]
- 55.Frangogiannis NG. Cardiac fibrosis: Cell biological mechanisms, molecular pathways and therapeutic opportunities. Mol Aspects Med. 2019;65:70–99. [DOI] [PubMed] [Google Scholar]
Associated Data
This section collects any data citations, data availability statements, or supplementary materials included in this article.