

Abstract
Although the main focus of immuno-oncology has been on manipulating the adaptive immune system, harnessing both the innate and adaptive arms of the immune system might produce superior tumor reduction and elimination. Tumor-associated macrophages (TAMs) often have net pro-tumor effects1, but their embedded location and their untapped potential provide impetus to discover strategies to turn them against tumors. Strategies that deplete (αCSF-1, CSF-1R inhibition)2,3 or stimulate (agonistic αCD40, inhibitory αCD47)4,5 TAMs have met with some success. We instead hypothesized that pharmacologic modulation of macrophage phenotype might have anti-tumor effect. We recently reported that a first-in-class selective class IIa HDAC inhibitor (TMP195) influenced human monocyte responses to colony stimulating factors CSF-1 and CSF-2 in vitro6. Here, we utilize a macrophage-dependent autochthonous mouse model of breast cancer to demonstrate that in vivo TMP195 treatment alters the tumor microenvironment and reduces tumor burden and pulmonary metastases through macrophage modulation. TMP195 induces recruitment and differentiation of highly phagocytic and stimulatory macrophages within tumors. Furthermore, combining TMP195 with chemotherapy regimens or T-cell checkpoint blockade in this model significantly enhances the durability of tumor reduction. These data introduce class IIa HDAC inhibition as a novel means to harness the anti-tumor potential of macrophages to enhance cancer therapy.
Class IIa HDACs (HDAC4, 5, 7 and 9) are distinct from both class I (HDAC1, 2, 3 and 8) and class IIb (HDAC6 and 10)6 in that they bind but do not “erase” acetylated lysines7,8 and they rarely associate with histone tails9. Previously we described the discovery of selective competitive class IIa HDAC inhibitors (e.g. TMP195) occupying the acetyllysine binding site of class IIa HDACs6. We confirm TMP195 competes against HDAC7 binding to a variety of sidechain modifications on the same peptide backbone despite no interference with the activity of other acetyllysine reader proteins (bromodomain containing protein 4 (BRD4) IC50 > 50 M−6) (Fig. 1a). Unlike the class I selective HDAC inhibitor vorinostat, TMP195 altered monocyte gene expression without affecting that of lymphocytes6. Class IIa HDAC inhibition also biased monocytes toward a type 1 pro-inflammatory phenotype across a gradient of Th1 cytokine exposure6. Here, we tested the hypothesis that a class IIa HDAC inhibitor would induce an anti-tumor innate immune response capable of executing tumor regression in vivo. We selected MMTV-PyMT transgenic mice because they provide an aggressive autochthonous model of luminal B-type mammary carcinoma in which late-stage carcinogenesis and pulmonary metastasis are regulated by CSF-1 and macrophages10.
Figure 1. TMP195 modulates macrophages in breast tumors.
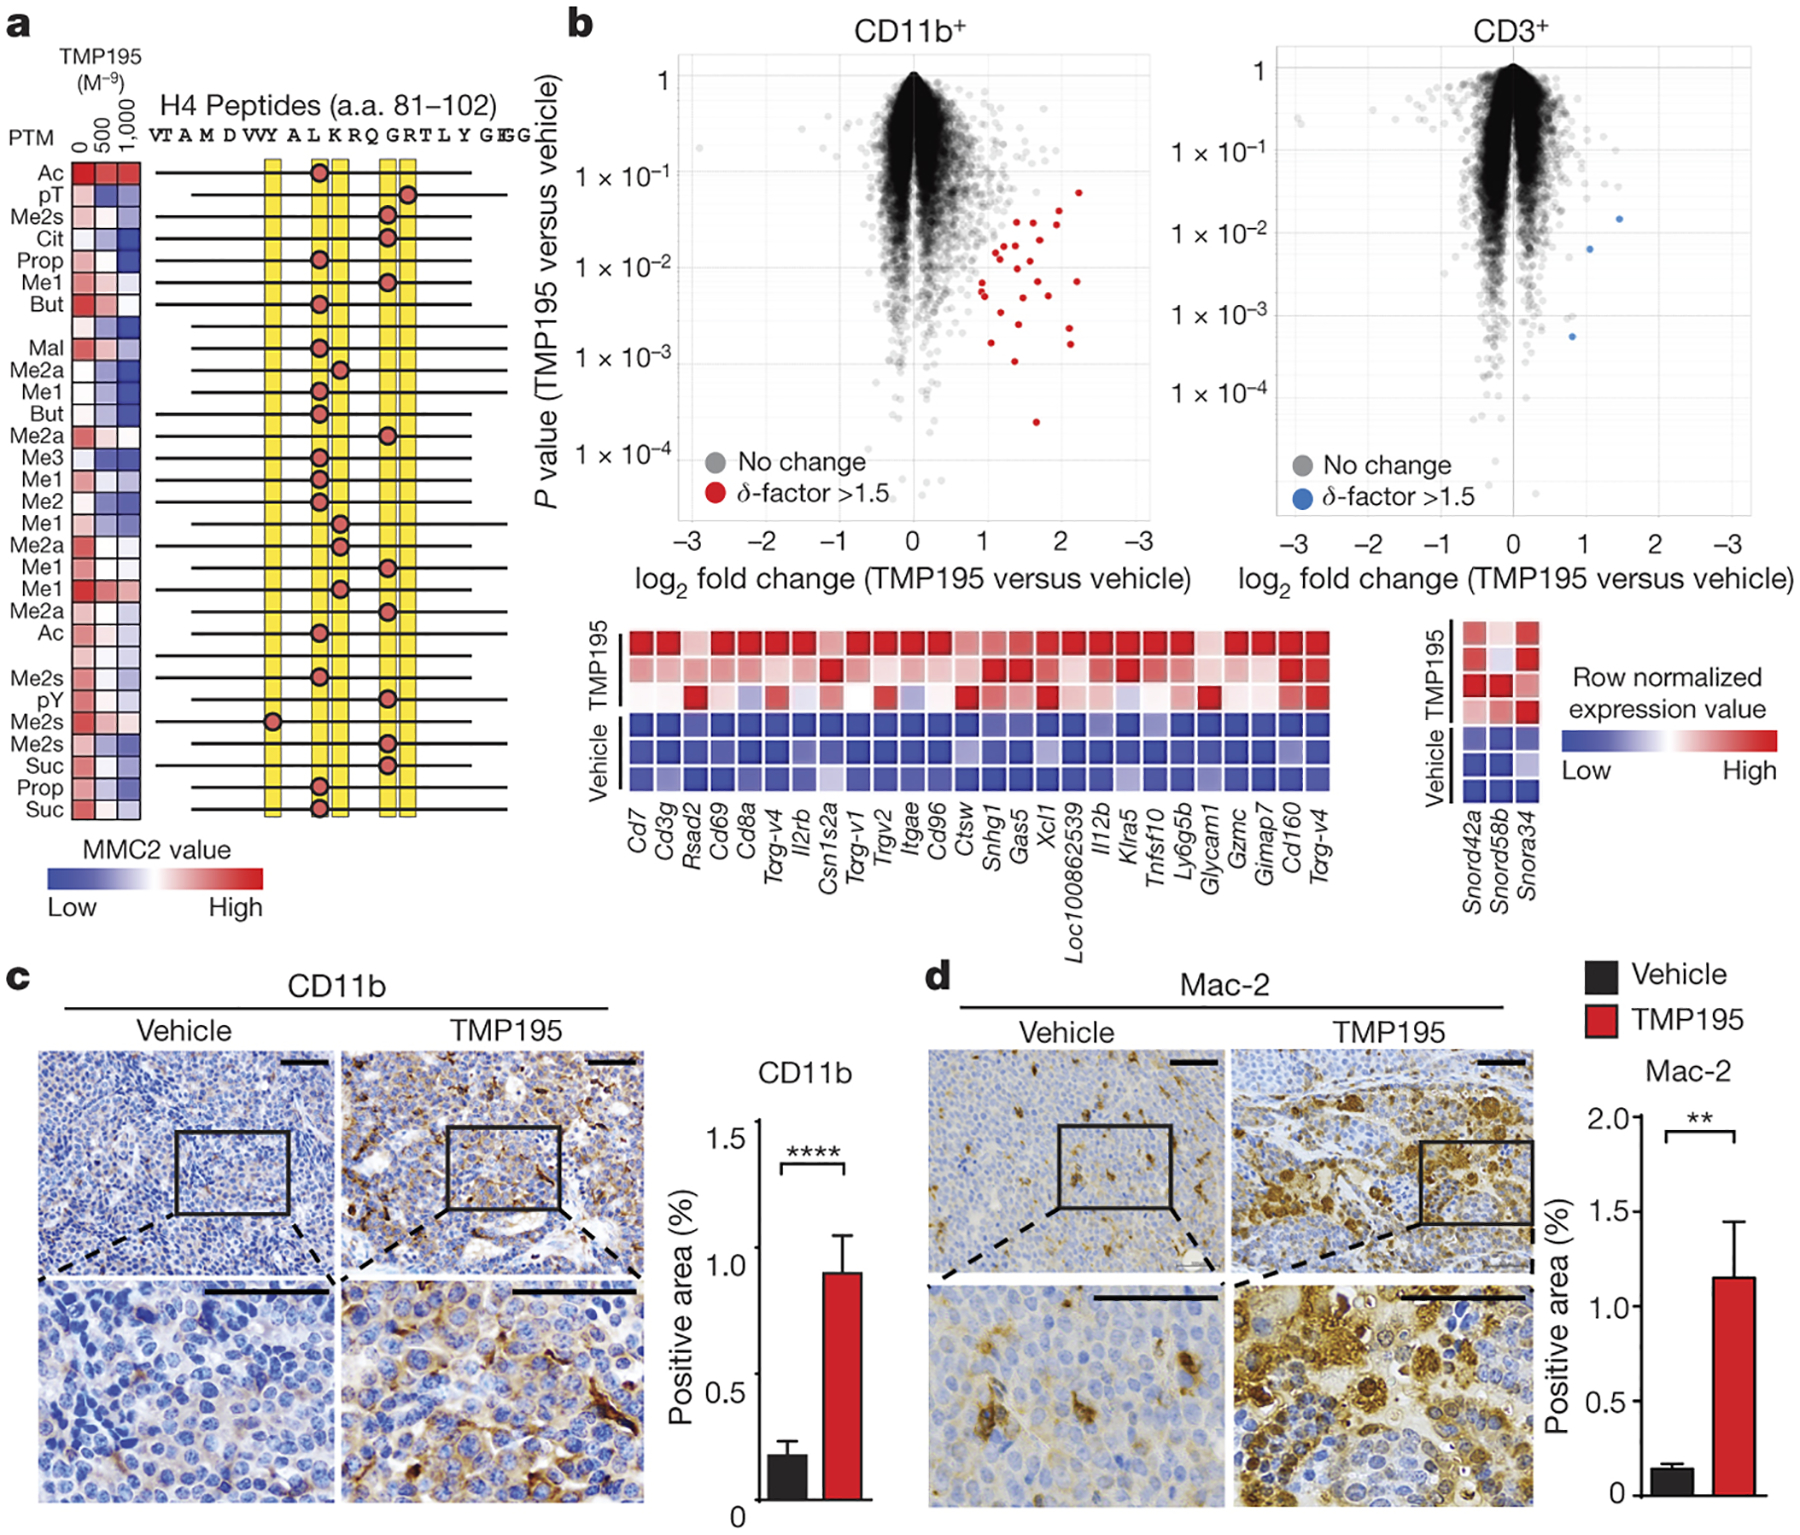
a, Heatmap of MMC2 values indicating recombinant HDAC7 catalytic domain (a. a. 483–903) binding to immobilized histone H4 peptides containing the indicated modifications with DMSO or with increasing concentrations of TMP195. b-d, Mice were treated for 5 days as indicated. b, Volcano plots of gene expression datasets derived from FACS double-sorted tumor infiltrating leukocytes. All probesets are shown, highlight coloring applied to differentially expressed (δ-factor >1.5) probeset listed in the heatmap adjacent to each plot. c-d, Tumors were obtained for immunohistochemistry (IHC) for c, the myeloid marker, CD11b and d, the mature macrophage marker, Mac-2 to assess infiltration of monocytes and macrophages. Representative quantitation and images are shown from two separate experiments with at least 5 mice per group. Scale bar represents 100 μm. Graphs show the results from two independent experiments (unpaired t-test). Graphs show mean and error bars represent S.E.M. Significance: **P<0.01, ****P<0.0001.
As observed in vitro6, 5 days of TMP195 treatment selectively induced differential gene expression in the myeloid cells (up to 4.8-fold increase in 26 probes in CD11b+ versus 3 probes in CD3+ with a δ-factor11 > 1.5 (Fig. 1b; Extended Data Fig. 1a–d). Probes meeting these criteria in CD11b+ cells were significantly enriched for transcripts associated with immune cell activation (Extended Data Fig. 1e). Unbiased Gene Set Enrichment Analysis (GSEA)12 on the entire dataset found the highest degree of enrichment was with activated immune cell signatures (Extended Data Fig. 1e–j). The myeloid-biased effect of TMP195 treatment is also evidenced by the increased proportion of both CD11b+ cells and mature macrophages (Mac-2+, CD115+, F480+) in MMTV-PyMT tumors without affecting other tumor infiltrating immune cells we examined (Fig. 1c–d; Extended Data Fig. 2).
Cytometric analysis of CD45+MHCII+ cells from MMTV-PyMT tumors has been described to distinguish Notch-dependent, pro-tumor TAMs from homeostatic Mammary Tissue Macrophages (MTM) based on the differential expression of CD11b (TAM=CD11blo; MTM=CD11bhi)13. Five days of TMP195 treatment results in a significant reduction in the proportion of pro-tumor TAMs gated this way (Extended Data Fig. 3a,b). A longitudinal study tracking pre-existing versus new macrophages in the tumor reveals that TMP195 treatment increases the number of new macrophages (Extended Data Fig. 3c,d). Very few, if any, of the new macrophages arriving upon TMP195 treatment are TAMs using the CD45+/MHCII+/CD11blo gating paradigm (Extended Data Fig. 3e). TMP195 significantly enhanced the recruitment of tail-vein injected CD11bhiCFSE+ monocytes into tumors (Extended Data Fig. 3f,g). TMP195 induced appearance of cells resembling highly phagocytic tingible body macrophages (TBM) (Fig. 2a). Using IHC, we confirm TMP195 treatment results in the appearance of tumor cell-derived (EPCAM+) apoptotic bodies within tumor macrophages (F480+ and CD11b+ cells; Fig. 2b–d, Extended Data Fig. 4a–d). Tumors from TMP195-treated mice had a higher proportion of F480+ and CD11b+ cells expressing CD40 (Fig. 2e,f and Extended Data Fig. 4e), consistent with their pro-inflammatory gene signature. Similarly, TMP195 promoted T cell co-stimulatory function in human monocytes differentiated to antigen presenting cells with IL-4 and GM-CSF in vitro (Extended Data Fig. 4f,g). TMP195 also significantly increased the abundance of activated cytotoxic T lymphocytes in tumors (Fig. 2g). Class IIa HDAC inhibition promotes phagocytic and immunostimulatory functions in macrophages, steering them toward an anti-tumor phenotype with enhanced capacity to activate cytotoxic T lymphocytes.
Figure 2. TMP195-activated myeloid cells are highly phagocytic and induce vasculature normalization in breast tumors.
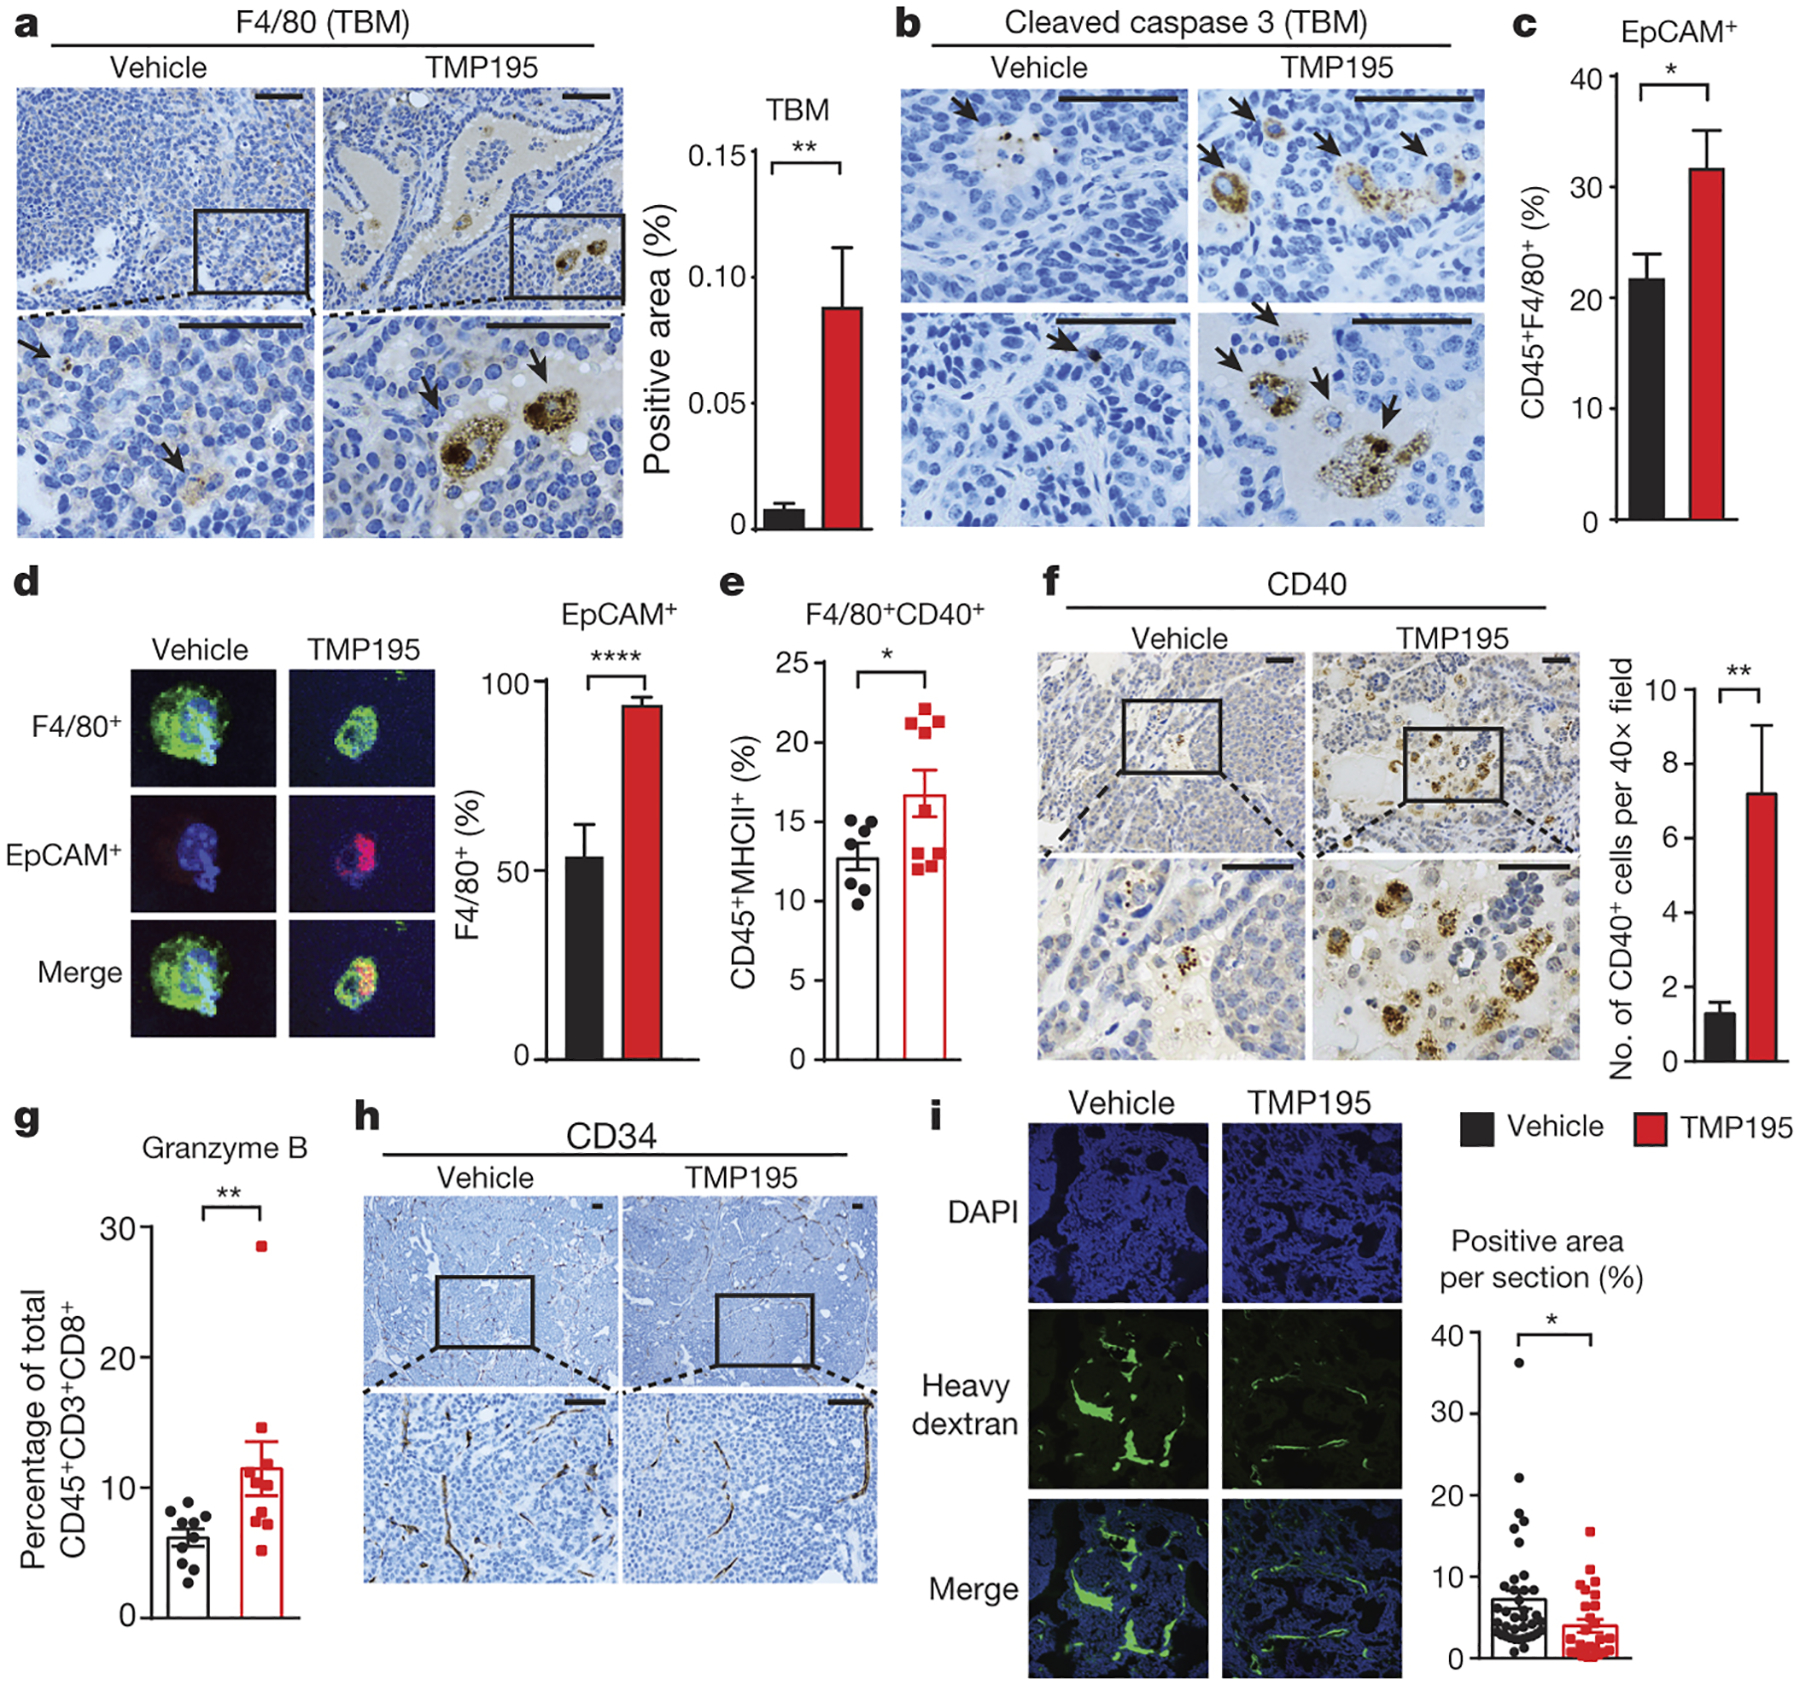
Mice were treated for 5 days as indicated. IHC was performed using (a) the macrophage specific markers, F480 to identify tingible body macrophages (TBM), indicated by black arrow heads and (b) Cleaved caspase-3 to identify apoptotic bodies within macrophages. Phagocytosis of breast tumor cells was quantified as the proportion of F480+ macrophages that contain intracellular EPCAM, a marker of breast tumor cells, by (c) flow cytometry (d) immunofluorescence. The proportion of activated macrophages was identified by (e) flow cytometry using F480+CD40+ of the CD45+MHCII+ population of cells. f, IHC was performed to identify CD40+ cells. g, The proportion of CD45+CD3+CD8+ cells that are Granzyme B+ were identified by flow cytometry. Results from 3 independent experiments are shown. Vascular density and integrity was assessed by (h) IHC using the endothelial cell marker CD34 and (i) by immunofluorescence utilizing localization of IV injected dextran. Graphs show the results from two independent experiments (unpaired t-test). All graphs show mean and error bars represent S.E.M. Significance: *P<0.05, **P<0.01, ***P<0.001, ****P<0.0001.
In addition to being immunosuppressive, pro-tumor TAMs contribute to abnormally leaky and branched tumor vasculature14–17. In contrast, anti-tumor macrophages are associated with anti-angiogenic mechanisms including vessel pruning and normalization18, which can substantially enhance the therapeutic potency of other cancer treatments19. TMP195 treatment is accompanied by elongated CD34+ vessel structure and lack of aberrantly branched vasculature in the tumor (Fig. 2h and Extended Data Fig. 5a). We also found that a fluorescent heavy dextran molecule remained in the tumor vasculature of TMP195-treated mice, indicating that the integrity of the tumor vasculature was significantly improved (Fig. 2i). TMP195 treatment significantly decreased proliferating tumor cells, most notably at the leading edge of the tumor (Extended Data Fig. 5b). We also observed an increase in cell death in the tumor (Extended Data Fig. 5c,d) that we conclude is indirect because TMP195 did not affect cell viability for any of the 5 mouse MMTV-PyMT or 6 human breast cancer cell lines tested (Extended Data Fig. 5e).
We tested TMP195’s ability to reduce overall tumor burden in three independent studies. In the first, mice exhibiting a wide range of total tumor burden (150–800mm3) were randomized for treatment with either DMSO (vehicle) or TMP195. Over 13 days, TMP195 significantly reduced the rate of tumor growth (Fig. 3a and Extended Data Fig. 6a,b). The subset of mice with an initial tumor burden of <400mm3 received continued treatment for a total of 24 days at which point we identified a significant decrease in metastatic lesions in the lung (Extended Data Fig. 6c,d). Informed by this finding, we enrolled mice with a total tumor burden between 200–600mm3 for treatment with either vehicle or TMP195. Again, we identified a significant reduction in tumor burden which correlated with a decrease in pulmonary metastases (Fig. 3a,b and Extended Data Fig. 6e,f).
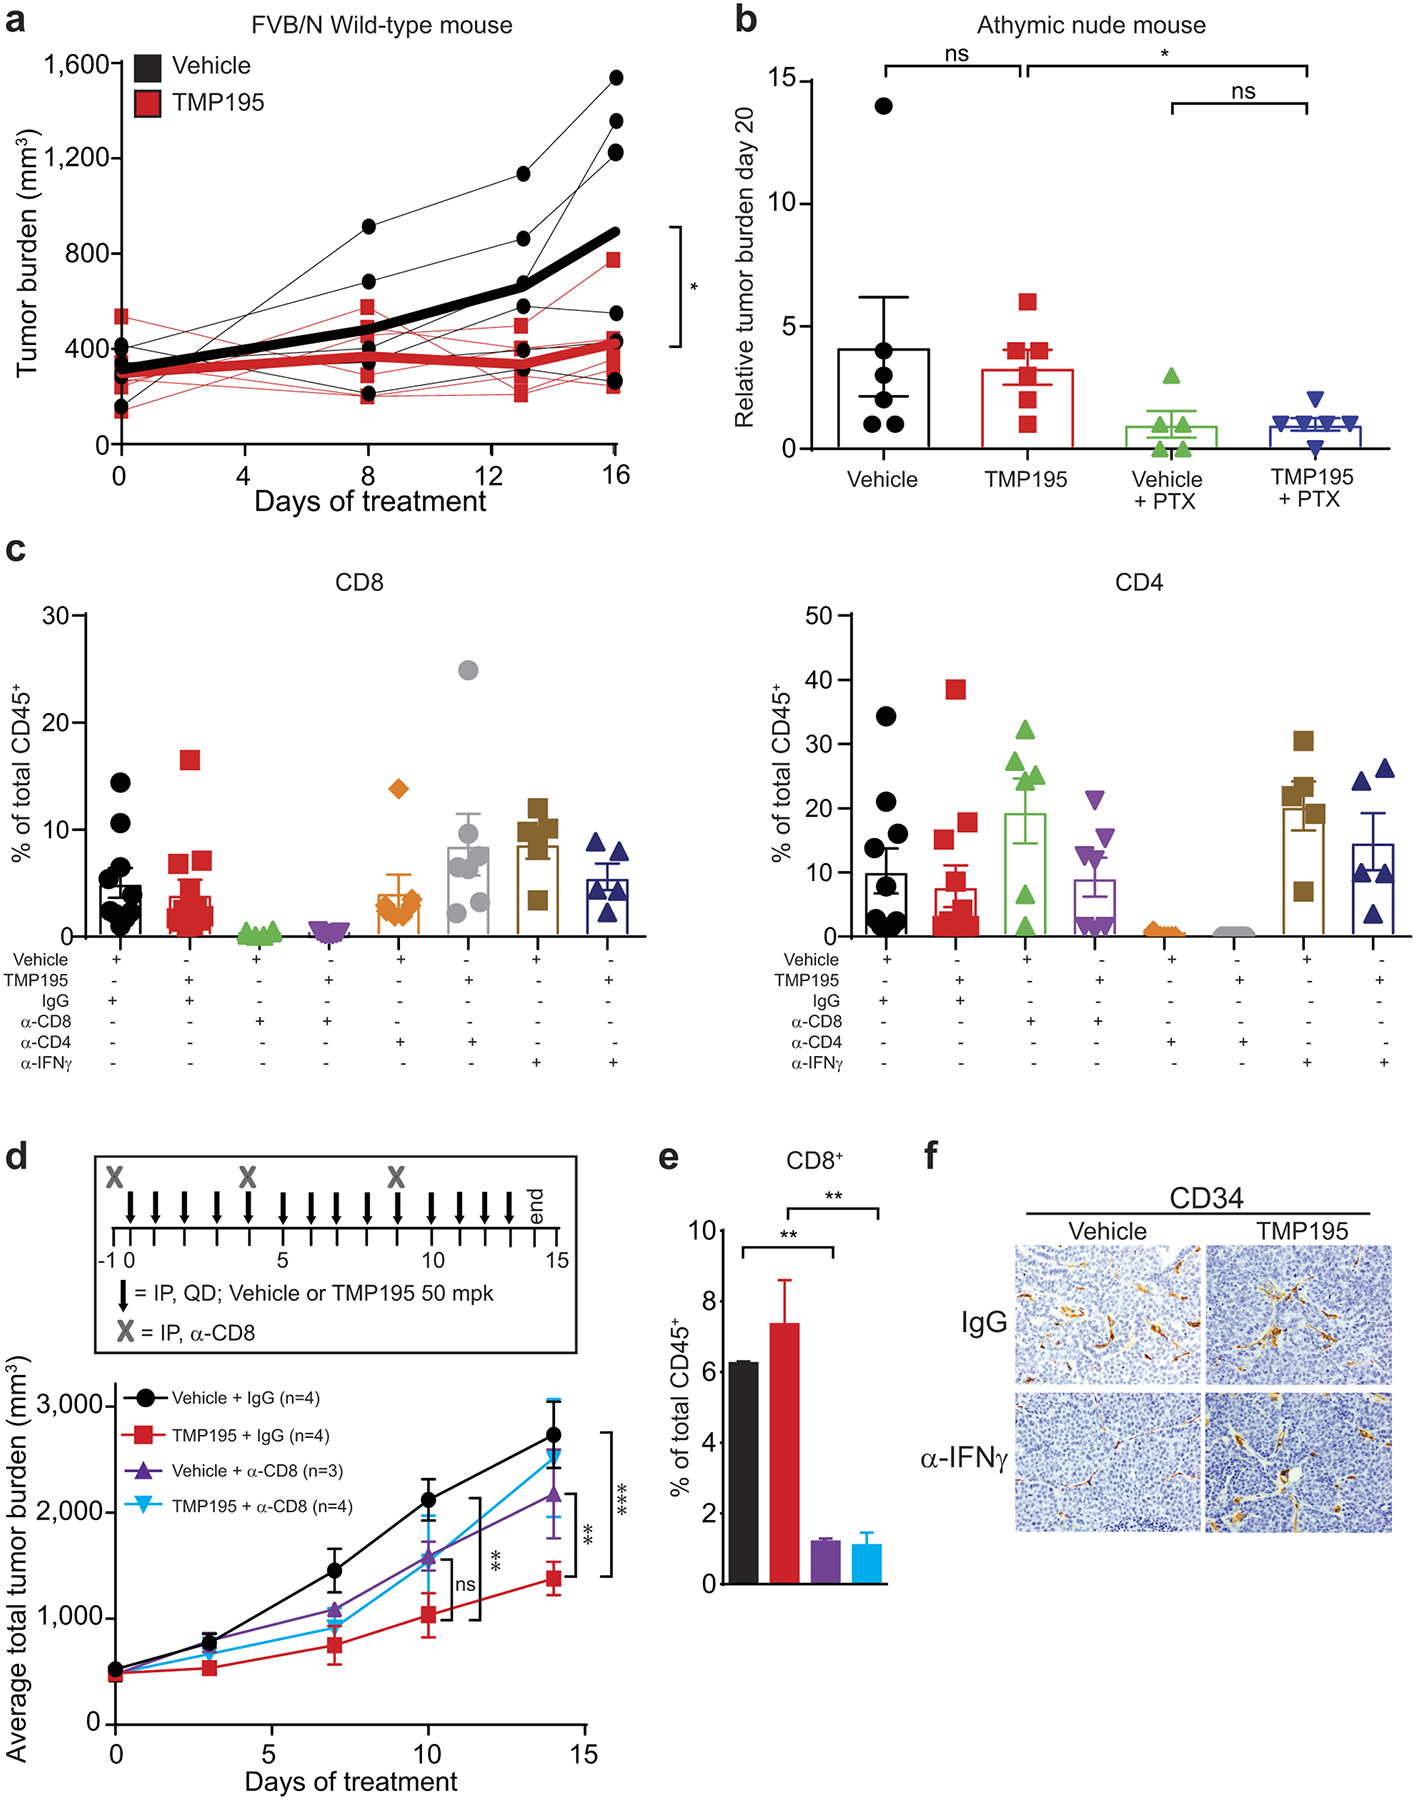
Figure 3. TMP195 induces macrophage-dependent reduction in tumor burden and decreases pulmonary metastasis.
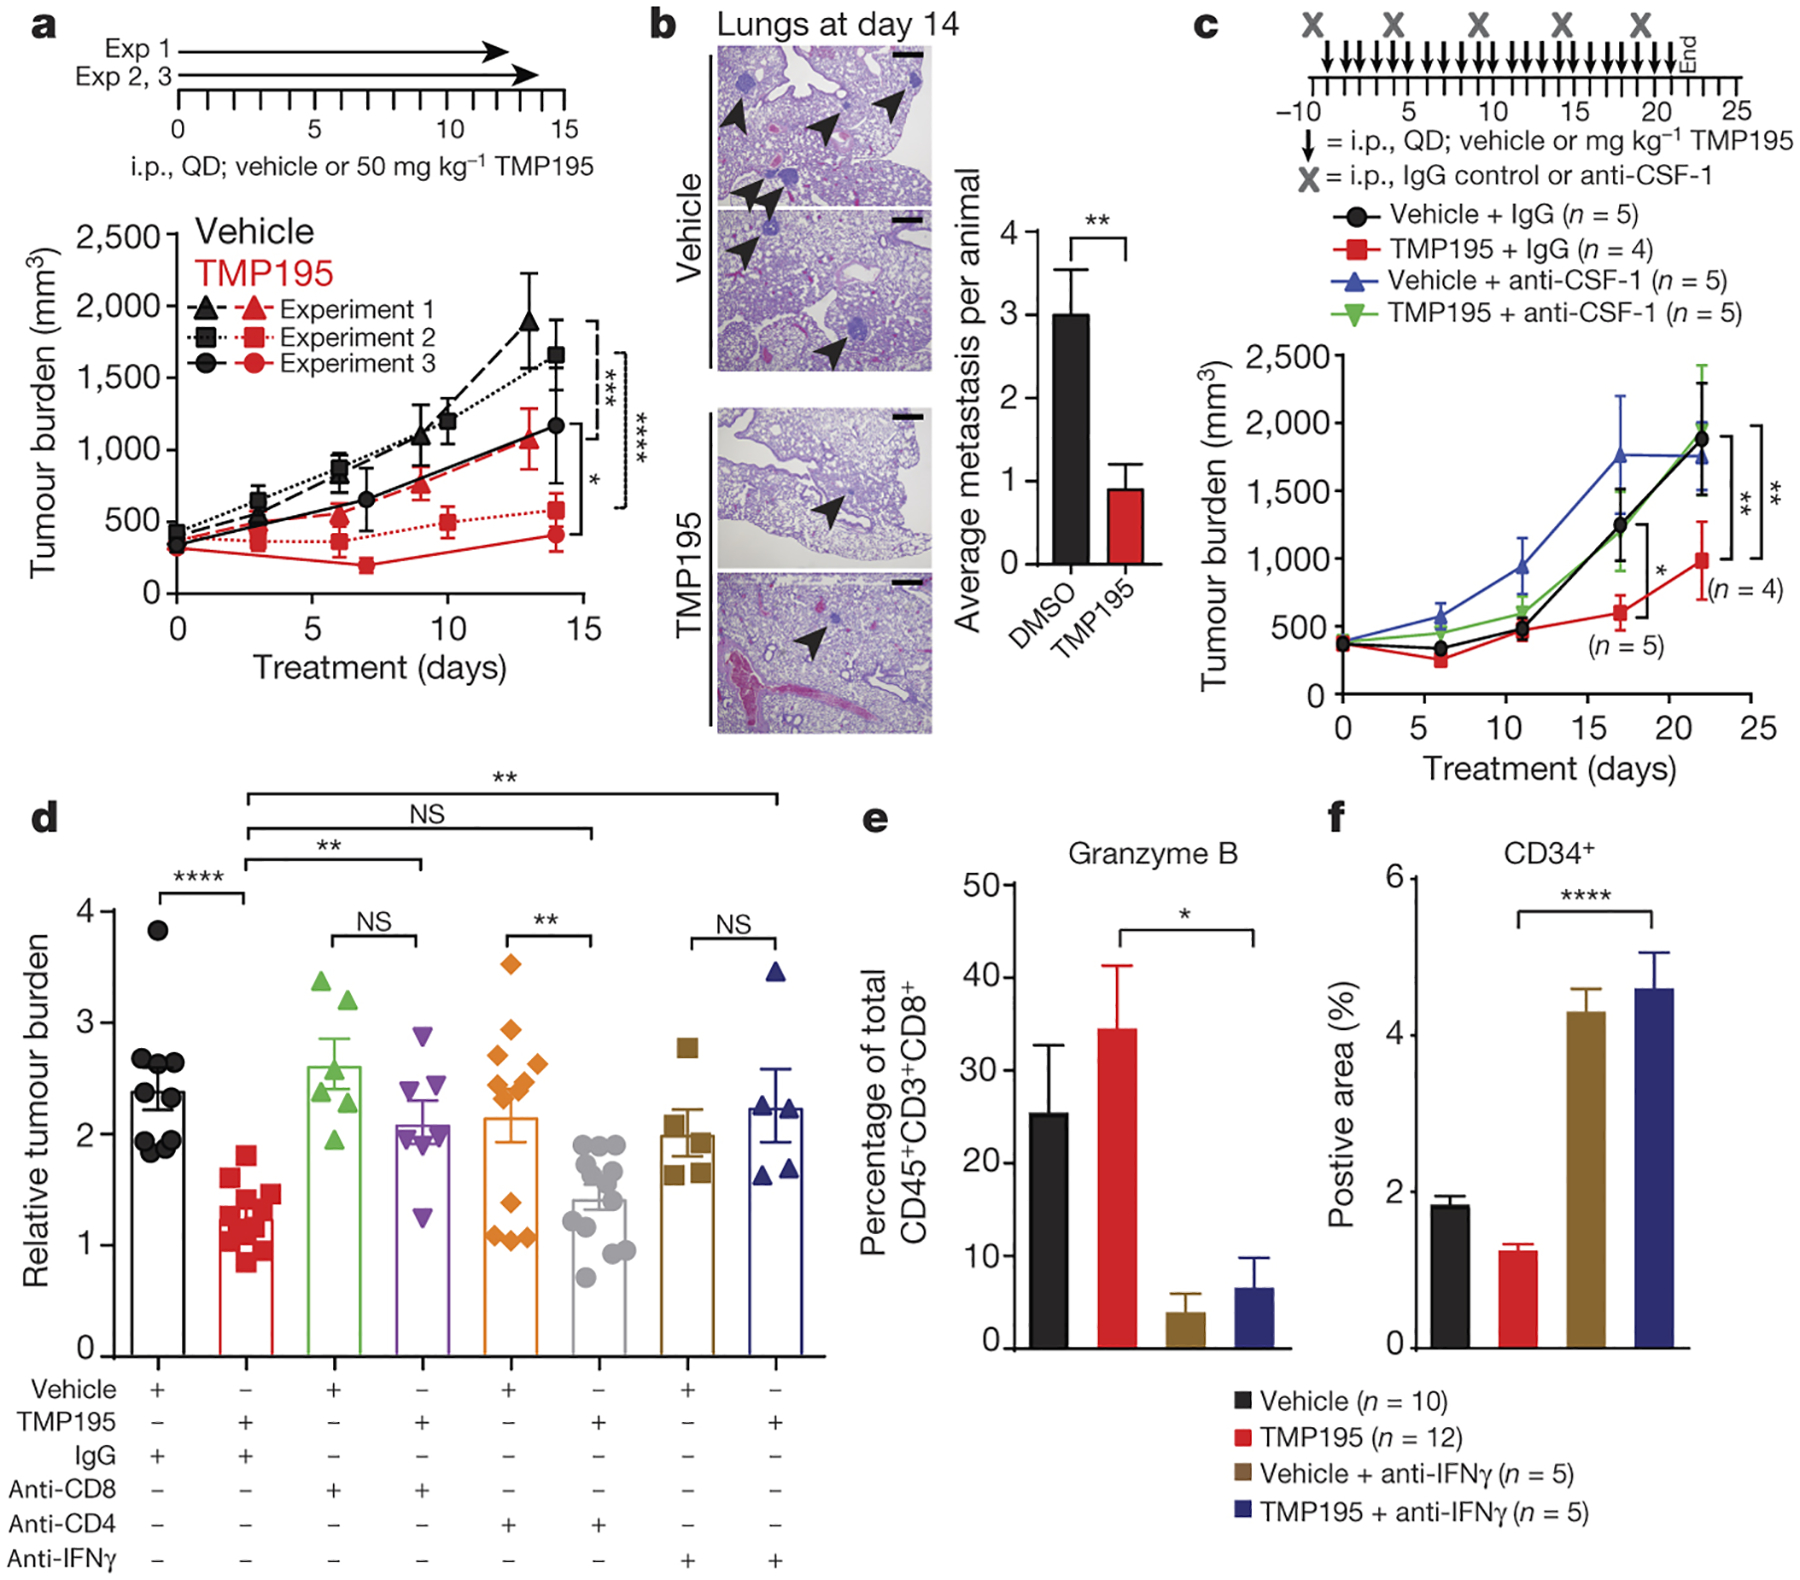
Tumor bearing MMTV-PyMT mice were randomly placed into treatment groups and received daily IP injections of either vehicle or 50 mg/kg of TMP195, as shown. Tumors were measured and plotted as average total tumor burden ±SEM. a, Three independent experiments are shown, the number of mice per group shown in Extended Data Fig. 6. b, After 14 days of treatment lungs were removed and hematoxylin and eosin (H&E) staining was performed to identify metastatic lesions. Representative sections from two vehicle and two TMP195 treated mice are shown. The number of metastatic lesions per lung is shown. Scale bar represents 100 μm. c, An antibody against CSF-1 was used to deplete macrophages. One mouse died due to unrelated experimental reasons in the TMP195+anti-CSF1 group and is indicated on the graph. d-f, CD8 or CD4 cells were depleted, or IFNγ was neutralized, as indicated. d, Relative tumor burden is shown. e, The proportion of CD45+CD3+CD8+ cells that are Granzyme B+ were identified by flow cytometry and (f) IHC was performed using CD34 to measure vascular organization on the indicated mice shown in (d), see images in Extended Data Fig. 9f. Statistics for all mouse experiments were performed using 2-way ANOVA. An unpaired t-test was performed for bar graphs. Significance: *P<0.05, **P<0.01, ***P<0.001, ****P<0.0001.
We compared gene expression in whole tumors from mice treated with either vehicle or TMP195 for two weeks (Extended Data Fig. 7a). Five of the 20 ImmGen cell type signatures (lymphatic and blood endothelial cells, pre-B cells, macrophages, and monocytes) have a significant bias (X2 P value <0.05) due to TMP195 treatment (Extended Data Fig. 7b–h)20. Importantly, other infiltrating leukocyte populations (particularly those that may be CD11b+) were not identified through this analysis (Extended Data Fig. 7b–h). These findings parallel the observations made after five days of treatment and further support the conclusion that TMP195 affects CD11b+ leukocytes and establishes an anti-tumor microenvironment with normalized vasculature.
Myeloid cells were selectively depleted in vivo using antibodies against either CD11b (depletion of diverse myeloid cell populations) or CSF-1 (macrophage depletion). Both depletion strategies abrogated the efficacy of TMP195 (Fig. 3c and Extended Data Fig. 8a) and prevented the cellular and histological signs of TMP195 treatment from appearing (Extended Data Fig. 8b–i). These results provide evidence that the activated macrophages are required for the anti-tumor effect of class IIa HDAC inhibition.
We tested the requirement for the adaptive immune system by orthotopic transplantation of donor MMTV-PyMT autochthonous tumor pieces (50–100mm3) into T cell deficient athymic nude (Foxn1nu) recipient mice (or wild-type FVBN control mice). Although tumor burden was reduced in wild-type recipients (Extended Data Fig. 9a), TMP195 failed to inhibit transplant growth in the Foxn1nu mice; whereas paclitaxel was efficacious (Extended Data Fig. 9b). To refine this observation, we tested the ability of TMP195 to reduce tumor burden in the context of either CD8+ or CD4+ T cell depletion. Only CD8+ cell depletion prevented the single agent efficacy of TMP195 (Fig. 3d and Extended Data Fig. 9c–e), implicating an important role for the TMP195-induced increase in Granzyme B+ CD8+ T cells (Fig. 2g), even though the proportion of tumor CD8+ T cells does not change upon TMP195 treatment (Extended Data Figure 2m).
Pursuing the Th1 axis, we neutralized IFNγ systemically and examined the anti-tumor effects of TMP195. Anti-IFNγ antibody treatment alone dramatically increased vascular disorganization in MMTV-PyMT tumors, and without this Th1 cytokine, TMP195 failed to normalize CD34 staining in tumor sections (Extended Data Fig. 9f). Furthermore, neutralizing IFNγ is required for TMP195 to reduce tumor burden (Fig. 3d), and this loss of efficacy coincides with the disappearance of Granzyme B+ CD8+ T cells in the tumors (Fig. 3e) without effecting the proportion of CD8+ T (Extended Data Fig. 9c). Taken together, we demonstrate macrophages, IFNγ and CD8+ T cells are required for the anti-tumor microenvironment elicited by TMP195 treatment (Extended Data Fig. 10), but cannot rule out the involvement of untested myeloid populations. Nonetheless, these depletion studies demonstrate that class IIa HDAC inhibitors enable macrophages to both respond to and instruct the IFNγ axis to alter the tumor microenvironment and activate a functional adaptive anti-tumor immune response.
We hypothesized TMP195 would enhance the efficacy of standard chemotherapy in this model2. TMP195 in combination with either Carboplatin (Carbo) or Paclitaxel (PTX) yielded a significant reduction in tumor burden compared to either monotherapy (Fig. 4a,b). Furthermore, TMP195 and PTX combination treatment was more durable than PTX alone (Fig. 4b). Similar to work done in orthotopic MMTV-PyMT tumors21, we found that PD-1 neutralization is not sufficient to affect tumor burden in the autochthonous version of the model (Fig. 4c,d). Addition of TMP195 to the anti-PD-1 regimen yields a significant reduction in tumor burden compared to TMP195 alone (Fig. 4c,d). The anti-tumor macrophage phenotype induced by TMP195 treatment thus enhances the efficacy and durability of both standard chemotherapeutic regimens and checkpoint blockade immunotherapy in this mouse model of breast cancer.
Figure 4. TMP195 improves the efficacy of chemotherapy and checkpoint blockade, and induces a durable response.
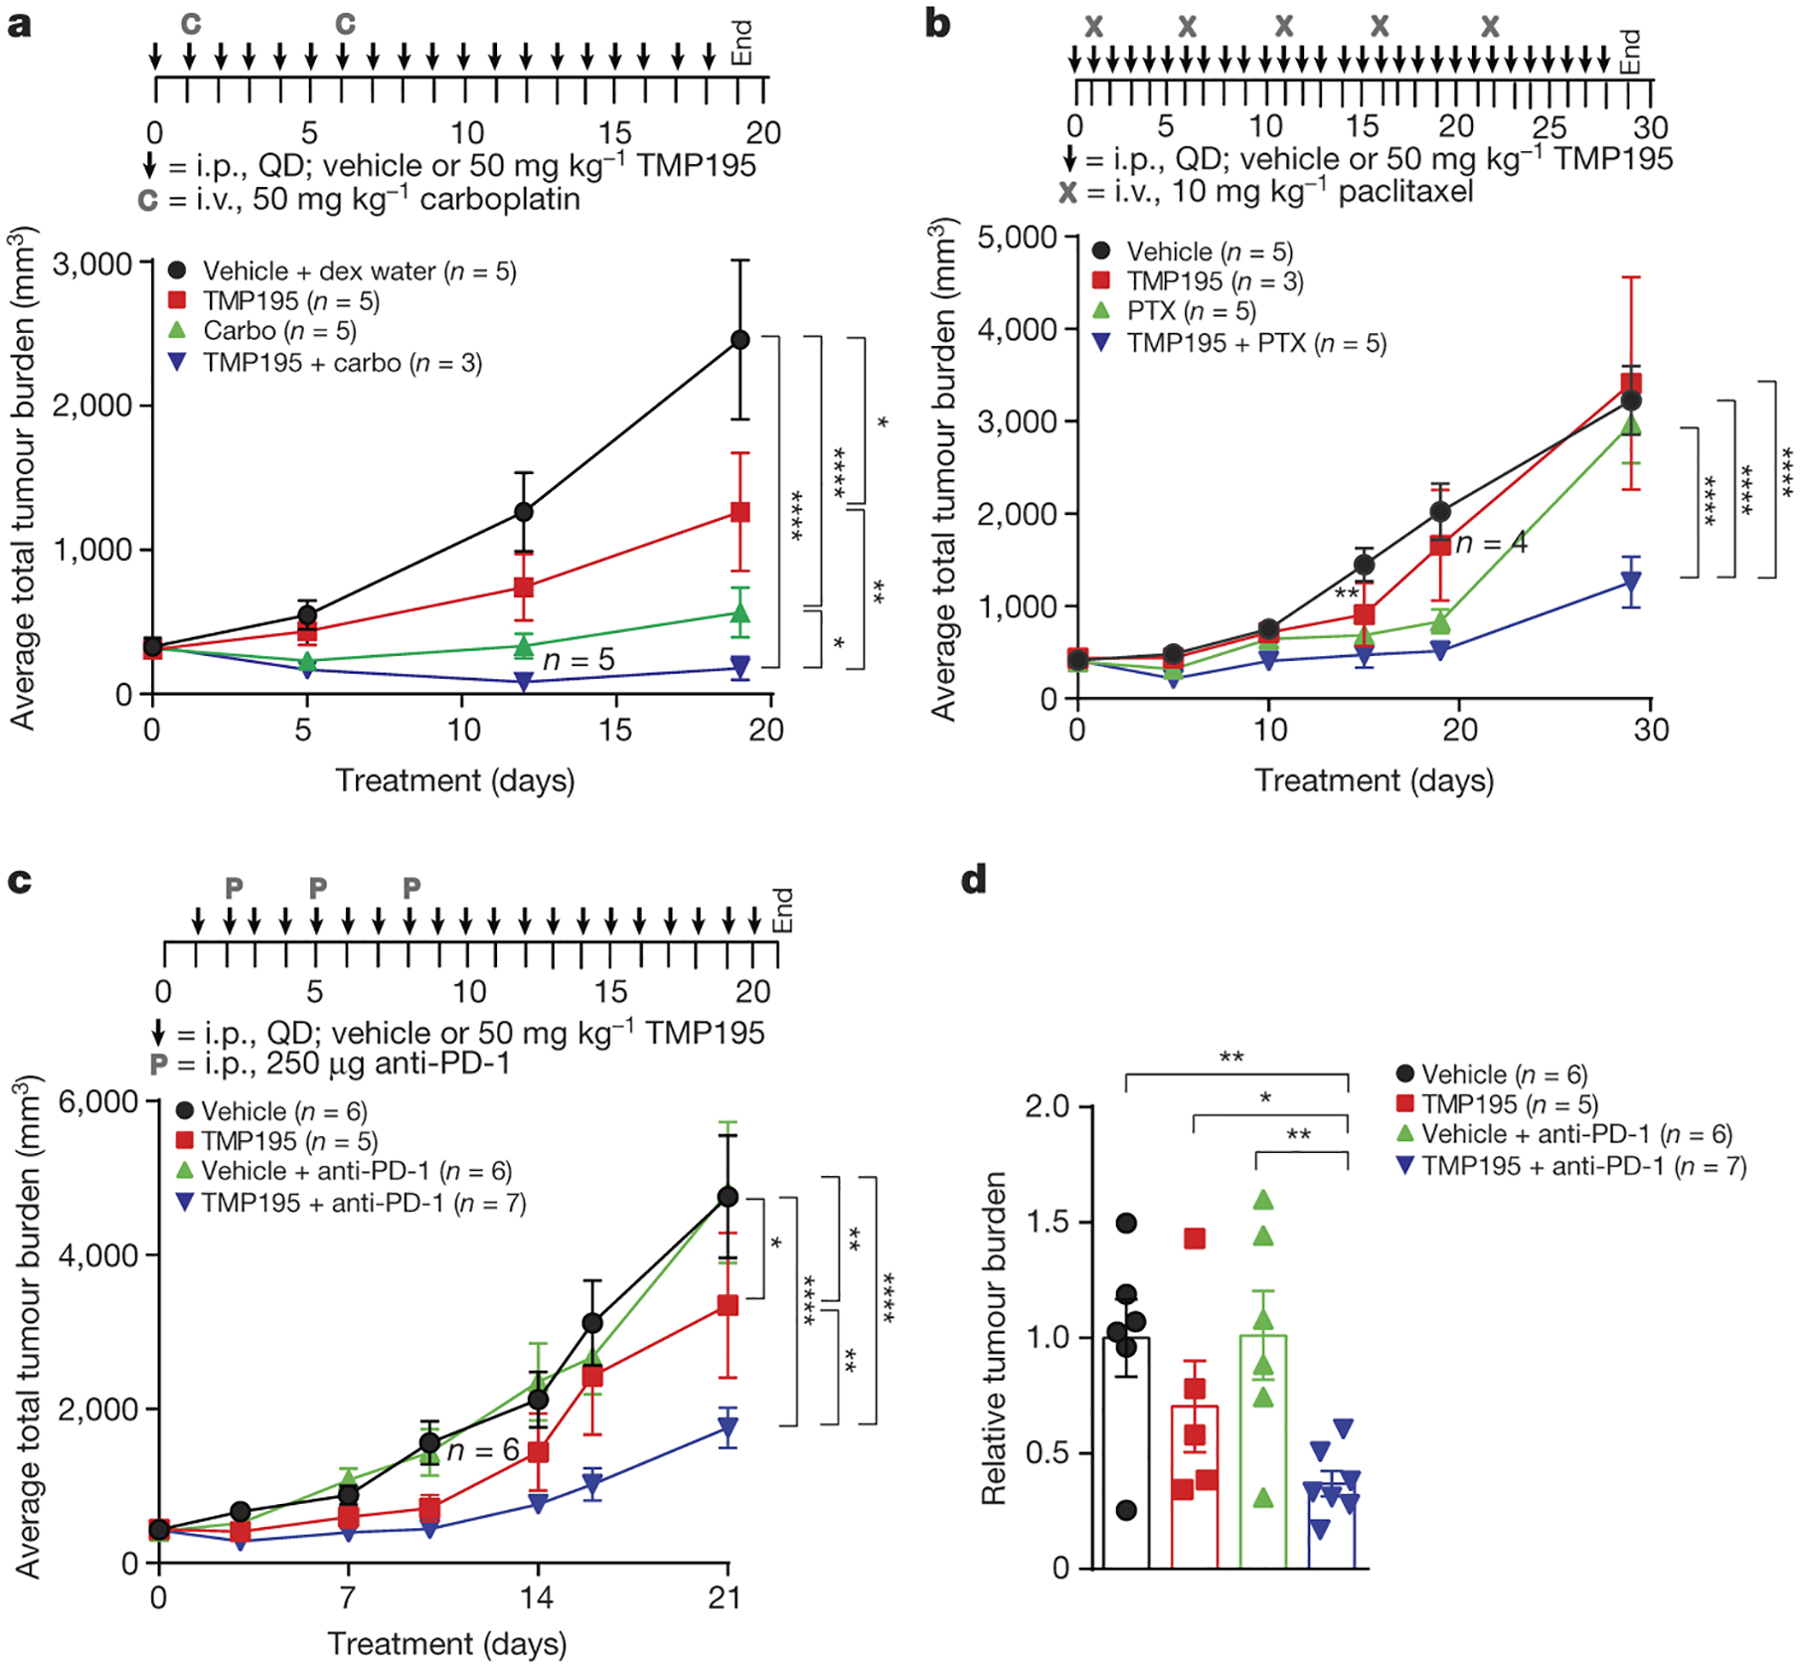
Tumor bearing MMTV-PyMT mice with similar total tumor burden were randomly placed into treatment groups and treated as indicated. Tumor volumes were measured and plotted as either average total tumor burden or relative tumor burden to day 0 of treatment. a, Mice received IP injections of either vehicle (DMSO) or 50 mg/kg of TMP195 in combination with either IV injections of vehicle (Dex5Water) or 50 mg/kg of carboplatin (Carbo). b, Mice received daily IP injections of either vehicle (DMSO) or 50 mg/kg of TMP195 alone or in combination with IV injections of 10 mg/kg of paclitaxel (PTX). c-d, Mice received daily IP injections of either DMSO or 50 mg/kg of TMP195 alone or in combination with IP injections of 250 μg of anti-PD-1. d, The total tumor burden at day 21 compared to the DMSO control is plotted. Statistics represent unpaired student t-test. Mice that died due to unrelated experimental reasons are indicated on the graph. Significance: *P<0.05, **P<0.01, ***P<0.001, ****P<0.0001. Statistics for all mouse experiments were performed using 2-way ANOVA. Error bars represent S.E.M.
Our findings reveal an immunostimulatory effect of class IIa HDAC inhibition that contrasts with strategies of depleting or inhibiting TAMs3,4,20 for cancer therapy. In contrast with TAM depletion (e.g. CSF-1 receptor tyrosine kinase inhibitors and anti-CSF-1 or anti-CSF-1R mAbs)2, TMP195 reduces autochthonous MMTV-PyMT tumor burden as a single agent by recruiting anti-tumor, highly phagocytic and co-stimulatory TAMs. Class IIa HDAC inhibition leverages the effector functions of macrophages, opening the door to clinically-relevant cooperation of checkpoint blockade22,23, agonistic αCD404 or inhibitory αCD4724 therapy, peptide vaccine therapy25 or the antibody-dependent cellular phagocytosis (ADCP) associated with mAb therapy26. Indeed, the innate immune system is the natural complement to the adaptive immune system that surveys and fights tumors, and these studies demonstrate a novel approach to harness innate immune cells to cooperate with agents that stimulate an adaptive anti-tumor immune response in an otherwise resistant cancer.
Materials and Methods
Histone Peptide Array Binding Assay
Recombinant HDAC7 catalytic domain (amino acids 483–903) was labeled with DyLight® 650 according to manufacturer’s instructions using the DyLight® 650 Microscale Antibody Labeling Kit (Thermo Scientific #84536) and applied to an arrayed library of 3868 immobilized 20-mer peptides derived from histone proteins with a variety of known modifications (Histone Code Microarray, JPT Peptide Technologies, Berlin, Germany).1 Arrays were conducted using an automated TECAN HS4 microarray processing station, initiated by incubation with blocking buffer (Superblock TBS T20, Pierce International #37536) for 30 minutes at 30 °C followed by washing with saline containing 50 mM Tris Base and 0.1% Tween-20 (pH 7.2) prior to incubation with the labeled HDAC7 protein for 120 minutes at 4 °C. In the case of TMP195 competition experiments, the labeled protein was pre-incubated with TMP195 for 30 minutes prior to application to the array. The microarrays were then washed prior to being dried and imaged with an Axon GenePix Scannder 4200AL. Spot recognition and fluorescence intensity was performed using GenePix software (Molecular Devices), and MMC2 values (mean of the three instances of each peptide on the microarray except when the standard deviation is greater than half of the mean) were calculated for each 20-mer. In cases where an MMC2 value is not calculated, the mean of the two closest values (MC2) is used for analysis.
BRD4 TR-FRET Biochemical Assays
Compound binding to either the BD1 or BD2 domains of BRD4 were assessed as previously described.2 Briefly, BRD4 binding is assessed by displacement of a fluorogenic substrate (AlexaFluor647 labelled N-(5-aminopentyl)-2-((4S)-6-(4-chlorophenyl)-8-methoxy-1-methyl-4Hbenzo[f][1,2,4]triazolo [4,3-a][1,4]diazepin-4-yl)acetamide) from recombinant BRD4 proteins (a.a. 1–477) containing a mutation in either BD1 (Y97A) or BD2 (Y390A) and a 6X-Histidine tag. Detection of substrate binding is achieved addition of Eu-W1024 Anti-6X-Histidine Antibody (AD0111 PerkinElmer) and measurement of time-resolved Forster (fluorescence) resonance energy transfer (TR-FRET) on an Envision (Perkin Elmer) reader. The donor and acceptor counts were determined and the ratio of acceptor/donor fluorescence was calculated (λex = 337 nm, λem donor = 615 nm, λem acceptor = 665 nm) and used for data analysis. All data was normalized to the robust mean of 16 high and 16 low control wells on each plate. A four parameter curve fit of the following form was then applied: y = (a – d) / (1 + (x / c)b) + d
Where ‘a’ is the minimum, ‘b’ is the Hill slope, ‘c’ is the pIC50 and’d’ is the maximum.
Mouse experiments:
For all transgenic mouse experiments virgin female FVB/N transgenic mice carrying the polyoma middle T (PyMT) transgene under the control of the mammary tumor virus (MMTV) promoter were used. All mice were maintained within the Dana-Farber Cancer Center (DCFI) animal facility and all experiments involving animals were conducted in accordance with the GSK Policy on the Care, Welfare and Treatment of Laboratory Animals and were reviewed and approved by the DFCI Institutional Animal Care and Use Committee approved. The policy at Dana-Farber Cancer Institute is as follows: If any individual tumor reaches 2 cm in size, then the animal must be euthanized. For multiple tumors on one animal, body condition scoring is used for endpoints. If an animal with multiple tumors reaches a body condition score of 2 out of 53, it must be euthanized. Other reasons for euthanasia for animal with multiple tumors include difficulty in ambulation (tumors on axillary or flank region that make it difficult for the animal to walk), tumors around the ventral neck, tumors of head/ears, ulceration of any tumor (unless approved by IACUC), or any other reason that would indicate that the tumor burden is painful or distressful to the animal.
MMTV-PyMT transgenic mice were obtained from The Jackson Laboratory (002374). Mice that were approximately 80 days old were randomized and enrolled into the study when their tumor burden was between 300–600 mm3, unless otherwise noted. Although female mice have 10 mammary fat pads, tumors from mammary fat pad positions 5 and 10 were excluded from all experiments and analysis. Caliper measurements were used to calculate the tumor volume from each mammary tumor (tumors 1–4 and 6–9) using [(Length × Width2)/2]. The sum of the volume from each tumor on a mouse was combined to generate “total tumor burden”. When possible, tumor measurements were performed blinded to the treatment. At the indicated time points animals were euthanized in a CO2 chamber before performing a cardiac perfusion with normal saline. Lungs and tumors were then removed for analysis.
Two transplant experiments were performed where tumors were extracted from MMTV-PyMT mice and 50–100 mm3 pieces were inserted into the 4th mammary fat pad of either wild-type FVBN mice or athymic nude Foxn1nu mice. Five days after implant mice were randomly placed into treatment groups and treated as indicated.
Immunohistochemistry:
Tumors were extracted and fixed in 10% formalin overnight. Tumors were embedded in paraffin and sectioned at the Rodent Pathology Core at Harvard Medical School. Preceding immunohistochemical staining, tumor sections were exposed to two washes with Histo-Clear II (National Diagnostics, cat. #HS-202), two washes with 100% ethanol, and subsequent hydration with washes of 90%, 80%, 70%, and 50% ethanol. Antigen unmasking was achieved by heating sections in 10mM sodium citrate buffer (pH 6.0). After cooling, sections were washed in dH20, incubated in 3% Hydrogen peroxide for 10 minutes at room temperature, washed in dH20 again, and then washed in 1X PBS. Antigen blocking was carried out by incubating sections in PBS buffer containing 0.5% Tween, 1% BSA plus 5% serum for 1 hour at room temperature. Sections were then stained in block buffer containing primary antibody (anti-mouse F4/80, clone BM8, BioLegend cat. #123101, 1:50; anti-mouse CD11b, clone EPR1344, Abcam® cat. #ab133357, 1:50; anti-mouse cleaved caspase-3 (Asp175), Cell Signaling Technology cat. #9661S, 1:300; anti-mouse CD34, clone MEC14.7, BioLegend cat. #119301, 1:100; anti-mouse Ki67, clone D3B5, Cell Signaling cat. #12202S, 1:400; CD40 Abcam (ab13545) 1:200); 1:200 Mac-2 (BioLegend cat. #125403, clone M3/38) overnight in a wet chamber at 4°C in the dark. The following day, sections were washed three times in 1X PBS and stained with secondary biotinylated antibody in PBS block buffer for 1 hour at room temperature. Sections were washed three times with 1X PBS and Elite Vectastain ABC Kit (Vector Laboratories, PK-6100) was applied for 30 minutes per manufacturer’s instructions at room temperature in the dark. Sections were washed with 1X PBS, developed with DAB reagent (Peroxidase Substrate Kit, Vector Laboratories, cat. #SK4100), and counterstained with hematoxylin. Sections were then exposed to two washes with dH20, one wash with 1X PBS, and subsequent washes of increasing ethanol concentration for dehydration followed by incubation in Histo-Clear II. Slides were mounted with VectaMount Permanent Mounting Medium (Vector Laboratories, H-5000) and No. 1 glass coverslips (Denville Scientific, cat. #M1100–02) and allowed to cure for 24 hours. Sections were viewed with an Olympus BX43 Trinocular Microscope. For all IHC quantitation ten randomly selected fields from at least 4 different tumors in each treatment group were used to quantitate the percent of tissue positive for each marker using ImageJ software4. Images were converted to a greyscale red-green-blue (RGB) stack. Positive stain in the “blue” greyscale image was quantified at the appropriate threshold as %total image area positive for stain. Quantitation as percent of total tissue is shown to the right of each representative section.
Pulmonary metastasis analysis:
Lungs were removed from animals as described above. Lungs were fixed overnight in 10% buffered formalin and sent to the Rodent Pathology Core at Harvard Medical School for paraffin embedding, sectioning, and hematoxylin and eosin (H&E) staining. The number of metastatic foci are determined on sections taken every 100 uM throughout the whole lung5,6 and quantitation was performed blinded by an animal pathologist.
Tumor digestion:
Tumors were extracted and finely minced. Tumor tissue was additionally blended with the gentleMACS Dissociator (Miltenyi cat. #130-093-235) and digested with MACS Miltenyi Tumor Dissociation Kit for mouse (Miltenyi Biotec cat. #130-096-730) according to manufacturer’s instructions. Dissociated tumor cells were washed with RPMI Medium 1640 (Life Technologies cat. # 11875-093) and lysed with RBC Lysis Solution (Qiagen cat. #158904).
Dosing:
For all mouse experiments mice were treated via intraperitoneal (IP) injections of 50 μL the vehicle dimethyl sulfoxide (DMSO) or 50 μL of TMP195 dissolved in 100% DMSO at a final concentration of 50 mpk daily. Paclitaxel and Carboplatin were obtained from the Dana-Farber Cancer Institute pharmacy and were dosed at 10 mpk and 50 mpk, respectively, every 5 days via intravenous (IV) injections. For PD-1 checkpoint blockade, mice were treated with three injections of 250 μg of anti-PD-1 on days 2, 5 and 8 (BioXCell clone RMP1-14; cat. # BE0146). The length of dosing is indicated in each experiment.
Immunocytochemistry:
Tumor cells were acquired from three DMSO and three TMP195 5-day treated autochthonous MMTV-PyMT mice. CD11b+ cells were purified using the automacs (Miltenyi) automated machine according to manufacturer’s protocol. CD11b cells were labeled with a CD11b-biotin antibody (101204, BioLegend) and retrieved with ultrapure biotin beads (Miltenyi 130-105-637). Following purification, CD11b+ cells were cytospun at 300 rpm for 5 minutes onto slides. Cells were fixed in 4% PFA/Sucrose solution for 5 minutes at RT and stored in 4°C until ready for use. Upon experimentation, slides were permeablized with 0.03% Triton-X for 10 minutes, followed by three 5 minute rinses with 1x PBS. Samples were blocked with 10% Normal Goat Serum (NGS) in 1x PBS for 1 hour at RT. Next cells were stained for the following antibodies anti-mouse/human CD11b (101201, BioLegend), anti-mouse F4/80 (Bio-Rad, MCA497R), and Alexa Fluor 594 anti-mouse CD326 (Ep-CAM) (118222, BioLegend) at 1:100, 1:50 and 1:25 dilution in 1% NGS/1xPBS respectively overnight at 4°C. The following morning, samples were rinsed three times with 1X PBS for five minutes each, replaced with Alexa Fluor 488 goat anti-rat IgG (405418, BioLegend) at 1:200 dilution in 1% NGS, and incubated for one hour at RT. All samples were counterstained with Dapi (P36930, Life Technologies) at 1:1000 dilution in 1% NGS. Next, the samples were rinsed three times for 5 minutes each with 1X PBS. Slides were dehydrated 2x with 95% ethanol and 1x with 100% ethanol. Coverslips were mounted using Prolong Gold antifade reagent (936930, Life Technologies) and imaged with Leica SP5X: Laser Scanning Confocal microscope at 40X magnification. For analysis immunocytochemistry images were assessed by using a co-localization pipeline. In general, the pipeline identified a primary image (nucleus) and a secondary image (CD11b+). The overlapped images were identified as a “cell”. To avoid background signal, a minimum threshold was applied for the protein of interest (CD11b, F480 and EPCAM) and only the masked objects that had fell within the given dynamic range were considered CD11b or F480 positive. Finally the overlapped image identified as “cell” was masked with the threshold image of the EPCAM. Objects identified as positive for CD11b and EPCAM or F480 and EPCAM were normalized to the number of CD11b or F480 positive cells per image, and portrayed as an average percentage. A total of 60 individual CD11b+ cells and a total of 100 individual F480+ cells were analyzed from each treatment group.
Depletion experiments:
For CSF1 depletion, mice were injected IP with 1 mg of anti-CSF1 (BioXCell BE0204; clone 5A1) 1 day before treatment with vehicle or compound, and then with 0.5 mg every 5 days5. For CD11b depletion mice were injected IP with 100 μg of anti-CD11b (clone M1/70; BioLegend 101231) one day before treatment with vehicle or compound, and then every other day.7 For CD8 immune cell depletion, mice were injected IP with 1 mg anti-CD8 immunoglobulin (BioXCell BE0117; clone YTS169.4) or control IgG2b (BioXCell BE0090; clone LTF-2) on day 1 and then with 0.5 mg every 5 days for 2 week study. For 6-day experiment mice were dosed with: IgG1 (BioXcell BE0088; clone HRPN), α-CD8 (BioXcell BE0117; clone YTS169.4), α-CD4 (BioXcell BE0033-1; clone GK1.5) and α-INFγ (BioXcell BE0055; clone XMG1.2) with 1mg on day 0 and 0.5 mg on day 4; except α-CD4 which was dosed at 400 μg on day 0 and 400 μg on day 4.
Monocyte tracking experiment:
Monocyte tracking was adapted and modified from Qian et al8. Bone marrow cells were isolated from approximately 80 day old wild-type FVB/N virgin females. CD11b+ cells were isolated with CD11b MicroBeads (Miltenyi Biotec 130-049-601) using LS magnetic separation columns (Miltenyi Biotec 130-042-401) per manufacturer’s instruction. CD11b+ cells were incubated with 10 μM of CFSE (ThermoFisher C34554) for 15 minutes at 37°C. Cells were washed and injected IV into mice who had been treated for one day with DMSO or TMP195. Mice were treated for an additional 5 days and tumors were harvested. The percent of CD11b+CFSE+ double positive cells was assessed by flow cytometry.
New vs. pre-existing macrophage dextran experiment:
Macrophage labeling was adapted from Lohela et al.9 MMTV-PyMT tumor-bearing mice were injected with 0.25 mg/mouse (10 mpk) low molecular weight (10,000 MW) Alexa555-labelled dextran (Life Technologies D34679) which is readily taken up by phagocytic cells. Mice were then treated for 5 consecutive days with DMSO or TMP195. Two hours before the mice were sacrificed they were injected with 0.25 mg/mouse of another low molecular weight (10,000 MW) dextran, this time labeled with Alexa594 (Life Technologies D22913)9. Tumors were collected as described above and flow cytometry was performed. Macrophages that ingested the Alexa555-labelled dextran from the first injection survived for at least 5 days because at the end of the experiment there were a high number of Alexa555+ macrophages that were also Alexa594+. We designated the F480+Alexa555+Alexa594+ cells as pre-existing macrophages because these macrophages existed for the first and second dextran injections. The F480+ cells that were negative for the first dextran injection (Alexa555−) but positive for the second dextran (Alex594+) were defined as new macrophages because they did not exist for the first dextran injection. Mice that received only one of the dextran conjugates were used as controls for flow cytometry.
Heavy dextran leaky vasculature experiment:
Tumor bearing mice that had been treated for 5 days with vehicle or TMP195 were injected with a heavy molecular weight (250 kDa; Sigma-Aldrich FD250S) dextran labeled with FITC10. After 10 minutes, mice were sacrificed. In this case, the mice did not undergo cardiac perfusion. Tumors were removed and placed in a 4% PBS/Paraformaldehyde solution overnight, then embedded in a 20% sucrose solution overnight. Tumors were embedded in an optimum cutting temperature (OCT) solution and stored at −80°C prior to sectioning and staining. The extent of the heavy dextran that permeated through the vasculature was visualized by immunofluorescence.
Western Blot Analysis:
Tumors were manually dissociated using a blade before being lysed in complete RIPA lysis buffer for 2 hours at 4°C. Complete RIPA is a combination of RIPA lysis buffer, a protease inhibitor, and Phenylmethylsulfonyl fluoride (PMSF). After incubation in RIPA, the lysates were centrifuged at 10,000 rcf for 10 minutes and the supernatant was collected for analysis. Protein concentration was measured using a Bicinchoninic acid (BCA) assay as per manufacturer’s instructions. Equal protein concentrations were mixed into NuPAGE LDS sample buffer, beta mercaptoethanol (BME), and complete RIPA buffer before being heated for 10 mins at 90°C to denature the protein. The gels were run on 15 wells 4–12% Bis-Tris Protein gels for 2 hours at 110 volts before being transferred onto a PVDF membrane. The blots were blocked in a 5% milk and PBST solution, and placed in primary antibody overnight. Blots were then incubated in secondary antibody for 1 hour before being developed with supersignal west PICO chemiluminescence substrate and FEMTO supersignal maximal sensitivity substrate. A Luminescent Image Analyzer LAS-4000 was used to develop blots. Primary antibodies purchased from Cell Signaling Technology were used: cleaved caspase 3 (D175), PARP (9542S) and Actin. Antibodies were diluted to a 1:1000 solution in 1% BSA, and sodium azide diluted to 1:500. Secondary mouse antibody (NA931), and secondary rabbit antibody (NA934) were purchased from life sciences and were made in a 5% milk PBST solution at a 1:6000 concentration.
Immunofluorescence:
Tumors were extracted and fixed in 4% PFA, cryopreserved in 20% sucrose and snap-frozen in O.C.T. compound (Fisher Healthcare, cat. #4585). Frozen tissues were cryosectioned at the Rodent Pathology Core at Harvard Medical School. Preceding immunofluorescent staining, sections were fixed for 10 minutes in acetone pre-cooled to −20°C, washed three times in ice cold 1X PBS, and blocked in 1X PBS with 10% BSA for 1 hour at room temperature. Sections were stained with fluorochrome-conjugated antibody (anti-mouse EPCAM Alexa Fluor® 594, clone G8.8, BioLegend cat. #118222, 1:200; anti-mouse F4/80 Alexa Fluor® 647, clone BM8, BioLegend 123121, 1:50) overnight in a wet chamber at 4°C in the dark. The next day, sections were washed three times in ice cold 1X PBS and counter stained with DAPI (FluorPure™ Grade, Life Technologies cat. #D21490) at 0.5ug/ml for 8 minutes. Following additional washes with 1X PBS, sections were mounted with ProlongGold mounting media and No. 1.5 coverslips (Corning, cat. #2870–22) and allowed to cure for 24 hr at room temperature in the dark. Sections were imaged on a Leica SP5X Laser Scanning Confocal Microscope and z-stacks were captured using Leica Application Suite software. ImageJ software1 was used to create merged, flattened images.
Flow cytometry:
Tumors were extracted and processed as described above prior to re-suspension in Phosphate buffered saline (PBS) (Life Technologies cat. #10010–023) buffer containing 2% FBS and 2mM EDTA (Sigma-Aldrich cat. #E7889) for flow cytometric analysis. Zombie Aqua™ Fixable Viability Kit (Biolegend cat. #423101) was applied to cells in combination with anti-mouse CD16/CD32 Fc gamma receptor II/III blocking antibody (Affymetrix cat. # 14–0161) for 15 minutes on ice in the dark. Cells were washed and incubated with fluorochrome-conjugated antibody (anti-mouse CD45 Alexa Flour® 488, clone 30-F11, BioLegend cat. #103121; anti-mouse F4/80, clone BM8, BioLegend PerCP/Cy5.5 cat. #123127; anti-mouse CD11b APC, clone M1/70, BioLegend cat. #101211; anti-mouse CSF-1R/CD115, clone AFS98, BioLegend cat. #135517; anti-mouse I-A/I-E, clone M5/114.15.2, BioLegend cat. #107631) at the manufacturer’s recommended dilution for 30 minutes on ice in the dark. For samples requiring intracellular staining (ICS), cells were fixed with Fixation/Permeablization Diluent (eBioscience cat. #00-5223-56) for 30 minutes at room temperature, washed twice with Permeablization Buffer (eBioscience cat. #00-8333-56), and incubated with antibody (anti-mouse EPCAM APC/Cy7, clone, G8.8, BioLegend cat. #118217; anti-mouse CD206, clone C06862, BioLegend cat. #141705) in Permeabilization Buffer for 30 minutes at room temperature in the dark. Following staining, cells were washed again with Permeabilizaton Buffer, subsequently washed with PBS, and re-suspended in PBS buffer for flow cytometric analysis on the BD LSRFortessa X-20 at the Hematologic Neoplasia Flow Cytometry Core of the Dana-Farber Cancer Institute. One to five hundred million cells were analyzed per sample per mouse using BD FACS Diva Software.
Cell Sorting:
Tumor cells were isolated and processed as previously described. To enrich for CD45+ immune cells, EPCAM+ tumor cell depletion was carried out. Whole tumor cell suspension was incubated with biotinylated anti-EPCAM antibody (MACS Miltenyi cat. #130-101-859, clone caa7-9G8) for 10 minutes followed by incubation with Anti-Biotin Microbeads (MACS Miltenyi cat. #130-090-485) for 15 minutes at 4°C in the dark. Cells were washed in ice cold PBS containing 0.5% BSA and 2mM EDTA (Sigma-Aldrich cat. #E7889) (pH 7.2), and loaded onto a MACS Separation Column LS (Miltenyi cat. #130-042-401) appropriately secured on a MidiMACS Separator magnet (Miltenyi cat. #130-042-302). Following negative selection, EPCAM-depleted cells were stained for anti-mouse CD45 Alex Flour® 488 (BioLegend cat. #103121, clone 30-F11), anti-mouse CD3 BV421 (BioLegend cat. #100227, clone 17A2), anti-mouse CD11b APC (BioLegend cat. #101211, clone M1/70), and anti-mouse CD19 (BioLegend cat. #115507, clone 6D5). 7-AAD Viability Staining Solution (BioLegend cat. #420403) was applied to the cells 10 minutes prior to sorting on the BD FACSAria. CD45+/CD19-/7-AAD-/CD3+ cells and CD45+/CD19-/7-AAD-/CD11b+ cells were sorted into DMEM medium (Life Technologies cat. #11995–065) containing 2% FBS at 4°C. Cells were pelleted and immediately lysed in RNeasy® RLT buffer (RNeasy® Mini Plus Kit, Qiagen cat. #74134) containing 2-mercaptoethanol. RNA was isolated according to RNeasy® instructions in combination with RNase-Free DNase Set (Qiagen cat. #79254) standard protocol, and quality was verified with the Nanodrop™ Spectrophotometer. To obtain adequate amounts of RNA, tumors from 5 mice were pooled together for each “sample”.
Gene array experiments
All procedures were performed at Boston University Microarray Resource Facility as described in the GeneChip® Whole Transcript (WT) Plus Reagent Kit Manual (Affymetrix, Santa Clara, CA). Briefly, the total RNA was isolated using an RNeasy kit (Qiagen), and the sample integrity was verified using RNA 6000 Pico Assay RNA chips run in Agilent 2100 Bioanalyzer (Agilent Technologies). The total RNA (200 ng) was reverse transcribed using GeneChip® WT PLUS Reagent Kit (Affymetrix). The obtained cDNA was used as a template for in vitro transcription using GeneChip® WT Expression Kit (Life Technologies). The obtained antisense cRNA was purified using Nucleic Acid Binding Beads (GeneChip® WT PLUS Reagent Kit, Affymetrix) and used as a template for reverse transcription to produce single-stranded DNA in the sense orientation. During this step, dUTP was incorporated. The DNA was then fragmented using uracil DNA glycosylase (UDG) and apurinic/apyrimidinic endonuclease 1 (APE 1) and labeled with DNA labeling reagent covalently linked to biotin using terminal deoxynucleotidyl transferase (TdT, GeneChip® WT PLUS Reagent Kit, Affymetrix). IVT and cDNA fragmentation quality controls were carried out by running an mRNA Pico assay in the Agilent 2100 Bioanalyzer.
The labeled fragmented DNA was hybridized to the Gene Arrays 1.0ST for 16–18 h in GeneChip® Hybridization oven 640 at 45 °C with rotation (60 r.p.m.). The hybridized samples were washed and stained using Affymetrix fluidics station 450 as per manufacturer’s instruction (Hybridization, Washing and Staining kit, Affymetrix). Microarrays were immediately scanned using Affymetrix GeneArray Scanner 3000 7G Plus (Affymetrix). Data is deposited in the Gene Expression Omnibus repository as record GSE87164.
For two populations, a and b, the δ-factor is a slight variation of delta-score11 and is defined as:
where μ and σp(a, b) are the geometric mean and the pooled geometric standard deviation respectively. It is essentially a variance-adjusted fold change value reflecting the amount of differential expression between two classes in excess of the observed variance and represented in the same logarithmic scale as the original fold change value (i.e. a factor).
In vitro antigen presenting cell (APC) and T cell proliferation experiments:
Blood was collected from healthy donors according to the guidelines of the American Association of Blood Banks and under an IRB-approved informed consent form was purchased from Research Blood Components (Boston, MA). Human monocytes were isolated from buffy coat preparations via positive selection as per the manufacturer’s instructions (StemCell Technologies, Catalog #18058). Monocytes were differentiated into antigen presenting cells in RPMI Medium 1640 supplemented with GlutaMAX™ (GIBCO), fetal bovine serum (10% v/v), IL-4 (10 ng/ml), GM-CSF (50 ng/ml), penicillin (100 U/ml), and streptomycin (100 ug/ml) for 5 days in the presence of either 0.1% (v/v) DMSO or 300 nM TMP195. Cells were collected by washing and incubation with a solution of 5 mM EDTA in PBS (Ca2+ and Mg2+-free), prior to flow cytometric analysis of CD80 (Biolegend #305208) and CD86 (Biolegend #305418). Alternatively, harvested APCs were counted and co-cultured in culture medium (no DMSO or inhibitor present) with heterologous CD4+ T cells (isolated from buffy coats via negative selection following manufacturer’s instructions, StemCell Technologies, Catalog #15062) that had been labeled with CellTrace™ CFSE (ThermoFisher catalog #C34554) at a 10:1 T cell:APC ratio. T cell proliferation was stimulated by the addition of 200 pg/ml anti-CD3 (Biolegend Catalog #317326), and proliferation was quantified after 72 hours of co-culture by the dilution of CFSE using FlowJo software (version 9.4, Treestar, Inc.)
In vitro cell death assays:
The human breast cancer cell lines (BT20, MCF7, HCC202, T47D, MDA-MB-453 and MDA-MB-436) were obtained from ATCC. Prior to use, cell line authentication was performed by either STR profiling at Dana-Farber Cancer Institute or by Fluidigm based fingerprinting with a panel of SNPs at The Broad Institute. Cell lines were tested for mycoplasma with the MycoAlert PLUS Mycoplasma Detection Kit (Lonza LT07) according to manufacturer’s instructions. Mouse breast tumor cell lines were established from 4 different MMTV-PyMT tumor bear mice. Mouse breast tumor cell line 7333 was implanted into wild-type littermates and once the tumor formed it was removed and used to generate the tumor cell line “MMTV”. All cells were plated at 1E4 cells/well in a 96 well plate. Cells were treated for 48 hours and CellTiter-Glo was used to assess cell viability.
Statistical Analysis:
Appropriate statistical analyses were performed dependent on the comparisons made and referenced in the text and figure legends. Unless otherwise described, Student’s T tests were performed in Prism version 7 (Graphpad, Inc.), and P values are designated as * P<0.05, ** P<0.01, *** P<0.001, **** P<0.0001. Error bars represent S.E.M.
Data availability:
[Data type e.g. “Sequence”] data that support the findings of this study have been deposited in the Gene Expression Omnibus repository as record GSE87164: https://www.ncbi.nlm.nih.gov/geo/query/acc.cgi?acc=GSE87164.
Extended Data
Extended Data Figure 1. TMP195 modulates CD11b+ cells in breast tumors.
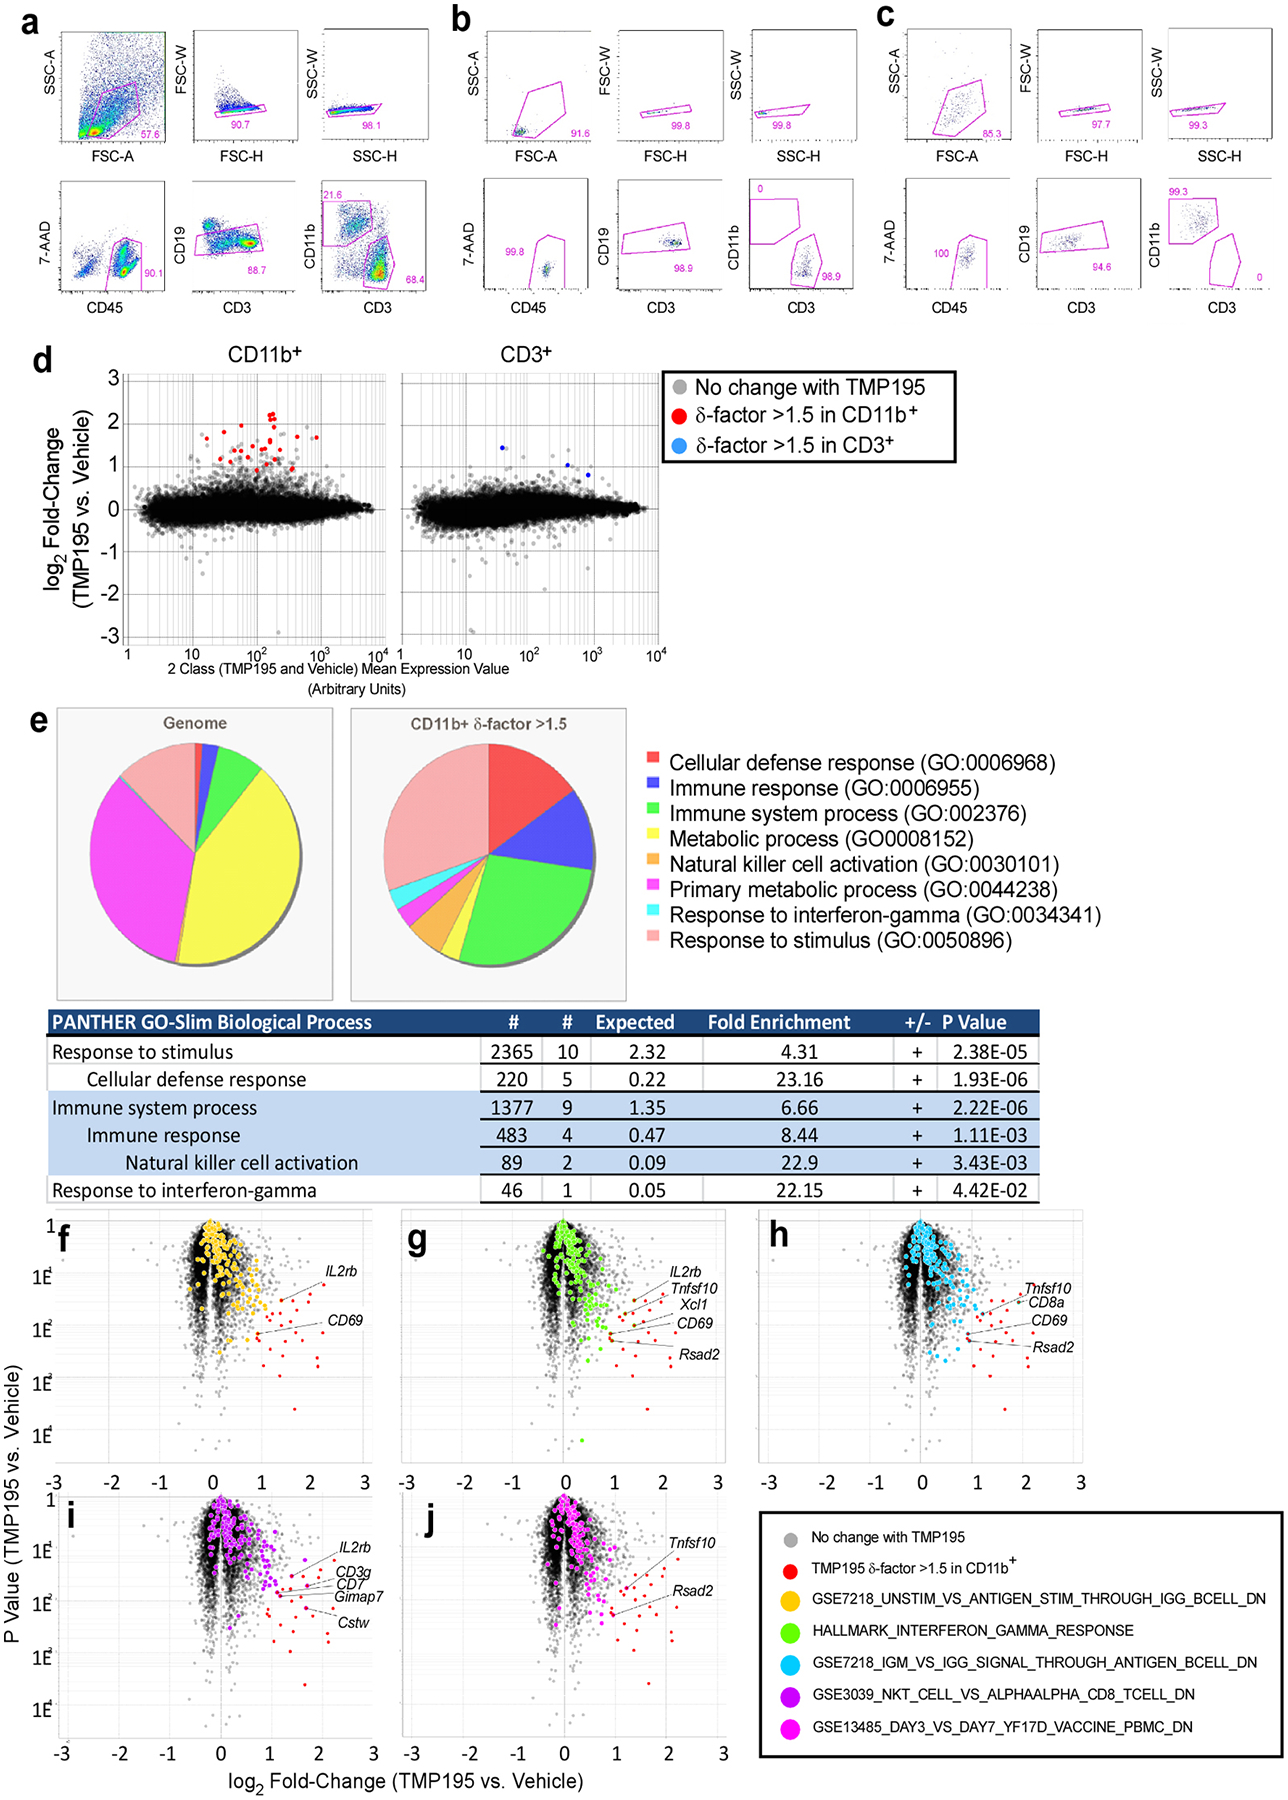
a, Gating strategy for double-sorting tumor cell suspensions. Mononuclear cells gated on the basis of FSC-A vs. SSC-A were sequentially gated to select single cells (FSC-H vs. FSC-W then SSC-H vs. SSC-W). Single cells were then gated to select live CD45+ (7-AAD vs CD45). Live CD45+ cells were then gated to select CD19− cells (CD19 vs. CD3). Live/CD45+/CD19− cells were then gated to select either CD11b+ or CD3+ cells (CD11b vs. CD3). Tumor suspensions were sorted on a BD Aria II into CD11b+ or CD3+ fractions. These fractions were concentrated by centrifugation and sorted through the same gating strategy a second time to increase the purity of each population. The purity of these double-sorted populations were confirmed for each sample prior to RNA isolation. Representative purity checks of the double-sorted CD3+ (b) and CD11b+ (c) populations are shown. d, Mean vs. Expression Value plots of Affymetrix transcriptional profiling data. All probesets are shown, highlights apply only to probesets with a δ-factor >1.5. e-j, Starting with the list of genes most affected by 5-day TMP195 treatment (δ-factor >1.5), we queried their biological processes in the PANTHER GO-Slim gene ontology database and compared that to the distribution of biological processes represented in the genome. e, The genes induced by TMP195 treatment had a significant over- or under-representation of the ontologies illustrated in the pie charts and embedded table of statistics. Unbiased analysis of TMP195-induced differential gene expression through GSEA of all probesets revealed a significant bias (χ2 P value <0.05) in the distribution of the expression values of five gene sets as highlighted on the volcano plots (Y-axis = Student’s t test P value). f-j, Probesets representing genes in both the δ-factor list we selected and the GSEA gene set are labeled with the gene symbol corresponding to that probeset.
Extended Data Figure 2. TMP195 induced recruitment of tumor infiltrating leukocytes.
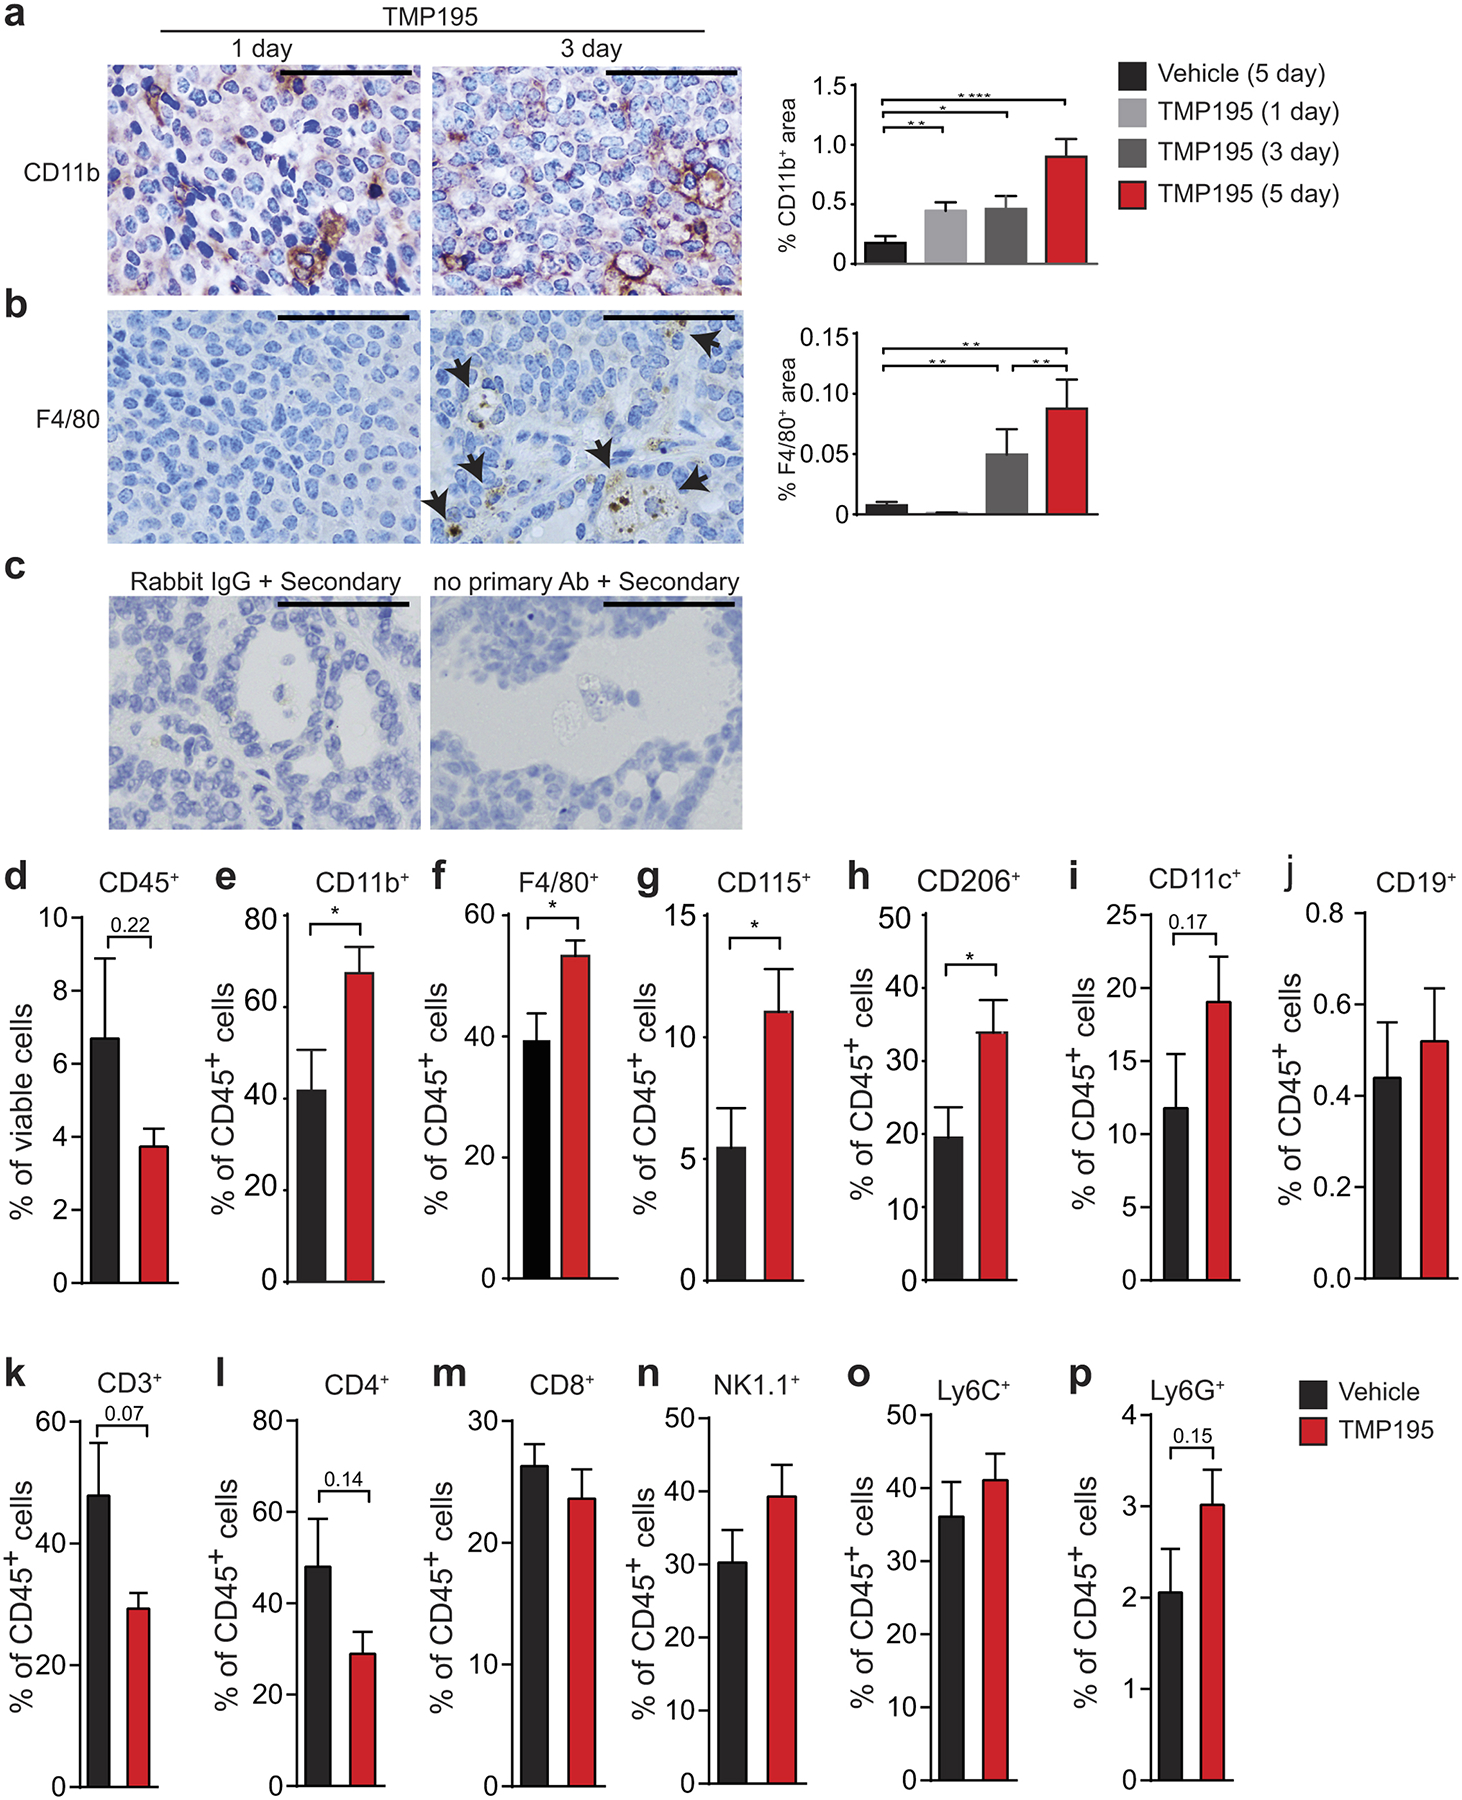
Tumor bearing MMTV-PyMT mice were randomly placed into treatment groups and received daily intraperitoneal (IP) injections of either vehicle (DMSO) or 50 mg/kg of TMP195 for the indicated days. IHC was performed on tumor sections for a, the myeloid marker, CD11b, and b, the macrophage specific marker, F480. Quantitation as percent of total tissue is shown to the right of each representative section. Vehicle (5 days of DMSO) and 5 day TMP195 quantitation is taken from Figure 1a and 2a for reference. Scale bar represents 100 μm. Significance: t test *P<0.05, **P<0.01, ***P<0.001, ****P<0.0001. c, Negative controls for the CD40 IHC staining (Fig. 2f) are shown. Both rabbit IgG and no primary antibody controls are shown in TMP195 treated tumors and reveal no background or non-specific positive signal. d-p, Whole tumors were processed into single cells and flow cytometry was performed to determine the extent of immune cell infiltration into tumors. Representative graphs are shown from at least 3 independent experiments of 3–5 animals per group. Significance: t test *P<0.05, **P<0.01, ***P<0.001, ****P<0.0001.
Extended Data Figure 3. Characterization of recruited TMP195-activated myeloid cells.
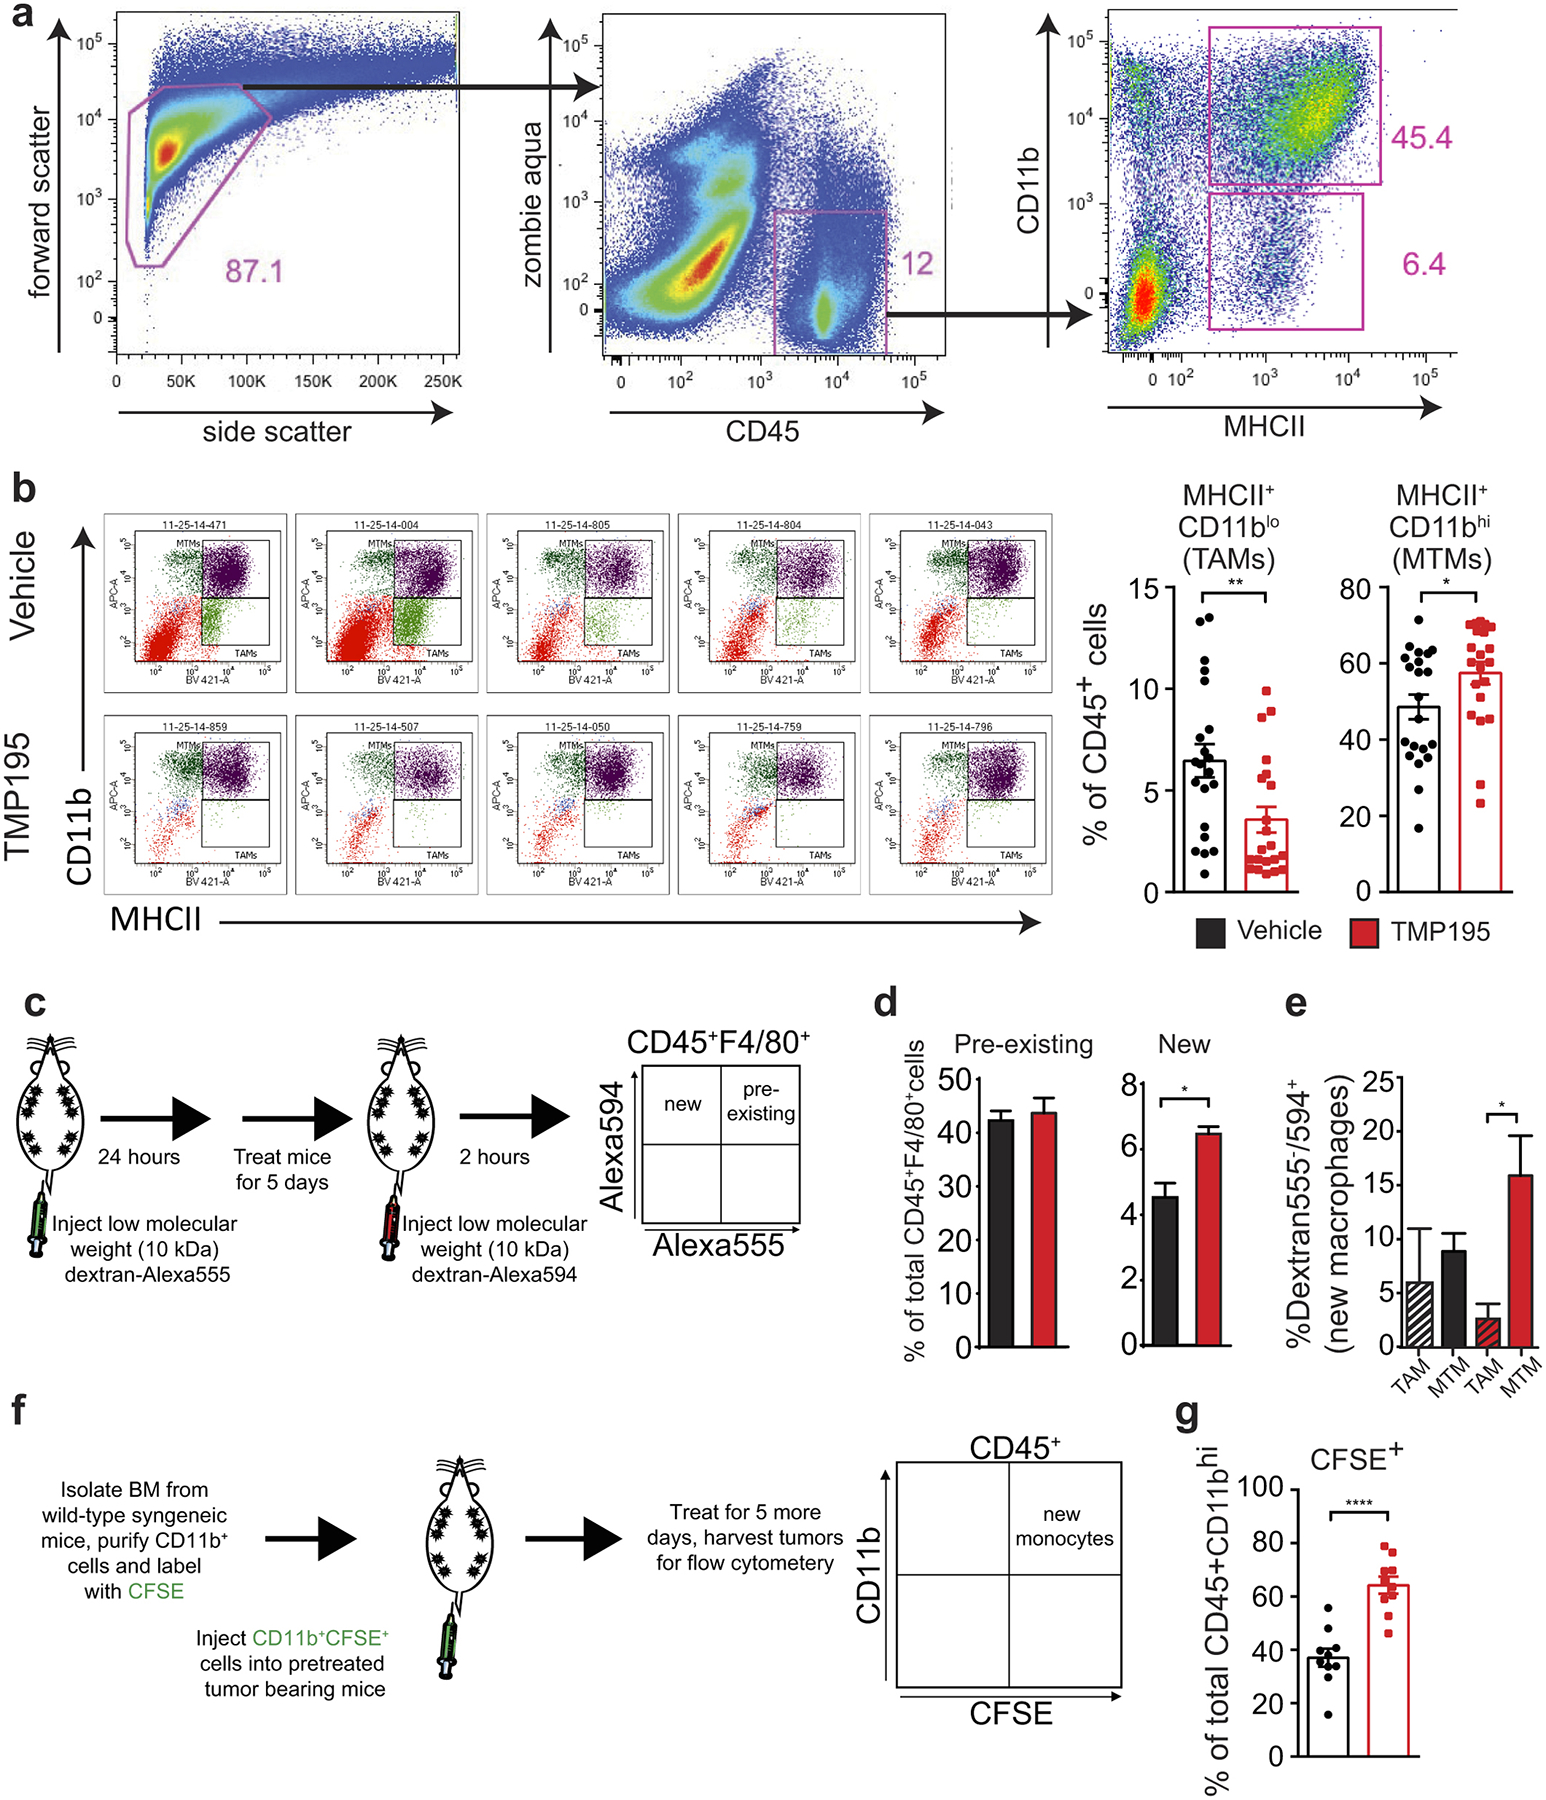
Tumor bearing MMTV-PyMT mice were randomly placed into treatment groups and received daily IP injections of either vehicle (DMSO) or 50 mg/kg of TMP195 for 5 days. Whole tumors were processed into single cells and flow cytometry was performed. a, Gating strategy for MHCII+CD11blo versus MHCII+CD11bhi. b, Representative MTM vs TAM plots of 5 vehicle treated and 5 TMP195 treated mice with quantitation. Graphs show the results from 5 independent experiments where there were 3–5 animals per treatment group. c-e, To identify pre-existing versus new tumor macrophages, mice were pretreated with dextran labelled with Alexa555, which is ingested by macrophages. Then mice were treated for 5 days with vehicle or TMP195. Mice were injected with dextran labelled with Alexa594 before sacrifice. Whole tumors were processed into single cells and flow cytometry was performed. d, There is an increase in new but not pre-existing macrophages in tumors from TMP195 treated animals. Representative graph from two separate experiments with n=3 per treatment group (unpaired t-test) e, Of note, the new macrophages are MHCII+CD11bhi (MTM). Significance: t test *P<0.05. f, Mice received one IP injection of either vehicle (DMSO) or 50 mg/kg of TMP195. The following day mice were IV injected with CD11b+ cells labelled with CFSE. Mice were then treated for an additional 5 days with vehicle or compound. g, Whole tumors were processed into single cells and flow cytometry was performed. Thirteen mice from 3 different experiments are shown. There is a significant increase in recruitment of IV injected CD11b+CFSE+ monocytes to tumors in TMP195 treated mice. Graphs show the results from 2 independent experiments (unpaired t-test). All graphs show mean and error bars represent S.E.M. Significance: *P<0.05, **P<0.01, ***P<0.001, ****P<0.0001.
Extended Data Figure 4. TMP195-activated myeloid cells are highly phagocytic, engulf breast tumor cells and are co-stimulatory.
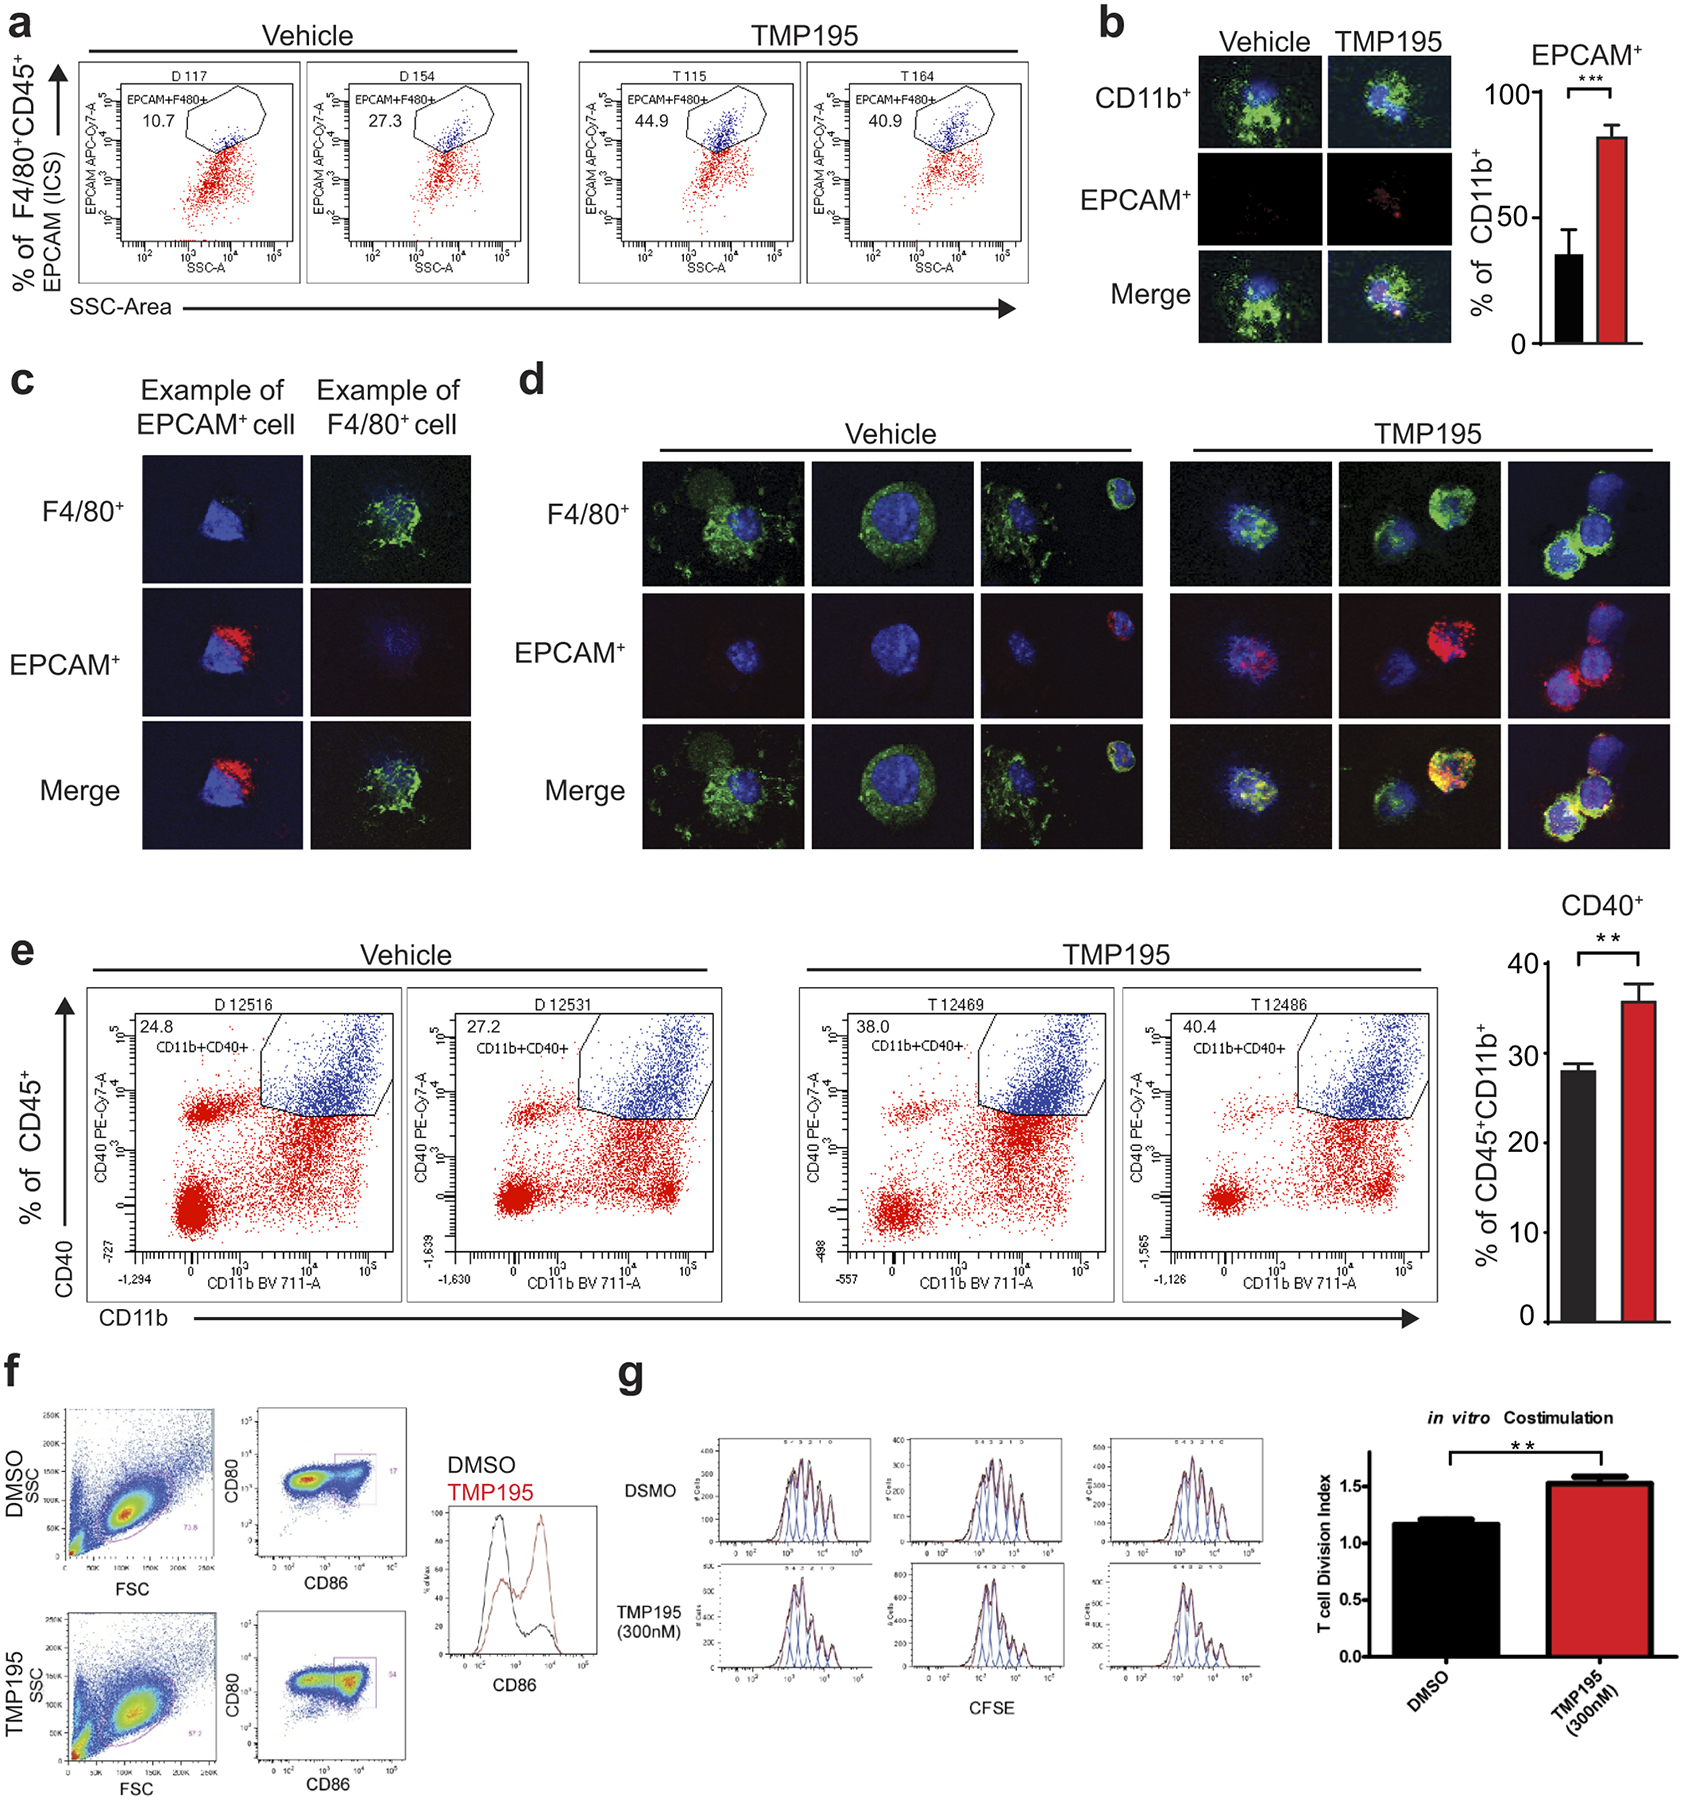
Mice were treated for 5 days with vehicle or 50 mg/kg of TMP195. Whole tumors were processed into single cells. a, Flow cytometry was performed and representative flow cytometry plots are shown indicating intracellular EPCAM signal inside F480+ macrophages, which corresponds with Figure 2c. b-d, CD11b+ cells were isolated from tumors and cytospun onto glass slides. Immunofluorescence was performed to identify phagocytosed breast tumor cells (corresponding with Fig. 2d). e, Representative flow cytometry plots of CD40+CD11b+ monocytes, and quantitation. f-g, In vitro TMP195 treatment enhances the co-stimulatory activity of monocytes differentiated in IL-4 / GM-CSF. Human monocytes purified from peripheral blood were differentiated with IL-4 and GM-CSF for 5 days in the presence of 300 nM TMP195 or 0.1% DMSO as a control. f, FACS analysis of CD80 and CD86 shows an increase in the proportion of cells expressing the co-stimulatory molecule CD86. g, Following the 5-day differentiation, monocytes were used cells as APCs in a polyclonal T cell proliferation assay (10 CFSE-labeled naïve CD4+ T cells per 1 differentiated monocyte), T cells display a higher degree of proliferation (Division Index, FlowJo, Treestar Inc.) when co-cultured with monocytes differentiated in 300nM TMP195 compared to the DMSO control monocytes. Data is representative of three independent experiments, each with two unique blood donors per experiment. Significance: t test **P<0.01.
Extended Data Figure 5. TMP195 is not directly cytotoxic.
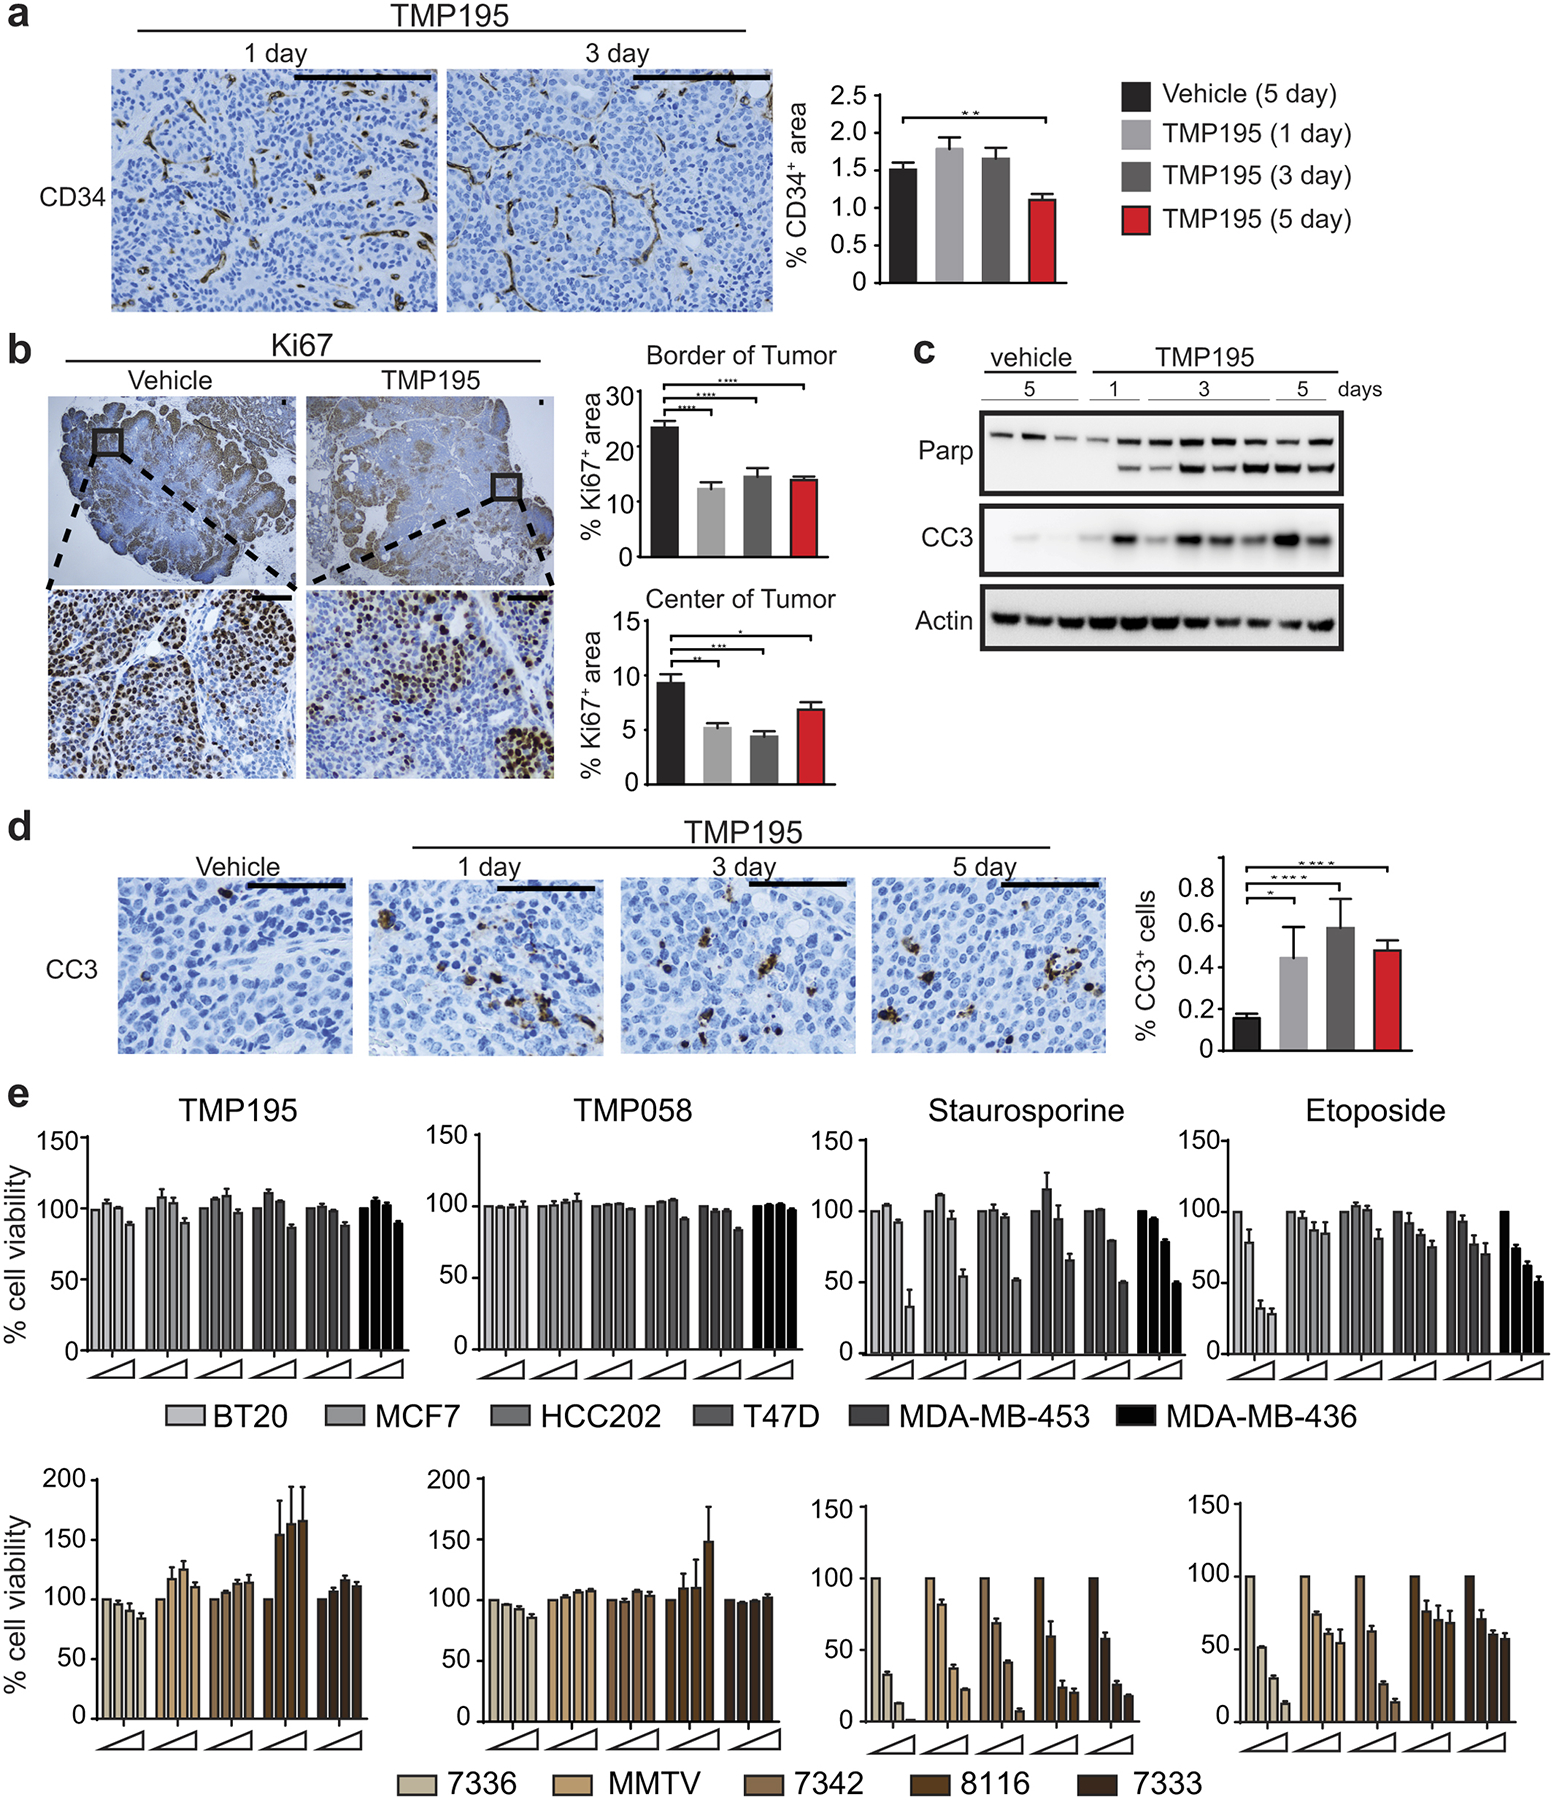
Tumor bearing MMTV-PyMT mice were randomly placed into treatment groups. Mice received daily IP injections of either vehicle (DMSO) for 5 days or 50 mg/kg of TMP195 for 1, 3, or 5 days. IHC was performed on tumor sections for a, a marker of vasculature, CD34, b, a marker of proliferation, Ki67, and d, a marker of apoptosis, cleaved Caspase 3 (CC3). Quantitation as percent of total tissue is shown to the right of each representative section. Vehicle (5 days of DMSO) and 5 day TMP195 quantitation is taken from Figure 2h for reference. For IHC representative quantitation and images are shown from two independent experiments with at least 3 mice per group. Scale bar represents 100 μm. Significance: t test *P<0.05, **P<0.01, ***P<0.001 and ***P<0.0001. c, Whole tissue lysate was used to generate lysates for immunoblotting analysis using markers of apoptosis, Parp and Cleaved caspase 3. Each lane represents an individual tumor. For gel source data, see Supplementary Figure 1. e, Human or mouse breast tumor cells were plated and treated with increasing concentrations of TMP195 (0, 0.1, 1, 10 μM), an inactive isomer, TMP058 (Ref #6; 0, 0.1, 1, 10 μM), Staurosporine (0, 1, 10, 100 ng/mL) or Etoposide (0, 10, 50, 100 μM), for 48 hours. CellTiter-Glo was used to assess cell viability. Error bars represent the average of three independent experiments. Shown in the mean and error bars represent S.E.M. An unpaired t-test was performed for all statistical values.
Extended Data Figure 6. TMP195 induces reduction in tumor burden and decreases pulmonary metastasis.
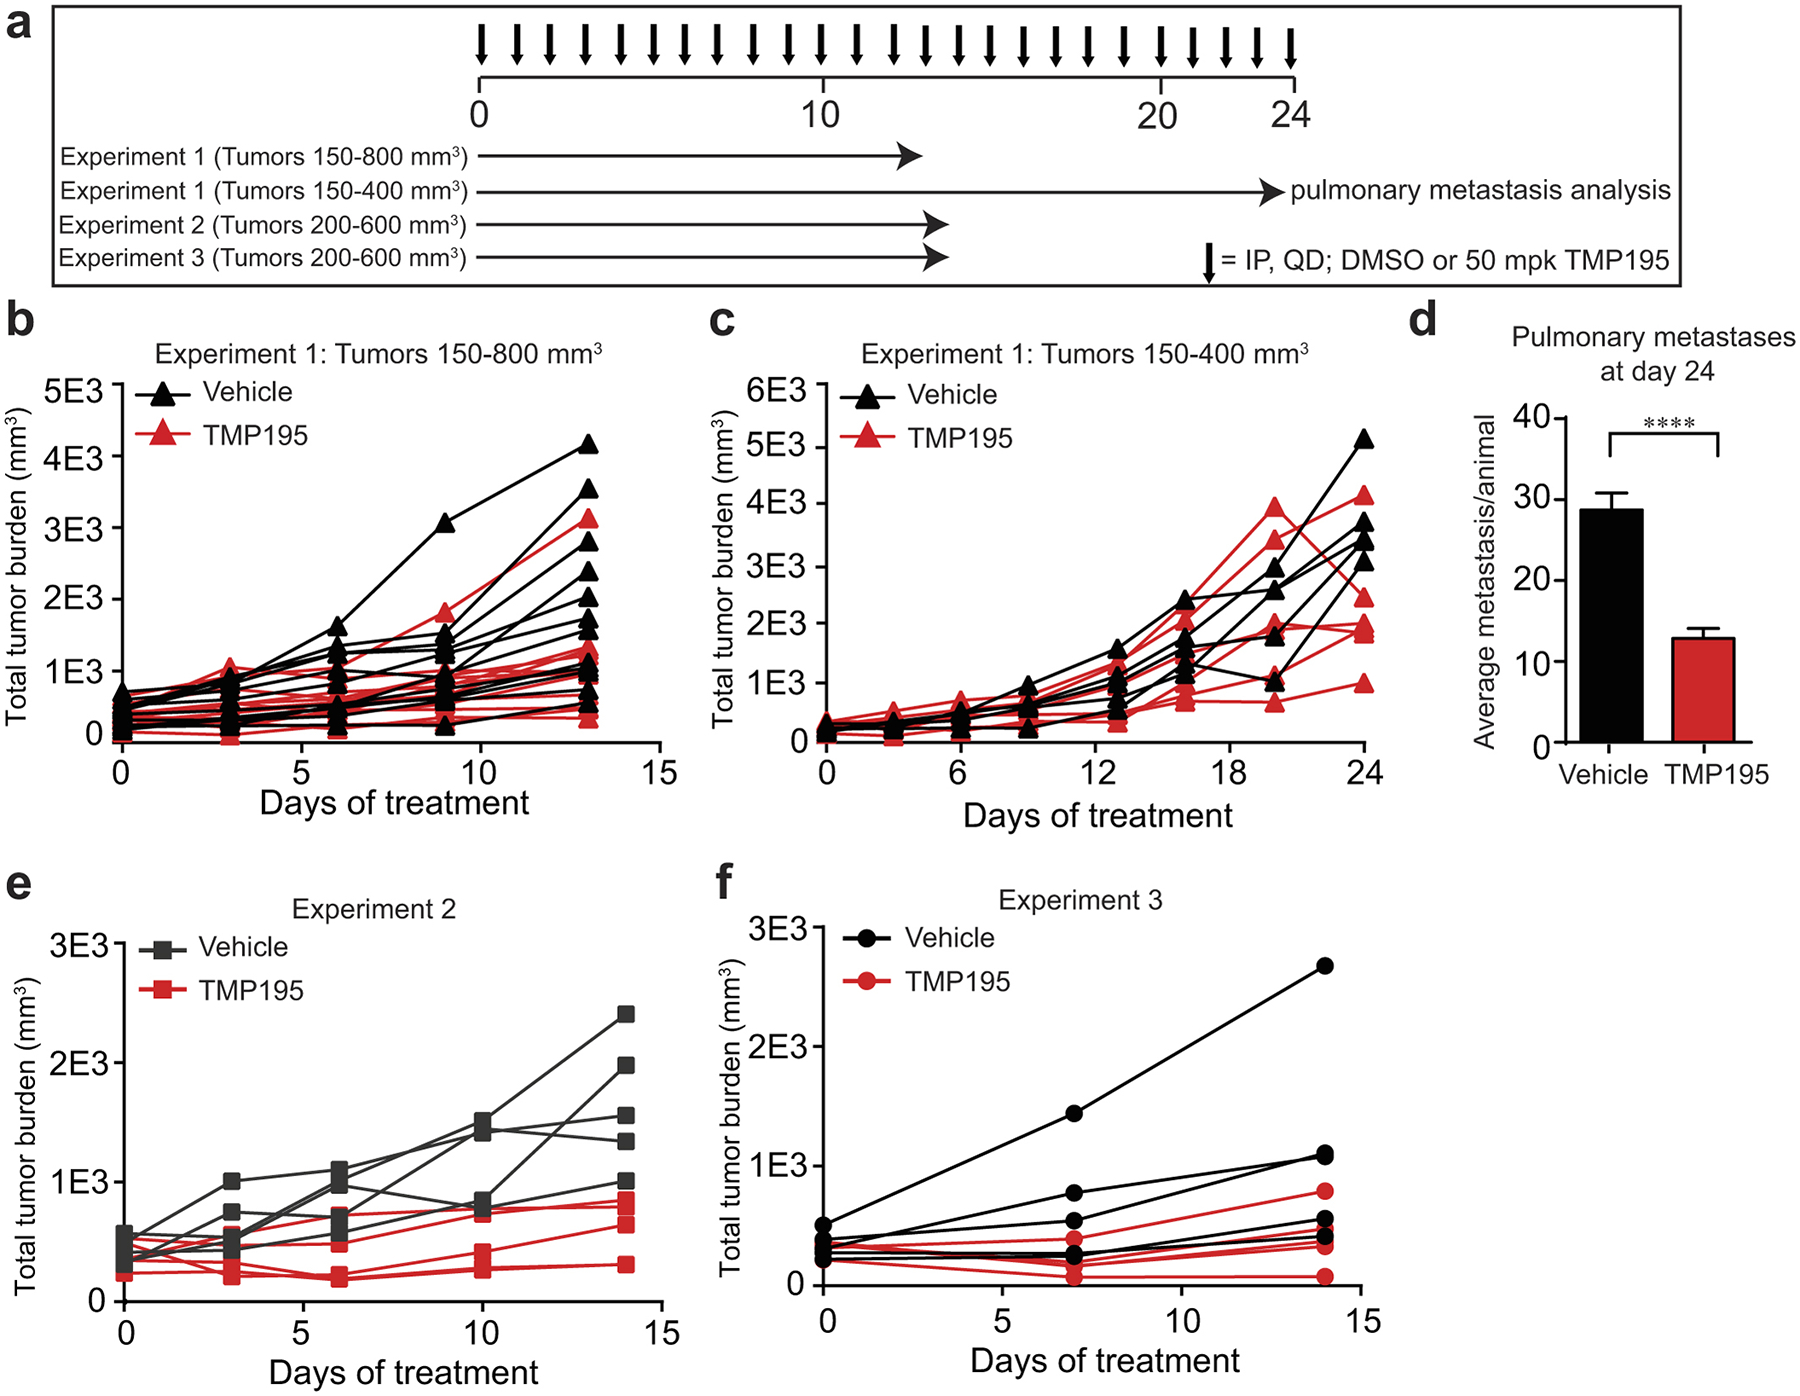
a, Treatment regimen of three independent experiments testing single agent efficacy of TMP195. b, Mice with total tumor burden between 150–800 mm3 were treated with DMSO (n=12) or 50 mg/kg of TMP195 (n=13) for 13 days. Tumor volume was measured and plotted as total tumor burden ±SEM. c, The mice whose tumors started between 150–400 mm3 were kept on therapy to day 24 (DMSO n=5; TMP195 n=6). d, At day 24 their lungs were removed and H&E was performed to assess pulmonary metastasis. The number of metastatic lesions per lung section is quantitated and the mean is shown ±SEM. Significance: t-test P ***P<0.0001. e,f, Two additional independent experiments were performed to test single agent efficacy of TMP195.
Extended Data Figure 7. Two week TMP195 treatment results in the biased distribution of select cell type signatures.
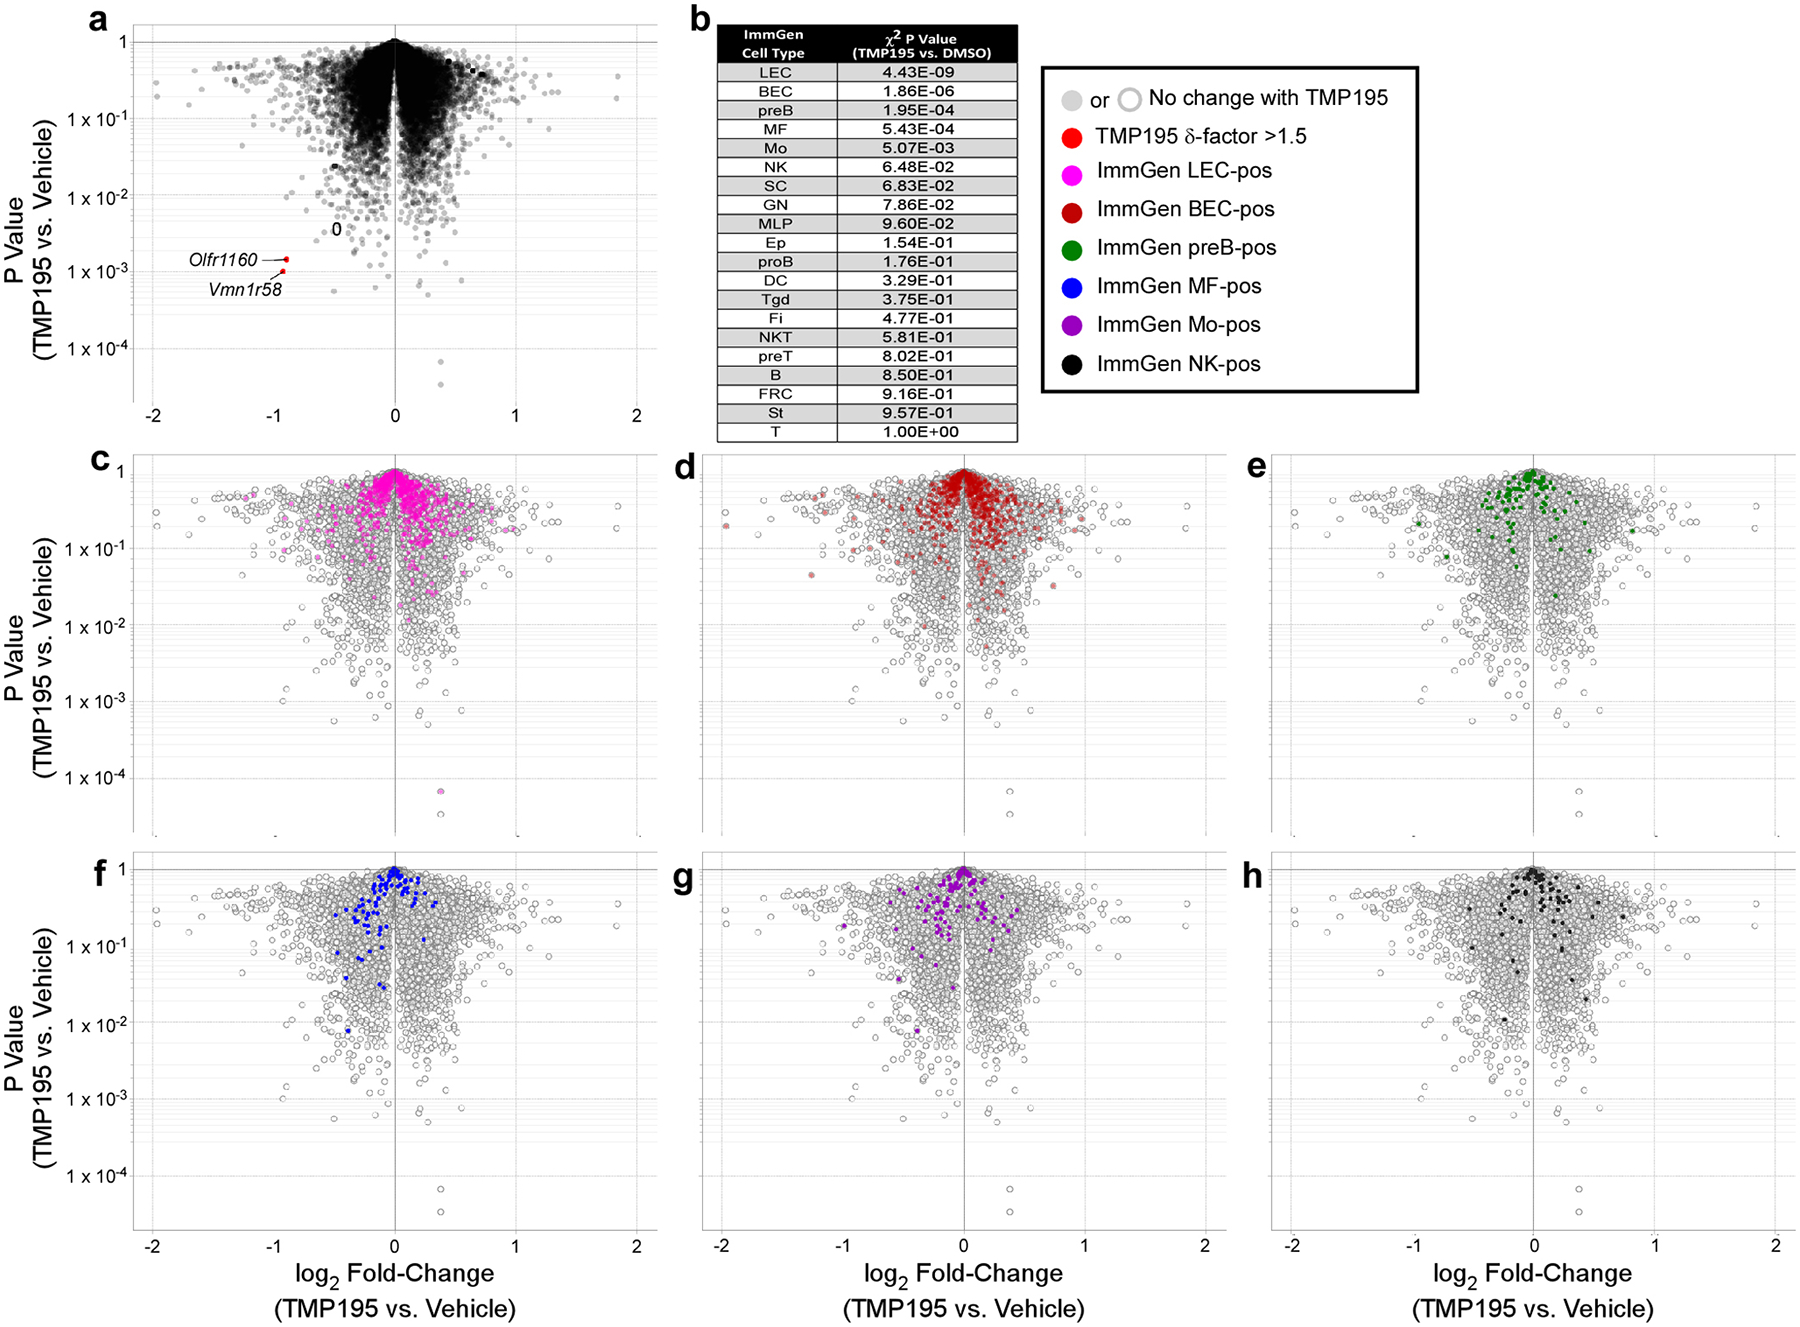
a, Volcano plot of Affymetrix gene expression in RNA isolated from whole tumors (n=3 mice per treatment group) demonstrates an overall lack of differential gene expression in these samples. However, analysis for biased enrichment of the ImmGen cell type signature gene sets identifies only 5 populations of cells as significantly (χ2 P value <0.05) affected by TMP195 treatment as listed in (b) and illustrated in the volcano plots (c-g). For a visual point of reference, the unaffected natural killer gene signature is highlighted in volcano plot h. Volcano plot y-axes are Student’s t test P values.
Extended Data Figure 8. Macrophages are required for efficacy of TMP195.
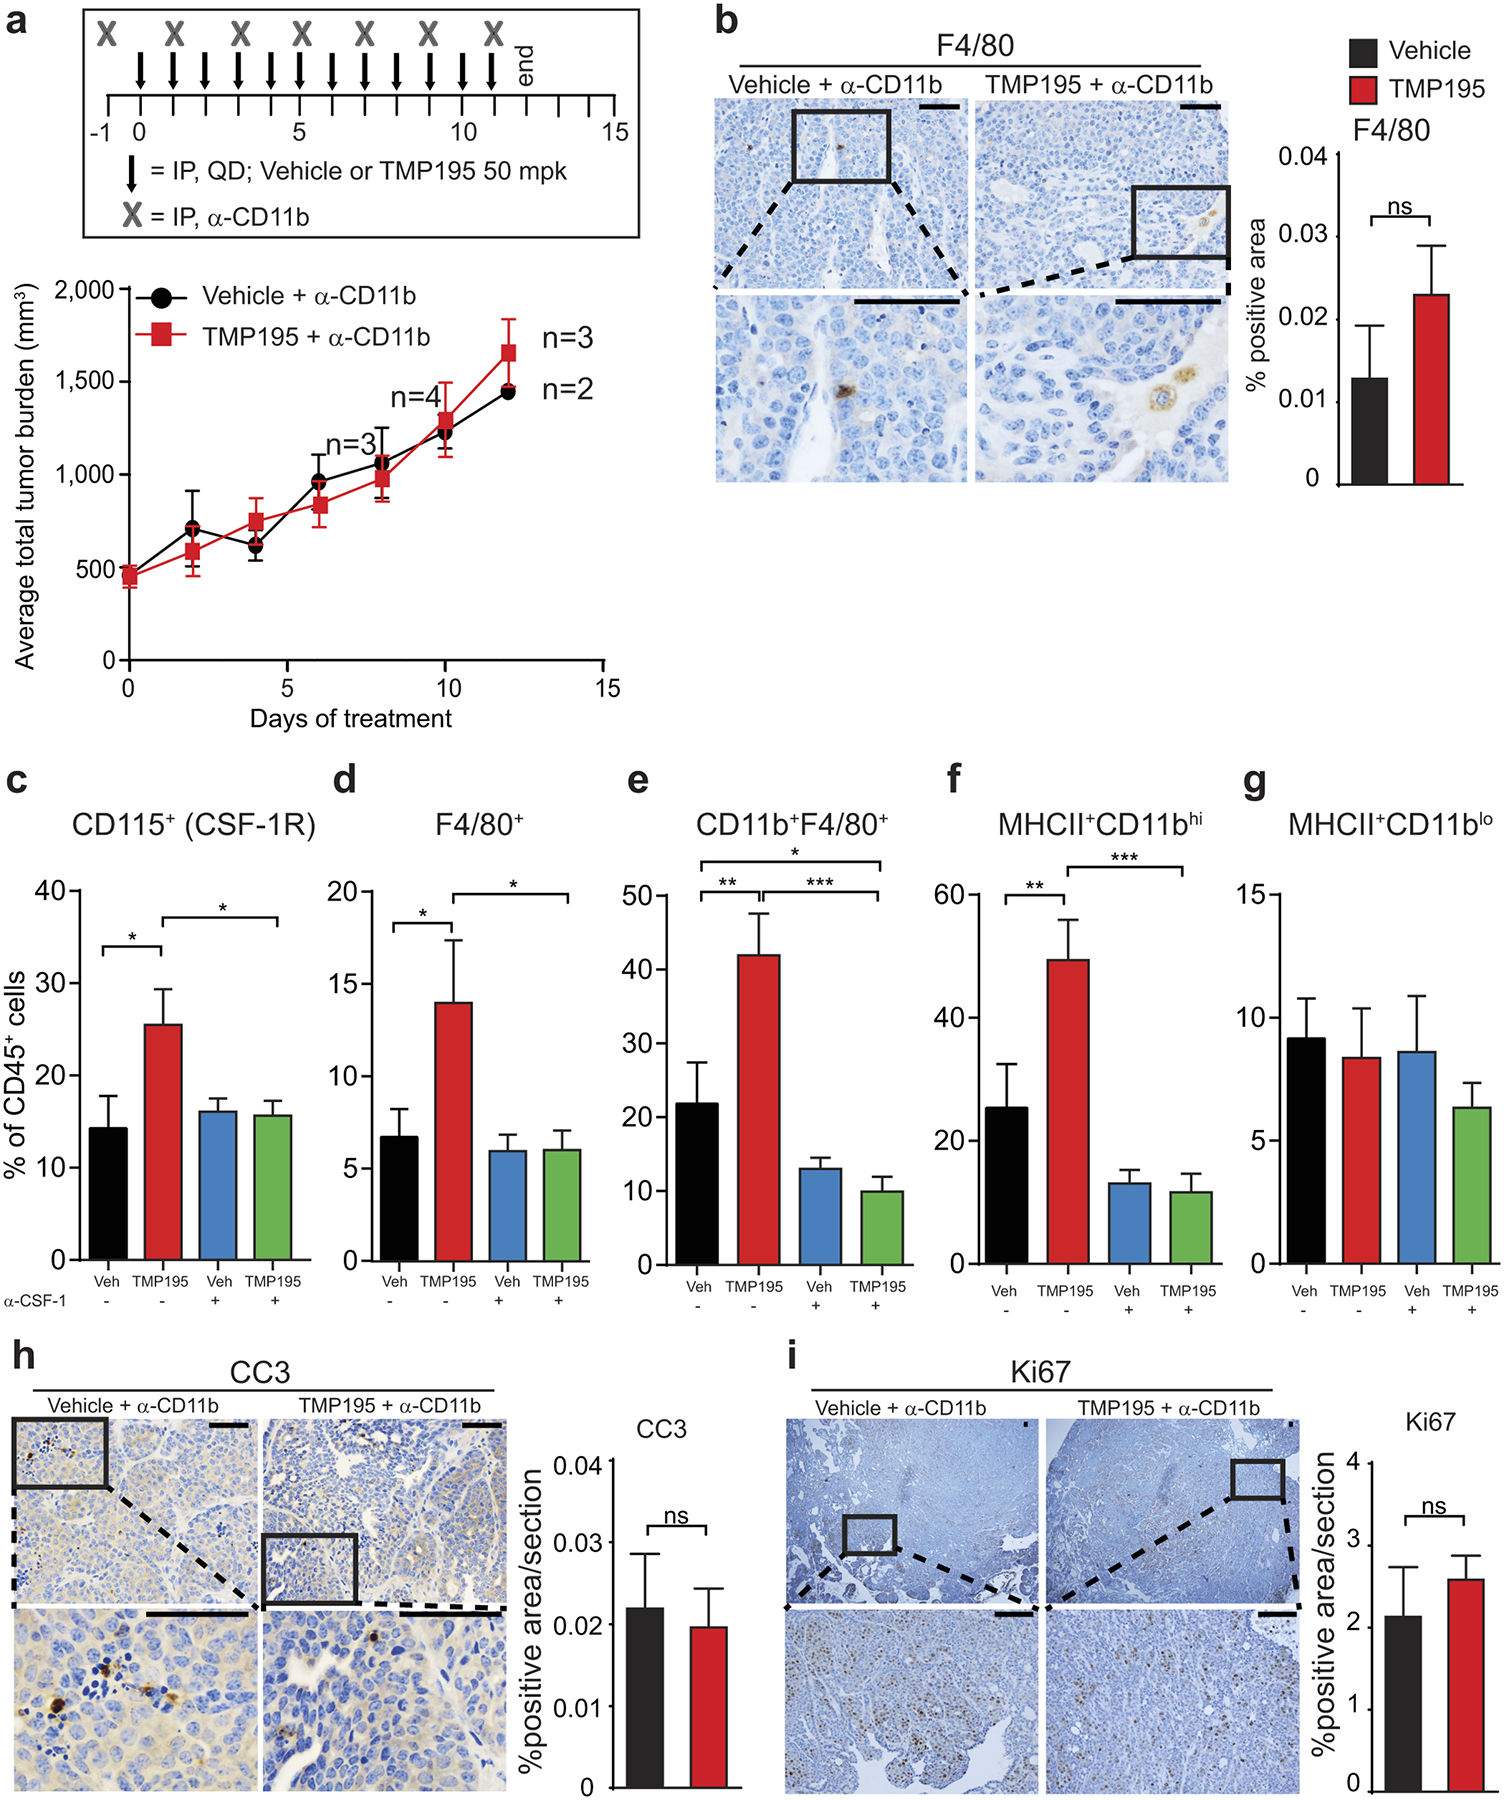
Tumor bearing MMTV-PyMT mice were randomly placed into treatment groups. Mice received daily IP injections of either vehicle (DMSO) or 50 mg/kg of TMP195 in combination with (a,b and h,i) a myeloid depleting antibody (α-CD11b) or (c-g) a macrophage depleting antibody (α-CSF-1). a, Tumor volumes were measured and plotted as average total tumor burden ±SEM. b, Tumors were removed from animals at the end of the CD11b depletion experiment and IHC was used to confirm the depletion of myeloid cells in the tumor tissue. c-g, Corresponding with Figure 3c, at the end of the experiment, tumors were removed from animals and flow cytometry was used to confirm depletion of macrophages in the tumor tissue. f, MHCII+CD11bhi but not MHCII+CD11blo macrophage populations were significantly depleted in response to the α-CSF-1 depletion strategy. h,i, Corresponding with Extended Data Fig. 12a, at the end of the experiment, tumors were removed from animals and IHC was used to assess h, cell death and i, cellular proliferation.
Extended Figure 9. CD8+ but not CD4+ T cells are required for optimal TMP195 efficacy.
a, Wild-type FVB/N and b, immunodeficient athymic nude mice were implanted with tumor chunks from MMTV-PyMT transgenic mice and treated daily for 16 days or 20 days, respectively, with vehicle (DMSO) or 50 mg/kg of TMP195. Athymic nude mice were also treated with paclitaxel (PTX) as a positive control. Tumor burden (a) or relative tumor burden (b) is shown for each mouse. Relative tumor burden is the volume of the tumor at day 0 of treatment compared to indicated day post treatment. c, Tumor bearing MMTV-PyMT mice with similar total tumor burden were randomly placed into treatment groups and received daily IP injections of either vehicle or 50 mg/kg of TMP195 in combination with IgG, α-CD8, α-CD4 or α-IFNγ for 6 days (corresponding with Fig. 3d). At the end of the experiment tumors were removed and single cell suspensions were subjected to flow cytometry to confirm depletion of T cells in the tumor. d,e, Tumor bearing MMTV-PyMT mice with similar total tumor burden were randomly placed into treatment groups and received daily IP injections of either vehicle or 50 mg/kg of TMP195 in combination with IgG or α-CD8 for 14 days. e, CD8+ T cell depletion was confirmed by flow cytometry. f, Mice treated with DMSO or TMP195 in combination with isotype or neutralizing anti-IFNγ antibody for 5 days and their tumors were harvested. IHC was performed to identify the extent of vasculature organization.
Extended Data Figure 10. Representation of MMTV-PyMT breast tumors with and without TMP195 therapy.
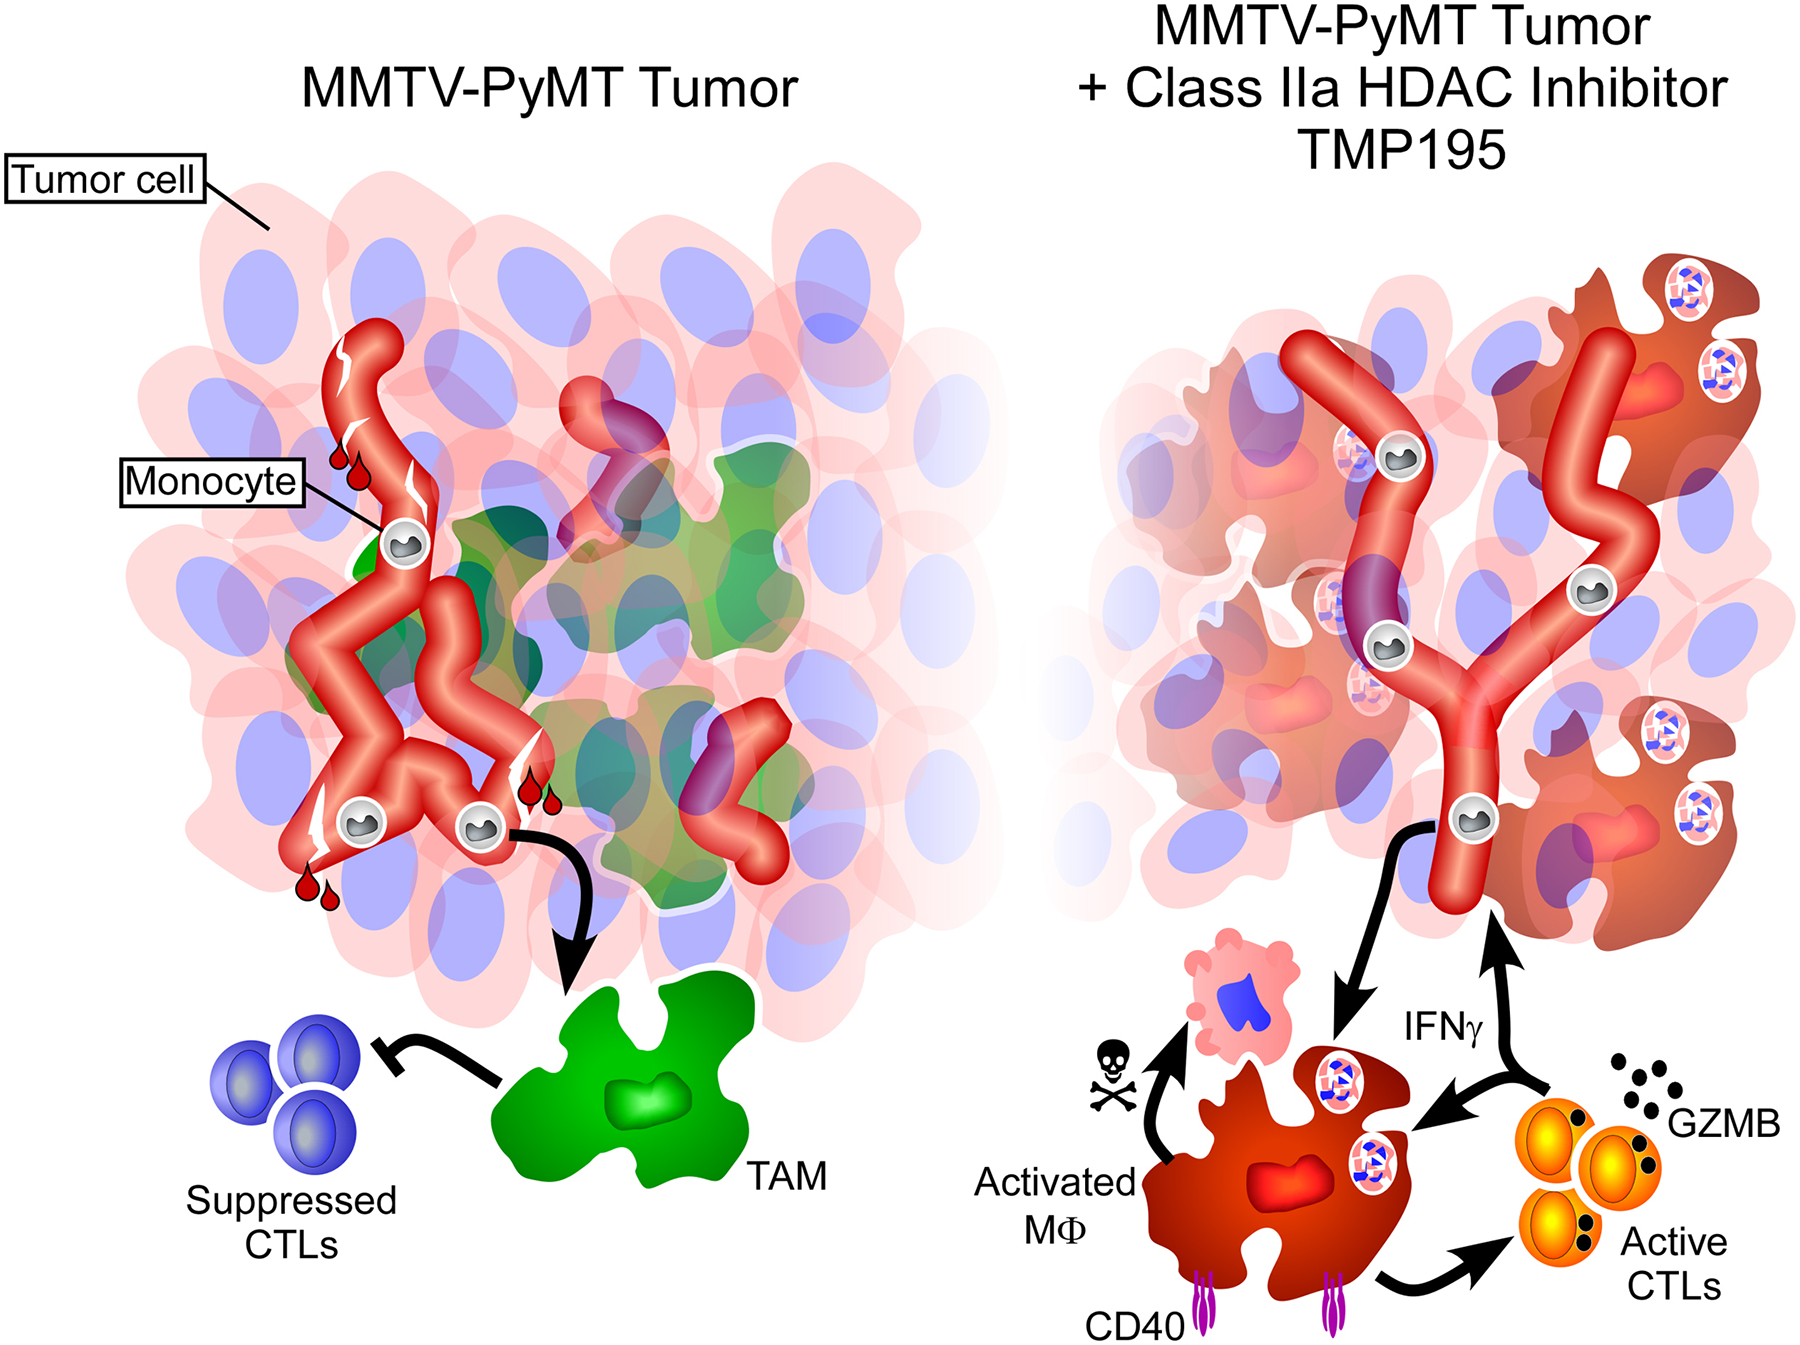
Breast tumors in MMTV-PyMT transgenic mice contain leaky vasculature and monocytes and pro-tumor macrophages that suppress the function of CD8 T cells (left). Upon treatment with TMP195 (right side), tumor macrophages become activated, expressing CD40, and are highly phagocytic (engulfment of tumor cells depicted). CD8+ T cells become Granzyme B+ indicating their ability to kill tumor cells. Tumor vasculature becomes more organized and less leaky. Additionally, there is a reduction in tumor volume.
Supplementary Material
Acknowledgments
We thank Andrew Benowitz and Craig Leach for their support and discussions in the preparation of the manuscript. This work was supported by NIH NCI F32CA180733 (J.L.G.), The Friends of Dana-Farber, Dancing for a Cure (J.L.G.), NIH NCI R01CA205967 (A.L.) and a sponsored research agreement from GlaxoSmithKline (A.L. and J.L.G.).
This work was supported though a sponsored research agreement with GSK to A.L. and J.L.G. S.P.D, M.L. and M.A.N are GSK employees. Readers are welcome to comment on the online version of the paper.
Footnotes
Supplementary Information is linked to the online version of the paper at www.nature.com/nature.
Data is deposited in the Gene Expression Omnibus repository as record GSE87164.
Authors declare competing financial interests.
References
- 1.Pollard JW Tumour-educated macrophages promote tumour progression and metastasis. Nat Rev Cancer 4, 71–78, 10.1038/nrc1256 (2004). [DOI] [PubMed] [Google Scholar]
- 2.DeNardo DG, Brennan DJ, Rexhepaj E, Ruffell B, Shiao SL, Madden SF, Gallagher WM, Wadhwani N, Keil SD, Junaid SA, Rugo HS, Hwang ES, Jirström K, West BL & Coussens LM Leukocyte Complexity Predicts Breast Cancer Survival and Functionally Regulates Response to Chemotherapy. Cancer Discovery 1, 54–67, 10.1158/2159-8274.cd-10-0028 (2011). [DOI] [PMC free article] [PubMed] [Google Scholar]
- 3.Pyonteck SM, Akkari L, Schuhmacher AJ, Bowman RL, Sevenich L, Quail DF, Olson OC, Quick ML, Huse JT, Teijeiro V, Setty M, Leslie CS, Oei Y, Pedraza A, Zhang J, Brennan CW, Sutton JC, Holland EC, Daniel D & Joyce JA CSF-1R inhibition alters macrophage polarization and blocks glioma progression. Nature medicine 19, 1264–1272, 10.1038/nm.3337 (2013). [DOI] [PMC free article] [PubMed] [Google Scholar]
- 4.Beatty GL, Chiorean EG, Fishman MP, Saboury B, Teitelbaum UR, Sun W, Huhn RD, Song W, Li D, Sharp LL, Torigian DA, O’Dwyer PJ & Vonderheide RH CD40 agonists alter tumor stroma and show efficacy against pancreatic carcinoma in mice and humans. Science 331, 1612–1616, 331/6024/1612 [pii] 10.1126/science.1198443 (2011). [DOI] [PMC free article] [PubMed] [Google Scholar]
- 5.Willingham SB, Volkmer JP, Gentles AJ, Sahoo D, Dalerba P, Mitra SS, Wang J, Contreras-Trujillo H, Martin R, Cohen JD, Lovelace P, Scheeren FA, Chao MP, Weiskopf K, Tang C, Volkmer AK, Naik TJ, Storm TA, Mosley AR, Edris B, Schmid SM, Sun CK, Chua MS, Murillo O, Rajendran P, Cha AC, Chin RK, Kim D, Adorno M, Raveh T, Tseng D, Jaiswal S, Enger PO, Steinberg GK, Li G, So SK, Majeti R, Harsh GR, van de Rijn M, Teng NN, Sunwoo JB, Alizadeh AA, Clarke MF & Weissman IL The CD47-signal regulatory protein alpha (SIRPa) interaction is a therapeutic target for human solid tumors. Proc Natl Acad Sci U S A 109, 6662–6667, 10.1073/pnas.1121623109 (2012). [DOI] [PMC free article] [PubMed] [Google Scholar]
- 6.Lobera M, Madauss KP, Pohlhaus DT, Wright QG, Trocha M, Schmidt DR, Baloglu E, Trump RP, Head MS, Hofmann GA, Murray-Thompson M, Schwartz B, Chakravorty S, Wu Z, Mander PK, Kruidenier L, Reid RA, Burkhart W, Turunen BJ, Rong JX, Wagner C, Moyer MB, Wells C, Hong X, Moore JT, Williams JD, Soler D, Ghosh S & Nolan MA Selective class IIa histone deacetylase inhibition via a nonchelating zinc-binding group. Nature chemical biology 9, 319–325, 10.1038/nchembio.1223 (2013). [DOI] [PubMed] [Google Scholar]
- 7.Fischle W, Dequiedt F, Hendzel MJ, Guenther MG, Lazar MA, Voelter W & Verdin E Enzymatic activity associated with class II HDACs is dependent on a multiprotein complex containing HDAC3 and SMRT/N-CoR. Mol Cell 9, 45–57 (2002). [DOI] [PubMed] [Google Scholar]
- 8.Lahm A, Paolini C, Pallaoro M, Nardi MC, Jones P, Neddermann P, Sambucini S, Bottomley MJ, Lo Surdo P, Carfi A, Koch U, De Francesco R, Steinkuhler C & Gallinari P Unraveling the hidden catalytic activity of vertebrate class IIa histone deacetylases. Proc Natl Acad Sci U S A 104, 17335–17340, 10.1073/pnas.0706487104 (2007). [DOI] [PMC free article] [PubMed] [Google Scholar]
- 9.Di Giorgio E, Gagliostro E & Brancolini C Selective class IIa HDAC inhibitors: myth or reality. Cellular and molecular life sciences : CMLS 72, 73–86, 10.1007/s00018-014-1727-8 (2015). [DOI] [PMC free article] [PubMed] [Google Scholar]
- 10.Lin EY, Nguyen AV, Russell RG & Pollard JW Colony-stimulating factor 1 promotes progression of mammary tumors to malignancy. The Journal of experimental medicine 193, 727–740 (2001). [DOI] [PMC free article] [PubMed] [Google Scholar]
- 11.Malhotra D, Fletcher AL, Astarita J, Lukacs-Kornek V, Tayalia P, Gonzalez SF, Elpek KG, Chang SK, Knoblich K, Hemler ME, Brenner MB, Carroll MC, Mooney DJ, Turley SJ & Immunological Genome Project C Transcriptional profiling of stroma from inflamed and resting lymph nodes defines immunological hallmarks. Nature immunology 13, 499–510, 10.1038/ni.2262 (2012). [DOI] [PMC free article] [PubMed] [Google Scholar]
- 12.Subramanian A, Tamayo P, Mootha VK, Mukherjee S, Ebert BL, Gillette MA, Paulovich A, Pomeroy SL, Golub TR, Lander ES & Mesirov JP Gene set enrichment analysis: a knowledge-based approach for interpreting genome-wide expression profiles. Proc Natl Acad Sci U S A 102, 15545–15550, 10.1073/pnas.0506580102 (2005). [DOI] [PMC free article] [PubMed] [Google Scholar]
- 13.Franklin RA, Liao W, Sarkar A, Kim MV, Bivona MR, Liu K, Pamer EG & Li MO The cellular and molecular origin of tumor-associated macrophages. Science 344, 921–925, 10.1126/science.1252510 (2014). [DOI] [PMC free article] [PubMed] [Google Scholar]
- 14.Hanahan D & Folkman J Patterns and emerging mechanisms of the angiogenic switch during tumorigenesis. Cell 86, 353–364 (1996). [DOI] [PubMed] [Google Scholar]
- 15.Qian BZ & Pollard JW Macrophage diversity enhances tumor progression and metastasis. Cell 141, 39–51, S0092–8674(10)00287–4 [pii] 10.1016/j.cell.2010.03.014 (2010). [DOI] [PMC free article] [PubMed] [Google Scholar]
- 16.Heldin CH, Rubin K, Pietras K & Ostman A High interstitial fluid pressure - an obstacle in cancer therapy. Nat Rev Cancer 4, 806–813, 10.1038/nrc1456 (2004). [DOI] [PubMed] [Google Scholar]
- 17.Tredan O, Galmarini CM, Patel K & Tannock IF Drug resistance and the solid tumor microenvironment. Journal of the National Cancer Institute 99, 1441–1454, 10.1093/jnci/djm135 (2007). [DOI] [PubMed] [Google Scholar]
- 18.Jain RK Antiangiogenesis strategies revisited: from starving tumors to alleviating hypoxia. Cancer cell 26, 605–622, 10.1016/j.ccell.2014.10.006 (2014). [DOI] [PMC free article] [PubMed] [Google Scholar]
- 19.Garber K Targeting vessel abnormalization in cancer. Journal of the National Cancer Institute 99, 991–992, 995, 10.1093/jnci/djm056 (2007). [DOI] [PubMed] [Google Scholar]
- 20.Heng TS & Painter MW The Immunological Genome Project: networks of gene expression in immune cells. Nature immunology 9, 1091–1094, 10.1038/ni1008-1091 (2008). [DOI] [PubMed] [Google Scholar]
- 21.Bos PD, Plitas G, Rudra D, Lee SY & Rudensky AY Transient regulatory T cell ablation deters oncogene-driven breast cancer and enhances radiotherapy. The Journal of experimental medicine 210, 2435–2466, 10.1084/jem.20130762 (2013). [DOI] [PMC free article] [PubMed] [Google Scholar]
- 22.Gul N, Babes L, Siegmund K, Korthouwer R, Bogels M, Braster R, Vidarsson G, ten Hagen TL, Kubes P & van Egmond M Macrophages eliminate circulating tumor cells after monoclonal antibody therapy. J Clin Invest 124, 812–823, 10.1172/JCI66776 (2014). [DOI] [PMC free article] [PubMed] [Google Scholar]
- 23.Simpson TR, Li F, Montalvo-Ortiz W, Sepulveda MA, Bergerhoff K, Arce F, Roddie C, Henry JY, Yagita H, Wolchok JD, Peggs KS, Ravetch JV, Allison JP & Quezada SA Fc-dependent depletion of tumor-infiltrating regulatory T cells co-defines the efficacy of anti-CTLA-4 therapy against melanoma. The Journal of experimental medicine 210, 1695–1710, 10.1084/jem.20130579 (2013). [DOI] [PMC free article] [PubMed] [Google Scholar]
- 24.Dahan R, Sega E, Engelhardt J, Selby M, Korman AJ & Ravetch JV FcgammaRs Modulate the Anti-tumor Activity of Antibodies Targeting the PD-1/PD-L1 Axis. Cancer cell 28, 285–295, 10.1016/j.ccell.2015.08.004 (2015). [DOI] [PubMed] [Google Scholar]
- 25.Zhang M, Hutter G, Kahn SA, Azad TD, Gholamin S, Xu CY, Liu J, Achrol AS, Richard C, Sommerkamp P, Schoen MK, McCracken MN, Majeti R, Weissman I, Mitra SS & Cheshier SH Anti-CD47 Treatment Stimulates Phagocytosis of Glioblastoma by M1 and M2 Polarized Macrophages and Promotes M1 Polarized Macrophages In Vivo. PloS one 11, e0153550, 10.1371/journal.pone.0153550 (2016). [DOI] [PMC free article] [PubMed] [Google Scholar]
- 26.van der Sluis TC, Sluijter M, van Duikeren S, West BL, Melief CJ, Arens R, van der Burg SH & van Hall T Therapeutic Peptide Vaccine-Induced CD8 T Cells Strongly Modulate Intratumoral Macrophages Required for Tumor Regression. Cancer immunology research 3, 1042–1051, 10.1158/2326-6066.cir-15-0052 (2015). [DOI] [PubMed] [Google Scholar]
- 27.Burgos ES, Wilczek C, Onikubo T, Bonanno JB, Jansong J, Reimer U & Shechter D Histone H2A and H4 N-terminal tails are positioned by the MEP50 WD repeat protein for efficient methylation by the PRMT5 arginine methyltransferase. The Journal of biological chemistry 290, 9674–9689, 10.1074/jbc.M115.636894 (2015). [DOI] [PMC free article] [PubMed] [Google Scholar]
- 28.Theodoulou NH, Bamborough P, Bannister AJ, Becher I, Bit RA, Che KH, Chung CW, Dittmann A, Drewes G, Drewry DH, Gordon L, Grandi P, Leveridge M, Lindon M, Michon AM, Molnar J, Robson SC, Tomkinson NC, Kouzarides T, Prinjha RK & Humphreys PG Discovery of I-BRD9, a Selective Cell Active Chemical Probe for Bromodomain Containing Protein 9 Inhibition. Journal of medicinal chemistry 59, 1425–1439, 10.1021/acs.jmedchem.5b00256 (2016). [DOI] [PMC free article] [PubMed] [Google Scholar]
- 29.Ullman-Cullere MH & Foltz CJ Body condition scoring: a rapid and accurate method for assessing health status in mice. Laboratory animal science 49, 319–323 (1999). [PubMed] [Google Scholar]
- 30.Schneider CA, Rasband WS & Eliceiri KW NIH Image to ImageJ: 25 years of image analysis. Nature methods 9, 671–675 (2012). [DOI] [PMC free article] [PubMed] [Google Scholar]
- 31.DeNardo DG, Brennan DJ, Rexhepaj E, Ruffell B, Shiao SL, Madden SF, Gallagher WM, Wadhwani N, Keil SD, Junaid SA, Rugo HS, Hwang ES, Jirström K, West BL & Coussens LM Leukocyte Complexity Predicts Breast Cancer Survival and Functionally Regulates Response to Chemotherapy. Cancer Discovery 1, 54–67, 10.1158/2159-8274.cd-10-0028 (2011). [DOI] [PMC free article] [PubMed] [Google Scholar]
- 32.Ruffell B, Chang-Strachan D, Chan V, Rosenbusch A, Ho CM, Pryer N, Daniel D, Hwang ES, Rugo HS & Coussens LM Macrophage IL-10 blocks CD8+ T cell-dependent responses to chemotherapy by suppressing IL-12 expression in intratumoral dendritic cells. Cancer cell 26, 623–637, 10.1016/j.ccell.2014.09.006 (2014). [DOI] [PMC free article] [PubMed] [Google Scholar]
- 33.Ahn GO, Tseng D, Liao CH, Dorie MJ, Czechowicz A & Brown JM Inhibition of Mac-1 (CD11b/CD18) enhances tumor response to radiation by reducing myeloid cell recruitment. Proc Natl Acad Sci U S A 107, 8363–8368, 10.1073/pnas.0911378107 (2010). [DOI] [PMC free article] [PubMed] [Google Scholar]
- 34.Qian BZ, Li J, Zhang H, Kitamura T, Zhang J, Campion LR, Kaiser EA, Snyder LA & Pollard JW CCL2 recruits inflammatory monocytes to facilitate breast-tumour metastasis. Nature 475, 222–225, 10.1038/nature10138 (2011). [DOI] [PMC free article] [PubMed] [Google Scholar]
- 35.Lohela M, Casbon AJ, Olow A, Bonham L, Branstetter D, Weng N, Smith J & Werb Z Intravital imaging reveals distinct responses of depleting dynamic tumor-associated macrophage and dendritic cell subpopulations. Proc Natl Acad Sci U S A 111, E5086–5095, 10.1073/pnas.1419899111 (2014). [DOI] [PMC free article] [PubMed] [Google Scholar]
- 36.Huang FJ, You WK, Bonaldo P, Seyfried TN, Pasquale EB & Stallcup WB Pericyte deficiencies lead to aberrant tumor vascularizaton in the brain of the NG2 null mouse. Developmental biology 344, 1035–1046, 10.1016/j.ydbio.2010.06.023 (2010). [DOI] [PMC free article] [PubMed] [Google Scholar]
- 37.Malhotra D, Fletcher AL, Astarita J, Lukacs-Kornek V, Tayalia P, Gonzalez SF, Elpek KG, Chang SK, Knoblich K, Hemler ME, Brenner MB, Carroll MC, Mooney DJ, Turley SJ & Immunological Genome Project C Transcriptional profiling of stroma from inflamed and resting lymph nodes defines immunological hallmarks. Nature immunology 13, 499–510, 10.1038/ni.2262 (2012). [DOI] [PMC free article] [PubMed] [Google Scholar]
Associated Data
This section collects any data citations, data availability statements, or supplementary materials included in this article.
Supplementary Materials
Data Availability Statement
[Data type e.g. “Sequence”] data that support the findings of this study have been deposited in the Gene Expression Omnibus repository as record GSE87164: https://www.ncbi.nlm.nih.gov/geo/query/acc.cgi?acc=GSE87164.