

Abstract
Background:
Non-Hispanic black (NHB) individuals have increased risk of Alzheimer’s disease (AD) relative to non-Hispanic whites (NHW). Ethnicity/race can serve as a proxy sociodemographic variable for a complex representation of sociocultural and environmental factors. Chronic pain is a form of stress with high prevalence and sociodemographic disparities. Chronic pain is linked to lower cognition and accelerated biological aging.
Objective:
The purpose of this study is to seek understanding of potential cognitive and temporal lobe structural brain AD vulnerabilities based on chronic pain stage and ethnicity/race.
Methods:
Participants included 147 community dwelling NHB and NHW adults without dementia between 45–85 years old who had or were at risk of knee osteoarthritis. All participants received MRI (3T Philips), the Montreal Cognitive Assessment (MoCA), and assessment of clinical knee pain stage.
Results:
There were ethnic/race group differences in MoCA scores but no relationships with chronic knee pain stage. Ethnicity/race moderated the relationship between AD-related temporal lobe thickness and chronic pain stage with quadratic patterns suggesting thinner cortex in high chronic pain stage NHB adults.
Conclusion:
There appear to be complex relationships between chronic knee pain stage, temporal lobe cortex, and sociodemographic variables. Specifically, NHB participants without dementia but with high chronic knee pain stage appeared to have thinner temporal cortex in areas associated with Alzheimer’s disease. Understanding the effects of sociocultural and socioeconomic factors on health outcomes is the first step to challenging the disparities in healthcare that now appear to link disease conditions to neurodegenerative processes.
MeSH Keywords: Chronic Pain, Ethnic Groups, Race Factors, Socioeconomic Factors, Magnetic Resonance Imaging, Risk Factors, Alzheimer Disease, Temporal Lobe
INTRODUCTION
Non-Hispanic black (NHB) individuals in the United States of America have heightened risk of Alzheimer’s disease (AD) relative to non-Hispanic whites (NHW) [1–4]. Differences between sociodemographic groups extend to brain structure as well; NHB adults who are amyloid-positive appear to have thinner cortex in AD regions than amyloid-positive NHW adults [5]. Interestingly, biomarkers of dementia predict dementia diagnoses in NHW populations; however, weaker relationships are indicated between the same biomarkers and a dementia diagnoses in NHB populations [6–9]. Such findings of disparities implicate other potential risk factors in dementia onset among NHBs, including exposure to, prevalence of, and severity of a range of stressors across the lifespan [10]. Lower cognitive reserve secondary to adverse socioeconomic and environmental conditions could partially account for ethnic/race differences [4, 11]. Ethnicity/race therefore serves as a proxy variable for a complex representation of cultural, socioeconomic, and environmental factors including stress.
Chronic pain is a form of stress with high prevalence [12, 13]. Osteoarthritis (OA) is a condition associated with chronic pain that affects approximately 19% of adults ages 45+ in the United States and is a leading cause of disability worldwide [12]. Due to an aging population and a range of health factors, the impacts of OA on individuals, communities, and healthcare systems are increasing [14]. Among individuals with knee OA, pain is one of the primary factors contributing to functional limitations and physical disability [15–17]. Chronic pain has been associated with cognitive impairment and accelerated biological aging [18–22]. Chronic pain, likely through an elevated neurobiological stress response, has also been associated with changes in brain structure and function, including within temporal lobe regions [23–25], and overall brain aging [26]. Pain-related changes in the brain are not always linear, with greater gray matter volume and increased connectivity in early stages of chronic pain followed by gray matter decreases with high persistence, longer duration, and greater intensity of chronic pain [25, 27–29]. These brain imaging findings align with a developing body of evidence demonstrating that greater stage of chronic pain (based on measures of frequency, characteristic intensity, time/duration, and total pain sites) is associated with indications of dysregulation or accelerated attrition in stress-related biological measures [21, 30].
Considerable evidence demonstrates health disparities in the impact of OA [31]. Specifically, NHBs experience greater clinical pain severity, disability and functional limitations, and decreased quality of life compared to NHWs with knee osteoarthritis [32]. Ethnic/race group differences in knee OA health outcomes are driven by interactions among biological and environmental factors [33]. NHBs with chronic pain experience worse OA health outcomes and a greater burden of exposure to environmental and social stress across the lifespan compared to NHWs [34, 35]. Hence, NHB adults with chronic pain due to OA might be at greater risk of adverse pain-related changes in brain structure.
As referenced earlier, chronic pain associates with changes in brain structure within temporal lobe regions [23–25]. Other research indicates a region of temporal lobe cortex (entorhinal and fusiform, inferior temporal, and middle temporal gyri) is sensitive to pathological and cognitive changes associated with AD [36]. This region of the temporal cortex is also predictive of progression to mild cognitive impairment in older adults [37]. It is important to consider the effects of sociodemographic variables in aging-related research because there are ethnicity/race-linked disparities in aging-related cognitive and neurological factors [8, 38–40]. Understanding how sociodemographic variables, such as ethnicity/race, moderate the relationships between chronic pain and cognitive and neuroanatomical risk of aging-related disorders, including dementia is an area needing additional research. The purpose of this study, therefore, is to seek understanding of cognitive and structural brain AD vulnerabilities based on chronic pain stage and ethnicity/race, which is used as a proxy variable for measured and unmeasured sociocultural and environmental factors.
We have two primary aims: 1) investigate if ethnicity/race moderates the relationships between chronic pain stage and general cognition in a sample of adults without dementia, and 2) investigate if ethnicity/race moderates the relationship between chronic pain stage and brain temporal lobe structure that were previously demonstrated to be vulnerable to cognitive decline and pathology associated with Alzheimer’s disease.
MATERIALS AND METHODS
Study Overview
Data used in the current cross-sectional study was obtained from an ongoing, prospective observational cohort study titled Understanding Pain and Limitations in Osteoarthritic Disease-2 (UPLOAD-2). The study aims to investigate the mechanisms underlying ethnic/race group differences in knee pain among adults with/at risk for knee osteoarthritis (OA). The UPLOAD-2 study is a multi-site investigation conducted at the University of Florida (UF) and the University of Alabama at Birmingham (UAB). The participants described in the current analysis were recruited at both sites between August 2015 and May 2017. All procedures were reviewed and approved by the Institutional Review Boards at UF and UAB and participants provided verbal and written informed consent. Participants were recruited through the community via multiple advertisement methods (e.g., posted fliers) and clinic-based methods.
Participants
Participants included 147 community dwelling adults between 45–85 years of age who self-identified as non-Hispanic and “Black/African American” (NHB) or non-Hispanic “White/Caucasian/European” (NHW), who had or were at risk of knee osteoarthritis [41]. Participants were excluded for systemic rheumatologic conditions including rheumatoid arthritis and fibromyalgia, knee replacement surgery, neurological diseases (e.g., dementia, Parkinson’s disease, multiple sclerosis), chronic daily opioid use, uncontrolled hypertension, cardiovascular or peripheral arterial disease, psychiatric disorder requiring hospitalization within the past 12 months, and pregnant or nursing. Participants were also excluded from the current study if they were unable to undergo magnetic resonance imaging (MRI). The procedures described are limited to those relevant to the current investigation.
Descriptive Measures
Demographic information was collected by self-report including ethnicity/race, age, and education level. In addition, all participants completed the Montreal Cognitive Assessment (MoCA) as a measure of overall cognitive function [42].
Clinical Pain Measures
Participants were asked to indicate which knee they experienced the most severe pain; this knee was designated as the index knee. The Graded Chronic Pain Scale (GCPS) was also completed, which assessed global knee pain severity over the past 6 months [43]. Characteristic pain intensity is computed by averaging three measures: the intensity of current, average and worst clinical pain over the past 6 months from 0 (no pain) to 10 (pain as bad as it could be) and then multiplying by 10 (resulting in a range from 0 to 100).
The chronic pain stage index (FITT = Frequency, Intensity, Time, Total pain sites) was computed as previously reported [21, 30]. This measure of chronic pain stage was developed to improve pain phenotyping. It was previously shown to be sensitive to biomarkers of immune and metabolic functioning and a measure of cellular aging [21, 30]. Frequency of pain was determined based on the number of days per week pain is experienced. Intensity of pain was determined by the GCPS characteristic pain intensity. Time (i.e., pain duration) was computed as the duration of knee pain reported. The total pain sites variable was computed based on the number of body sites (28 maximum with 14 on each side) in which the participant reported experiencing pain more days than not over the past 3 months. For each dimension of chronic pain stage individuals were assigned a 0 or a 1 based on whether they were below or above the median score, respectively, and the total score was computed by summing the individual values for each dimension. Thus, total chronic pain stage scores range from 0 to 4 and are coded as a total FITT score of 0 = 1 (low pain) to a total FITT score of 4 = 5 (high/severe pain).
Brain Imaging
MRI data were acquired MRI data using a 3 Tesla Philips Achieva (32-channel head coil at UF and an 8-channel at UAB). T1 MP-RAGE images were acquired and used for analyses. UAB and UF: T1-weighted imaging TE: 3.2 ms, TR: 7.0 ms, flip angle: 8, 1mm iso voxels, FOV: 240×240×176.
MRI Processing
MP-RAGE files were processed (by trained professional [JJT]) using FreeSurfer 6.0 [44]. FreeSurfer is a set of software tools for the study of cortical and subcortical anatomy [45–47] The cerebral cortex was parcellated into units with respect to gyral and sulcal structure [48–50]. FreeSurfer morphometric procedures have been demonstrated to show good test-retest reliability across scanner manufacturers and across field strengths [51, 52].
Cortical thickness (mm) within the left and right temporal lobes that is associated with Alzheimer’s disease or AD-risk was averaged across the following regions: entorhinal cortex, fusiform gyrus, and inferior and middle temporal gyri [53]. These temporal lobe regions include areas that have been previously linked to chronic pain [23, 24]. This region of the temporal lobe is sensitive to AD pathology and related cognitive decline [36] as well as progression to mild cognitive impairment [37].
As an additional region of interest, based on our previous work, we included cortex where we expected relationships with pain but no moderation by ethnicity/race. To create this region of interest, we averaged thickness across superior and middle frontal gyri. The dorsolateral prefrontal cortex (DLPFC) is commonly localized to portions of the middle and superior frontal gyri [54]. The middle frontal gyrus is a highly-connected and large region involved in cognition [54] and pain processing [55]. The superior frontal gyrus includes areas associated with cognitive processing, motor function, and pain response [56, 57]. These regions of the brain, which include the DLPFC and other functionally-defined regions, while affected by both pain and Alzheimer’s disease, do not show the same specificity to AD as do temporal and parietal cortices [58, 59].
Statistical Analyses
The analytic plan was designed to address the following hypotheses: Aim 1: a) greater knee chronic pain stage will associate with lower general cognition and b) ethnicity/race will interact with knee chronic pain stage and general cognition; Aim 2: a) reduced cortical thickness in temporal lobe regions associated with Alzheimer’s disease [53] will be indicated in individuals with greater knee chronic pain stage and b) there will be ethnicity/race interactions with chronic pain stage and cortical thickness. As a sub-aim, it is hypothesized there will be associations between frontal cortical thickness and pain stage but no significant ethnicity/race interactions.
Predictors of interest
Included ethnicity/race, chronic pain stage (treated as a continuous variable in regression analyses), and chronic pain stage × ethnicity/race interactions. To account for potential curvilinear relationships, quadratic terms of the chronic pain stage and chronic pain stage × ethnicity/race were also included in regression models. Variables were centered around zero before calculating new interaction variables to potentially reduce multicollinearity effects [60].
Dependent variables of interest
MoCA total score without education adjustment (Aim 1), AD-related bilateral temporal cortex thickness (Aim 2a) [53], and mean thickness of middle and superior frontal gyri (Aim 2b).
Covariates of non-interest
We included study site (to adjust for potential MRI scanner differences but also to adjust for possible environmental differences between sites), age, BMI (relationships with the brain and also socioeconomic status [61]), mean z score of education level and income level (adjust for socioeconomic factors), and MoCA without adjustment for education (except where MoCA is the dependent variable). Education levels: 1 = Less than high school, 2 = high school, 3 = some college/university, 4 = college/university, 5 = master’s, 6 = doctorate or equivalent. Income Levels: 1 = $0 – $9,999, 2 = $10,000 – $19,999, 3 = $20,000 – $29,999, 4 = $30,000 – $39,999, 5 = $40,000 – $49,999, 6 = $50,000 – $59,999, 7 = $60,000 – $79,999, 8 = $80,000 – $99,999, 9 = $100,000 – $149,999, 10 = $150,000 or higher.
Statistical models
All analyses were performed in SPSS version 26. All data were checked for normality by visual inspection of distributions and using the Shapiro-Wilk test [62]. To assess basic demographic group differences in included variables, differences in continuous (scale) variables were calculated using two-sided t-tests. Sociodemographic group differences in categorical or ordinal variables were calculated using chi-square or Mann Whitney U tests. Multiple comparisons were adjusted using a false discovery (FDR) technique with FDR set at 0.05 [63].
To assess our hypotheses, we ran hierarchical regressions first accounting for covariates of non-interest (model 1) and then adding the following predictors of interest: 2) ethnicity/race, 3) chronic pain stage, 4) chronic pain stage × ethnicity/race, 5) chronic pain stage quadratic term, 6) chronic pain stage × ethnicity/race quadratic term. Quadratic terms were included because relationships between pain and the brain are not always linear; increases in greater gray matter volume can occur in early stages of chronic pain followed by gray matter decreases with longer duration or greater frequency or intensity of chronic pain [25, 27–29]. These analyses were run for Aims 1 and 2a-b.
As a post hoc analysis for Aim 2a to clarify patterns from the regression analyses, we used chronic pain stage to classify participants into low pain (1 and 2; n = 52) and moderate to high pain (4 and 5; n = 48). The middle chronic pain stage group (n = 47) was excluded to compare the phenotypic extreme groups. Then using a mixed model ANCOVA with chronic pain stage classification and ethnicity/race as independent variables, we assessed differences in mean bilateral cortical thickness across the AD-related temporal regions.
RESULTS
See Table 1 for sample characteristics (n = 147). Ethnic/race groups were evenly balanced in numbers (NHB = 72 [UF = 43, UAB = 29], NHW = 75 [UF = 50, UAB = 25]). AD-related temporal cortex thickness and frontal cortex thickness were normally distributed (Shapiro-Wilk p values ≥ 0.572). The other variables failed to fit the assumption of normality (Shapiro-Wilk p values < 0.01). However, given the sample size, we used parametric statistical approaches for the main analyses as described in the methods. Ethnic/race groups differed (NHB < NHW) in age, MoCA total score, and AD-related temporal cortex thickness. There were also group differences in the proportion of the sample with less than a high school education (p < 0.05), overall income (p = 0.01; specific differences in income levels 1 and 9), the combined income/education variable (p < 0.001), and chronic pain stage (p = 0.01; specific difference in chronic pain stage = 4, p < 0.05; range 1 – 5).
Table 1.
Variables of Interest by Ethnic/Race Group
| Ethnicity/Race | ||||||||
|---|---|---|---|---|---|---|---|---|
| NHB (n = 72) | NHW (n = 75) | |||||||
| Mean/Median | Max | Min | SD/IQR | Mean/Median | Max | Min | SD/IQR | |
| Age** | 56.38 | 73 | 45 | 6.46 | 59.59 | 78 | 45 | 8.47 |
| BMI | 31.91 | 45.27 | 20.09 | 5.85 | 30.74 | 51.29 | 19.15 | 6.85 |
| MoCA** | 22.29 | 30 | 13 | 3.83 | 26 | 30 | 20 | 2.99 |
| AD Cort Thick* | 2.75 | 3.08 | 2.42 | 0.13 | 2.80 | 3.03 | 2.58 | 0.11 |
| Front Cort Thick | 2.39 | 2.67 | 2.17 | 0.11 | 2.39 | 2.62 | 2.08 | 0.10 |
| Edu/Inc Comp** | −0.29 | 1.90 | −1.37 | 0.84 | 0.29 | 2.08 | −1.37 | 0.84 |
| Edu Level^** | 2.00 | 6 | 1 | 2.00 | 3 | 6 | 1 | 2 |
| Income Level^** | 2.50 | 1 | 1 | 4.00 | 6 | 10 | 1 | 4 |
| Chronic Pain Stage^* | 3.00 | 5 | 1 | 2.00 | 3 | 5 | 1 | 1 |
Notes: Group differences in continuous (scale) variables were calculated using two-sided t-tests. Group differences in categorical or ordinal variables were calculated using chi square and Mann Whitney U.
Median and interquartile range values presented;
Group difference, FDR corrected p < 0.05,
Group difference, FDR corrected p < 0.01;
Front Cort Thick = Mean Bilateral Superior/Middle Frontal Cortex thickness in mm; AD Cort Thick = Mean Bilateral AD-related Temporal Cortex [53] thickness in mm; Edu/Inc Comp = Education and Income levels were group z transformed and then mean averaged; Education (Edu) levels: 1 = Less than high school, 2 = high school, 3 = some college/university, 4 = college/university, 5 = master’s, 6 = doctorate or equivalent. Income Levels: 1 = $0 – $9,999, 2 = $10,000 – $19,999, 3 = $20,000 – $29,999, 4 = $30,000 – $39,999, 5 = $40,000 – $49,999, 6 = $50,000 – $59,999, 7 = $60,000 – $79,999, 8 = $80,000 – $99,999, 9 = $100,000 – $149,999, 10 = $150,000 or higher. Chronic Pain Stage was used as a continuous variable in regression analyses.
Aim 1: Chronic Pain Stage and General Cognition
In our sample, only the education/income composite and ethnicity/race were significant predictors of MoCA total score (see Tables 2A and 2B, Figure 1, and Supplemental Figure 3). Contrary to our hypothesis, there was no evidence that chronic pain stage (FITT) or chronic pain stage × ethnicity/race interactions predicted MoCA total score (p values ≤ 0.466).
Table 2A.
Predictor Models of Montreal Cognitive Assessment Total Score
| Model | R2 | ΔR2 | ΔF | ΔF p value | Model F |
|---|---|---|---|---|---|
| 1 Study Site | |||||
| Age | |||||
| BMI | .213 | .213 | 9.602 | <.001 | 9.602 |
| Education/Income Composite | |||||
| 2 Ethnicity/Race | .310 | .097 | 19.839 | <.001 | 12.668 |
| 3 Chronic pain Stage | .310 | .000 | .004 | .948 | 10.483 |
| 4 Chronic Pain Stage × Ethnicity/Race | .311 | .001 | .222 | .638 | 8.967 |
| 5 Chronic Pain Stage2 | .314 | .003 | .534 | .466 | 7.887 |
| 6 (Chronic Pain Stage × Ethnicity/Race)2 | .314 | .000 | .055 | .815 | 6.969 |
Notes. All models p < 0.001; Δ = change in; Education/Income Level is the mean of the group-based z scores for education and income levels; Chronic Pain Stage = Frequency, Intensity, Time (duration), Total pain sites;
Squared terms are quadratic models.
Table 2B.
Model 2 Predictors of Montreal Cognitive Assessment Total Score
| Predictor | B | SE | 95% CI | p | |
|---|---|---|---|---|---|
| LL | UL | ||||
| Study Site | −.214 | .517 | −1.227 | .799 | .677 |
| Age | .002 | .033 | −.064 | .067 | .959 |
| BMI | −.054 | .040 | −.133 | .026 | .185 |
| Education/Income Composite | 1.232 | .294 | .651 | 1.813 | <.001 |
| Ethnicity/Race | 2.316 | .520 | 1.288 | 3.344 | <.001 |
Note. Regression weights for model 2 (Table 2A). The other models did not add significant predictors and are not included. Bold indicates p < 0.05. B = unstandardized coefficient; CI = confidence interval; LL = lower limit; UL = upper limit; FITT = Frequency, Intensity, Time (duration), Total pain sites;
Squared terms are quadratic models.
Figure 1.
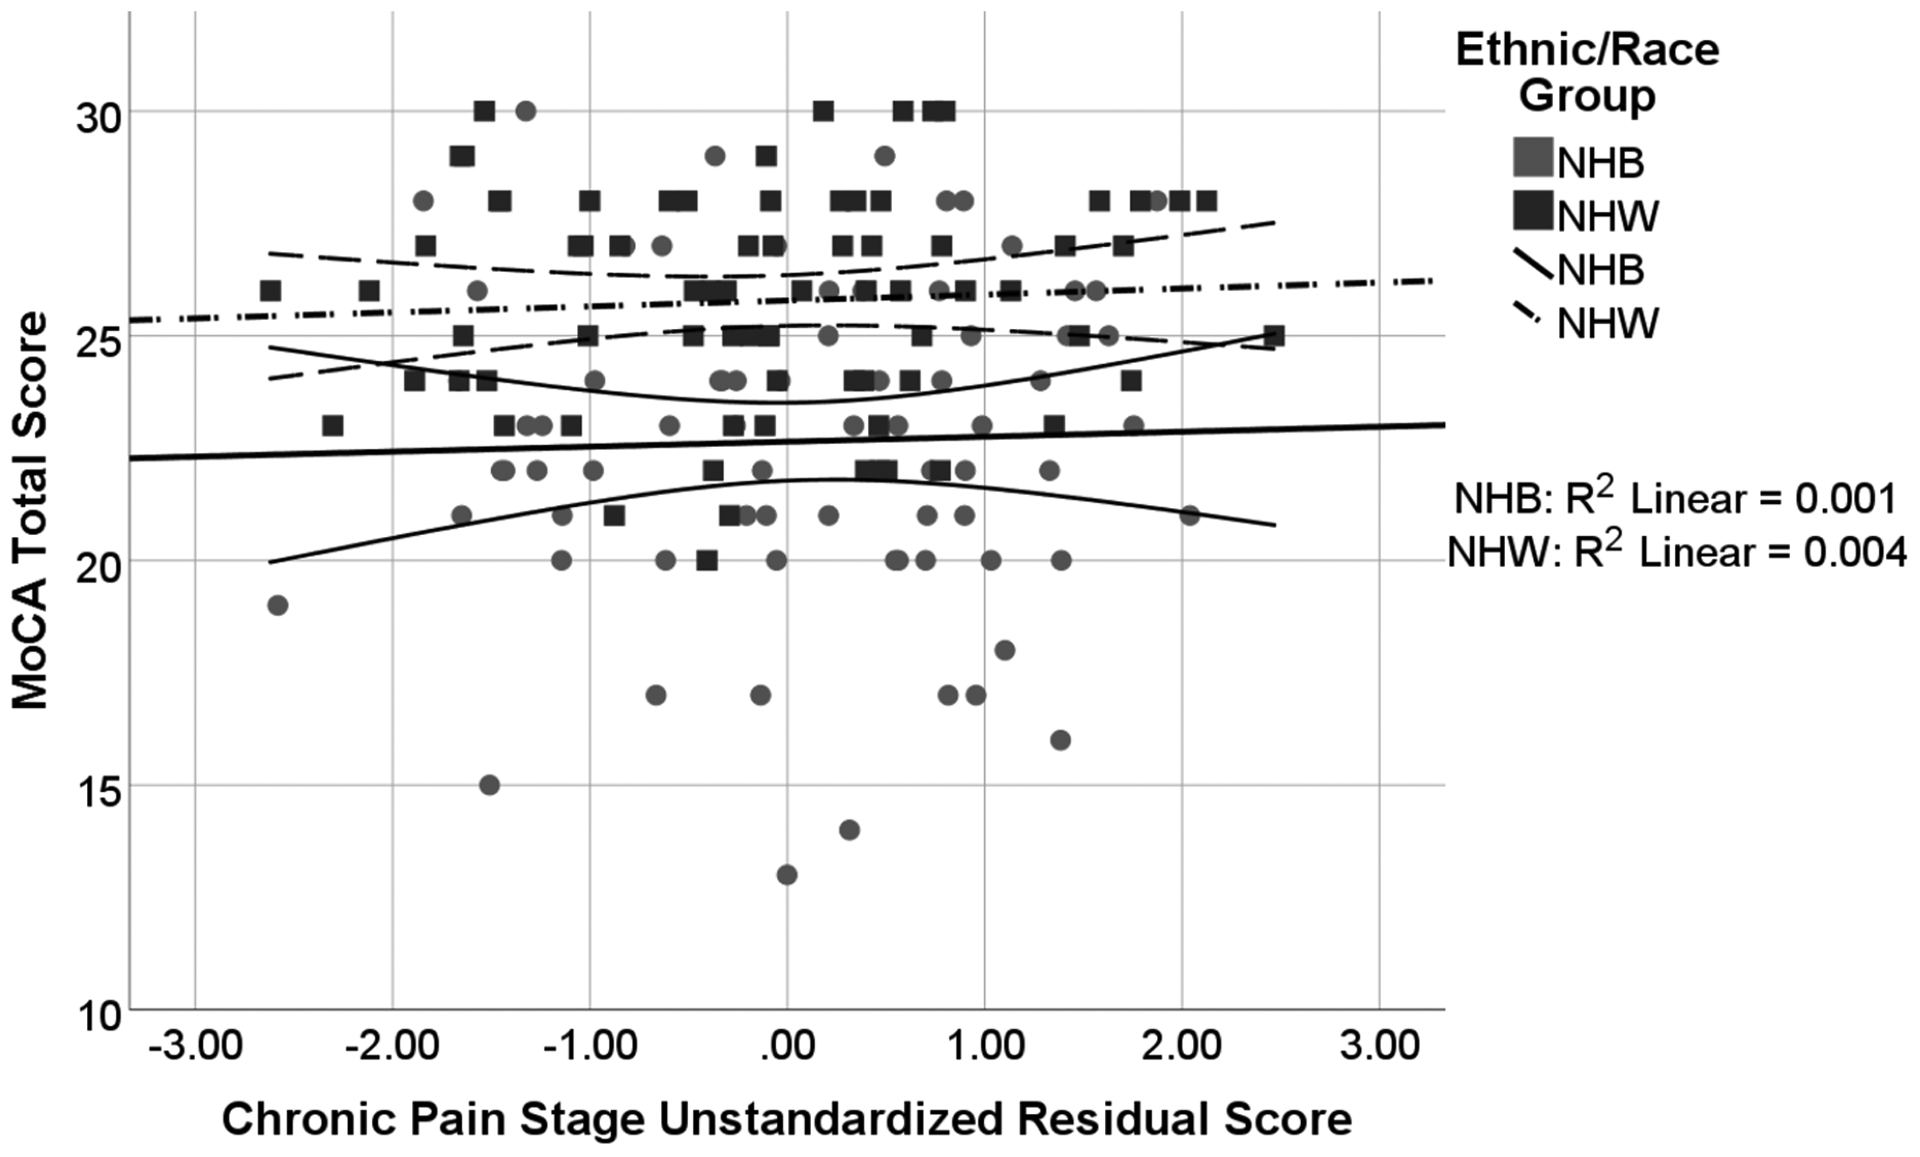
Associations between Chronic Pain Stage and MoCA Total Score by Ethnic/Race Group
Note: Chronic Pain Stage unstandardized residual score is adjusted for study site, age, BMI, and mean z score of education level and income level. There were sociodemographic group differences (NHB < NHW, p = 0.002) but no group interactions.
Aim 2a: Chronic Pain Stage and AD-related Temporal Cortex
See Tables 3A and 3B, Figure 2, and Supplemental Figure 1. Our results indicated there were significant quadratic chronic pain stage and quadratic chronic pain stage × ethnicity/race effects (p = 0.009). In the full predictor model (Table 3B), education level, MoCA total score, ethnicity/race, and chronic pain stage × ethnicity/race were non-significant predictors of cortical thickness in temporal lobe regions.
Table 3A.
Predictor Models of Alzheimer’s Disease-related Cortical Thickness
| Model | R2 | ΔR2 | ΔF | ΔF p value | Model F |
|---|---|---|---|---|---|
| 1 Study Site | |||||
| Age | |||||
| Education/Income Level | .211 | .211 | 7.548 | <.001 | 7.548 |
| BMI | |||||
| MoCA Total Score | |||||
| 2 Ethnicity/Race | .246 | .035 | 6.456 | .012 | 7.609 |
| 3 Chronic Pain Stage | .248 | .002 | .362 | .548 | 6.544 |
| 4 Chronic Pain Stage × Ethnicity/Race | .263 | .015 | 2.891 | .091 | 6.165 |
| 5 Chronic Pain Stage2 | .265 | .002 | .301 | .584 | 5.486 |
| 6 (Chronic Pain Stage × Ethnicity/Race)2 | .302 | .037 | 7.124 | .009 | 5.870 |
Notes. All models p < 0.001; Δ = change in. BMI = Body Mass Index; MoCA = Montreal Cognitive Assessment; Chronic Pain Stage = Frequency, Intensity, Time (duration), Total pain sites;
Squared terms are quadratic models
Table 3B.
Full Model Predictors of Alzheimer’s Disease-related Cortical Thickness
| Predictor | B | SE | 95% CI | p | |
|---|---|---|---|---|---|
| LL | UL | ||||
| Study Site | .067 | .019 | .029 | .105 | .001 |
| Age | −.004 | .001 | −.007 | −.002 | .001 |
| BMI | −.006 | .002 | −.009 | −.003 | <.001 |
| Education/Income Level | .010 | .012 | −.014 | .033 | .404 |
| MoCA Total Score | .000 | .003 | −.006 | .007 | .914 |
| Ethnicity/Race | .006 | .027 | −.047 | .059 | .811 |
| Chronic Pain Stage | −.002 | .008 | −.018 | .015 | .817 |
| Chronic Pain Stage × Ethnicity/Race | .026 | .016 | −.006 | .058 | .115 |
| Chronic Pain Stage2 | .403 | .153 | .102 | .705 | .009 |
| (Chronic Pain Stage × Ethnicity/Race)2 | −1.635 | .612 | −2.846 | −.423 | .009 |
Note. Regression weights for model 6 (Table 3A). Bold indicates p < .05. B = unstandardized coefficient; CI = confidence interval; LL = lower limit; UL = upper limit. BMI = Body Mass Index; MoCA = Montreal Cognitive Assessment; FITT = Frequency, Intensity, Time (duration), Total pain sites;
Squared terms are quadratic models
Figure 2.
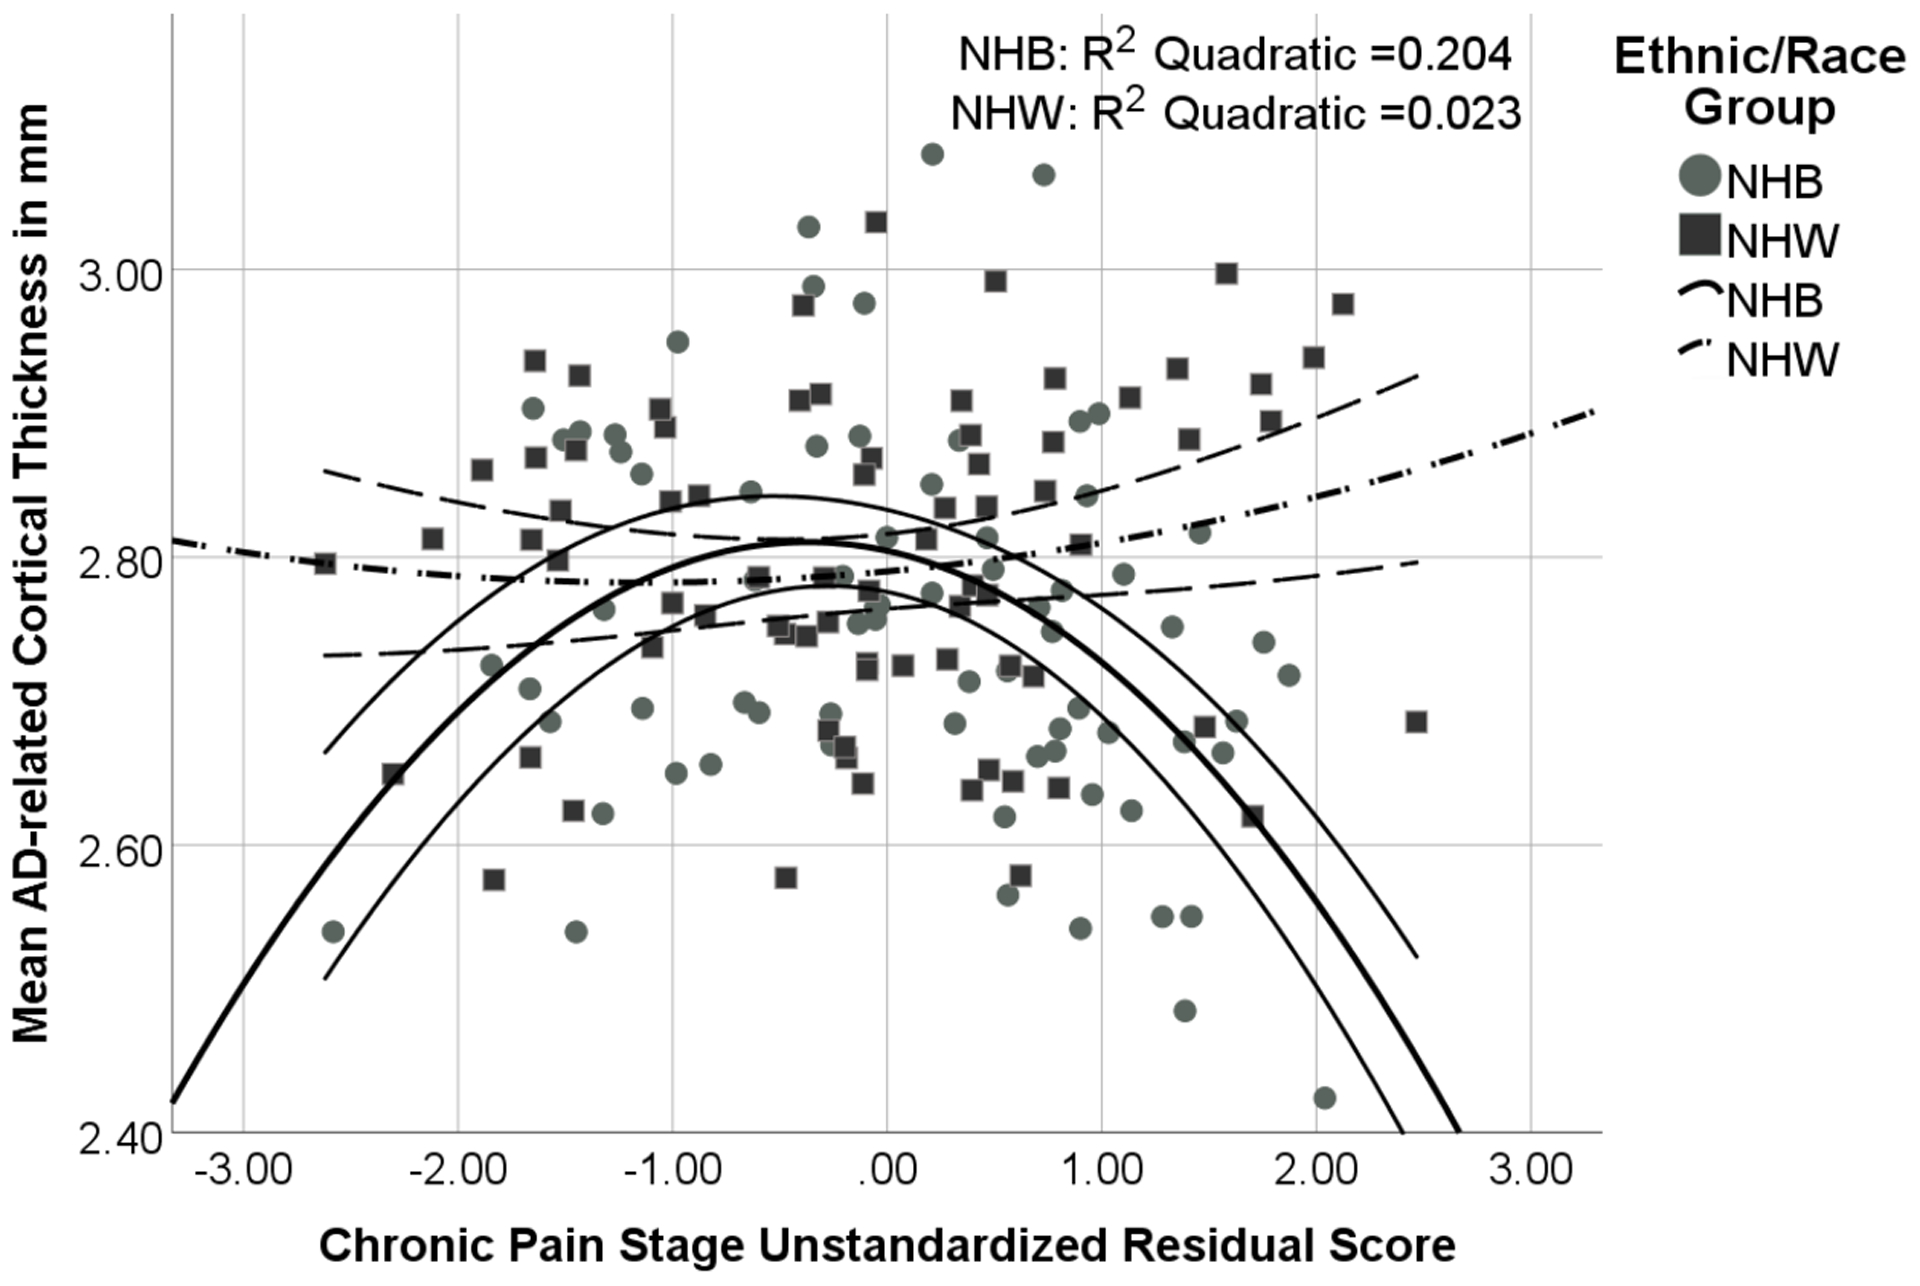
Associations between Chronic Pain Stage and Alzheimer’s-related Cortical Thickness in Temporal Lobe Regions by Ethnic/Race Group
Note: Chronic Pain Stage unstandardized residual score is adjusted for study site, age, BMI, mean z score of education level and income level, and MoCA. The quadratic Chronic Pain Stage × Ethnicity/Race interaction term was significant (p = 0.009).
The post hoc analysis with phenotypic extreme high and low chronic pain stage groups indicated significant ethnicity/race (F = 9.843, p = 0.002) and chronic pain stage × ethnicity/race interaction effects (F = 4.937, p = 0.029). Specifically, NHB adults with high chronic pain stage (n = 31) had thinner temporal lobe cortex than the other three groups (NHB low [n = 20], NHW high [n = 17], NHW low [n = 32]; p values < 0.025; see Supplemental Figure 2), which did not differ from each other (p values > 0.192).
Aim 2b: Frontal Cortex
While the overall model with covariates was significant (F = 2.428, p = 0.022), there was a trend but non-significant relationship between cortical thickness in middle and superior frontal gyri and chronic pain stage (p = 0.061). Only age was a significant predictor (p = 0.001). Further, there was insufficient evidence of ethnicity/race or ethnicity/race interactions (chronic pain stage × ethnicity/race) predicting cortical thickness of the middle and superior frontal gyri (p values > 0.181). See Figure 3.
Figure 3.
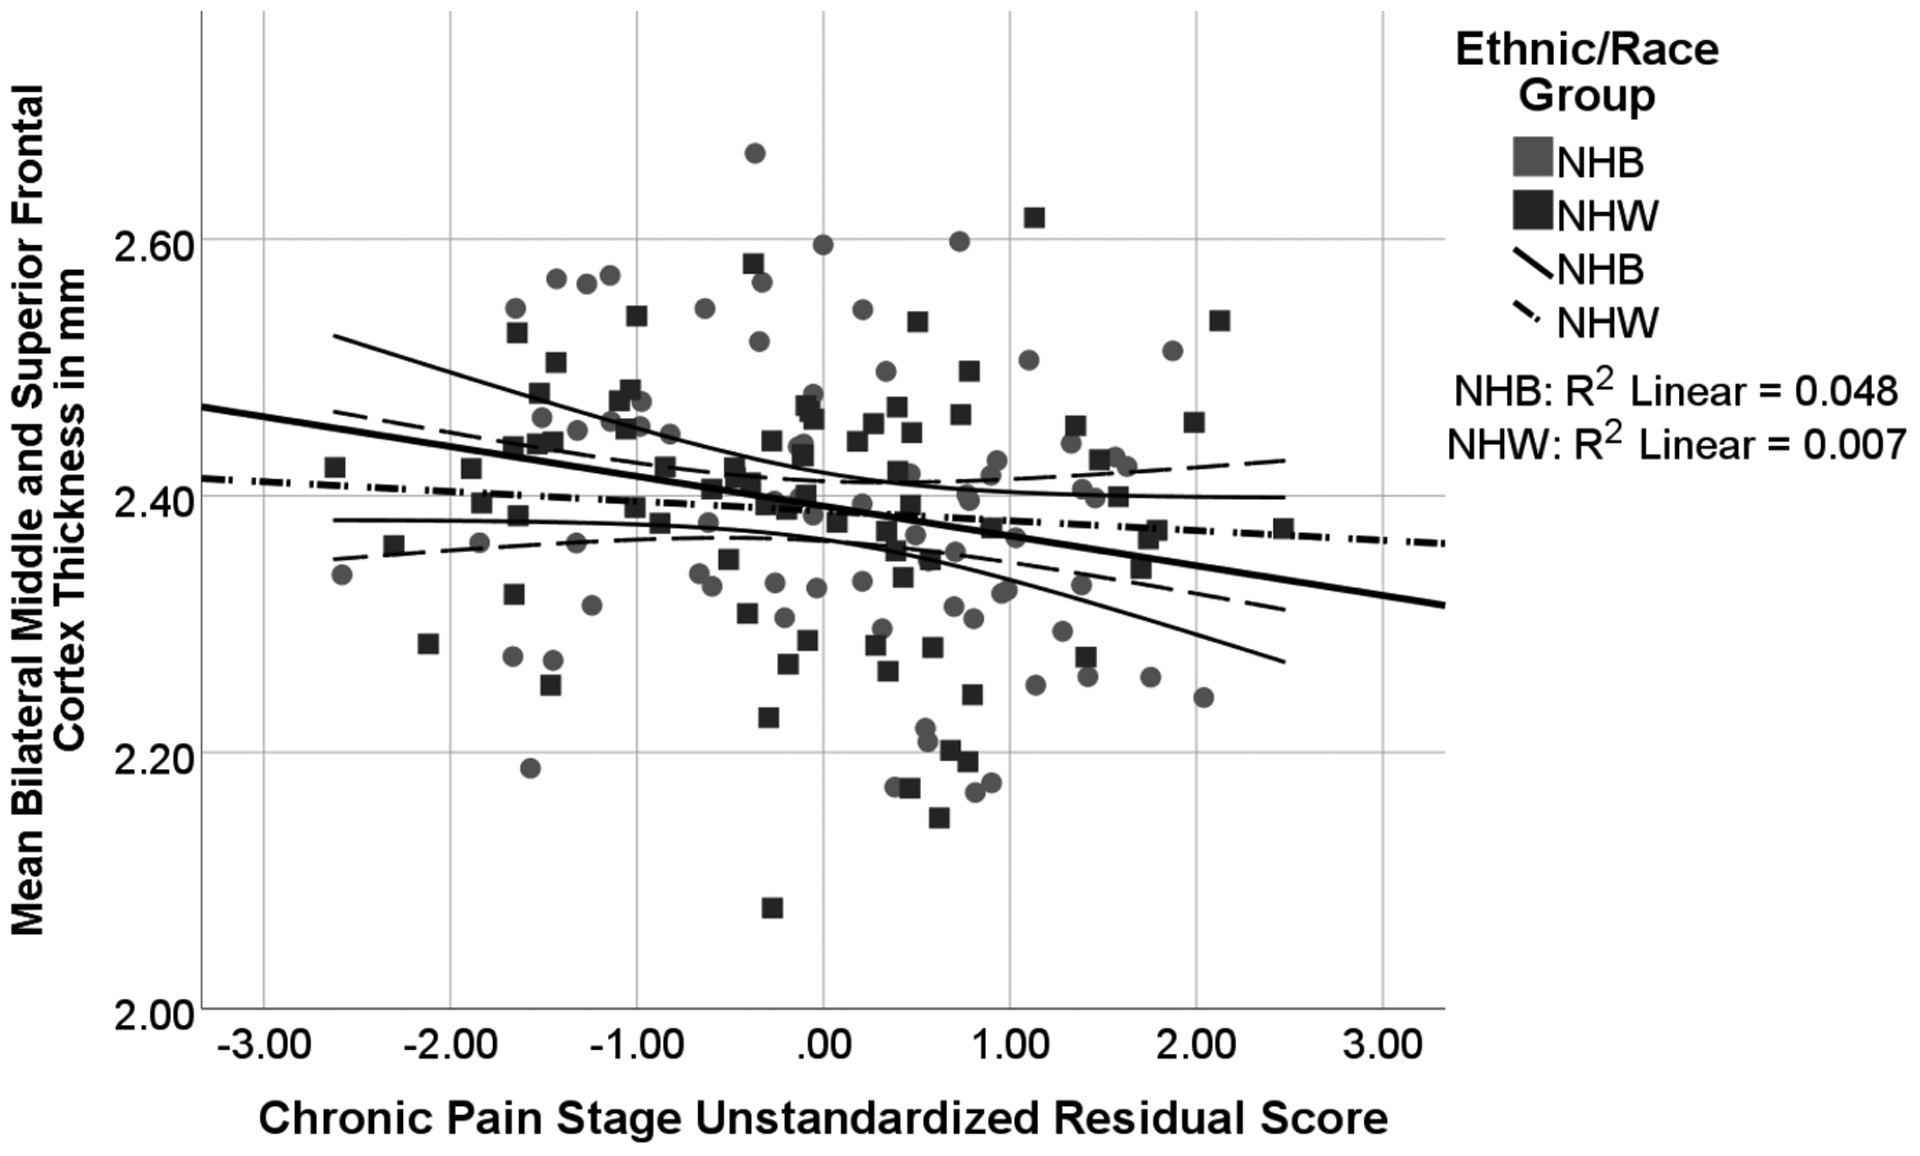
Associations between Chronic Pain Stage and Frontal Cortex by Ethnic/Race Group
Note: Chronic Pain Stage unstandardized residual score is adjusted for study site, age, BMI, mean z score of education level and income level, and MoCA. There was a trend significant effect of Chronic Pain Stage (p = 0.061) and insufficient evidence of ethnicity/race interactions or differences (p values > 0.181) or quadratic effects.
DISCUSSION
Our two primary aims were 1) to investigate if ethnicity/race moderates the relationships between chronic pain stage and general cognition in a sample of adults without dementia, 2) to investigate if ethnicity/race moderates the relationship between chronic pain stage and brain temporal lobe structure as a potential vulnerability to Alzheimer’s disease. Performance on the MoCA showed sociodemographic group differences but did not associate with chronic pain stage. In contrast, our findings show NHB participants with higher chronic pain stage display thinner temporal lobe cortices in areas associated with Alzheimer’s disease compared to high pain stage NHW participants and low pain stage NHBs and NHWs. An important consideration is that our groups differed on clinical pain, general cognition, and sociodemographic variables including age, income, and education. Understanding the effects of sociocultural and socioeconomic factors on health outcomes is the first step to challenging the disparities in healthcare that now appear to link disease conditions to neurodegenerative processes.
Cognitive Findings
Contrary to expectations, there was not an association between our measure of chronic pain stage and MoCA score. There was, however, evidence of an ethnic/race difference in MoCA scores. While previous research demonstrated associations between chronic pain and cognition [64–67], we did not find a relationship between our measure of chronic knee pain stage and the MoCA total score. Our sample comprised adults with mild to moderate knee pain with or at risk for knee osteoarthritis. The MoCA is a neurocognitive screening instrument with that combines multiple cognitive domains into an overall score; however, not all domains of cognitive functioning are expected to be influenced by chronic pain and each domain has a limited score range. Indeed, previous findings suggest that chronic pain is associated with cognitive function in attention and speed of information processing [68] and memory [69], although results are varied from study to study (for a review see [70]). As a screening instrument, the MoCA is also unlikely to be sensitive to subtle cognitive deficits in late middle age (mean sample age was about 58). Relationships between chronic pain stage and cognitive function might become more pronounced with advanced age or with more comprehensive measure of cognition. This remains a future direction of investigation.
Even with the young age representation of participants and with all participants demonstrating independence in activities of daily living, we observed MoCA scores in the 13 – 20 range that might indicate possible major neurocognitive disorder (dementia). However, our mean scores by demographic group match results from population-based samples [71, 72]. Other groups have reported on sociodemographic-based disparities in cognition, including the MoCA [40, 73–75]. The contributors toward ethnic/race group disparities are complex and involve not only sociodemographic and socioeconomic factors but also biobehavioral, psychosocial, and environmental factors [1, 4, 10].
Cortical Findings
Temporal Cortex Associated with AD
The relationship between AD-linked temporal cortex and chronic pain stage appears to follow an inverted ‘U’ shape for the NHB group (see Figure 2 and Supplemental Figures S1 – S2). A similar pattern between chronic pain and the brain has been demonstrated previously [25, 28, 29]. Several factors need to be considered in order to capture the biological interface of chronic pain [21, 30, 76]. Physiological systems are adaptive in nature. Consistent with the allostatic load conceptualization, stress with adequate recovery serves as a stimulus that promotes growth and change [77–79]. ‘Wear and tear’ and physiological dysregulation occur as a result of frequent, intense, and prolonged experiences of stress [80]. Thus, short-term and intermittent experiences of pain may serve as a stimulus that promotes adaptive plasticity, thereby contributing to increases in connectivity and structure [28]. Life experiences including chronic pain might result in different neurobiological aging trajectories for the sociodemographic groups. Higher levels of sociodemographic stress plus chronic pain could contribute to an overload (e.g., NHB with high pain stage) while lower levels of sociodemographic stress and chronic pain could indicate a different pattern (e.g., NHW) [79].
The interpretation of the observed inverted ‘U’ pattern should be tempered due to the relatively few NHB participants in our sample who are in the low chronic pain stage. A more reliable interpretation of our results is that NHB participants with high chronic pain stage appear to have particularly thin AD-related temporal lobe cortex. NHB adults with high chronic pain stage had thinner temporal lobe cortex than the other three groups, which did not differ from each other. Previous research suggests the aging cortex thins about 0.5% per year in later adulthood, although with local and inter-personal variation [81]. With extrapolation, NHB adults with high chronic pain stage had temporal cortices that appeared six to nine years ‘older’ than expected, which matches ethnic-related patterns reported in different samples [5]. While we cannot establish causality with our cross-sectional data, this is compelling evidence that complex sociocultural factors experienced over a lifetime in combination with a high stage of chronic pain might affect brain areas sensitive to neurodegenerative processes. Prior research indicates chronic pain changes brain structure (e.g., [82–84]) but it is also feasible NHB adults with particularly thin cortex in inferior temporal regions are at increased risk of more severe chronic pain. Either case is concerning for potential dementia risk.
Additional factors might also explain the observed relationships. The temporal lobe appears to be vulnerable to sociodemographic factors outside chronic pain. One measure of sociodemographic factors is the neighborhood-level disadvantage, including poverty, education, income level, and infrastructure within geographic regions. High neighborhood-level disadvantage has been linked to significantly lower hippocampus and total brain volumes, which might increase risk for dementia and cognitive decline later in life [85]. Furthermore, cardiovascular risk significantly mediated this relationship, which implies that this was due to high neighborhood-level disadvantaged regions having less access to “health-promoting resources” such as healthier food options and safe and effective recreational areas [85]. This is notable because access to health-promoting resources directly or indirectly provide neuroprotection against Alzheimer’s pattern temporal lobe neurodegeneration [86].
Abnormal temporal lobe morphometry in historically disadvantaged communities has also been reported to mediate poor cognitive performance across the lifespan. High financial burden correlates with poorer cognitive performance in children. This association is hypothesized to be due to higher levels of life stress, family instability, and the higher potential exposure to violence burdened to this socioeconomic stratum [87]. Additionally, low socioeconomic status in childhood associates with significantly decreased gray matter volume in the temporal lobe, which in turn associates with poorer academic achievement [87]. Delayed or atypical temporal lobe development has been related to lower socioeconomic status in other studies investigating family income and brain structure in children [88]. Socioeconomic disadvantages early in life can have long-lasting effects on neurobiology, cognition, and chronic pain [89–91]. Given the association of sociodemographic factors with brain structure, chronic pain, and cognitive functioning and the ethnic/race group differences in key sociodemographic variables, we speculate similar sociodemographic variables play a major role in our findings. We included income, education, and general cognition as covariates in our models but recognize they cannot fully capture the complexities of environmental and personal variables that might contribute to the AD-related temporal lobe cortex findings.
Mechanisms for temporal lobe links to environmental stressors are not fully clear but stress affects temporal lobe regions [92], although not exclusively (e.g., [93]). Further, chronic pain associates with increased levels of systemic inflammation [94, 95]. There is also evidence of ethnic/race differences in markers of systemic inflammation [96]. In aging, inflammation is also a risk factor for dementia and is associated with increased AD pathology [97, 98]. Considerations of inflammatory factors is an important next step in understanding the potential mechanismscontributing to the sociodemographic findings.
Frontal Cortex
Our frontal cortex findings suggest a small but nonsignificant inverse linear relationship between chronic pain stage and cortical thickness. The region of interest included dorsolateral prefrontal cortex, which has previously been related to chronic pain [55, 99, 100]. Specifically, longer pain duration in osteoarthritis has been associated with thinner prefrontal cortex, including the superior frontal gyrus [99]. Our measure of chronic pain stage includes pain duration as well as other factors (e.g., frequency). Therefore, our findings partially replicate previous work and extend it by demonstrating that relationships between pain stage and middle and superior frontal cortex do not appear to be moderated by ethnicity/race. Sociodemographic variables therefore do not moderate all relationships between the brain and chronic pain. The mechanisms for moderating effects of sociodemographics in some regions but not others should be investigated further.
Limitations and Future Directions
There are several strengths to our investigation including a large sample size with equal ethnic/race group representation, data collected from two study sites, and a comprehensive array of biopsychosocial and brain imaging data. There are also some important limitations to consider that highlight opportunities for future studies. In the current study, the chronic pain stage measure is specific to knee pain (frequency, intensity, and duration) and does not capture pain at other body sites. The current sample of participants reported a median of five body sites of pain. Thus, the chronic pain experienced may not be fully captured in the chronic pain stage measure used in the current study.
The ethnicity/race variable in the study served as a proxy for lifetime exposures of sociocultural priviledge or disadvantages and discrimination. This is a limitation compared to fully measuring the underlying variables, especially given that ethnic/racial classification does not reveal educational, socioeconomic, and cultural experiences [101]. While we accounted for education attainment, income level, and general cognition, we were unable to account for all variables that might influence the relationships between sociodemographic factors and brain structure. Further, our measure of educational attainment does not indicate quality, capacity, or informal education. Income level also does not capture financial-related security or insecurity across the lifespan. We also used a cognitive screeening measure, and more comprehensive measures of cognition will be important moving forward. An additional limitation is the cross-sectional nature of the data, which does not allow for inpretation of causation of relationships.
Conclusions
There appear to be complex relationships between chronic pain stage, temporal lobe cortex, and sociodemographic variables. By specifically evaluating sociodemographic groups (ethnicity/race) as a moderating variable, we found relationships between chronic knee pain stage and temporal cortex thickness that otherwise would have been masked. Specifically, NHW participants had relatively flat associations between chronic knee pain stage and cortical thickness. In contrast, NHB participants with high chronic knee pain stage appeared to have thinner temporal cortex in areas associated with Alzheimer’s disease. Our findings suggest the interplay between sociodemographic variables and chronic pain might enhance vulnerabilities to neurodegenerative processes.
Supplementary Material
ACKNOWLEDGEMENTS
The authors would like to thank Dr. Larry Bradley for his invaluable contributions to developing and implementing the UPLOAD Projects and to Angela Mickle, MS, CCRP for her literature search contributions. The content is solely the responsibility of the authors and does not necessarily represent the official views of the National Institutes of Health or other funding agencies.
FUNDING
Research funding and support provided by NIH/NIA Grants R01AG054370 (KTS) & R01AG054370-05S1 (JJT, KTS); R37AG033906 (RBF) and UF CTSA Grant UL1TR001427 and UAB CTSA Grant UL1TR001417 from the NIH Center for Advancing Translational Sciences. Data management was funded in part by NCATS grant UL1 TR000064. A portion of this work was performed in the McKnight Brain Institute at the National High Magnetic Field Laboratory’s Advanced Magnetic Resonance Imaging and Spectroscopy (AMRIS) Facility, which is supported by National Science Foundation Cooperative Agreement No. DMR-1644779 and the State of Florida.
Footnotes
COMPETING INTERESTS
The authors have no conflicts of interest to report.
References
- [1].Mayeda ER, Glymour MM, Quesenberry CP, Whitmer RA (2016) Inequalities in dementia incidence between six racial and ethnic groups over 14 years. Alzheimer’s & Dementia 12, 216–224. [DOI] [PMC free article] [PubMed] [Google Scholar]
- [2].Mehta KM, Yeo GW (2017) Systematic review of dementia prevalence and incidence in United States race/ethnic populations. Alzheimers Dement 13, 72–83. [DOI] [PubMed] [Google Scholar]
- [3].Steenland K, Goldstein FC, Levey A, Wharton W (2016) A meta-analysis of Alzheimer’s disease incidence and prevalence comparing African-Americans and Caucasians. Journal of Alzheimer’s Disease 50, 71–76. [DOI] [PMC free article] [PubMed] [Google Scholar]
- [4].Yaffe K, Falvey C, Harris TB, Newman A, Satterfield S, Koster A, Ayonayon H, Simonsick E (2013) Effect of socioeconomic disparities on incidence of dementia among biracial older adults: prospective study. Bmj 347, f7051. [DOI] [PMC free article] [PubMed] [Google Scholar]
- [5].McDonough IM (2017) Beta-amyloid and Cortical Thickness Reveal Racial Disparities in Preclinical Alzheimer’s Disease. NeuroImage: Clinical 16, 659–667. [DOI] [PMC free article] [PubMed] [Google Scholar]
- [6].Burchard EG, Ziv E, Coyle N, Gomez SL, Tang H, Karter AJ, Mountain JL, Pérez-Stable EJ, Sheppard D, Risch N (2003) The importance of race and ethnic background in biomedical research and clinical practice. New England Journal of Medicine 348, 1170–1175. [DOI] [PubMed] [Google Scholar]
- [7].Farrer LA, Cupples LA, Haines JL, Hyman B, Kukull WA, Mayeux R, Myers RH, Pericak-Vance MA, Risch N, Van Duijn CM (1997) Effects of age, sex, and ethnicity on the association between apolipoprotein E genotype and Alzheimer disease: a meta-analysis. Jama 278, 1349–1356. [PubMed] [Google Scholar]
- [8].Morris JC, Schindler SE, McCue LM, Moulder KL, Benzinger TL, Cruchaga C, Fagan AM, Grant E, Gordon BA, Holtzman DM (2019) Assessment of racial disparities in biomarkers for Alzheimer disease. JAMA neurology 76, 264–273. [DOI] [PMC free article] [PubMed] [Google Scholar]
- [9].Tang M-X, Stern Y, Marder K, Bell K, Gurland B, Lantigua R, Andrews H, Feng L, Tycko B, Mayeux R (1998) The APOE-∊ 4 allele and the risk of Alzheimer disease among African Americans, whites, and Hispanics. Jama 279, 751–755. [DOI] [PubMed] [Google Scholar]
- [10].Myers HF (2009) Ethnicity- and socio-economic status-related stresses in context: an integrative review and conceptual model. Journal of Behavioral Medicine 32, 9–19. [DOI] [PubMed] [Google Scholar]
- [11].Yaffe K, Weston A, Graff-Radford NR, Satterfield S, Simonsick EM, Younkin SG, Younkin LH, Kuller L, Ayonayon HN, Ding J (2011) Association of plasma β-amyloid level and cognitive reserve with subsequent cognitive decline. Jama 305, 261–266. [DOI] [PMC free article] [PubMed] [Google Scholar]
- [12].Lawrence RC, Felson DT, Helmick CG, Arnold LM, Choi H, Deyo RA, Gabriel S, Hirsch R, Hochberg MC, Hunder GG (2008) Estimates of the prevalence of arthritis and other rheumatic conditions in the United States: Part II. Arthritis & Rheumatism 58, 26–35. [DOI] [PMC free article] [PubMed] [Google Scholar]
- [13].Neogi T, Zhang Y (2013) Epidemiology of Osteoarthritis. Rheumatic Disease Clinics of North America 39, 1–19. [DOI] [PMC free article] [PubMed] [Google Scholar]
- [14].Wallace IJ, Worthington S, Felson DT, Jurmain RD, Wren KT, Maijanen H, Woods RJ, Lieberman DE (2017) Knee osteoarthritis has doubled in prevalence since the mid-20th century. Proceedings of the National Academy of Sciences of the United States of America 114, 9332–9336. [DOI] [PMC free article] [PubMed] [Google Scholar]
- [15].Creamer P, Lethbridge‐Cejku M, Hochberg M (2000) Factors associated with functional impairment in symptomatic knee osteoarthritis. Rheumatology 39, 490–496. [DOI] [PubMed] [Google Scholar]
- [16].Kauppila A-M, Kyllönen E, Mikkonen P, Ohtonen P, Laine V, Siira P, Niinimäki J, Arokoski JP (2009) Disability in end-stage knee osteoarthritis. Disability and rehabilitation 31, 370–380. [DOI] [PubMed] [Google Scholar]
- [17].Ling SM, Fried LP, Garrett ES, Fan M-Y, Rantanen T, Bathon JM (2003) Knee osteoarthritis compromises early mobility function: The Women’s Health and Aging Study II. The Journal of rheumatology 30, 114–120. [PubMed] [Google Scholar]
- [18].Berryman C, Stanton TR, Bowering KJ, Tabor A, McFarlane A, Moseley GL (2014) Do people with chronic pain have impaired executive function? A meta-analytical review. Clinical Psychology Review 34, 563–579. [DOI] [PubMed] [Google Scholar]
- [19].Jongsma MLA, Postma SAE, Souren P, Arns M, Gordon E, Vissers K, Wilder-Smith O, Van Rijn CM, Van Goor H (2011) Neurodegenerative Properties of Chronic Pain: Cognitive Decline in Patients with Chronic Pancreatitis. PloS one 6, e23363. [DOI] [PMC free article] [PubMed] [Google Scholar]
- [20].Hassett AL, Epel E, Clauw DJ, Harris RE, Harte SE, Kairys A, Buyske S, Williams DA (2012) Pain is associated with short leukocyte telomere length in women with fibromyalgia. The Journal of Pain 13, 959–969. [DOI] [PubMed] [Google Scholar]
- [21].Sibille KT, Chen H, Bartley EJ, Riley III J, Glover TL, King CD, Zhang H, Cruz-Almeida Y, Goodin BR, Sotolongo A (2017) Accelerated aging in adults with knee osteoarthritis pain: consideration for frequency, intensity, time, and total pain sites. Pain reports 2. [DOI] [PMC free article] [PubMed] [Google Scholar]
- [22].Cruz-Almeida Y, Fillingim RB, Riley JL 3rd, Woods AJ, Porges E, Cohen R, Cole J (2019) Chronic pain is associated with a brain aging biomarker in community-dwelling older adults. Pain 160, 1119–1130. [DOI] [PMC free article] [PubMed] [Google Scholar]
- [23].Magon S, Sprenger T, Otti A, Papadopoulou A, Gündel H, Noll-Hussong M (2018) Cortical thickness alterations in chronic pain disorder: an exploratory MRI study. Psychosomatic medicine 80, 592–598. [DOI] [PubMed] [Google Scholar]
- [24].Schwedt TJ, Berisha V, Chong CD (2015) Temporal Lobe Cortical Thickness Correlations Differentiate the Migraine Brain from the Healthy Brain. 10, e0116687. [DOI] [PMC free article] [PubMed] [Google Scholar]
- [25].Vachon-Presseau E, Roy M, Martel M-O, Caron E, Marin M-F, Chen J, Albouy G, Plante I, Sullivan MJ, Lupien SJ, Rainville P (2013) The stress model of chronic pain: evidence from basal cortisol and hippocampal structure and function in humans. Brain 136, 815–827. [DOI] [PubMed] [Google Scholar]
- [26].Cruz-Almeida Y, Fillingim RB, Riley III JL, Woods AJ, Porges E, Cohen R, Cole J (2019) Chronic pain is associated with a brain aging biomarker in community-dwelling older adults. Pain 160, 1119–1130. [DOI] [PMC free article] [PubMed] [Google Scholar]
- [27].Schweinhardt P, Kuchinad A, Pukall CF, Bushnell MC (2008) Increased gray matter density in young women with chronic vulvar pain. Pain 140, 411–419. [DOI] [PubMed] [Google Scholar]
- [28].Maleki N, Becerra L, Brawn J, McEwen B, Burstein R, Borsook D (2013) Common hippocampal structural and functional changes in migraine. Brain Structure and Function 218, 903–912. [DOI] [PMC free article] [PubMed] [Google Scholar]
- [29].Moayedi M, Weissman-Fogel I, Salomons TV, Crawley AP, Goldberg MB, Freeman BV, Tenenbaum HC, Davis KD (2012) Abnormal gray matter aging in chronic pain patients. Brain Res 1456, 82–93. [DOI] [PubMed] [Google Scholar]
- [30].Sibille KT, Steingrímsdóttir ÓA, Fillingim RB, Stubhaug A, Schirmer H, Chen H, McEwen BS, Nielsen CS (2016) Investigating the burden of chronic pain: an inflammatory and metabolic composite. Pain Research and Management 2016. [DOI] [PMC free article] [PubMed] [Google Scholar]
- [31].Allen KD (2010) Racial and ethnic disparities in osteoarthritis phenotypes. Current opinion in rheumatology 22, 528–532. [DOI] [PubMed] [Google Scholar]
- [32].Vaughn IA, Terry EL, Bartley EJ, Schaefer N, Fillingim RB (2019) Racial-ethnic differences in osteoarthritis pain and disability: a meta-analysis. The Journal of Pain 20, 629–644. [DOI] [PMC free article] [PubMed] [Google Scholar]
- [33].Vina ER, Ran D, Ashbeck EL, Kwoh CK (2018) Natural history of pain and disability among African–Americans and Whites with or at risk for knee osteoarthritis: A longitudinal study. Osteoarthritis and Cartilage 26, 471–479. [DOI] [PMC free article] [PubMed] [Google Scholar]
- [34].Adler NE, Newman K (2002) Socioeconomic disparities in health: pathways and policies. Health affairs 21, 60–76. [DOI] [PubMed] [Google Scholar]
- [35].Geronimus AT, Bound J, Waidmann TA, Colen CG, Steffick D (2001) Inequality in life expectancy, functional status, and active life expectancy across selected black and white populations in the United States. Demography 38, 227–251. [DOI] [PubMed] [Google Scholar]
- [36].Jack CR, Wiste HJ, Weigand SD, Knopman DS, Mielke MM, Vemuri P, Lowe V, Senjem ML, Gunter JL, Reyes D, Machulda MM, Roberts R, Petersen RC (2015) Different definitions of neurodegeneration produce similar amyloid/neurodegeneration biomarker group findings. Brain 138, 3747–3759. [DOI] [PMC free article] [PubMed] [Google Scholar]
- [37].Petersen RC, Lundt ES, Therneau TM, Weigand SD, Knopman DS, Mielke MM, Roberts RO, Lowe VJ, Machulda MM, Kremers WK, Geda YE, Jack CR (2019) Predicting Progression to Mild Cognitive Impairment. Annals of Neurology 85, 155–160. [DOI] [PMC free article] [PubMed] [Google Scholar]
- [38].Anderson NB, Bulatao RA, Cohen B, on Race P, Council NR (2004) Racial and ethnic disparities in health and mortality among the US elderly population In Critical perspectives on racial and ethnic differences in health in late life National Academies Press; (US: ). [PubMed] [Google Scholar]
- [39].Cunningham TJ, Croft JB, Liu Y, Lu H, Eke PI, Giles WH (2017) Vital Signs: Racial Disparities in Age-Specific Mortality Among Blacks or African Americans - United States, 1999–2015. MMWR. Morbidity and mortality weekly report 66, 444–456. [DOI] [PMC free article] [PubMed] [Google Scholar]
- [40].Zahodne LB, Manly JJ, Azar M, Brickman AM, Glymour MM (2016) Racial Disparities in Cognitive Performance in Mid‐and Late Adulthood: Analyses of Two Cohort Studies. Journal of the American Geriatrics Society 64, 959–964. [DOI] [PMC free article] [PubMed] [Google Scholar]
- [41].Roux CH, Saraux A, Mazieres B, Pouchot J, Morvan J, Fautrel B, Testa J, Fardellone P, Rat AC, Coste J (2008) Screening for hip and knee osteoarthritis in the general population: predictive value of a questionnaire and prevalence estimates. Annals of the rheumatic diseases 67, 1406–1411. [DOI] [PubMed] [Google Scholar]
- [42].Nasreddine ZS, Phillips NA, Bédirian V, Charbonneau S, Whitehead V, Collin I, Cummings JL, Chertkow H (2005) The Montreal Cognitive Assessment, MoCA: A Brief Screening Tool For Mild Cognitive Impairment. Journal of the American Geriatrics Society 53, 695–699. [DOI] [PubMed] [Google Scholar]
- [43].Von Korff M, Ormel J, Keefe FJ, Dworkin SF (1992) Grading the severity of chronic pain. Pain 50, 133–149. [DOI] [PubMed] [Google Scholar]
- [44].Fischl B (2012) FreeSurfer. Neuroimage 62, 774–781. [DOI] [PMC free article] [PubMed] [Google Scholar]
- [45].Fischl B, Dale AM (2000) Measuring the thickness of the human cerebral cortex from magnetic resonance images. Proceedings of the National Academy of Sciences of the United States of America 97, 11050–11055. [DOI] [PMC free article] [PubMed] [Google Scholar]
- [46].Fischl B, Salat DH, Busa E, Albert M, Dieterich M, Haselgrove C, van der Kouwe A, Killiany R, Kennedy D, Klaveness S, Montillo A, Makris N, Rosen B, Dale AM (2002) Whole brain segmentation: automated labeling of neuroanatomical structures in the human brain. Neuron 33, 341–355. [DOI] [PubMed] [Google Scholar]
- [47].Fischl B, van der Kouwe A, Destrieux C, Halgren E, Ségonne F, Salat DH, Busa E, Seidman LJ, Goldstein J, Kennedy D, Caviness V, Makris N, Rosen B, Dale AM (2004) Automatically parcellating the human cerebral cortex. Cerebral cortex 14, 11–22. [DOI] [PubMed] [Google Scholar]
- [48].Fischl B, Salat DH, van der Kouwe AJW, Makris N, Ségonne F, Quinn BT, Dale AM (2004) Sequence-independent segmentation of magnetic resonance images. NeuroImage 23, S69–S84. [DOI] [PubMed] [Google Scholar]
- [49].Klein A, Tourville J (2012) 101 labeled brain images and a consistent human cortical labeling protocol. Frontiers in neuroscience 6, 171. [DOI] [PMC free article] [PubMed] [Google Scholar]
- [50].Salat DH, Buckner RL, Snyder AZ, Greve DN, Desikan RSR, Busa E, Morris JC, Dale AM, Fischl B (2004) Thinning of the Cerebral Cortex in Aging. Cerebral cortex 14, 721–730. [DOI] [PubMed] [Google Scholar]
- [51].Han X, Jovicich J, Salat D, van der Kouwe A, Quinn B, Czanner S, Busa E, Pacheco J, Albert M, Killiany R, Maguire P, Rosas D, Makris N, Dale A, Dickerson B, Fischl B (2006) Reliability of MRI-derived measurements of human cerebral cortical thickness: The effects of field strength, scanner upgrade and manufacturer. NeuroImage 32, 180–194. [DOI] [PubMed] [Google Scholar]
- [52].Reuter M, Schmansky NJ, Rosas HD, Fischl B (2012) Within-subject template estimation for unbiased longitudinal image analysis. Neuroimage 61, 1402–1418. [DOI] [PMC free article] [PubMed] [Google Scholar]
- [53].Jack CR, Wiste HJ, Weigand SD, Therneau TM, Lowe VJ, Knopman DS, Gunter JL, Senjem ML, Jones DT, Kantarci K (2017) Defining imaging biomarker cut points for brain aging and Alzheimer’s disease. Alzheimer’s & Dementia 13, 205–216. [DOI] [PMC free article] [PubMed] [Google Scholar]
- [54].Cieslik EC, Zilles K, Caspers S, Roski C, Kellermann TS, Jakobs O, Langner R, Laird AR, Fox PT, Eickhoff SB (2013) Is There “One” DLPFC in Cognitive Action Control? Evidence for Heterogeneity From Co-Activation-Based Parcellation. Cerebral Cortex 23, 2677–2689. [DOI] [PMC free article] [PubMed] [Google Scholar]
- [55].Seminowicz DA, Moayedi M (2017) The Dorsolateral Prefrontal Cortex in Acute and Chronic Pain. The Journal of Pain 18, 1027–1035. [DOI] [PMC free article] [PubMed] [Google Scholar]
- [56].Li W, Qin W, Liu H, Fan L, Wang J, Jiang T, Yu C (2013) Subregions of the human superior frontal gyrus and their connections. NeuroImage 78, 46–58. [DOI] [PubMed] [Google Scholar]
- [57].Kong J, Loggia ML, Zyloney C, Tu P, LaViolette P, Gollub RL (2010) Exploring the brain in pain: activations, deactivations and their relation. Pain 148, 257–267. [DOI] [PMC free article] [PubMed] [Google Scholar]
- [58].Bakkour A, Morris JC, Wolk DA, Dickerson BC (2013) The effects of aging and Alzheimer’s disease on cerebral cortical anatomy: Specificity and differential relationships with cognition. NeuroImage 76, 332–344. [DOI] [PMC free article] [PubMed] [Google Scholar]
- [59].Pini L, Pievani M, Bocchetta M, Altomare D, Bosco P, Cavedo E, Galluzzi S, Marizzoni M, Frisoni GB (2016) Brain atrophy in Alzheimer’s Disease and aging. Ageing Research Reviews 30, 25–48. [DOI] [PubMed] [Google Scholar]
- [60].Iacobucci D, Schneider MJ, Popovich DL, Bakamitsos GA (2016) Mean centering helps alleviate “micro” but not “macro” multicollinearity. Behavior Research Methods 48, 1308–1317. [DOI] [PubMed] [Google Scholar]
- [61].Basto‐Abreu A, Barrientos‐Gutiérrez T, Zepeda‐Tello R, Camacho V, Gimeno Ruiz de Porras D, Hernández‐Ávila M (2018) The relationship of socioeconomic status with body mass index depends on the socioeconomic measure used. Obesity 26, 176–184. [DOI] [PubMed] [Google Scholar]
- [62].Shapiro SS, Wilk MB (1965) An analysis of variance test for normality (complete samples)†. Biometrika 52, 591–611. [Google Scholar]
- [63].Benjamini Y, Hochberg Y (1995) Controlling the false discovery rate: a practical and powerful approach to multiple testing. Journal of the Royal statistical society: series B (Methodological) 57, 289–300. [Google Scholar]
- [64].Malfliet A, Coppieters I, Van Wilgen P, Kregel J, De Pauw R, Dolphens M, Ickmans K (2017) Brain changes associated with cognitive and emotional factors in chronic pain: a systematic review. European Journal of Pain 21, 769–786. [DOI] [PubMed] [Google Scholar]
- [65].Baker K, Gibson S, Georgiou‐Karistianis N, Giummarra M (2018) Relationship between self‐reported cognitive difficulties, objective neuropsychological test performance and psychological distress in chronic pain. European Journal of Pain 22, 601–613. [DOI] [PubMed] [Google Scholar]
- [66].Berryman C, Stanton TR, Bowering KJ, Tabor A, McFarlane A, Moseley GL (2013) Evidence for working memory deficits in chronic pain: a systematic review and meta-analysis. PAIN® 154, 1181–1196. [DOI] [PubMed] [Google Scholar]
- [67].Mazza S, Frot M, Rey AE (2018) A comprehensive literature review of chronic pain and memory. Progress in Neuro-Psychopharmacology and Biological Psychiatry 87, 183–192. [DOI] [PubMed] [Google Scholar]
- [68].van der Leeuw G, Leveille SG, Dong Z, Shi L, Habtemariam D, Milberg W, Hausdorff JM, Grande L, Gagnon P, McLean RR (2018) Chronic pain and attention in older adults living in the community. Journal of the American Geriatrics Society 66, 1318. [DOI] [PMC free article] [PubMed] [Google Scholar]
- [69].Oosterman JM, Derksen LC, van Wijck AJ, Veldhuijzen DS, Kessels RP (2011) Memory functions in chronic pain: examining contributions of attention and age to test performance. The Clinical journal of pain 27, 70–75. [DOI] [PubMed] [Google Scholar]
- [70].Moriarty O, McGuire BE, Finn DP (2011) The effect of pain on cognitive function: a review of clinical and preclinical research. Progress in neurobiology 93, 385–404. [DOI] [PubMed] [Google Scholar]
- [71].Rossetti HC, Lacritz LH, Cullum CM, Weiner MF (2011) Normative data for the Montreal Cognitive Assessment (MoCA) in a population-based sample. Neurology 77, 1272–1275. [DOI] [PubMed] [Google Scholar]
- [72].Rossetti HC, Lacritz LH, Hynan LS, Cullum CM, Van Wright A, Weiner MF (2016) Montreal Cognitive Assessment Performance among Community-Dwelling African Americans. Archives of Clinical Neuropsychology. [DOI] [PMC free article] [PubMed] [Google Scholar]
- [73].Milani SA, Marsiske M, Cottler LB, Chen X, Striley CW (2018) Optimal cutoffs for the Montreal Cognitive Assessment vary by race and ethnicity. Alzheimer’s & Dementia: Diagnosis, Assessment & Disease Monitoring 10, 773–781. [DOI] [PMC free article] [PubMed] [Google Scholar]
- [74].Weuve J, Barnes LL, de Leon CFM, Rajan KB, Beck T, Aggarwal NT, Hebert LE, Bennett DA, Wilson RS, Evans DA (2018) Cognitive aging in black and white Americans: cognition, cognitive decline, and incidence of Alzheimer disease dementia. Epidemiology (Cambridge, Mass.) 29, 151. [DOI] [PMC free article] [PubMed] [Google Scholar]
- [75].Wilson RS, Rajan KB, Barnes LL, Weuve J, Evans DA (2016) Factors related to racial differences in late-life level of cognitive function. Neuropsychology 30, 517. [DOI] [PMC free article] [PubMed] [Google Scholar]
- [76].Sibille KT, McBeth J, Smith D, Wilkie R (2017) Allostatic load and pain severity in older adults: Results from the English Longitudinal Study of Ageing. Exp Gerontol 88, 51–58. [DOI] [PMC free article] [PubMed] [Google Scholar]
- [77].McEwen BS (1998) Protective and damaging effects of stress mediators. N Engl J Med 338, 171–179. [DOI] [PubMed] [Google Scholar]
- [78].McEwen BS, Gianaros PJ (2011) Stress- and allostasis-induced brain plasticity. Annu Rev Med 62, 431–445. [DOI] [PMC free article] [PubMed] [Google Scholar]
- [79].Epel ES (2020) The geroscience agenda: Toxic stress, hormetic stress, and the rate of aging. Ageing Research Reviews, 101167. [DOI] [PMC free article] [PubMed] [Google Scholar]
- [80].McEwen BS (2004) Protection and damage from acute and chronic stress: allostasis and allostatic overload and relevance to the pathophysiology of psychiatric disorders. Ann N Y Acad Sci 1032, 1–7. [DOI] [PubMed] [Google Scholar]
- [81].Fjell AM, Walhovd KB, Fennema-Notestine C, McEvoy LK, Hagler DJ, Holland D, Brewer JB, Dale AM (2009) One-Year Brain Atrophy Evident in Healthy Aging. Journal of Neuroscience 29, 15223–15231. [DOI] [PMC free article] [PubMed] [Google Scholar]
- [82].Lewis GN, Parker RS, Sharma S, Rice DA, McNair PJ (2018) Structural Brain Alterations Before and After Total Knee Arthroplasty: A Longitudinal Assessment. Pain Med 19, 2166–2176. [DOI] [PubMed] [Google Scholar]
- [83].May A (2011) Structural brain imaging: a window into chronic pain. Neuroscientist 17, 209–220. [DOI] [PubMed] [Google Scholar]
- [84].Rodriguez-Raecke R, Niemeier A, Ihle K, Ruether W, May A (2013) Structural brain changes in chronic pain reflect probably neither damage nor atrophy. PLoS One 8, e54475. [DOI] [PMC free article] [PubMed] [Google Scholar]
- [85].Hunt JFV, Buckingham W, Kim AJ, Oh J, Vogt NM, Jonaitis EM, Hunt TK, Zuelsdorff M, Powell R, Norton D, Rissman RA, Asthana S, Okonkwo OC, Johnson SC, Kind AJH, Bendlin BB (2020) Association of Neighborhood-Level Disadvantage With Cerebral and Hippocampal Volume. JAMA Neurology 77, 451. [DOI] [PMC free article] [PubMed] [Google Scholar]
- [86].Vemuri P, Knopman DS, Lesnick TG, Przybelski SA, Mielke MM, Graff-Radford J, Murray ME, Roberts RO, Vassilaki M, Lowe VJ (2017) Evaluation of amyloid protective factors and Alzheimer disease neurodegeneration protective factors in elderly individuals. JAMA neurology 74, 718–726. [DOI] [PMC free article] [PubMed] [Google Scholar]
- [87].Hair NL, Hanson JL, Wolfe BL, Pollak SD (2015) Association of child poverty, brain development, and academic achievement. JAMA pediatrics 169, 822–829. [DOI] [PMC free article] [PubMed] [Google Scholar]
- [88].Noble KG, Houston SM, Brito NH, Bartsch H, Kan E, Kuperman JM, Akshoomoff N, Amaral DG, Bloss CS, Libiger O (2015) Family income, parental education and brain structure in children and adolescents. Nature neuroscience 18, 773–778. [DOI] [PMC free article] [PubMed] [Google Scholar]
- [89].Goosby BJ (2013) Early Life Course Pathways of Adult Depression and Chronic Pain. 54, 75–91. [DOI] [PMC free article] [PubMed] [Google Scholar]
- [90].Wilson RS, Scherr PA, Hoganson G, Bienias JL, Evans DA, Bennett DA (2005) Early Life Socioeconomic Status and Late Life Risk of Alzheimer’s Disease. Neuroepidemiology 25, 8–14. [DOI] [PubMed] [Google Scholar]
- [91].Jagust WJ (2016) Early life sets the stage for aging. Proceedings of the National Academy of Sciences 113, 9148–9150. [DOI] [PMC free article] [PubMed] [Google Scholar]
- [92].Kim JJ, Diamond DM (2002) The stressed hippocampus, synaptic plasticity and lost memories. Nature Reviews Neuroscience 3, 453. [DOI] [PubMed] [Google Scholar]
- [93].Saleh A, Potter GG, McQuoid DR, Boyd B, Turner R, Macfall JR, Taylor WD (2017) Effects of early life stress on depression, cognitive performance and brain morphology. Psychological Medicine 47, 171–181. [DOI] [PMC free article] [PubMed] [Google Scholar]
- [94].Coe CL, Muller DA, Schell K (2008) Altered cytokine levels in the blood and cerebrospinal fluid of chronic pain patients. Journal of neuroimmunology 195, 157–163. [DOI] [PubMed] [Google Scholar]
- [95].Marchand F, Perretti M, McMahon SB (2005) Role of the immune system in chronic pain. Nature Reviews Neuroscience 6, 521–532. [DOI] [PubMed] [Google Scholar]
- [96].Paalani M, Lee JW, Haddad E, Tonstad S (2011) Determinants of inflammatory markers in a bi-ethnic population. Ethnicity & disease 21, 142–149. [PMC free article] [PubMed] [Google Scholar]
- [97].Schain M, Kreisl WC (2017) Neuroinflammation in neurodegenerative disorders—a review. Current neurology and neuroscience reports 17, 25. [DOI] [PubMed] [Google Scholar]
- [98].Van Eldik LJ, Carrillo MC, Cole PE, Feuerbach D, Greenberg BD, Hendrix JA, Kennedy M, Kozauer N, Margolin RA, Molinuevo JL (2016) The roles of inflammation and immune mechanisms in Alzheimer’s disease. Alzheimer’s & Dementia: Translational Research & Clinical Interventions 2, 99–109. [DOI] [PMC free article] [PubMed] [Google Scholar]
- [99].Alshuft HM, Condon LA, Dineen RA, Auer DP (2016) Cerebral cortical thickness in chronic pain due to knee osteoarthritis: the effect of pain duration and pain sensitization. PloS one 11. [DOI] [PMC free article] [PubMed] [Google Scholar]
- [100].Coppieters I, Meeus M, Kregel J, Caeyenberghs K, De Pauw R, Goubert D, Cagnie B (2016) Relations Between Brain Alterations and Clinical Pain Measures in Chronic Musculoskeletal Pain: A Systematic Review. J Pain 17, 949–962. [DOI] [PubMed] [Google Scholar]
- [101].Manly JJ (2006) Deconstructing race and ethnicity: implications for measurement of health outcomes. Medical care, S10–S16. [DOI] [PubMed] [Google Scholar]
Associated Data
This section collects any data citations, data availability statements, or supplementary materials included in this article.