

Abstract
The significance of the phenotypic plasticity afforded by epithelial-mesenchymal transition (EMT) for cancer progression and drug resistance remains to be fully elucidated in the clinic. We evaluated epithelial-mesenchymal phenotypic characteristics across a range of tumor histologies using a validated, high resolution digital microscopic immunofluorescence assay (IFA) that incorporates β-catenin detection and cellular morphology to delineate carcinoma cells from stromal fibroblasts and that quantitates the individual and co-localized expression of the epithelial marker E-cadherin (E) and the mesenchymal marker vimentin (V) at subcellular resolution (“EMT IFA”). We report the discovery of β-catenin+ cancer cells that co-express E-cadherin and vimentin in core needle biopsies from patients with various advanced metastatic carcinomas wherein these cells are transitioning between strongly epithelial and strongly mesenchymal-like phenotypes. Treatment of carcinoma models with anticancer drugs that differ in their mechanism of action (the tyrosine kinase inhibitor pazopanib in MKN45 gastric carcinoma xenografts, and the combination of tubulin-targeting agent paclitaxel with the BCR-ABL inhibitor nilotinib in MDA-MB-468 breast cancer xenografts) caused changes in the tumor epithelial-mesenchymal character. Moreover, the appearance of partial-EMT or mesenchymal-like carcinoma cells in MDA-MB-468 tumors treated with the paclitaxel-nilotinib combination resulted in upregulation of cancer stem cell (CSC) markers and susceptibility to FAK inhibitor. A metastatic prostate cancer patient treated with the PARP inhibitor talazoparib exhibited similar CSC marker upregulation. Therefore, the phenotypic plasticity conferred on carcinoma cells by EMT allows for rapid adaptation to cytotoxic or molecularly-targeted therapy and could create a form of acquired drug resistance that is transient in nature.
Keywords: Carcinoma, epithelial-mesenchymal transition, cancer stem cells, E-cadherin, vimentin
Introduction
The conversion of carcinoma cells from an epithelial to a mesenchymal-like or partial mesenchymal phenotype (epithelial-mesenchymal transition, or EMT) is of considerable interest due to its potential role in the promotion of tumor invasiveness, metastasis, and resistance to chemotherapy (1). The hallmarks of EMT—loss of intercellular adhesion, actin cytoskeleton remodeling, acquisition of enhanced motility, and resistance to apoptosis and senescence (2)—comprise a pro-metastatic phenotype. Yet, despite extensive preclinical research linking EMT to cancer progression, histopathological evidence of EMT in human cancers remains elusive (3–6), in part because of the difficulty in distinguishing mesenchymal-like carcinoma cells from non-neoplastic cells in the tumor stroma. Unlike the bulk of carcinoma cells in a tumor that exhibits an epithelial phenotype, the invasive front often contains dedifferentiated mesenchymal-like cells with increased motility (7,8). These mesenchymal-like cells have acquired stem-like properties, making them instrumental to cancer progression (9–11).
Because EMT involves a complex interplay amongst the cell microenvironment, transcriptional regulators, and downstream effectors (3,12), an abundance of candidate biomarkers exist that could be conjointly examined to assess the extent of EMT. The Snail protein, a known inducer of EMT, strongly downregulates E-cadherin in epithelial cells and consequently decreases cell-cell adhesion in the early stages of EMT (13). As E-cadherin expression decreases, free β-catenin, which is normally bound to E-cadherin at the plasma membrane, accumulates in the cytoplasm and subsequently translocates to the nucleus, where it regulates the expression of multiple target genes, including vimentin (13–15). Because changes in levels of E-cadherin (E) and vimentin (V) during EMT are inversely related (4), the ratio of their protein (16–18) or mRNA (19) levels has been employed as an indicator of phenotypic status.
We developed a quantitative immunofluorescence imaging method relying on individual or dual expression of these proteins as unequivocal markers of epithelial (E+), mesenchymal-like (V+), and mixed or hybrid epithelial/mesenchymal (E+V+) phenotypes (20). For unbiased and accurate demarcation of carcinoma cells independent of diagnosis, and to restrict the automated quantitation of the E-cadherin and vimentin biomarkers to the neoplastic cell population, we evaluated β-catenin as a generalized tumor marker. This protein plays a fundamental role in molecular reprogramming events associated with EMT (21), and its expression persists during EMT, albeit with changes in subcellular distribution (8,21,22).
Using microscopy with subcellular resolution, we report the discovery of β-catenin+ carcinoma cells that co-express E-cadherin and vimentin in core needle biopsies from patients with various advanced metastatic carcinomas, providing comprehensive histopathological evidence of EMT occurring in human tumors. Furthermore, we have demonstrated that treatment of xenograft models and patients harboring tumors of different histologies with therapeutic agents from multiple mechanistic classes prompts extensive changes in the distribution of epithelial-mesenchymal phenotypes; these phenotypic conversions were in some cases accompanied by the appearance of carcinoma cells co-expressing relevant cancer stem cell (CSC) markers, including CD133, CD44v6, and ALDH1, as well as the embryonic and cancer stem cell transcription factor NANOG (23). Our findings are consistent with a role for phenotypic plasticity in the adaptive response of carcinomas to drug therapy and highlight how monitoring these phenotypic states during treatment could contribute to the development of new therapeutic strategies to eliminate populations of resistant cells.
Materials and Methods
Reagents and Cell Lines.
Detailed descriptions of reagents, cell lines, and drugs used in this study can be found in Supplementary Methods. Isogenic HCT116 cell lines CTNNB1 (+/−) and CTNNB1 (Δ45/-) were obtained from Horizon Discovery; all remaining cell lines were obtained from the Division of Cancer Treatment and Diagnosis (DCTD) Repository, Frederick National Laboratory for Cancer Research (FNLCR). Each lot of cells was authenticated using AmpFLSTR Identifiler (Applied Biosystems) and limited to 20 passages of growth (lots were generally used within 5 passages). Each cell line stock was tested for mycoplasma upon acceptance into the repository and regularly thereafter using the Mycosensor PCR Kit (Agilent), STAT-Myco testing (IDEXX BioAnalytics), or a similar PCR-based assay.
Human Tumor Biopsies.
Pairs of 18-gauge needle core biopsies were collected from metastatic sites up to 15 days prior to drug treatment and again during the course of treatment in patients with advanced, refractory cancers enrolled in clinical trials conducted by the NCI Division of Cancer Treatment and Diagnosis (DCTD) and Center for Cancer Research at the NIH Clinical Center, Bethesda, MD. All patients gave written informed consent for study participation. Study design and conduct complied with all applicable regulations, guidances, and local policies, and the studies were approved by the NCI Institutional Review Board. Biopsy cores were placed individually in pre-chilled cryogenic vials, frozen within 2 min of collection, and stored at ≤ –80°C, until they were thaw-fixed and paraffin blocked together with a biomarker-positive control tissue for sectioning, using a newly developed method for preserving labile biomarkers, including phosphoproteins (24). A summary of the procedures for processing clinical and preclinical samples can be found in Supplementary Fig. S1 and in Standard Operating Procedures (SOP) 340507, 340550, 340546, and 340548 published on the NCI/DCTD website (http://dctd.cancer.gov/ResearchResources/ResearchResources-biomarkers.htm).
Immunohistochemistry.
Formalin-fixed paraffin-embedded tissues (FFPEs) were cut into 5 μm sections, placed on slides, and deparaffinized. Staining was performed in a Bond-max Autostainer (Leica Microsystems). Heat-induced antigen retrieval and immunohistostaining were performed as indicated below (see Supplementary Methods and Table S1). Human tissue sections and xenografts were stained with Hematoxylin and Eosin (H&E), or chromogenic staining was performed using a secondary amplification with diaminobenzidine (DAB) before counterstaining with hematoxylin. Specific staining for human tumor markers was performed using anti-S100 for parotid gland carcinoma, anti-PSA for prostate tumors, and anti-CEA for colorectal tumors.
EMT Immunofluorescence Assay.
Staining was performed in a Bond-max Autostainer. Heat-induced antigen retrieval was performed in citrate at pH 6.0 and 100°C for 10 minutes. Monoclonal antibody-fluorescent dye conjugates of E-cadherin-AF488 (2.0 μg/mL), vimentin-AF647 (4.0 μg/mL), and β-catenin-AF546 (5.0 μg/mL) were used, along with 4’,6-diamidino-2-phenylindole (DAPI; 0.25 μg/mL) staining of nuclei. Image acquisition was performed using an Aperio FL Scanner and Spectrum Analysis software as well as a wide-field fluorescent and confocal microscope (Nikon 90i Andor Camera, NIS Elements Software). Image segmentation and quantitative multiplex analysis were performed using Definiens Software (Tissue Studio Architect).
CSC Immunofluorescence Assay.
The CSC multiplex IFA panel consisting of CD44v6, NANOG, and ALDH1 (panel A) was performed using unconjugated mouse monoclonal antibody to CD44v6 (clone 2F10, R&D Systems); unconjugated rabbit monoclonal antibody to ALDH1 (clone EP1933Y, Abcam), and unconjugated goat polyclonal antibody to NANOG (Cat # AF1997, R&D Systems). CSC multiplex IFA consisting of CD133, CD44v6, and NANOG (panel B) was performed using unconjugated rabbit monoclonal CD133 (47–10) antibody developed by our group (25), mouse monoclonal anti-CD44v6 antibody, and goat polyclonal antibody to human NANOG (AF1997). For both panels, 10 μg/mL of donkey anti-rabbit-AF647, anti-mouse-AF488, and anti-goat-AF555 (all from Life Technologies) were used as secondary antibodies.
Quantitative Analysis of EMT-IFA stained slide sections.
Flanking 5 μm serial sections were stained with H&E, and whole slide scans of the H&E slides from paired biopsies as well as those stained for the EMT-IFA panel along with control tissue were annotated for viable tumor areas by two pathologists. EMT-IFA stained sections containing regions of interest (ROI) identified from the pathologists’ annotated regions of tumor in adjacent H&E stained sections were image-extracted as SVS files (JPEG2000) with the 4 separate fluorescent layers, and imported into Definiens Tissue Studio for analysis using a pre-formulated dax solution file that included detailed tumor-stroma segmentation using the β-catenin layer in combination with cellular morphology, nuclear segmentation using the DAPI layer, and EMT marker thresholding with pre-determined threshold values based on multiple training sets of images taken from every biopsy ROI analyzed, and subsequently applied to the test set consisting of the remaining ROI images. These constraints were applied to generate CSV files containing values for individual EMT marker areas per ROI, areas of marker overlap, and total number of nuclei (or cells) per tumor ROI. The following calculations were then made per ROI, per slide, and per patient sample: log10(V/E) ± SD and mean EMT marker area/cell (μm2 and percent) ± SD, total number of tumor cells (nuclei) per slide, and EMT phenotype proportions normalized to the number of tumor cells per slide. A minimum of 8 ROIs from at least two non-adjacent slide sections of each patient biopsy were used to generate quantitative data, as this sampling strategy is typically sufficient to capture the overall distribution of EMT markers within a biopsy specimen (Supplementary Fig. S2A–B). To avoid sample edge artifacts and to obtain sufficient numbers of tumor cells for analysis, we selected non-adjacent slides from interior sections with high tumor content that were distal to one another. For cases in which two non-adjacent slides yielded drastically different EMT marker distributions, additional slides were used in the quantitative analysis.
Therapeutic Studies in Xenograft Models.
Athymic nude mice (NCr; Animal Production Program, FNLCR) were implanted subcutaneously with MKN45 or SNU5 cells. When the tumors reached approximately 200 mg (study day 1), MKN45- and SNU5-implanted mice were randomized to receive either pazopanib (100 mg/kg/day) or the saline vehicle alone by oral gavage daily for 14 (MKN45 xenografts) or 15 (SNU5 xenografts) days. Median tumor volumes for MKN45 xenografts (n = 12 control; n = 6 pazopanib) were measured with calipers on study days 17, 21, 24, 27, 31, 36, 43, 46, and 56. SNU5 xenograft tumor volumes (n = 12 control; n = 8 pazopanib) were measured on days 12, 20, 22, 27, 30, 36, 42, 48, and 55. For biomarker studies, separate groups of animals (MKN45: n = 12 control, n = 19 pazopanib; SNU5: n = 9 control, n = 9 pazopanib) were treated similarly, and whole xenograft tumors for analysis were collected on treatment day 8. Within one minute of excision, specimens were cut into two to four equal pieces with fine-point scissors or a single-edge scalpel, which were then individually flash-frozen in liquid nitrogen-pre-cooled, O-ring sealed, conical bottom screw-capped 1.5-mL Sarstedt cryovials by touching the specimen to the inside of the tube. Frozen tissues or cell pellets were fixed in 10% neutral buffered formalin (Sigma Aldrich) for 48h and 24h, respectively, and then embedded in paraffin before being sectioned.
For nilotinib-paclitaxel studies, NOD scid gamma (NSG) mice (Animal Production Program, FNLCR) were implanted subcutaneously with MDA-MB-468 cells. When tumors reached approximately 200 mg, MDA-MB-468-implanted mice were randomized to receive no treatment, nilotinib (daily 75 mg/kg orally for 19 days), paclitaxel (once weekly 15 mg/kg intravenously for 3 weeks), a combination of both agents using the same dosage regimens, or saline vehicle. MDA-MB-468 xenograft tumor volumes (n = 15 vehicle, n = 5 no treatment, and n = 5 drug treatment groups) were measured on study days 33, 39, 47, 56, 61, 69, 77, 83, 90, 97, and 103. For biomarker studies, separate groups of animals (n = 6 for each group) were treated similarly, and whole xenograft tumors for analysis were collected on treatment days 1, 8, 15, 19 and 58 and processed as described above. Tumors from untreated mice were also collected.
In a separate experiment to examine CD44, CD24, and ALDH1 expression after nilotinib-paclitaxel therapy and to test the effects of focal adhesion kinase (FAK) inhibitor maintenance therapy on tumor regrowth after nilotinib-paclitaxel treatment, NSG mice bearing MDA-MB-468 tumors were randomized to receive either vehicle or the combination of nilotinib (75 mg/kg daily, orally) and paclitaxel (15 mg/kg once weekly, intravenously, for 3 weeks) for 21 days (study days 33–53); following 21 days of treatment, a subset of vehicle- or nilotinib-paclitaxel–treated animals (n = 6 each) were sacrificed for CSC marker analysis (tumors collected and processed as described above), while the remaining nilotinib-paclitaxel–treated animals were further randomized to receive either vehicle or the FAK inhibitor VS-4718 (100 mg/kg, orally) twice daily from study days 54–132 (n = 16 per group); in addition, a group of animals treated with vehicle for days 33–53 then received vehicle for days 54–132 (n = 16). Tumor volumes were measured on days 33, 36, 40, 43, 47, 50, 54, 57, 62, 65, 69, 72, 77, 82, 86, 91, 96, 100, 104, 107, 111, 114, 117, 121, 126, and 132.
Frederick National Laboratory for Cancer Research is accredited by AAALAC International and follows the Public Health Service Policy for the Care and Use of Laboratory Animals. Animal care was provided in accordance with the procedures outlined in the “Guide for Care and Use of Laboratory Animals” (National Research Council; 1996; National Academy Press; Washington, D.C.).
Statistical analysis.
Statistical analyses were performed using GraphPad Prism X7 software or Microsoft Excel 2010. Differences between drug- and vehicle- treated mice were evaluated using the Mann-Whitney test; significance was defined as *p< 0.05, **p< 0.01, and ***p< 0.001. For the MDA-MB-468 xenograft experiment with nilotinib-paclitaxel treatment followed by FAK inhibitor maintenance therapy with VS-4718 or vehicle, mean log(AUC) [area under the curve] values for each group were compared using a Mann-Whitney test.
Results
Subcellular Co-expression of E-cadherin and Vimentin in Human Tumor Biopsies
We first applied our validated multiplexed EMT-IFA for β-catenin, E-cadherin, and vimentin (Supplementary Methods and Figs. S3A–B, S4A–H, S5, S6A–C; reference specimens and calibrators in Supplementary Fig. S7A–D) to a core biopsy from a metastatic site of a patient with advanced ovarian carcinoma. Pathologists reviewed H&E-stained sections to define ROIs with high concentrations of viable tumor cells (Fig. 1A). In an adjacent section, a tumor segmentation algorithm based on β-catenin signal intensity and cellular morphology (Fig. 1B) was applied to the annotated ROIs, and the expression of DAPI, E-cadherin (E+) and vimentin (V+) was recorded in each pixel. The overall phenotype of each ROI was inferred by taking the log10 of the V+ area divided by the E+ area [log10(V/E)] (Fig. 1C). Log10(V/E) was further validated as an unambiguous phenotypic indicator by comparison to published, empirically-derived gene signatures associated with epithelial or mesenchymal functions and phenotypes (Supplementary Fig. S8) (26).
Figure 1. EMT-IFA quantitation of EMT biomarkers in a human ovarian carcinoma biopsy.

(A) Upper panel: H&E section of a formalin-fixed paraffin-embedded (FFPE) ovarian carcinoma biopsy pre-annotated by an anatomic pathologist to identify tumor (green outline) or non-tumor (cyan outline) areas, including normal or stromal tissues, inflammatory and/or necrotic regions, folds, and freeze artifacts. Lower panel: whole-slide EMT-IFA scan containing the annotated, tumor-containing regions of interest (ROIs) based on H&E, using square boxes of ~3.1×105 μm2 area for quantitative analysis. (B) Definiens analysis of representative ROIs from the EMT-IFA scan. Raw IFA image files of representative ROIs showing the relationship between E-cadherin (E) and vimentin (V) fluorescent layers (column 1) and the β-catenin layer (column 2). The β-catenin layer segments tumor (orange) from stromal tissues (blue) using Tissue Studio software (column 3). Pre-determined intensity thresholds for the EMT markers are applied to each tissue ROI for quantitative reporting of E (green) and V (red) expression (column 4) only within the segmented tumor areas. (C) Log10(V/E) for segmented tumor (left panel) or normal stromal tissues (right panel) generated by Definiens analysis for each ROI. (D) Mean ROI pixel areas for individual (E, green; V, red) or co-localized (yellow) EMT markers (μm2/cell).
The small imaging pixel size of the IFA (0.25 μm2) relative to the dimensions of the cross-sectional areas of tumor (ranging from 75–500 μm2 in parotid, prostate, colon, and ovarian cancers) allowed us to quantify individual areas of V+ and E+ staining as well as areas of co-localized E+V+ staining within single cells. The V+, E+, and E+V+ co-localized areas could also be normalized to the number of evaluated cells enumerated with the DAPI nuclear mask and reported as mean area (μm2) per cell, as seen in Figure 1D wherein E-cadherin and vimentin are co-expressed in approximately 10% of the ovarian carcinoma cellular area.
Co-Occurrence of E+, V+, and E+V+ Cells in Core Biopsies from Advanced Human Carcinomas
Core biopsies from metastatic sites in 11 patients diagnosed with advanced carcinoma contained malignant cells in phenotypic states ranging from almost entirely epithelial to mesenchymal, as defined by E and V expression, respectively (Fig. 2). Tissue from 4 patients with sarcomas served as mesenchymal phenotype controls. Expression patterns of EMT markers varied widely across the individual cases, with some areas displaying a fairly homogenous epithelial (Fig. 2A, prostate 1 case) or mesenchymal (Fig. 2A, fibrosarcoma 2 case) phenotype, some exhibiting sharp boundaries between these phenotypes indicative of tumor heterogeneity (Fig. 2A, colorectal 1 case), and others presenting intermixed or gradual transitions between epithelial and mesenchymal markers (Fig. 2A, esophageal and parotid cases). Quantifying the global phenotype of each biopsy (log10[V/E]; Fig. 2B) further highlighted the diversity of expression patterns, with colorectal and prostate cancers occupying the epithelial end of the spectrum, sarcomas displaying a uniform mesenchymal phenotype, and other carcinomas demonstrating a range of different V:E co-expression levels. Some cases of prostate cancer (prostate 1), esophageal cancer, and parotid gland carcinoma contained substantial areas of co-localized E+V+ staining (20–56% of the tumor area; Fig. 2C). The different phenotypes measured in biopsies from two different prostate cancer patients (Figs. 2B, 2C) demonstrate clinical heterogeneity in carcinomas with the same histology.
Figure 2. EMT-IFA quantitation of EMT biomarkers in core biopsies from patients with various tumor histologies.
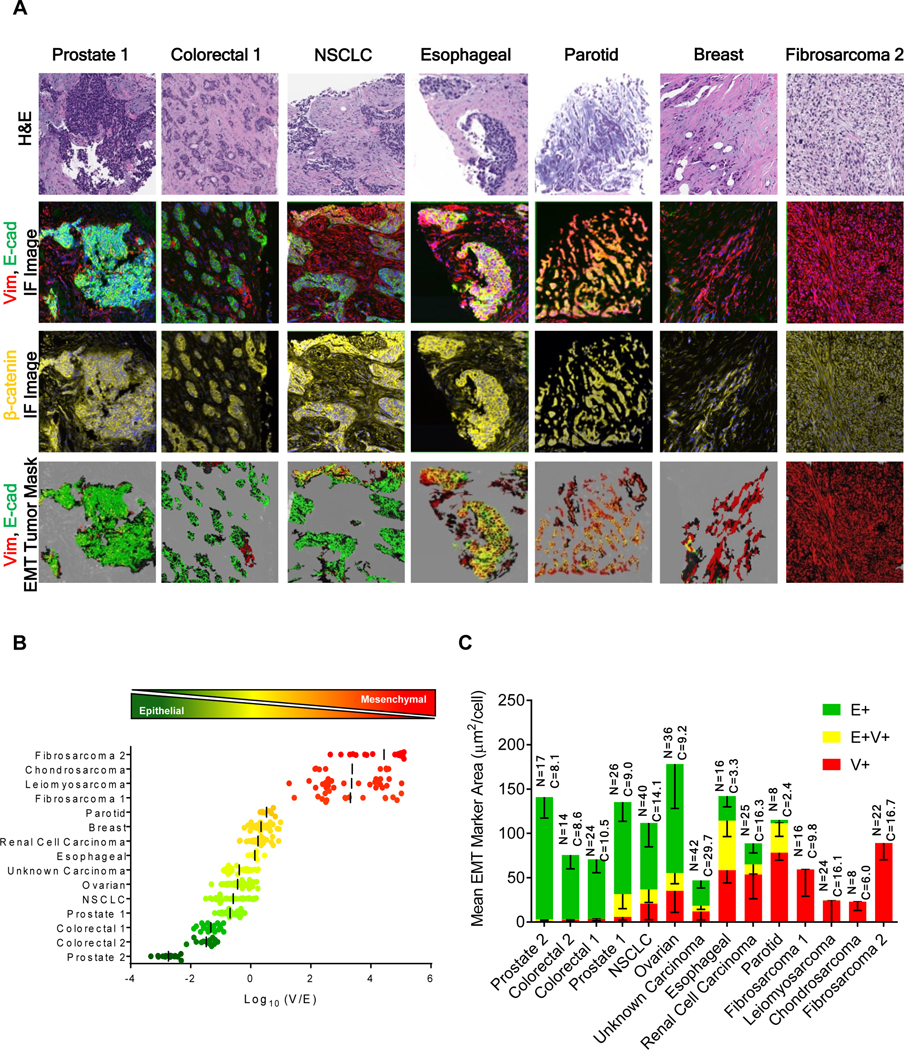
(A) Representative image fields from sections of FFPE core biopsies collected from the metastases of patients with various tumor histologies analyzed with the EMT-IFA. Row 1: H&E-stained sections. Row 2: raw immunofluorescence image files of an adjacent section analyzed with the EMT-IFA showing E-cadherin and vimentin as green and red, respectively, or yellow for co-localized signals. Row 3: β-catenin (yellow) fluorescent layer to segment tumor cells. Row 4: marker masks for E-cadherin (green), vimentin (red), or co-localized (yellow) signals on tumor segmented regions. (B) Scatter plots of log10(V/E) ratios from individual ROIs in each biopsy. Each point represents the log10(V/E) ratio in the segmented tumor regions of an ROI, with the bar representing the mean value for the biopsy. (C) Bar graphs of mean EMT marker pixel areas (μm2/cell) ± SD for each tumor biopsy; E+ in green, V+ in red, and E-cadherin/vimentin co-localized areas in yellow. The total number of analyzed ROIs (N) and the total number of evaluated tumor cells (C x 103) are provided for each biopsy.
Morphological Characteristics of E+V+ Regions
The detection of carcinoma cells co-expressing E-cadherin and vimentin (E+V+) is of interest for understanding the EMT process in malignant cells. EMT-IFA analysis of core biopsies from patients with parotid gland, colorectal, and prostate carcinomas revealed heterogeneous cellular phenotypes within the different specimens; in addition to tumor regions containing cells with distinct epithelial and mesenchymal phenotypes, tumor cells co-expressing markers for both phenotypes were also observed (Fig. 3). The biopsy from a patient with myoepithelial carcinoma of the parotid gland offered an example of a ‘phenotypic gradient’, characterized by an epithelial-mesenchymal spectrum progressing from the top right (E+) to the bottom left (V+) of the image (Fig. 3, top row, third column), with the E+V+ co-expressing cancer cells (yellow) in the center in an apparent transition zone (white arrows). There were clear morphological differences across the epithelial-mesenchymal staining spectrum; the cells with higher E-cadherin staining (yellow arrow) form tubular/myoepithelial nest-like structures, while those with higher vimentin staining (blue arrows) appear dedifferentiated, with a loss of smooth muscle phenotype. The V+ cells expressed the tumor marker S100, but not the myoepithelial marker proteins α-SMA and p63 (Supplementary Fig. S9), confirming that normal myoepithelial cells did not confound the analysis even if they had infiltrated the tumor (27,28).
Figure 3. Patterns of phenotypic expression and morphological characteristics in E+V+ and V+ cells derived from human carcinomas.
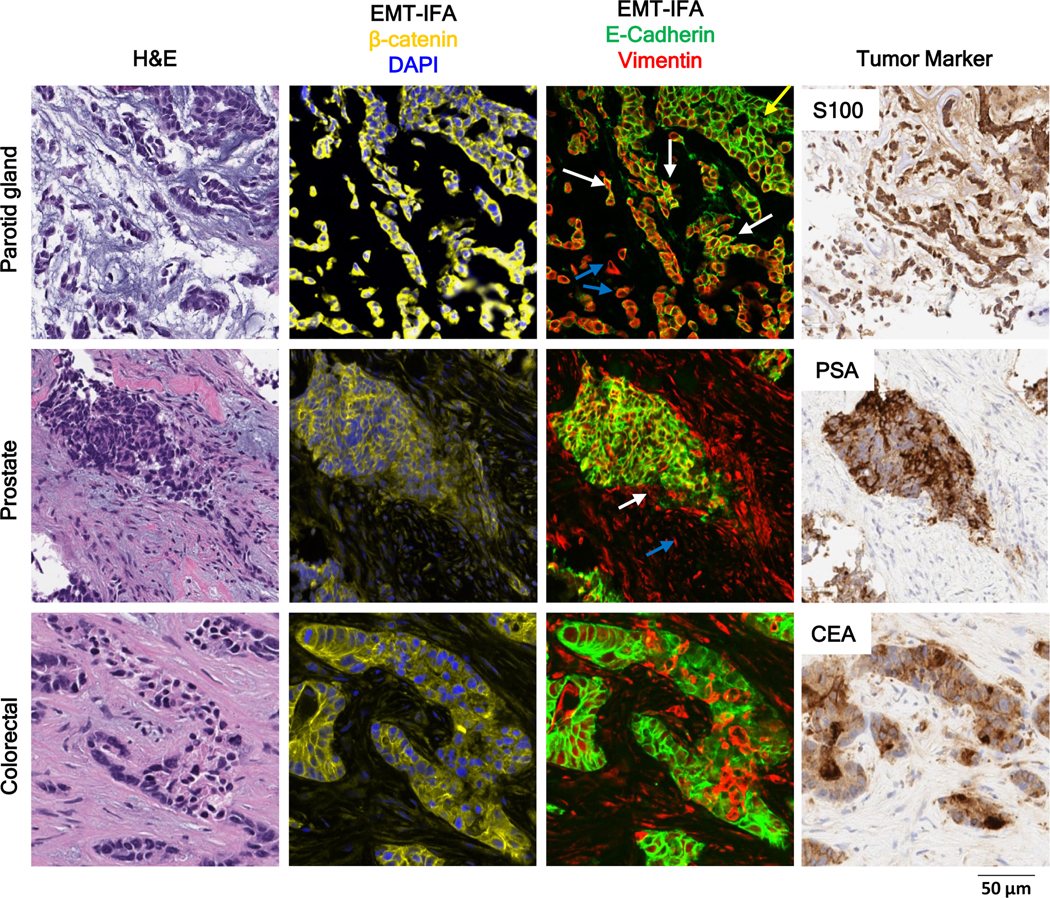
High-resolution images of clinical biopsies from patients with myoepithelial carcinoma of the parotid gland, prostate tumor, or colorectal carcinoma analyzed by EMT-IFA for β-catenin and DAPI to identify carcinoma cells and nuclei, respectively (column 2) and E-cadherin and vimentin (column 3), with the identity of tumor cells confirmed by tumor specific markers S100, PSA, and CEA (column 4), as well as H&E staining (column 1) of nearby sections from the same tumor biopsy. The EMT-IFA image of the patient with parotid gland carcinoma shows transitional cells with co-localized cell expression of membranous E-cadherin and cytoplasmic vimentin (white arrows), while other tumor cells are either only epithelial (E+; yellow arrow) or mesenchymal (V+; blue arrows). Similar transitional cells are found in the tumor sample from the patient with prostate cancer, whereas the patient with colorectal cancer exhibits areas of tumor heterogeneity (E+ or V+ carcinoma cells) but no transitional cells.
The PSA+ prostate cancer specimen (Fig. 3, middle row) contained cells of all three phenotypes within one nodule: primarily epithelial (E+) staining, mixed staining (E+V+), and mesenchymal characteristics (V+) (white arrow, distinct from V+ fibroblasts, which are shown with a blue arrow). A different pattern was observed in the colorectal carcinoma specimen (Fig. 3, bottom row), which displayed small foci of V+ cells within predominantly E+ areas. Similar to the patient with parotid cancer, the tumor samples from the patients with prostate and colorectal cancers were negative for α-SMA and p63, but positive for tumor markers PSA and CEA, respectively. Overall, we find that carcinoma cells exhibiting some expression of vimentin often display morphologies consistent with increased motility (Fig. 3, parotid gland carcinoma case), although some V+ cells appear to retain epithelial cell morphology, thus distinguishing them from the surrounding stroma and suggesting that these carcinoma cells, while no longer expressing E-cadherin, may not have completed the full program of EMT (Fig. 3, colorectal carcinoma case).
Pazopanib-induced Changes to Epithelial-mesenchymal Phenotype in Tumor Xenografts
To investigate the therapeutic implications of EMT, we treated xenograft models of human gastric cancer with the pan-tyrosine kinase inhibitor (TKI) pazopanib, which targets VEGFR1–3, PDGFRα and β, c-KIT, FGFR1–4, and CSF1R (c-FMS) (Fig. 4; Supplementary Fig. S10A–B; Supplementary Table S2) (29). Pazopanib was administered daily for 14 consecutive days to MKN45 gastric adenocarcinoma xenografts and for 15 consecutive days to SNU5 gastric tumor xenografts (Figs. 4A, 4B). Human mitochondrial staining exactly matched β-catenin tumor marker staining, confirming that murine mesenchymal infiltrate did not confound tumor tissue segmentation. Quantitation of EMT in tumor quarters obtained on day 8 indicated a significant (**p<0.01) shift toward a mesenchymal phenotype in pazopanib-treated MKN45 xenografts compared to vehicle-treated controls, manifested as significantly increased E+V+ mixed-phenotype cells and V+ cells with acquired mesenchymal traits; in contrast, the baseline mesenchymal phenotype of SNU5 xenografts was unaffected by treatment (Figs. 4C–F; Supplementary Fig. S10A). Furthermore, the changes in relative epithelial-mesenchymal phenotype of MKN45 xenografts were observed in conjunction with tumor stasis and delayed regrowth after treatment completion (Fig. 4G; Supplementary Fig. S10B, left panel), while pazopanib was less effective in SNU5 xenografts despite an additional day of treatment (Fig. 4H; Supplementary Fig. S10B, right panel).
Figure 4. Evolution of epithelial-mesenchymal phenotypes in pazopanib-treated gastric cancer xenografts.

(A, B) Representative EMT-IFA images of (A) MKN45 and (B) SNU5 gastric xenografts treated with vehicle or pazopanib (100 mg/kg/day). (C) Log10(V/E) measurements for individual tumor ROIs indicate that pazopanib significantly shifted MKN45 tumors towards a less epithelial phenotype compared to vehicle-treated tumors (mean of −0.79 vs. −2.44, respectively; **p= 0.0023). (E) Stacked bar graphs showing the proportion of V+, E+, and E+V+ area (left) normalized to the total number of tumor cells assessed (right) (± SD error bars) demonstrate a significant decrease in E+ tumor cells (***p< 0.001 vs. vehicle), and significant increase in V+ tumor cells (**p= 0.003 vs. vehicle) and in E+V+ tumor cells (**p= 0.007 vs. vehicle) for MKN45 xenografts post-treatment. In contrast, SNU5 xenografts treated with pazopanib did not demonstrate significant changes in (D) log10(V/E) or (F) the proportion of cells with each phenotype (left). The shift toward a mesenchymal phenotype in MKN45 xenografts after treatment is accompanied by tumor stasis (G), while SNU5 xenografts displayed little response to treatment (H). Grey shaded areas in growth curves (± SD error bars) represent the time course of treatment and the arrows show the day tumor biopsies were harvested for analysis. P-values from t-tests comparing tumor volumes for vehicle vs. pazopanib groups (across all time points) are shown.
In our gene expression analyses of pazopanib molecular targets, only FGFR2 and FGFR3 were significantly expressed at a higher level, both in vitro and in vivo, in MKN45 compared to SNU5 at baseline, which may explain the greater pazopanib sensitivity of MKN45 xenograft models (Supplementary Table S2; Supplementary Fig. S11A–B). This greater sensitivity could also be due to the >40-fold higher expression of OATP1B3 (SLCO1B3), which encodes a transmembrane receptor capable of facilitating cellular uptake of pazopanib (30), in MKN45 relative to SNU5 xenograft models (Supplementary Fig. S11C). These molecular features may account for intrinsic resistance of SNU5 to pazopanib, consistent with the mesenchymal-like phenotype of this model.
Further characterization of gene expression differences between vehicle- and pazopanib-treated MKN45 xenograft models provided additional evidence of pazopanib-induced EMT and hinted at early signs of drug resistance emerging in this model. Just one canonical EMT transcription factor was significantly differentially expressed between the two treatment groups: pazopanib induced upregulation of TWIST1 (Supplementary Fig. S11D). This significant pazopanib-induced upregulation of TWIST1 but no other EMT TFs might reflect the transient nature of EMT TF expression. The induction of EMT at day 8, as indicated by the increased expression of TWIST1 and the EMT-IFA data, may signify emergence of resistance to pazopanib, in line with reports linking TWIST1, EMT, FGF signaling, and chemoresistance (31,32). In further support of this hypothesis, among the total of 36 other genes that were significantly differentially expressed between the vehicle- and pazopanib-treated MKN45 groups (Supplementary Table S3), we detected pazopanib-induced upregulation of several genes associated with drug resistance, EMT, migration, invasion, or clinical metastasis, including CYP2C19, TFF3, and PLA2G2A. Pazopanib treatment also suppressed expression of several negative regulators of EMT and/or metastasis/invasion, such as EGLN2, MIR590, LCN2, and TET1 (Supplementary Table S3). These changes, together with the increased expression of TWIST1 and the increase in V:E ratio measured by EMT-IFA, indicate a transition toward a more mesenchymal-like and perhaps pazopanib-resistant phenotype in the MKN45 model following pazopanib treatment.
In contrast to our in vivo results, when MKN45 cells were exposed for up to 6 days to pazopanib concentrations ranging from sub-efficacious (≤ 10 μM) (33) to concentrations that caused modest but observable cell killing (30–100 μM), EMT was not induced (Supplementary Fig. S12), suggesting that potent tumor cell killing and/or tumor microenvironment effects are essential to the therapy-induced perturbation of EMT phenotype observed in vivo. One potential explanation for the reduced pazopanib sensitivity of MKN45 in vitro vs. in vivo may be dampened FGFR signaling in vitro due to the significantly lower expression of FGF-binding protein 1 (FGFBP1)—a protein that potentiates FGF signaling by mediating FGF-2 release from the extracellular matrix (34)—thereby rendering FGFR signaling a less relevant target in vitro (Supplementary Fig. S11E). This may explain the previously observed insensitivity of MKN45 cells to pazopanib [IC50 > 10 μM, (33)], and this lack of pazopanib-induced cell killing and cellular stress may in turn account for the lack of EMT response in vitro.
Pazopanib-induced Changes to Epithelial-mesenchymal Phenotype in Human Tumors
To explore the clinical relevance of these phenotypic changes, we used the EMT-IFA to analyze core tumor biopsies from patients with advanced malignancies enrolled in clinical trial NCT01468922 at the NCI (Fig. 5A). After a pre-treatment tumor biopsy specimen was obtained, these patients received single-agent pazopanib (800 mg per day, oral administration) for 7 days, at which time a second tumor biopsy was obtained prior to the addition of tivantinib to the therapeutic regimen on day 8. Paired biopsies from seven patients were evaluable; EMT analysis revealed that 4 patients (patients 25, 26, 28, and 29) had a significant shift toward a mesenchymal phenotype following 7-day drug treatment, as assessed by the log10(V/E) ratio and relative changes in the total numbers of tumor cells with E+-only, V+-only, and mixed V+E+ phenotypes (Fig. 5B–C). As in the preclinical experiment, patients who started treatment with a more epithelial-like tumor phenotype were more likely to experience a significant shift toward mixed or mesenchymal characteristics after treatment; patient 25 also experienced a significant mesenchymal shift despite starting with a marginally mesenchymal-like phenotype.
Figure 5. Pazopanib treatment leads to changes in expression of EMT biomarkers in patient tumor biopsies.

Core needle biopsies of advanced, refractory solid tumors in seven patients, obtained before and after a 1-week course of treatment with daily pazopanib (800 mg, oral administration), were analyzed by EMT-IFA. (A) Representative image fields from three patients before and after treatment. (B) Quantitation of the E-cadherin and vimentin-expressing areas using the log10(V/E) measure showed that biopsies from 4 of 7 patients displayed significant shifts towards a more mesenchymal phenotype. Statistical significance: **p< 0.01; ***p< 0.001. (C) Stacked bar graphs showing, for each patient, the proportion of V+, E+, and E+V+ area normalized to the total number of tumor cells assessed, yielding an estimate of the total number of tumor cells of each phenotype.
Effective Anticancer Treatment Targets E-cadherin-expressing Tumor Cells
To further explore the relationship between epithelial-mesenchymal phenotype, conferred stem-like character, and treatment efficacy, we used a breast cancer xenograft model known to undergo EMT, MDA-MB-468 (35), to densely sample tumors over a course of treatment and tumor regrowth. Groups of xenograft-bearing mice were treated with the anti-tubulin agent paclitaxel, alone or in combination with a daily dose of the BCR-ABL kinase inhibitor nilotinib, an agent that can potentiate paclitaxel activity (36). Tumor samples taken from vehicle-treated mice demonstrated a predominantly epithelial baseline phenotype for this model (mean log10[V/E] from −0.6 to −0.3; Figs. 6A–6C, Supplementary Fig. S13A–B). Nilotinib treatment alone had no effect on the epithelial-mesenchymal phenotype or tumor growth (Supplementary Fig. S14A–D). By day 8 of treatment with paclitaxel alone or in combination with nilotinib, there was a significant shift toward mesenchymal characteristics, which accelerated in the combination treatment on days 15 and 19 (Figs. 6A–6C, Supplementary Fig. S13) and coincided with a pronounced cell-killing effect (Fig. 6D).
Figure 6. Paclitaxel alone and in combination with nilotinib yields loss of E+ cells and enrichment of residual V+ cells with CSC-like characteristics during treatment, with subsequent repopulation of E+ cells after cessation of therapy.
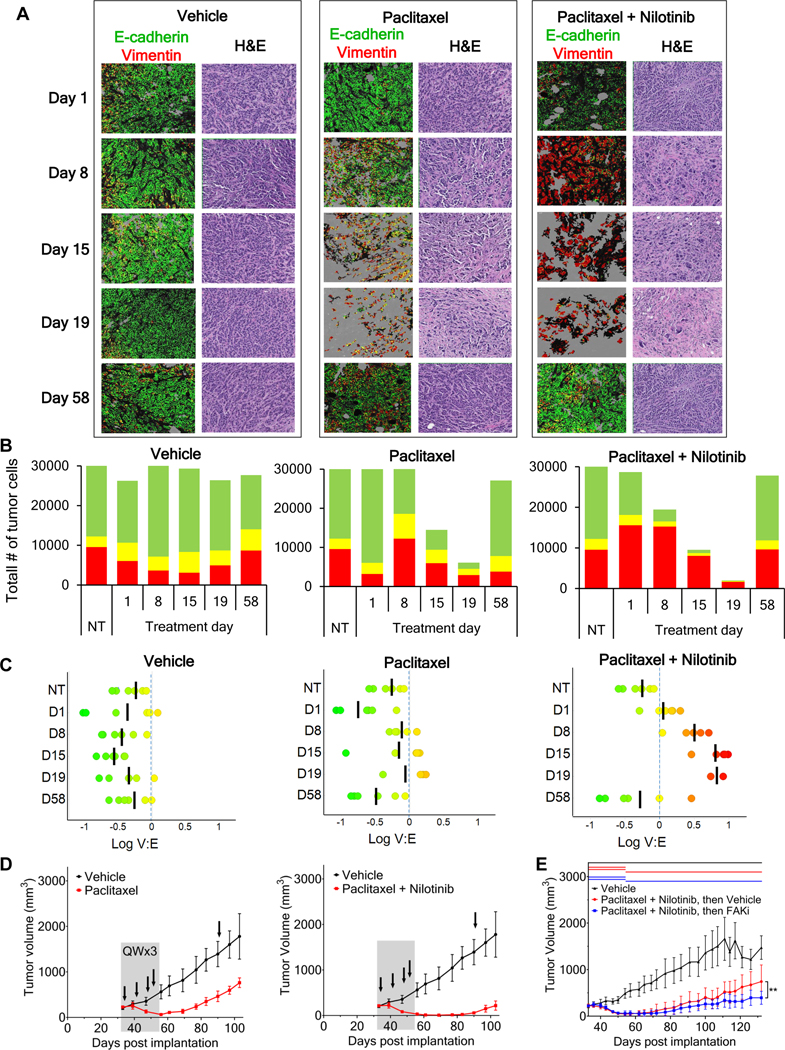
(A) Representative tumor field images of MDA-MB-468 xenografts after the start of treatment with vehicle, paclitaxel, or paclitaxel (15 mg/kg) combined with nilotinib (75 mg/kg), showing adjacent H&E staining and EMT-masked images of E+ (green), V+ (red), and E+V+ (yellow) tumor regions. “Day 1” tumor samples were collected 8 hours after the first treatment. “Day 58” tumor samples were collected 37 days after the cessation of treatment; black arrows in (D) denote the timing of xenograft tumor sampling. High-magnification EMT-IFA images of these specimens are shown in Supplementary Figure S13. (B) Total number of V+, E+, and E+V+ tumor cells observed for each timepoint and treatment group. (C) Scatter plots of log10(V/E) (black bar represents the mean) of individual tumor xenografts from each treatment groups and timepoints. (D) Tumor growth curves (± SD error bars) with treatment duration represented as gray shaded areas. Xenograft tumor sampling is indicated with black arrows. (E) Tumor growth curves (± SD error bars) for MDA-MB-468 xenograft models treated for 21 days with the combination of nilotinib (75 mg/kg daily) and paclitaxel (15 mg/kg once weekly), followed by treatment with either vehicle (red) or the CSC-targeting FAK inhibitor (FAKi) VS-4718 (100 mg/kg twice daily; blue) from study days 54–132 (treatment durations are indicated for each group by colored lines at the top of the graph). An additional group was treated with the appropriate vehicle-only throughout the experiment (black). Asterisks indicate a significant difference in the mean log(area under the curve), from day 54–132, for the animals treated with vehicle vs. FAK inhibitor (**p = 0.005).
The conversion to predominantly mesenchymal-like or partial-EMT phenotypes was accompanied by a progressive increase in the expression of CSC markers CD133, CD44v6, and ALDH1, and the pronounced appearance of cells expressing all 3 markers by day 19 (Supplementary Fig. S15, white arrows). Upon cessation of paclitaxel treatment, tumor regrowth began almost immediately (Fig. 6D, left panel). The combination resulted in more profound tumor regression and delayed regrowth for approximately 30 days after completion of treatment (Fig. 6D, right panel). Interestingly, tumor regrowth after the end of either treatment (sampled at day 58) recapitulated the largely epithelial phenotype observed before treatment (Figs. 6A–C, Supplementary Fig. S13). Further evidence of this EMT phenotypic plasticity in the CSC-like cells remaining after treatment cessation is the widespread presence of classic breast CSC marker expression—namely, CD44+CD24˗ and ALDH1+ (37)—in cells of both V+-only and mixed V+E+ phenotypes after 21 days of combination treatment in a separate experiment using MDA-MB-468 tumors grown in NSG mice (Supplementary Fig. S16A–C). Finally, to further demonstrate the CSC-like character of the tumor cells remaining after cessation of nilotinib-paclitaxel treatment, we compared tumor regrowth during subsequent treatment with either vehicle or VS-4718, a focal adhesion kinase (FAK) inhibitor that selectively targets cancer stem cells (38). After 21 days of nilotinib-paclitaxel administration, subsequent treatment of the tumor-bearing animals with VS-4718 yielded significantly decreased tumor regrowth compared to the vehicle-only group (Fig. 6E), suggesting that CSCs remaining after cessation of nilotinib-paclitaxel treatment promote repopulation of the MDA-MB-468 tumors.
Drug-induced EMT and Cancer Stem Cell Marker Expression
To explore whether drug-induced EMT accompanied by increased expression of CSC markers CD44v6, CD133, and ALDH1 occurs in the clinic, we analyzed core needle biopsies of lymph node metastases from patients with BRCA-mutant prostate or breast cancer before and after treatment with talazoparib, a PARP inhibitor (clinical trial NCT01989546). In the case of the prostate cancer patient, who experienced a partial response to talazoparib, the carcinoma cells in the pre-treatment biopsy displayed a generally epithelial phenotype with a few E+V+ mixed-phenotype cells dispersed among the E+ cells (Fig. 7A–B; Supplementary Fig. S17A), but minimal V+-only expression. By day 8 of treatment, the biopsy specimen for this responding prostate cancer patient contained significantly fewer E+ tumor cells interspersed within a residual population enriched in V+ and E+V+ carcinoma cells (Fig. 7B; Supplementary Fig. S17A).
Figure 7. Changes in epithelial-mesenchymal phenotype and detection of stem-like cells in tumor biopsy specimens from patients treated with talazoparib.

(A) Representative ROIs in serial sections of baseline and post-treatment (cycle 1, day 8) core needle tumor biopsies from a patient with BRCA-mutant prostate cancer (cervical lymph node lesion) who exhibited a partial response (PR) to treatment (left) and a patient with BRCA-mutant breast cancer (supraclavicular lymph node lesion) who had a best response of stable disease (SD; right) were analyzed for EMT and cancer stem cell markers, revealing a drug-induced shift to a more mesenchymal phenotype in residual tumor cells remaining after treatment, associated with the appearance of cancer stem cell markers. Masks of EMT and CSC markers are shown in false colors on multiple co-stained adjacent/nearby slide sections. Top panels: EMT markers E-cadherin (green), vimentin (red), and co-localization of the two (yellow). Middle panels: EMT/CSC marker NANOG (green), CSC marker ALDH1 (red), and co-localization of the two (yellow). Bottom panels: CSC markers CD44v6 (green) and CD133 (red), and co-localization of the two (yellow). The tumor segmented area is color-coded black to more easily visualize the staining of the CSC markers. Scale bars indicate 50 μm. (B) Quantitation of tumor cells and their EMT phenotypes showed a significant decrease in the total number as well as the proportion of E-cadherin–expressing and mixed-phenotype cells in the responding prostate cancer patient after treatment, while no substantial changes in EMT phenotype were observed for the breast cancer patient with a best response of stable disease.
The area of drug-induced EMT was analyzed for NANOG, a key transcription factor implicated in the control and possibly the coordination of both EMT and cancer stemness (39). NANOG+ cells were rare in the pre-treatment biopsy, even in areas where E+V+ carcinoma cells were present (Fig. 7A). However, on day 8 of drug treatment, foci of NANOG+ carcinoma cells were detectable within areas where all 3 phenotypes (E+, V+, and E+V+) coincided (Fig. 7). CSC markers ALDH1, CD44v6, and CD133 were absent at baseline, but by day 8, foci of ALDH1+ carcinoma cells, a few of which co-localized with NANOG expression, were visible in some areas (Fig. 7A). Consistent with the presence of NANOG+ cells in this specimen, CD44v6 expression was also detected, but CD133 was not (Fig. 7A, bottom).
In a biopsy specimen from the breast cancer patient experiencing stable disease following talazoparib treatment, the majority (60%) of tumor cells in the pre-treatment biopsy were V+-only, with approximately 20% each of E+-only and E+V+ mixed-phenotype tumor cells, and no substantial changes in EMT phenotype proportions were detected following talazoparib treatment (Fig. 7; Supplementary Fig. S17B). In addition to this more mesenchymal-like baseline phenotype, the breast cancer patient with stable disease also exhibited substantial baseline expression of NANOG and CD133, while the post-treatment biopsy exhibited NANOG and CD133 expression, as well as small numbers of ALDH1- and CD44v6-positive tumor cells (Fig. 7).
Discussion
Clinical studies have shown that prolonged, repeated exposure to anticancer therapies may select for carcinoma cells with a partial mesenchymal phenotype, coincident with the emergence of drug resistance (40,41). However, this hypothesis has not been decisively tested due to the absence of a definitive, quantitative tool to evaluate EMT in clinical tumor specimens (4). Because transcriptional control of EMT is complex and is regulated by a wide array of transcription factors, including NANOG (3,39,41,42), and microRNAs (16,43), the measurement of downstream protein markers of epithelial and mesenchymal expression programs (E-cadherin and vimentin) was our preferred strategy for direct evaluation of phenotypic state. We validated β-catenin as a general tumor marker preferentially overexpressed in carcinoma cells regardless of tumor histology or disease stage (Supplementary Figs. S4, S5, and S6 and Supplementary Table S4), providing a crucial component for the unbiased quantitative image analysis of EMT markers. The ability to restrict the EMT-IFA analysis to individual carcinoma cells using β-catenin masking in combination with cellular morphology also enables detection of not only intercellular heterogeneity resulting from EMT, but also overlapping expression of EMT markers E and V in β-catenin-positive regions at the pixel (i.e., sub-cellular) level, thus pinpointing cells of mixed phenotype resulting from EMT, or the reverse process, mesenchymal-epithelial transition (MET).
Our findings directly demonstrate that the high prevalence of mixed epithelial/mesenchymal-phenotype cells previously observed in xenograft models, patient circulating tumor cells, and select TKI-resistant lung cancer patient tumors (35,44–48) is also detected in metastatic patient tumors across various histologies, as has been suggested by prior gene expression analyses (49,50), but our results also reveal unexpected patterns of mixed-phenotype cells within tumor specimens. Some patient tumor biopsies displayed large areas of epithelial/mesenchymal marker co-expression throughout the tumor tissue rather than being localized to the invasive front of the tumor (Fig. 3) as has been previously documented (51,52). The high proportion of cells with mixed epithelial/mesenchymal phenotype (Fig. 2) suggests that the occurrence of tumor cells simultaneously expressing characteristics of epithelial and mesenchymal states is more widespread in advanced carcinomas than has been appreciated (20,44). Unfortunately, it cannot be determined whether these cells present a stable hybrid phenotype, or whether they continually undergo dynamic interconversions (EMT and MET) between epithelial and mesenchymal phenotypes.
Our observation that the TKI pazopanib profoundly perturbs the epithelial-mesenchymal phenotypic character of xenografted (Fig. 4) and metastatic human carcinomas (Fig. 5) is evidence that the plasticity conferred on carcinoma cells by EMT allows for rapid adaptive response to therapy. Although the MKN45 and SNU5 xenograft models used in the first set of experiments had the same tissue of origin and diagnosis (33), MKN45 xenografts were strongly epithelial at baseline, while the SNU5 model expressed the mesenchymal marker vimentin. The epithelial MKN45 xenografts underwent a phenotypic shift, with the emergence of E+V+ and V+ areas after 2 weeks of treatment (Fig. 4A, C, E), phenotypic changes coinciding with therapeutic efficacy (Fig. 4G). In sharp contrast, the SNU5 model demonstrated neither efficacy nor phenotypic changes (Fig. 4B, D, F, H). Our gene expression analysis revealed that pazopanib target genes FGFR2 and FGFR3 are highly expressed in MKN45 but not SNU5, both in vivo and in vitro (Supplementary Table S2 and Fig. S11), which can account for the differential pazopanib activity between the 2 xenograft models. Grygielewicz et al. described the acquisition of resistance to anti-FGFR treatment in 3 gastric cancer cell lines following long-term (1-month) drug exposure, and the concurrent loss of FGFR2 expression and acquisition of EMT characteristics (53). Though we did not detect significant loss of FGFR2 mRNA expression at day 8 of pazopanib treatment in MKN45 xenograft models (Supplementary Fig. S11), it is possible that FGFR2 activity could be suppressed at the post-transcriptional level or that FGFR2 expression may be downregulated at a later time point during the development of pazopanib resistance. Although clinical response to a 1-week course of pazopanib (a similar timeframe to the preclinical experiments) could not be assessed in our patients, the treatment was associated with significant mesenchymal shifts in 4/7 cases (Fig. 5), further supporting the postulate that EMT may occur as a mechanism of response to pazopanib treatment in the clinic.
To probe the EMT response to drug therapy in a spontaneous EMT model (35), we performed a detailed time course study in the EGFR-amplified (54), triple-negative breast cancer model MDA-MB-468. In addition to the depopulation of E+ cells, treatment with paclitaxel or the nilotinib-paclitaxel combination led to an increase in vimentin-expressing cells due to stress-induced EMT and/or the expansion of drug-resistant V+ cells (Fig. 6). However, 5 weeks after the end of treatment (study day 58), and despite the extent of tumor response to treatment across the different arms of the study, the xenografts treated with either single-agent paclitaxel or the nilotinib-paclitaxel combination demonstrated tumor regrowth that recapitulated the tumor’s original epithelial/mesenchymal phenotype (Figs. 6A–6C). For the combination treatment, where essentially no tumor cells of epithelial phenotype remained after 19 days of treatment, these results imply enhanced survival of carcinoma cells with partial mesenchymal properties followed by a reverse transition—or MET—after the termination of treatment during tumor repopulation; such MET is reminiscent of findings from a prior in vivo study (in a spontaneous breast-to-lung metastasis transgenic mouse model that enables EMT lineage tracing) demonstrating that injection of exclusively mesenchymal-like tumor cells gave rise to metastases with a largely epithelial-like phenotype in the absence of chemotherapy (55). The increased expression (and co-localization) of CSC markers CD133, CD44v6, and ALDH1 associated with the observed increase in V+ cells in mice treated with the nilotinib-paclitaxel combination is consistent with this hypothesis (Supplementary Fig. S15), as is the efficacy of targeting CSCs with the FAK inhibitor VS-4718 to suppress tumor regrowth following nilotinib-paclitaxel treatment (Fig. 6E). Further indication of epithelial-mesenchymal phenotypic plasticity in these post-treatment CSC-like cells is the widespread presence of both CD44+/CD24˗ and ALDH1 CSC marker staining in both V+-only and mixed V+E+ cells after combination treatment (Supplementary Fig. S16). Although this seems contradictory to previous findings of CSCs predominantly in the mixed epithelial/mesenchymal phenotypic state (56,57), the V+-only cells we observe in these specimens likely represent a strongly mesenchymal-like state within the epithelial-mesenchymal spectrum rather than a fully mesenchymal phenotype, as the latter is thought to occur very rarely in carcinomas (58). The post-treatment return to the baseline epithelial-mesenchymal distribution is reminiscent of the re-sensitization to targeted and cytotoxic treatments observed in certain melanoma (59,60) and triple-negative breast cancer (61) models after drug holidays. The ability to detect these phenotypic responses will support further detailed dissection of the molecular pathways involved in EMT and their involvement in acquired, and likely transient, drug resistance.
Similarly, our observation that CSCs also arise in areas of residual tumor that are undergoing treatment-induced changes in epithelial-mesenchymal phenotype in matched pre- and post-treatment human tumor biopsies (Fig. 7) implicates this plasticity in the natural course of treatment-induced tumor cell death, resistance, and re-growth. The increase in NANOG+ carcinoma cells in the biopsy specimen from the responding prostate cancer patient indicated that the timing of the on-treatment biopsy was appropriate for analyzing CSC markers, most notably CD44v6, a known promoter of NANOG activation, thus providing a direct molecular link between EMT and cancer cell stemness (62). Finding CSC markers within a population of carcinoma-derived, mixed epithelial/mesenchymal-phenotype cells could signal an adverse prognosis, combining the poorer outcomes of increased tumor cell motility and stemness; this hypothesis is further supported by the poorer outcome (stable disease) of the talazoparib-treated breast cancer patient with high baseline expression of NANOG and CD133, including within areas rich in mesenchymal- and mixed epithelial/mesenchymal-phenotype cells. A similar subpopulation of NANOG+ cells postulated to be CSCs has been described in serous ovarian carcinoma (42). While the most desirable image analysis would reveal EMT and CSC marker co-expression, limitations in the number of image acquisition channels (wavelengths) that can be simultaneously assessed and in our imaging algorithm prevented us from quantifying co-localized markers at the individual cell level. Further characterization of carcinoma cell phenotypes with EMT and CSC markers will be needed to uncover which phenotype(s) might confer increased invasiveness and metastatic potential, as well as transient drug resistance, for the development of improved therapeutic strategies.
The subset of tumors observed to contain high concentrations of mixed-phenotype carcinoma-derived cells and the observed cases of targeted therapy-induced shifts towards more mesenchymal phenotypes have profound implications. If cancer drugs drive tumor cells toward a more intermediate or mesenchymal phenotype and/or select for tumor cells that undergo EMT, new approaches, such as longitudinal monitoring of EMT and simultaneous/sequential targeting of epithelial, mixed-phenotype, and mesenchymal-like carcinoma-derived tumor cells, may become important for clinical care. Integrating an EMT diagnostic component into clinical trials could address the emergence of drug resistance and its timing by monitoring the tumor for cells that may be responsible for tumor survival; such monitoring is warranted not only by our results demonstrating shifts toward mesenchymal-like phenotypes in tumor cells remaining after drug treatment, but also by other studies showing that tumor cell EMT is associated with drug resistance (46–48,55,63,64). Expanding the multiplex capability of the EMT-IFA will also create a combinatorial method to study the relationship between stem cells and EMT or the transcription factors (notably the SNAIL, ZEB, and TWIST families) linked to EMT initiation and progression, tumor metastasis, and patient outcome (4,44). It is important to note that such drug-induced EMT, and the associated appearance of carcinoma cells expressing stem cell biomarkers, will not be evident in pretreatment tumor specimens, such as diagnostic biopsies or baseline biopsies from clinical trials, but only with tumor sampling during treatment. Furthermore, an EMT response to therapy that promotes the survival of a small number of carcinoma cells capable of re-populating the tumor’s original phenotypic composition may be the underlying explanation for clinical reports that some carcinoma patients respond to re-treatment with the same agents upon progression (i.e., drug re-challenge) (65). Thus, the longitudinal assessment of EMT in the clinic could represent a powerful and potentially transformative strategy for the practice of precision oncology.
Supplementary Material
Statement of Significance.
Despite the role of EMT in metastasis and drug resistance, no standardized assessment of EMT phenotypic heterogeneity in human carcinomas exists; the EMT-IFA allows for clinical monitoring of tumor adaptation to therapy.
Acknowledgments
We thank the following scientific staff from Leidos Biomedical Research, Inc.: Brad Gouker, Lindsay Dutko, and Donna Butcher for expert histotechnology support; Karun Mutreja for microscopy; Facundo Cutuli for in vitro experimental support; Brandon Miller for Spotfire analysis; and John Carter for small animal tumor modeling. We also thank Gloryvee Rivera, Nikitha Nair, Amanda Peach, Brandie Fullmer, and Rajesh Patidar (Molecular Characterization and Clinical Assay Development Laboratory, FNLCR) for RNA sequencing experimental support and Thomas Pfister (Leidos Biomedical Research, Inc.) and Naoko Takebe (NCI) for excellent scientific discussions.
Financial support: This project has been funded in whole or in part with federal funds from the National Cancer Institute, National Institutes of Health, under Contract No. HHSN261200800001E. The content of this publication does not necessarily reflect the views or policies of the Department of Health and Human Services, nor does mention of trade names, commercial products, or organizations imply endorsement by the U.S. Government.
Footnotes
Disclosure of Potential Conflicts of Interest: The authors declare no potential conflicts of interest.
References
- 1.Chaffer CL, San Juan BP, Lim E, Weinberg RA. EMT, cell plasticity and metastasis. Cancer Metastasis Rev 2016;35:645–54. [DOI] [PubMed] [Google Scholar]
- 2.Lamouille S, Xu J, Derynck R. Molecular mechanisms of epithelial-mesenchymal transition. Nat Rev Mol Cell Biol 2014;15:178–96. [DOI] [PMC free article] [PubMed] [Google Scholar]
- 3.De Craene B, Berx G. Regulatory networks defining EMT during cancer initiation and progression. Nat Rev Cancer 2013;13:97–110. [DOI] [PubMed] [Google Scholar]
- 4.Steinestel K, Eder S, Schrader AJ, Steinestel J. Clinical significance of epithelial-mesenchymal transition. Clin Transl Med 2014;3:17. [DOI] [PMC free article] [PubMed] [Google Scholar]
- 5.Bastid J. EMT in carcinoma progression and dissemination: facts, unanswered questions, and clinical considerations. Cancer Metastasis Rev 2012;31:277–83. [DOI] [PubMed] [Google Scholar]
- 6.Chui MH. Insights into cancer metastasis from a clinicopathologic perspective: Epithelial-mesenchymal transition is not a necessary step. Int J Cancer 2013;132:1487–95. [DOI] [PubMed] [Google Scholar]
- 7.Christofori G. New signals from the invasive front. Nature 2006;441:444–50. [DOI] [PubMed] [Google Scholar]
- 8.Brabletz T, Jung A, Reu S, Porzner M, Hlubek F, Kunz-Schughart LA, et al. Variable beta-catenin expression in colorectal cancers indicates tumor progression driven by the tumor environment. Proc Natl Acad Sci U S A 2001;98:10356–61. [DOI] [PMC free article] [PubMed] [Google Scholar]
- 9.Mani SA, Guo W, Liao MJ, Eaton EN, Ayyanan A, Zhou AY, et al. The epithelial-mesenchymal transition generates cells with properties of stem cells. Cell 2008;133:704–15. [DOI] [PMC free article] [PubMed] [Google Scholar]
- 10.Morel AP, Lievre M, Thomas C, Hinkal G, Ansieau S, Puisieux A. Generation of breast cancer stem cells through epithelial-mesenchymal transition. PLoS One 2008;3:e2888. [DOI] [PMC free article] [PubMed] [Google Scholar]
- 11.Scheel C, Weinberg RA. Cancer stem cells and epithelial-mesenchymal transition: concepts and molecular links. Semin Cancer Biol 2012;22:396–403. [DOI] [PMC free article] [PubMed] [Google Scholar]
- 12.Zheng H, Kang Y. Multilayer control of the EMT master regulators. Oncogene 2014;33:1755–63. [DOI] [PubMed] [Google Scholar]
- 13.Wang Y, Shi J, Chai K, Ying X, Zhou BP. The role of Snail in EMT and tumorigenesis. Curr Cancer Drug Targets 2013;13:963–72. [DOI] [PMC free article] [PubMed] [Google Scholar]
- 14.Valenta T, Hausmann G, Basler K. The many faces and functions of beta-catenin. EMBO J 2012;31:2714–36. [DOI] [PMC free article] [PubMed] [Google Scholar]
- 15.Gilles C, Polette M, Mestdagt M, Nawrocki-Raby B, Ruggeri P, Birembaut P, et al. Transactivation of vimentin by beta-catenin in human breast cancer cells. Cancer Res 2003;63:2658–64. [PubMed] [Google Scholar]
- 16.Park SM, Gaur AB, Lengyel E, Peter ME. The miR-200 family determines the epithelial phenotype of cancer cells by targeting the E-cadherin repressors ZEB1 and ZEB2. Genes Dev 2008;22:894–907. [DOI] [PMC free article] [PubMed] [Google Scholar]
- 17.Edmond V, Dufour F, Poiroux G, Shoji K, Malleter M, Fouque A, et al. Downregulation of ceramide synthase-6 during epithelial-to-mesenchymal transition reduces plasma membrane fluidity and cancer cell motility. Oncogene 2015;34:996–1005. [DOI] [PubMed] [Google Scholar]
- 18.Yamada S, Fuchs BC, Fujii T, Shimoyama Y, Sugimoto H, Nomoto S, et al. Epithelial-to-mesenchymal transition predicts prognosis of pancreatic cancer. Surgery 2013;154:946–54. [DOI] [PubMed] [Google Scholar]
- 19.Murai T, Yamada S, Fuchs BC, Fujii T, Nakayama G, Sugimoto H, et al. Epithelial-to-mesenchymal transition predicts prognosis in clinical gastric cancer. J Surg Oncol 2014;109:684–9. [DOI] [PubMed] [Google Scholar]
- 20.Jolly MK, Boareto M, Huang B, Jia D, Lu M, Ben-Jacob E, et al. Implications of the hybrid epithelial/mesenchymal phenotype in metastasis. Front Oncol 2015;5:155. [DOI] [PMC free article] [PubMed] [Google Scholar]
- 21.Sanchez-Tillo E, de Barrios O, Siles L, Cuatrecasas M, Castells A, Postigo A. Beta-catenin/TCF4 complex induces the epithelial-to-mesenchymal transition (EMT)-activator ZEB1 to regulate tumor invasiveness. Proc Natl Acad Sci U S A 2011;108:19204–9. [DOI] [PMC free article] [PubMed] [Google Scholar]
- 22.Brabletz T, Jung A, Hermann K, Gunther K, Hohenberger W, Kirchner T. Nuclear overexpression of the oncoprotein beta-catenin in colorectal cancer is localized predominantly at the invasion front. Pathol Res Pract 1998;194:701–4. [DOI] [PubMed] [Google Scholar]
- 23.Iv Santaliz-Ruiz LE, Xie X, Old M, Teknos TN, Pan Q. Emerging role of Nanog in tumorigenesis and cancer stem cells. Int J Cancer 2014;135:2741–8. [DOI] [PMC free article] [PubMed] [Google Scholar]
- 24.Srivastava AK, Hollingshead MG, Weiner J, Navas T, Evrard YA, Khin SA, et al. Pharmacodynamic response of the MET/HGF receptor to small-molecule tyrosine kinase inhibitors examined with validated, fit-for-clinic immunoassays. Clin Cancer Res 2016;22:3683–94. [DOI] [PMC free article] [PubMed] [Google Scholar]
- 25.Navas T, Pfister TD, Colantonio S, Aziz A, Dieckman L, Saul RG, et al. Novel antibody reagents for characterization of drug- and tumor microenvironment-induced changes in epithelial-mesenchymal transition and cancer stem cells. PLoS One 2018;13:e0199361. [DOI] [PMC free article] [PubMed] [Google Scholar]
- 26.Kohn KW, Zeeberg BM, Reinhold WC, Pommier Y. Gene expression correlations in human cancer cell lines define molecular interaction networks for epithelial phenotype. PLoS One 2014;9:e99269. [DOI] [PMC free article] [PubMed] [Google Scholar]
- 27.Hsiao YH, Tsai HD, Chou MC, Man YG. The myoepithelial cell layer may serve as a potential trigger factor for different outcomes of stage-matched invasive lobular and ductal breast cancers. Int J Biol Sci 2011;7:147–53. [DOI] [PMC free article] [PubMed] [Google Scholar]
- 28.Dardick I, Stratis M, Parks WR, DeNardi FG, Kahn HJ. S-100 protein antibodies do not label normal salivary gland myoepithelium. Histogenetic implications for salivary gland tumors. Am J Pathol 1991;138:619–28. [PMC free article] [PubMed] [Google Scholar]
- 29.Kumar R, Knick VB, Rudolph SK, Johnson JH, Crosby RM, Crouthamel MC, et al. Pharmacokinetic-pharmacodynamic correlation from mouse to human with pazopanib, a multikinase angiogenesis inhibitor with potent antitumor and antiangiogenic activity. Mol Cancer Ther 2007;6:2012–21. [DOI] [PubMed] [Google Scholar]
- 30.Zimmerman EI, Hu S, Roberts JL, Gibson AA, Orwick SJ, Li L, et al. Contribution of OATP1B1 and OATP1B3 to the disposition of sorafenib and sorafenib-glucuronide. Clin Cancer Res 2013;19:1458–66. [DOI] [PMC free article] [PubMed] [Google Scholar]
- 31.Zhu DY, Guo QS, Li YL, Cui B, Guo J, Liu JX, et al. Twist1 correlates with poor differentiation and progression in gastric adenocarcinoma via elevation of FGFR2 expression. World J Gastroenterol 2014;20:18306–15. [DOI] [PMC free article] [PubMed] [Google Scholar]
- 32.Brown WS, Akhand SS, Wendt MK. FGFR signaling maintains a drug persistent cell population following epithelial-mesenchymal transition. Oncotarget 2016;7:83424–36. [DOI] [PMC free article] [PubMed] [Google Scholar]
- 33.Kim ST, Jang HL, Lee SJ, Lee J, Choi YL, Kim KM, et al. Pazopanib, a novel multitargeted kinase inhibitor, shows potent in vitro antitumor activity in gastric cancer cell lines with FGFR2 amplification. Mol Cancer Ther 2014;13:2527–36. [DOI] [PubMed] [Google Scholar]
- 34.Aigner A, Butscheid M, Kunkel P, Krause E, Lamszus K, Wellstein A, et al. An FGF-binding protein (FGF-BP) exerts its biological function by parallel paracrine stimulation of tumor cell and endothelial cell proliferation through FGF-2 release. Int J Cancer 2001;92:510–7. [DOI] [PubMed] [Google Scholar]
- 35.Bonnomet A, Syne L, Brysse A, Feyereisen E, Thompson EW, Noel A, et al. A dynamic in vivo model of epithelial-to-mesenchymal transitions in circulating tumor cells and metastases of breast cancer. Oncogene 2012;31:3741–53. [DOI] [PubMed] [Google Scholar]
- 36.Holbeck SL, Camalier R, Crowell JA, Govindharajulu JP, Hollingshead M, Anderson LW, et al. The National Cancer Institute ALMANAC: a comprehensive screening resource for the detection of anticancer drug pairs with enhanced therapeutic activity. Cancer Res 2017;77:3564–76. [DOI] [PMC free article] [PubMed] [Google Scholar]
- 37.Li W, Ma H, Zhang J, Zhu L, Wang C, Yang Y. Unraveling the roles of CD44/CD24 and ALDH1 as cancer stem cell markers in tumorigenesis and metastasis. Sci Rep 2017;7:13856. [DOI] [PMC free article] [PubMed] [Google Scholar]
- 38.Kolev VN, Tam WF, Wright QG, McDermott SP, Vidal CM, Shapiro IM, et al. Inhibition of FAK kinase activity preferentially targets cancer stem cells. Oncotarget 2017;8:51733–47. [DOI] [PMC free article] [PubMed] [Google Scholar]
- 39.Yao C, Su L, Shan J, Zhu C, Liu L, Liu C, et al. IGF/STAT3/NANOG/Slug signaling axis simultaneously controls epithelial-mesenchymal transition and stemness maintenance in colorectal cancer. Stem Cells 2016;34:820–31. [DOI] [PubMed] [Google Scholar]
- 40.Mego M, Mani SA, Lee BN, Li C, Evans KW, Cohen EN, et al. Expression of epithelial-mesenchymal transition-inducing transcription factors in primary breast cancer: The effect of neoadjuvant therapy. Int J Cancer 2012;130:808–16. [DOI] [PMC free article] [PubMed] [Google Scholar]
- 41.Puisieux A, Brabletz T, Caramel J. Oncogenic roles of EMT-inducing transcription factors. Nat Cell Biol 2014;16:488–94. [DOI] [PubMed] [Google Scholar]
- 42.Suster NK, Smrkolj S, Virant-Klun I. Putative stem cells and epithelial-mesenchymal transition revealed in sections of ovarian tumor in patients with serous ovarian carcinoma using immunohistochemistry for vimentin and pluripotency-related markers. J Ovarian Res 2017;10:11. [DOI] [PMC free article] [PubMed] [Google Scholar]
- 43.Liu T, Nie F, Yang X, Wang X, Yuan Y, Lv Z, et al. MicroRNA-590 is an EMT-suppressive microRNA involved in the TGFbeta signaling pathway. Mol Med Rep 2015;12:7403–11. [DOI] [PMC free article] [PubMed] [Google Scholar]
- 44.Yu M, Bardia A, Wittner BS, Stott SL, Smas ME, Ting DT, et al. Circulating breast tumor cells exhibit dynamic changes in epithelial and mesenchymal composition. Science 2013;339:580–4. [DOI] [PMC free article] [PubMed] [Google Scholar]
- 45.Pastushenko I, Brisebarre A, Sifrim A, Fioramonti M, Revenco T, Boumahdi S, et al. Identification of the tumour transition states occurring during EMT. Nature 2018;556:463–68. [DOI] [PubMed] [Google Scholar]
- 46.Liu X, Li J, Cadilha BL, Markota A, Voigt C, Huang Z, et al. Epithelial-type systemic breast carcinoma cells with a restricted mesenchymal transition are a major source of metastasis. Sci Adv 2019;5:eaav4275. [DOI] [PMC free article] [PubMed] [Google Scholar]
- 47.Gainor JF, Dardaei L, Yoda S, Friboulet L, Leshchiner I, Katayama R, et al. Molecular mechanisms of resistance to first- and second-generation ALK inhibitors in ALK-rearranged lung cancer. Cancer Discov 2016;6:1118–33. [DOI] [PMC free article] [PubMed] [Google Scholar]
- 48.Sequist LV, Waltman BA, Dias-Santagata D, Digumarthy S, Turke AB, Fidias P, et al. Genotypic and histological evolution of lung cancers acquiring resistance to EGFR inhibitors. Sci Transl Med 2011;3:75ra26. [DOI] [PMC free article] [PubMed] [Google Scholar]
- 49.Grosse-Wilde A, Fouquier d’Herouel A, McIntosh E, Ertaylan G, Skupin A, Kuestner RE, et al. Stemness of the hybrid epithelial/mesenchymal state in breast cancer and its association with poor survival. PLoS One 2015;10:e0126522. [DOI] [PMC free article] [PubMed] [Google Scholar]
- 50.George JT, Jolly MK, Xu S, Somarelli JA, Levine H. Survival outcomes in cancer patients predicted by a partial EMT gene expression scoring metric. Cancer Res 2017;77:6415–28. [DOI] [PMC free article] [PubMed] [Google Scholar]
- 51.Fendrich V, Waldmann J, Feldmann G, Schlosser K, Konig A, Ramaswamy A, et al. Unique expression pattern of the EMT markers Snail, Twist and E-cadherin in benign and malignant parathyroid neoplasia. Eur J Endocrinol 2009;160:695–703. [DOI] [PubMed] [Google Scholar]
- 52.Puram SV, Tirosh I, Parikh AS, Patel AP, Yizhak K, Gillespie S, et al. Single-cell transcriptomic analysis of primary and metastatic tumor ecosystems in head and neck cancer. Cell 2017;171:1611–24. [DOI] [PMC free article] [PubMed] [Google Scholar]
- 53.Grygielewicz P, Dymek B, Bujak A, Gunerka P, Stanczak A, Lamparska-Przybysz M, et al. Epithelial-mesenchymal transition confers resistance to selective FGFR inhibitors in SNU-16 gastric cancer cells. Gastric Cancer 2016;19:53–62. [DOI] [PMC free article] [PubMed] [Google Scholar]
- 54.Chavez KJ, Garimella SV, Lipkowitz S. Triple negative breast cancer cell lines: one tool in the search for better treatment of triple negative breast cancer. Breast Dis 2010;32:35–48. [DOI] [PMC free article] [PubMed] [Google Scholar]
- 55.Fischer KR, Durrans A, Lee S, Sheng J, Li F, Wong ST, et al. Epithelial-to-mesenchymal transition is not required for lung metastasis but contributes to chemoresistance. Nature 2015;527:472–6. [DOI] [PMC free article] [PubMed] [Google Scholar]
- 56.Jolly MK, Huang B, Lu M, Mani SA, Levine H, Ben-Jacob E. Towards elucidating the connection between epithelial-mesenchymal transitions and stemness. J R Soc Interface 2014;11:20140962. [DOI] [PMC free article] [PubMed] [Google Scholar]
- 57.Bierie B, Pierce SE, Kroeger C, Stover DG, Pattabiraman DR, Thiru P, et al. Integrin-beta4 identifies cancer stem cell-enriched populations of partially mesenchymal carcinoma cells. Proc Natl Acad Sci U S A 2017;114:E2337–46. [DOI] [PMC free article] [PubMed] [Google Scholar]
- 58.Dongre A, Weinberg RA. New insights into the mechanisms of epithelial-mesenchymal transition and implications for cancer. Nat Rev Mol Cell Biol 2019;20:69–84. [DOI] [PubMed] [Google Scholar]
- 59.Das Thakur M, Salangsang F, Landman AS, Sellers WR, Pryer NK, Levesque MP, et al. Modelling vemurafenib resistance in melanoma reveals a strategy to forestall drug resistance. Nature 2013;494:251–55. [DOI] [PMC free article] [PubMed] [Google Scholar]
- 60.Sun C, Wang L, Huang S, Heynen GJJE, Prahallad A, Robert C, et al. Reversible and adaptive resistance to BRAF(V600E) inhibition in melanoma. Nature 2014;508:118–22. [DOI] [PubMed] [Google Scholar]
- 61.Gomez-Miragaya J, Palafox M, Pare L, Yoldi G, Ferrer I, Vila S, et al. Resistance to taxanes in triple-negative breast cancer associates with the dynamics of a CD49f+ tumor-initiating population. Stem Cell Reports 2017;8:1392–407. [DOI] [PMC free article] [PubMed] [Google Scholar]
- 62.Bourguignon LY, Peyrollier K, Xia W, Gilad E. Hyaluronan-CD44 interaction activates stem cell marker Nanog, Stat-3-mediated MDR1 gene expression, and ankyrin-regulated multidrug efflux in breast and ovarian tumor cells. J Biol Chem 2008;283:17635–51. [DOI] [PMC free article] [PubMed] [Google Scholar]
- 63.Zheng X, Carstens JL, Kim J, Scheible M, Kaye J, Sugimoto H, et al. Epithelial-to-mesenchymal transition is dispensable for metastasis but induces chemoresistance in pancreatic cancer. Nature 2015;527:525–30. [DOI] [PMC free article] [PubMed] [Google Scholar]
- 64.Hu B, Cheng JW, Hu JW, Li H, Ma XL, Tang WG, et al. KPNA3 confers sorafenib resistance to advanced hepatocellular carcinoma via TWIST regulated epithelial-mesenchymal transition. J Cancer 2019;10:3914–25. [DOI] [PMC free article] [PubMed] [Google Scholar]
- 65.Kuczynski EA, Sargent DJ, Grothey A, Kerbel RS. Drug rechallenge and treatment beyond progression--implications for drug resistance. Nat Rev Clin Oncol 2013;10:571–87. [DOI] [PMC free article] [PubMed] [Google Scholar]
Associated Data
This section collects any data citations, data availability statements, or supplementary materials included in this article.