

Abstract
Exportin 1 (XPO1) mediates nuclear export of many cellular factors known to play critical roles in malignant processes, and selinexor (KPT-330) is the first XPO1-selective inhibitor of nuclear export compound in advanced clinical development phase for cancer treatment. We demonstrated here that inhibition of XPO1 drives nuclear accumulation of important cargo tumor suppressor proteins, including transcription factor FOXO3a and p53 in thymic epithelial tumor (TET) cells, and induces p53-dependent and -independent antitumor activity in vitro. Selinexor suppressed the growth of TET xenograft tumors in athymic nude mice via inhibition of cell proliferation and induction of apoptosis. Loss of p53 activity or amplification of XPO1 may contribute to resistance to XPO1 inhibitor in TET. Using mass spectrometry–based proteomics analysis, we identified a number of proteins whose abundances in the nucleus and cytoplasm shifted significantly following selinexor treatment in the TET cells. Furthermore, we found that XPO1 was highly expressed in aggressive histotypes and advanced stages of human TET, and high XPO1 expression was associated with poorer patient survival. These results underscore an important role of XPO1 in the pathogenesis of TET and support clinical development of the XPO1 inhibitor for the treatment of patients with this type of tumors.
Introduction
Almost all targeted therapies developed in the modern era work through inhibition of particular oncogenic pathways that confer cancer cells the ability to proliferate and survive independent of exogenous growth signals (1). However, to undergo dysregulated proliferation and survival, cancer cells also need to circumvent internal negative regulatory programs often governed by tumor suppressor proteins (TSP; ref. 2). Although inactivation of TSPs is paramount in tumorigenesis, no cancer therapy has yet been developed aiming to restore their activity.
TSPs can be inactivated by several mechanisms, including mutation, deletion, and epigenetic silencing (2). However, many TSPs such as p53 and p27 execute their tumor suppressor functions mainly in the nucleus and are in part regulated by nuclear–cytoplasmic shuttling for a rapid on/off switch. Dysregulation of nuclear–cytoplasmic shuttling affects nuclear activity of various TSPs and can contribute to abnormal cell survival, tumor progression, and drug resistance (3, 4). Although many molecules are involved in the shuttling process, alteration of exportin 1 (XPO1) plays a prominent role in tumor pathogenesis. XPO1, also known as chromosome region maintenance 1 (CRM1), mediates nuclear export of ~200 leucine-rich-nuclear export signal (LR-NES)-containing proteins (4). Importantly, XPO1 is the sole nuclear export receptor for a large number of TSPs involved in apoptotic signaling and cell-cycle regulation. Overexpression of XPO1 is reported in both solid tumors and leukemias and correlates with poor prognosis of several tumor types (4).
Consequently, XPO1 inhibition has emerged as a cancer therapeutic strategy (4). The first XPO1 inhibitor discovered was Leptomycin-B (LMB), a natural compound with antitumor activity (5), but severe toxicity profile prevented further clinical development (6). Latterly developed small-molecule selective inhibitors of nuclear export (SINE) represent a different class of XPO1 inhibitors with better specificity and efficacy. Selinexor (KPT-330) is one of such SINE compounds that is currently in clinical development (4, 7, 8). Unlike LMB that forms an irreversible covalent bond with cysteine-528 residue located in the vicinity of LR-NES-binding domain in XPO1, selinexor binds XPO1 through the same residue in a covalent but slowly reversible manner (4).
In this study, we investigated the role of XPO1 in thymic epithelial tumors (TET) and used selinexor to mechanistically explore the feasibility of XPO1-targeted therapy for TET treatment. We demonstrated that XPO1 is active in TET cells, and selinexor induced p53-dependent and -independent antitumor activity and suppressed TET xenograft tumor growth. We also demonstrated that p53 loss and XPO1 amplification are potential mechanisms of resistance to selinexor. Furthermore, we globally profiled the factors and pathways/networks that are affected by selinexor using a proteomics approach and identified several important changes including those on the transcriptional programs. Finally, we demonstrated that targeting XPO1 in TETs is relevant by providing evidence of XPO1 overexpression in this tumor type and its correlation with the disease outcome.
Materials and Methods
Cell lines, drug, and antibodies
T1889 and T1682 cell lines were kindly provided by Marco Breinig (Heidelberg University Hospital, Heidelberg, Germany; ref. 9). Ty82 was purchased from Japan Health Science Foundation (Tokyo, Japan). IU-TAB1 was kindly provided by George Sledge Jr (Indiana University School of Medicine, Indianapolis, IN; ref. 10). TEC84 was kindly provided by Phong Le (Loyola University, Chicago, IL; ref. 11), and TEC41.2 was kindly provided by Julian Sage and Brian Condie (University of Georgia, Athens, GA; ref. 12). MP57 was established in our lab as recently described (13). Except TEC84, which was cultured in TE media as previously described (11), all other cell lines were cultured in RPMI media containing 1% penicillin/streptomycin and 10% heat-inactivated bovine serum (Invitrogen). All cell lines were passaged less than 6 months between thawing and use in the described experiments and authenticated by routine monitoring of cell morphology and proliferation. We also regularly monitored potential mycoplasma contamination in these cell lines using the MycoAlert Mycoplasma Detection Kit (Lonza).
Selinexor was obtained from Karyopharm Therapeutics, Inc. Anti-XPO1 antibodies were purchased from Santa Cruz Biotechnology (sc-5595) for immunofluorescence and Western blot analysis and from Sigma-Aldrich (HPA042933) for immunohistochemistry. Antibodies for p53 (sc-126) and NF-κB subunit p65 (sc-372) were purchased from Santa Cruz Biotechnology. All other antibodies were purchased from Cell Signaling Technology: p27 (#2552), FOXO3 (#2497), tubulin (#2125), Histone H1 (#41328), PARP (#9532), BAX (#5023), and BIM (#2933).
Western blot analysis
Whole cell lysates were prepared using a RIPA buffer (Sigma) supplemented with protease and phosphatase inhibitors (Thermo scientific). Equal amounts of proteins were electrophoresed in 4% to 20% Mini-Protein TGX gels (Bio-Rad) and transferred onto PVDF membranes. Membranes were incubated with primary antibody overnight, washed, and incubated with the secondary antibody (Bio-Rad) for 1 hour at room temperature. The detected proteins were visualized by chemiluminescence using the Super Signal West-Pico Chemiluminiscent Substrate (Pierce).
Subcellular fractionation
Cells (1 × 10⁶) were seeded in 6-well plates and allowed to adhere overnight. After being treated with dimethyl sulfoxide (DMSO) or selinexor, cells were harvested and fractionated using the NE-PER Nuclear and Cytoplasmic Extraction Reagents (Pierce) according to the manufacturer’s protocol (100 μL of CER1 and 5.5 μL of the CER2 reagents for the cytoplasmic extraction and 50 μL of the NER reagent for nuclear extractions).
Immunofluorescence microscopy
Cells were fixed for 30 minutes in 4% paraformaldehyde and permeabilized with 0.1% Triton X-100 for 10 minutes. After blocking in 3% bovine serum albumin for 1 hour, cells were incubated with primary antibody for 1 hour, followed by 1 hour incubation with Alexa Fluor 488 dye (Thermo Fisher Scientific) and DAPI at room temperature. The staining was visualized under an immunofluorescence microscope.
Cell viability assay
Cells were seeded in 96-well plates (2.5 × 10³ cells/well), allowed to adhere overnight, and exposed to DMSO or selinexor for 72 hours. Cell viability was evaluated using the CellTiter-Glo viability assay (Promega). Each assay was performed in triplicate. Data were plotted and analyzed using GraphPad Prism and represent mean values ± SD. IC50 values were obtained by curve fitting to the Hill equation.
Cell-cycle analysis
Cells were exposed to DMSO or selinexor for 24 hours and harvested. After propidium iodide (PI) staining of the harvested cells, DNA content was measured by FACStar Plus Dual Laser System and FACSort System (Becton Dickinson). The percentage of cells in G1, S, and G2–M phases was analyzed by the ModFit LT program (Verify Software Home).
Apoptosis assay
Cells were exposed to DMSO or selinexor for 72 hours. Apoptotic cells were detected by Annexin V/ PI staining assay (Life Technologies) and measured by flow cytometry. Results represent mean ± SD of triplicates.
Caspase-3/7 assay
Caspase activity was detected using the Caspase-Glo 3/7 assay kit (Promega). Cells (2.5 × 10⁴ cells/well) were seeded in a luminometer white 96-well plate (Thermo Scientific) and treated with DMSO or selinexor for 48 hours. Caspase-3/7 reagents were then added to each well and incubated for 1 hour at room temperature. Luminescence was recorded using the GLOMAX+ instrument (Promega).
Transfection of siRNAs and plasmids
Cells were transfected with ON-TARGET plus siRNAs targeting XPO1, p53, and FOXO3a (Dharmacon) using Lipofectamine RNAiMAX transfection reagent (Invitrogen). AllStars Negative Control siRNA (Qiagen) was used as negative control. Transfection of H1682 cells with pIRES2-EGFP-p53WT or pIRES2-EGFP plasmids (Addgene) was carried out using Lipofectamine 2000 (Invitrogen).
Generation of selinexor-resistant cell line
IU-TAB1 cells (1 × 10⁶ cells) were seeded in T75 flasks in growth medium supplemented with selinexor (starting from 20 nmol/L). Medium was replaced every 2 to 3 days, and surviving cells were allowed to grow to 70% confluency before trypsinization and reseeded in medium containing gradually increased selinexor concentrations. This process was repeated for 2 months until selinexor reached 500 nmol/L. The resistant cells were maintained in growth medium containing 500 nmol/L of selinexor.
Gene copy-number variation analysis
Genomic DNA was extracted using the DNA/RNA mini kit (Qiagen) and subjected to a real-time PCR-based XPO1 gene copy-number analysis using TaqMan copy number assay on the ABI 7900HT system (Applied Biosystems). Primers for the XPO1 gene (XPO1: Hs03075013_cn) were purchased from ThermoFisher Scientific, and the RPPH1 gene used as an (endogenous reference control) was purchased from ThermoFisher Scientific. Gene copy number was analyzed by Copy-Caller software v1.0 (Applied Biosystems), and the copy number of the XPO1 gene was calibrated to that of the RPPH1 reference gene.
Xenograft study
Cells (1.5 × 10⁶/mouse in 0.1 mL of 50% Matrigel) were subcutaneously injected into the flanks of 6- to 8-week-old athymic nude mice (Charles River Laboratories). Tumor volume was measured once a week: Volume = 1/2 (Length × Width2). When average tumor volumes reached 100 mm3, mice were randomized into three groups (8 mice/group) and treated with vehicle [0.6% (w/v) Plasdone PVP and Poloxamer Pluronic] or selinexor 3 times/week for 4 weeks via oral gavage. At the end of experiment, tumor tissues were harvested and used for posttreatment analysis. The study was conducted under an animal protocol approved by the Institutional Animal Care and Use Committee (IACUC) at the Georgetown University Medical Center.
Immunohistochemistry
IHC staining was performed on 5-μm formalin-fixed paraffin-embedded tissue sections after heat-induced epitope retrieval. Xenograft tumor sections were incubated with anti-Ki67 (Abcam), anti-cleaved caspase-3 (Cell Signaling Technology), or anti-p27 (Abcam) primary antibody, followed by exposure to horseradish peroxidase labeled polymer and DAB chromogen (Dako). For detection of XPO1 expression in human TETs, tissue microarray sections (14) were stained with an anti-XPO1 antibody (Sigma-Aldrich), reviewed, and scored by a pathologist who was blinded to patient information and clinical outcomes. The percentage of positive cells was scored as 0 (0%), 1 (1–10%), 2 (11%–50%), 3 (51%–80%), or 4 (≥ 81%); and the staining intensity was scored as 0 (negative), 1 (weak), 2 (moderate), or 3 (strong). The two scores for the percentage of positive cells and the staining intensity were multiplied, resulting in the final IHC score (value between 0 and 12).
Mass spectrometry–based proteomics
IU-TAB1 cells were cultured for at least five passages in SILAC media containing L-arginine and L-lysine (light), or 13C6-arginine and 13C6-lysine (heavy; Cambridge Isotope Laboratories). Cells were then treated with DMSO (“light” labeled) or selinexor (400 nmol/L; “heavy” labeled) for 6 hours. Subcellular fractions were obtained using NE-PER Nuclear and Cytoplasmic Extraction Reagents (Thermo Scientific) and validated by Western blot using anti-tubulin (cytoplasmic marker) and anti-histone H3 (nuclear marker). Equal amounts of protein lysates were mixed together for either nuclear or cytoplasmic fraction. The combined proteins were subjected to tryptic digestion, followed by purification of digested peptides, basic RPLC fractionation, LC-MS/MS, and data analyses as described elsewhere (15).
Statistical analysis
Student t test or 1-way ANOVA analysis was used to determine statistical significance of in vitro and in vivo results. All reported P values were 2 sided and were considered significant if P < 0.05. All analyses were conducted with R software package, version 3.2.1 (16). Association between XPO1 expression levels and clinical and biologic characteristics of tumors were analyzed using the Fisher exact test or χ2 test, when appropriate. Survival curves were generated using the Kaplan–Meier method, and differences between curves were analyzed using the log-rank or Wilcoxon tests, as indicated. Survival was calculated from the date of primary surgery to the date of death. A Cox regression multivariate analysis of prognostic factors was also performed.
Results
XPO1 is expressed in TET cell lines and its activity can be inhibited by selinexor
To determine the relevance of XPO1 inhibition in TETs, we first examined XPO1 expression in two thymoma cell lines (IU-TAB1 and T1682) and three thymic carcinoma cell lines (Ty82, MP57, and T1889). We observed moderate to high levels of XPO1 protein, localized mainly in the nucleus in these cells (Fig. 1A and B; Supplementary Fig. S1A). Treatment of TET cells with selinexor resulted in a dose-dependent decrease or complete loss of XPO1 protein (Fig. 1C and D), likely caused by proteasomal degradation of XPO1 as previously reported (4).
Figure 1.
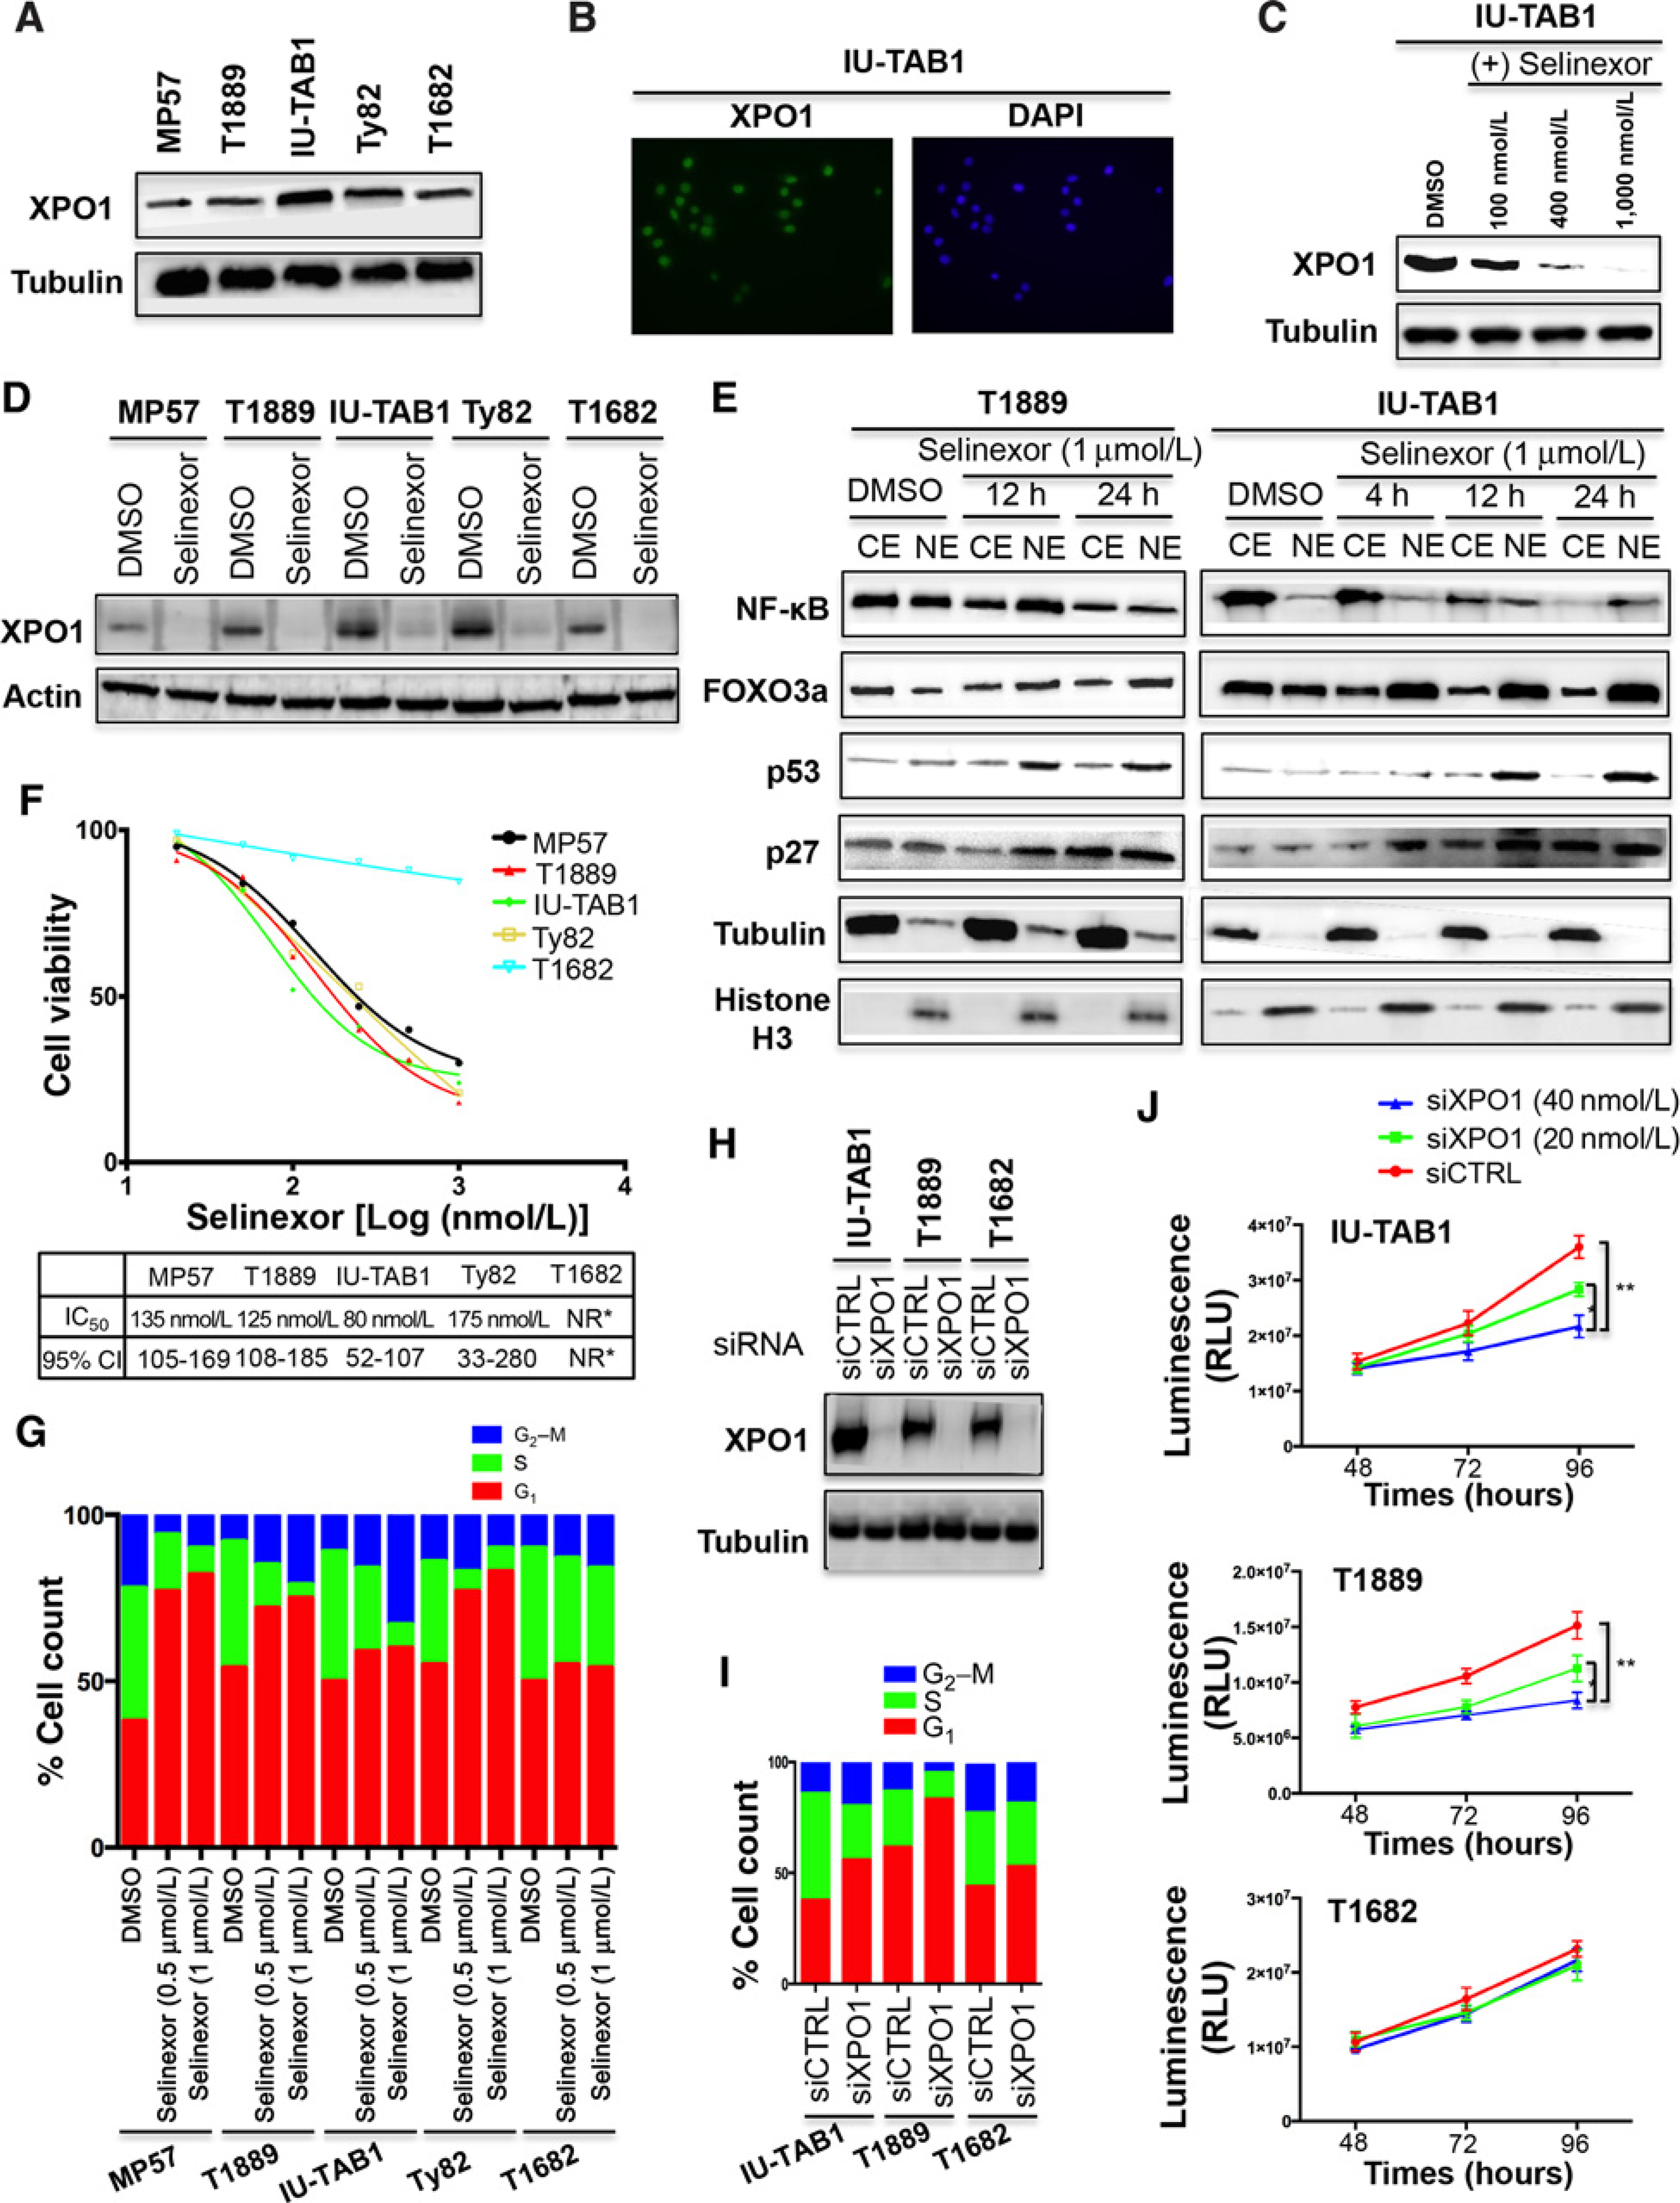
XPO1 inhibition induces nuclear accumulation of its cargo proteins and inhibits cell-cycle progression and proliferation of TET cells. A, Western blot detection of XPO1 in TET cell lines. B, Detection of XPO1 in IU-TAB1 cells by immunofluorescence staining (XPO1, green; DAPI, blue). C and D, Western blot detection of XPO1 in IU-TAB1 cells treated with increasing concentrations of selinexor (C), and in other TET cell lines, treated with 1 μmol/L of selinexor for 24 hours (D). DMSO was used as the treatment control. E, Western blot analyses of the indicated proteins in the nuclear (NE) and cytoplasmic extraction (CE) of T1889 and IU-TAB1 cells treated with DMSO or selinexor (1 μmol/L). Tubulin and Histone H3 were used to show equal protein loading and purity of cytoplasmic and nuclear fractions. F, Cell viability of TET cell lines treated with increasing concentrations of selinexor for 72 hours, and the IC50 of selinexor and 95% confidence interval (95% CI) for each cell line. NR*, not reached. G, Flow-cytometric analysis of TET cells stained with PI after 24 hours’ treatment with DMSO or selinexor (0.5 or 1 μmol/L). H, Western blot analysis of XPO1 knockdown by siRNA. Tubulin was used as a loading control. siCTRL, scramble siRNA; siXPO1, XPO1 siRNA. I, Cell-cycle analysis of IU-TAB1, T1889, and T1682 cells treated with siCTRL or siXPO1 (40 nmol/L) for 48 hours. J, Proliferation of IU-TAB1, T1889, and T1682 cells after treatment with siCTRL or siXPO1 for 48, 72, and 96 hours. Results are expressed as relative light units (RLU) and represent mean values ± SD of triplicates. *, P < 0.05; **, P < 0.01.
We then examined the effect of XPO1 inhibition on the nuclear–cytoplasmic shuttling of several known XPO1 cargo proteins (7). Selinexor treatment resulted in a significant shift in the balance of FOXO3a, p53, and p27 proteins in the nucleus and cytoplasm, leading to nuclear accumulation of these TSPs (Fig. 1E; Supplementary Fig. S1B). The concomitant robust increase of p27 cytoplasmic levels, observed after 24 hours of treatment, is possibly related to the increase of the FOXO3 activity, a positive regulator of p27 transcription (4, 7). The effect of XPO1 inhibition on the shuttling of NF-κB, an XPO1 cargo that is degraded in the nucleus when co-entrapped with another XPO1 cargo, IκB-α (4, 7, 17, 18), was also observed (Fig. 1E; Supplementary Fig. S1C and S2A).
Inhibition of XPO1 impairs proliferation and survival of TET cells
To determine the biological effect of XPO1 inhibition, we performed cell viability assay to test the sensitivity of TET cells to selinexor. Selinexor induced a dose-dependent inhibition of IU-TAB1, Ty82, T1889, and MP57 cell viability, with IC50 ranging from 80 to 175 nmol/L (Fig. 1F). Interestingly however, selinexor even at 1 μmol/L had almost no effect on the viability of T1682 cells (Fig. 1F), indicating that this cell line is primary resistant to this inhibitor.
Given that XPO1 mediates nuclear–cytoplasmic shuttling of several key cell-cycle regulators (4), we assessed the effect of selinexor on cell-cycle progression. Selinexor treatment resulted in G1 arrest in MP57 and Ty82 cells especially at higher concentration (G1 cell counts from 40% to 80% with P = 0.0003 for MP57, and from 51% to 74% with P = 0.0005 for Ty82), but led to an arrest of IU-TAB1 cells in the G2 phase (G2 cell count from 12% to 33% with P = 0.02; Fig. 1G). In T1889 cells, selinexor induced a significant increase of the cell counts in both G1 (from 51% to 73%; P = 0.0004) and G2 (from 13% to 21%; P = 0.03; Fig. 1G). These data suggest that selinexor may affect distinct cell-cycle regulators to inhibit cell-cycle progression in different cells. No significant cell-cycle effect was observed in T1682 cells treated with selinexor (Fig. 1G), in agreement with the cell viability assay result (Fig. 1F).
To determine whether the effects of selinexor on cell cycle and viability were XPO1 specific, we performed the same cell-based functional assays after siRNA-mediated inhibition of XPO1. We found that XPO1 siRNA knockdown resulted in a similar cell-cycle effect as that of selinexor treatment (Fig. 1H and I). XPO1 silencing also significantly reduced the proliferation of IU-TAB1 and T1889 cells but not that of T1682 after treatment with two different XPO1 siRNAs (Fig. 1J; Supplementary Fig. S2B and C).
To further elucidate cytotoxic effect of selinexor, we performed apoptosis assay by Annexin V/PI staining. All sensitive cell lines treated with selinexor showed a significantly dose-dependent increase of apoptotic cells, compared to controls (Fig. 2A and B). Selinexor-induced apoptosis was also confirmed by increases of caspases-3/7 activities and induction of poly ADP-ribose polymerase (PARP) cleavage in the selinexor-treated-sensitive cell lines (Fig. 2C and D). A significant induction of proapoptotic BAX and or BIM proteins, which are transcriptionally regulated by XPO1 cargoes (19, 20), was also observed in the MP57, IU-TAB1, Ty82, and T1889 cells (Fig. 2D), but it induced no apoptotic activity in the T1682 cells (Fig. 2A–D). Selinexor induced significantly less cytotoxic effect in the normal thymic epithelial cell lines TEC81 and TEC41.2 (Fig. 2E and F), indicating a tumor selective inhibitory activity of selinexor. Such specificity could be critical for minimizing potential adverse effect caused by selinexor treatment in patients.
Figure 2.
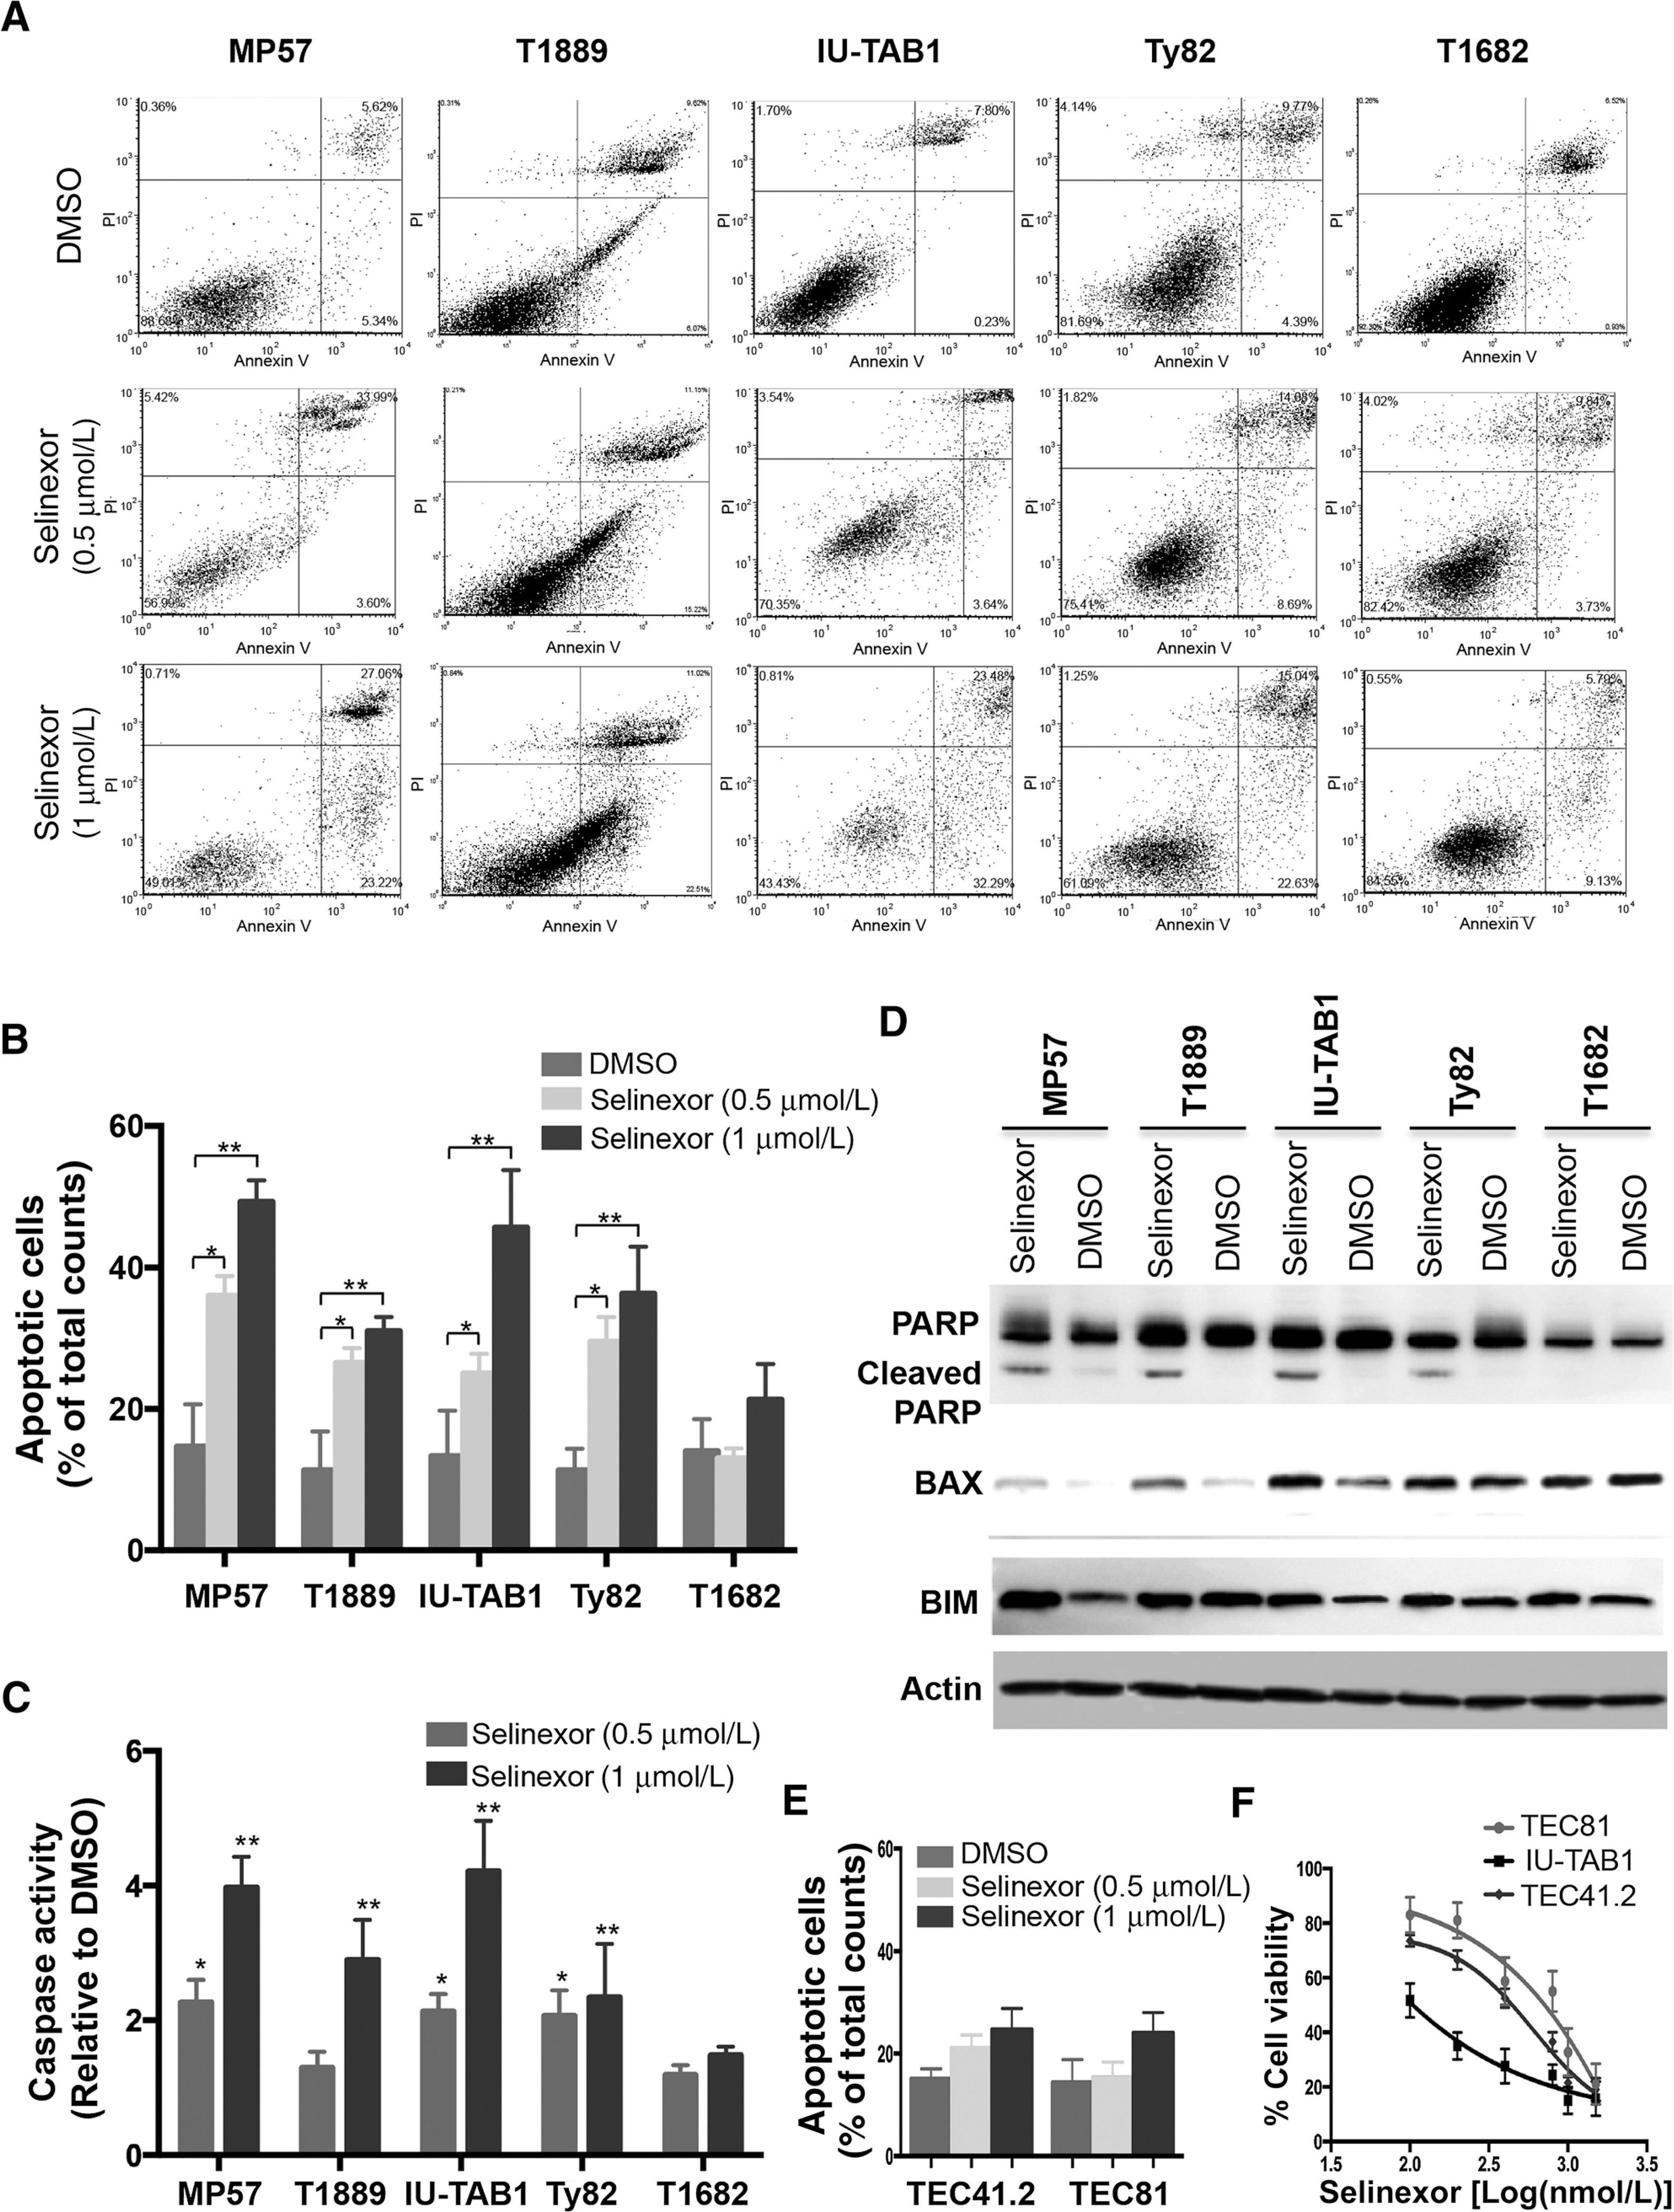
Selinexor induces apoptosis in sensitive TET cells but hardly in normal thymic epithelial cells. A, Apoptosis of TET cells was determined by flow cytometry-based Annexin V/PI apoptosis assay 72 hours after treatment with DMSO or selinexor (0.5 or 1 μmol/L). Representative contour plots from each experiment are shown. B, Quantification of apoptotic cells. C, Assessment of caspase-3 and −7 catalytic activity 48 hours after DMSO or selinexor treatment. Data are expressed as fold of fluorescence units of selinexor-treated samples relative to that of DMSO and represent mean values ± SD of triplicates. *, P < 0.05; **, P < 0.01. D, Western blot detection of PARP, cleaved PARP, BAX, and BIM in the indicated TET cells treated with DMSO or selinexor (1 μmol/L) for 24 hours. β-Actin was used as the loading control. E, Annexin V/PI apoptosis assay of normal thymic epithelial cells TEC41.2 and TEC81 after treatment with/without selinexor for 72 hours. F, Viability of TEC41.2, TEC81, and IU-TAB1 cells after treatment with increasing concentrations of selinexor for 72 hours. Data represent mean ± SD of triplicates.
Selinexor induces p53-dependent and -independent cytotoxic effects in TET cells
Selinexor treatment resulted in nuclear accumulation of p53 and FOXO3a (Fig. 1), two important TSPs that control the expression of many crucial genes and regulate various key cellular processes (4, 7). To definitively demonstrate the contribution of these two TSPs to the antitumor activity of selinexor, we assessed the viability of TET cells treated with selinexor after siRNA knockdown of p53 and/or FOXO3a. Knockdown of p53 significantly reduced selinexor cytotoxicity in T1889 and IU-TAB1 cells (IC50 from 150 nmol/L to 600 nmol/L in T1889, P < 0.001 and from less than 150 nmol/L to more than 300 nmol/L in IU-TAB1, P < 0.05; Fig. 3A and B); the effect was also reflected by increase of the area under the dose–response curve (AUC; from 30 to 52 in T1889, P = 0.002, and from 29 to 47 in IU-TAB1, P = 0.006; Fig. 3C). However, knockdown of FOXO3a in these two cell lines had almost no effect on selinexor cytotoxicity (Fig. 3A–C). Interestingly, FOXO3a knockdown resulted in a significantly reduced selinexor cytotoxicity in MP57 cells (IC50 from <150 nmol/L to ~600 nmol/L, P < 0.001, and AUC from 24 to 42, P = 0.02; Fig. 3A–C), a p53-deficent thymic carcinoma cell line (13). Nonetheless, no effect was observed in the Ty82 cells with the knockdown of p53 and/or FOXO3a (Fig. 3A and B), indicating the involvement of other factors. Together, these data suggest that selinexor depends upon different XPO1 cargo proteins to exert its antitumor activities under different cellular contexts (i.e. p53-dependent and p53-independent fashions).
Figure 3.
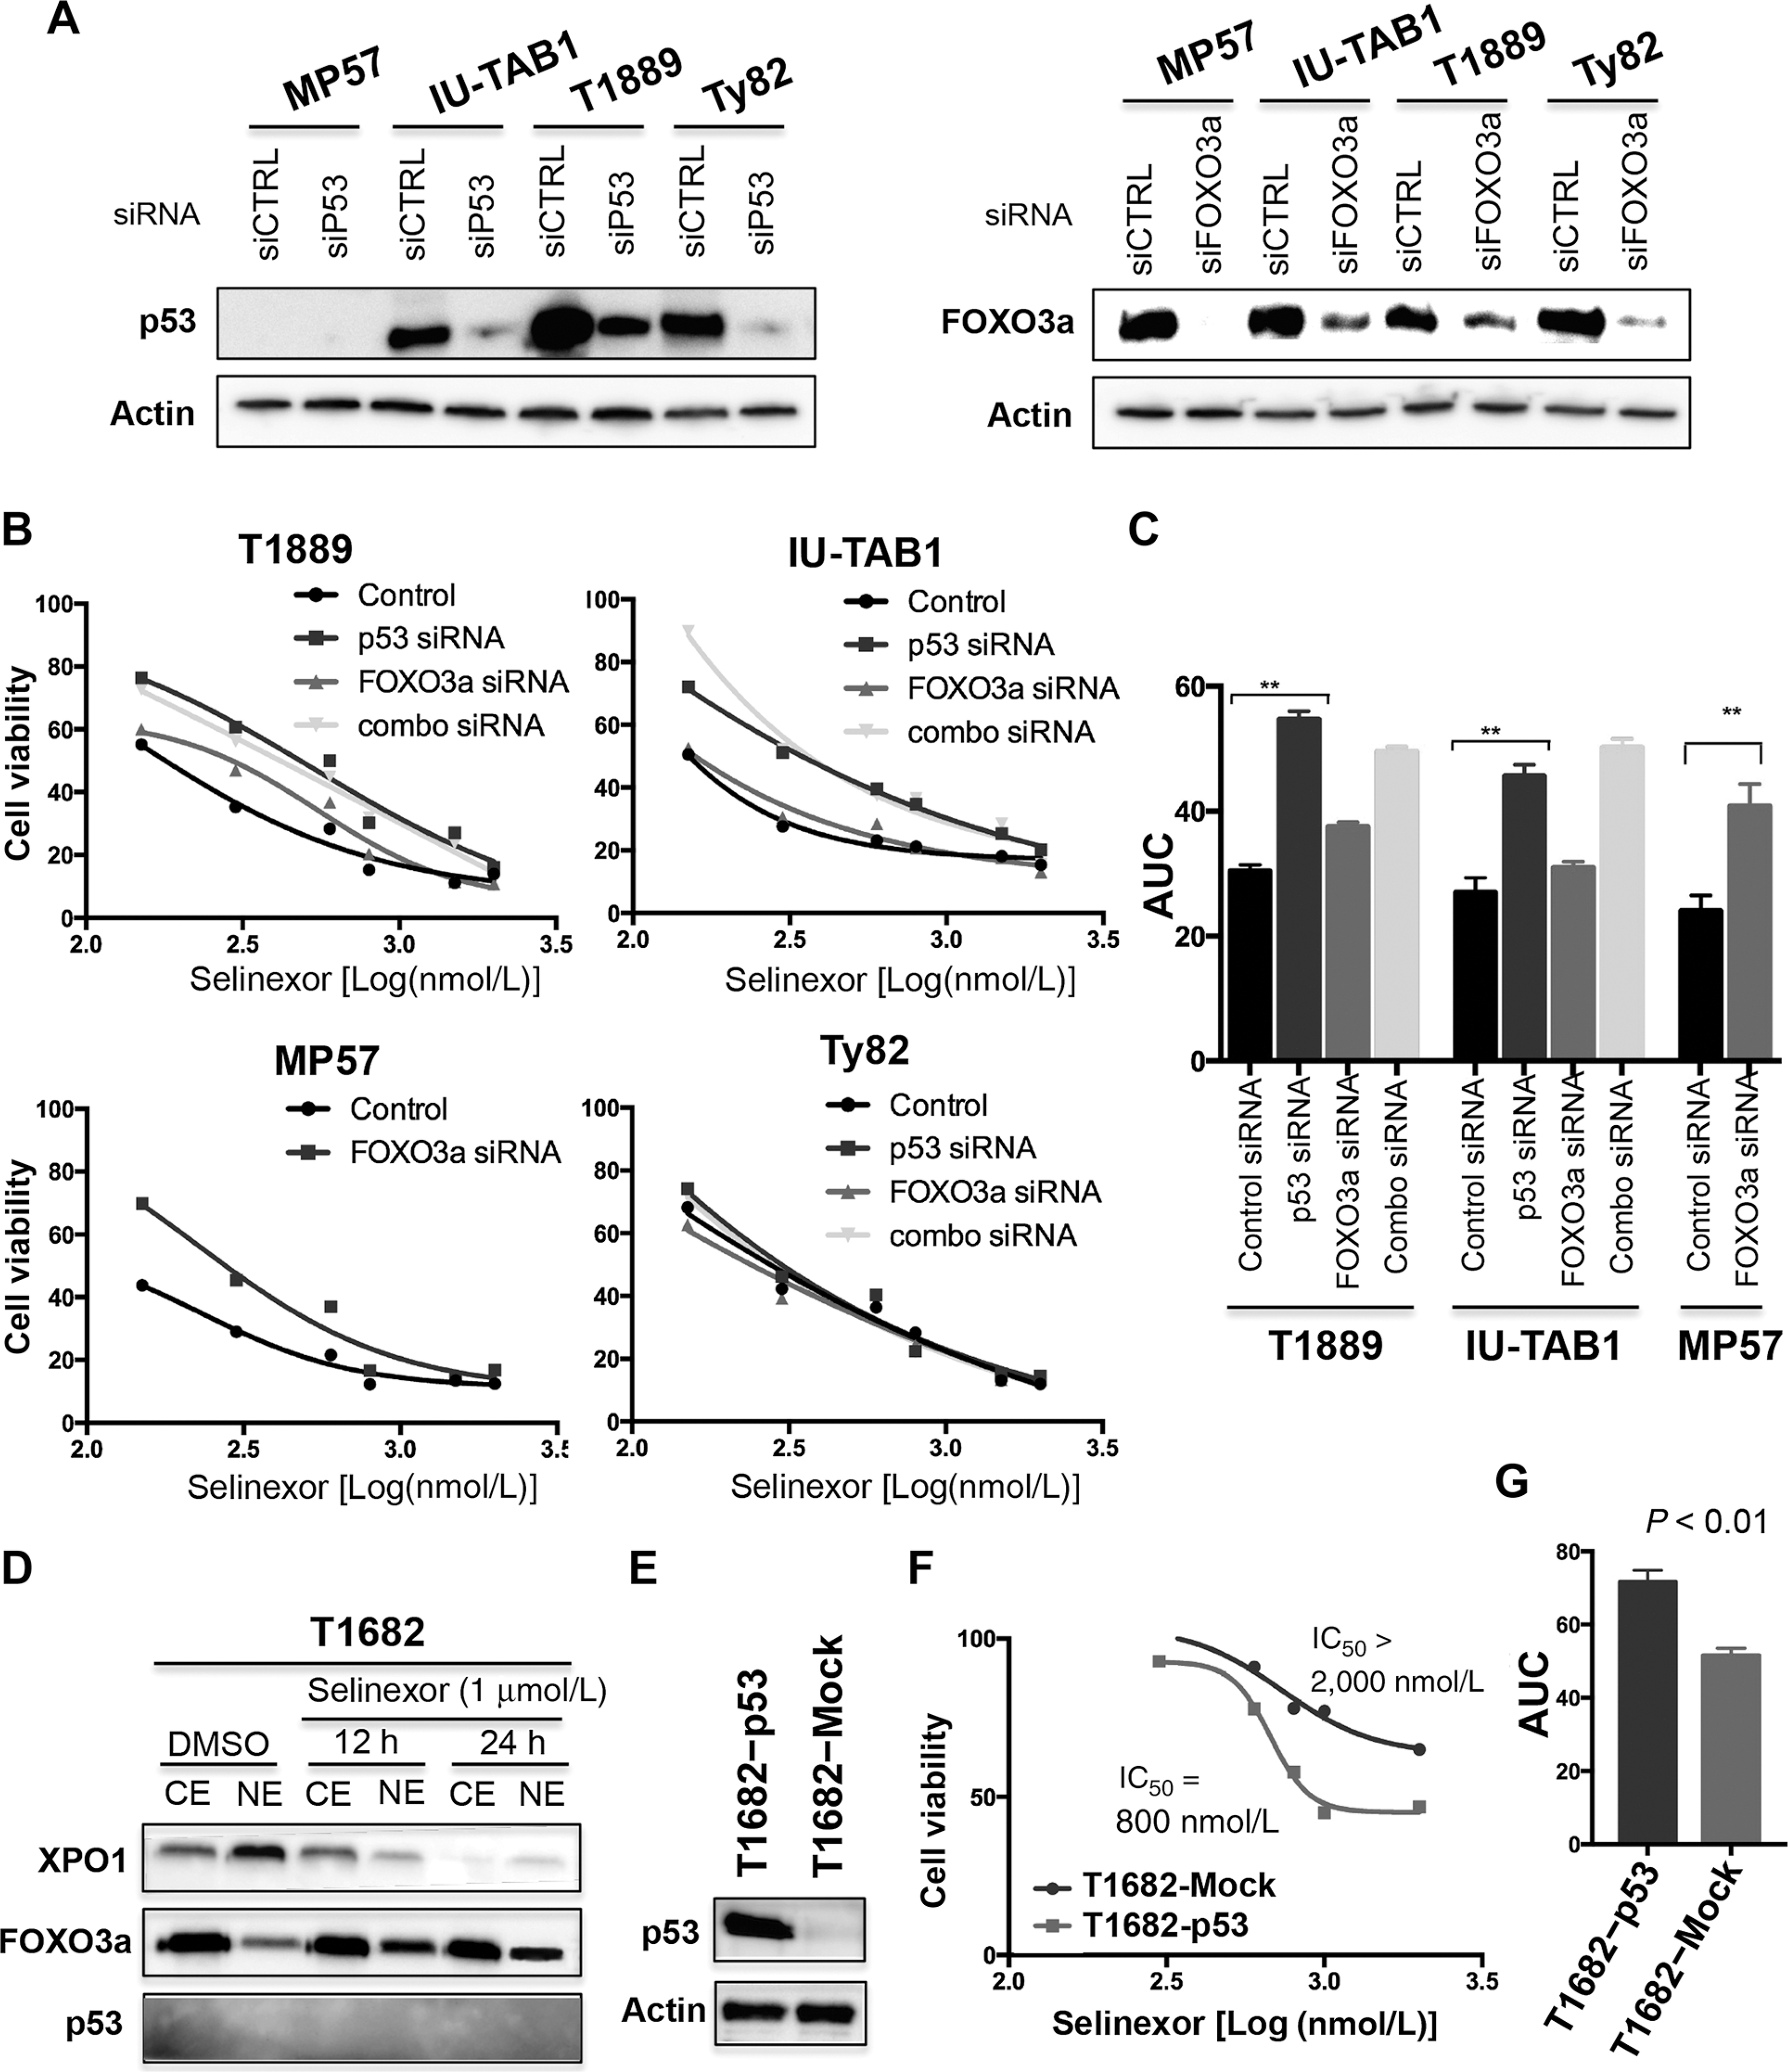
Selinexor confers p53-dependent and -independent antitumor activity in TET cells. A, Western blot detection of p53 and FOXO3a in the indicated TET cells after siRNA knockdown. B, Viability of T1889, IU-TAB1, MP57, and Ty82 cells treated with increasing concentrations of selinexor with/without control siRNA, p53 siRNA, and/or FOXO3a siRNA for 72 hours. C, Comparison of the AUC between cells treated with selinexor with and without p53 and/or FOXO3a siRNAs. Data represent mean values ± SD of triplicates. **, P < 0.01. D, Western blot detection of XPO1, FOXO3a, and p53 in the cytoplasmic (CE) and nuclear extraction (NE) of T1682 cells treated with DMSO or selinexor for the indicated times. E, Western blot confirmation of ectopic p53 expression in T1682 cells transfected with pIRES2-EGFP-p53 vector. Cells transfected with pIRES2-EGFP empty vector (Mock) were used as the control. F, Cell viability of Mock- or p53-transfected T1682 cells treated with increasing concentrations of selinexor for 72 h. IC50 concentrations were determined using GraphPad Prism program. G, Comparison of AUCs between p53- and Mock-transfected T1682 cells treated with selinexor. Data represent mean values ± SD of triplicates. **, P < 0.01.
Loss of p53 activity in T1682 cells contributes to selinexor resistance
T1682 cells are primarily resistant to selinexor (Figs. 1 and 2), even though XPO1 is functional and its inhibition by selinexor led to a nuclear accumulation of FOXO3a in this TET line (Fig. 3D). Given that no p53 was detected in T1682 cells (Fig. 3D; refs. 21–23), we asked whether p53 loss contributes to the resistance. We ectopically expressed p53 in T1682 cells and reassessed their sensitivity to selinexor. Reinstallation of p53 significantly increased the sensitivity of T1682 cells to selinexor (at least 2.5-fold decrease of IC50, compared to that of Mock control; AUC: 73 versus 52 with P = 0.008; Fig. 3E–G). These results clearly indicate a significant contribution of p53 loss to the resistance of T1682 cells to selinexor. Nevertheless, we cannot completely rule out the potential role of other XPO1 cargoes to this resistance.
XPO1 gene amplification confers acquired resistance to selinexor
To further explore potential mechanisms of resistance to the XPO1 inhibitor, we analyzed experimentally established selinexor-resistant IU-TAB1 cells (referred to as IU-TAB1-R; Fig. 4A). The resistant cells displayed a 5-fold increase of selinexor IC50 (400 nmol/L for IU-TAB1-R versus 80 nmol/L for the parental cells; Fig. 4B) and significantly less selinexor-induced apoptosis than the IU-TAB1 cells (Fig. 4C). While no acquired mutation was found in the XPO1 coding region in the IU-TAB1-R cells (data not shown), XPO1 protein levels were significantly elevated and higher concentrations of selinexor were required to inhibit XPO1 and to deregulate p53 and p27 in this resistant line (Fig. 4D). Gene copy-number analysis revealed at least 3.5-fold more copies of the XPO1 gene in the resistant cells than in the parental cells (Fig. 4E). A targeted exome sequencing of more than 200 cancer genes (13) confirmed XPO1 gene amplification but identified no additional alteration in the IU-TAB1-R cells (data not shown). Importantly, partial knockdown of XPO1 by siRNA (to a level comparable to that in the parental cells) was able to restore the sensitivity of IU-TAB1-R cells to selinexor (Fig. 4F and G). These data indicate that amplification of the XPO1 gene is one of the potential mechanisms of resistance to the XPO1 inhibitor.
Figure 4.
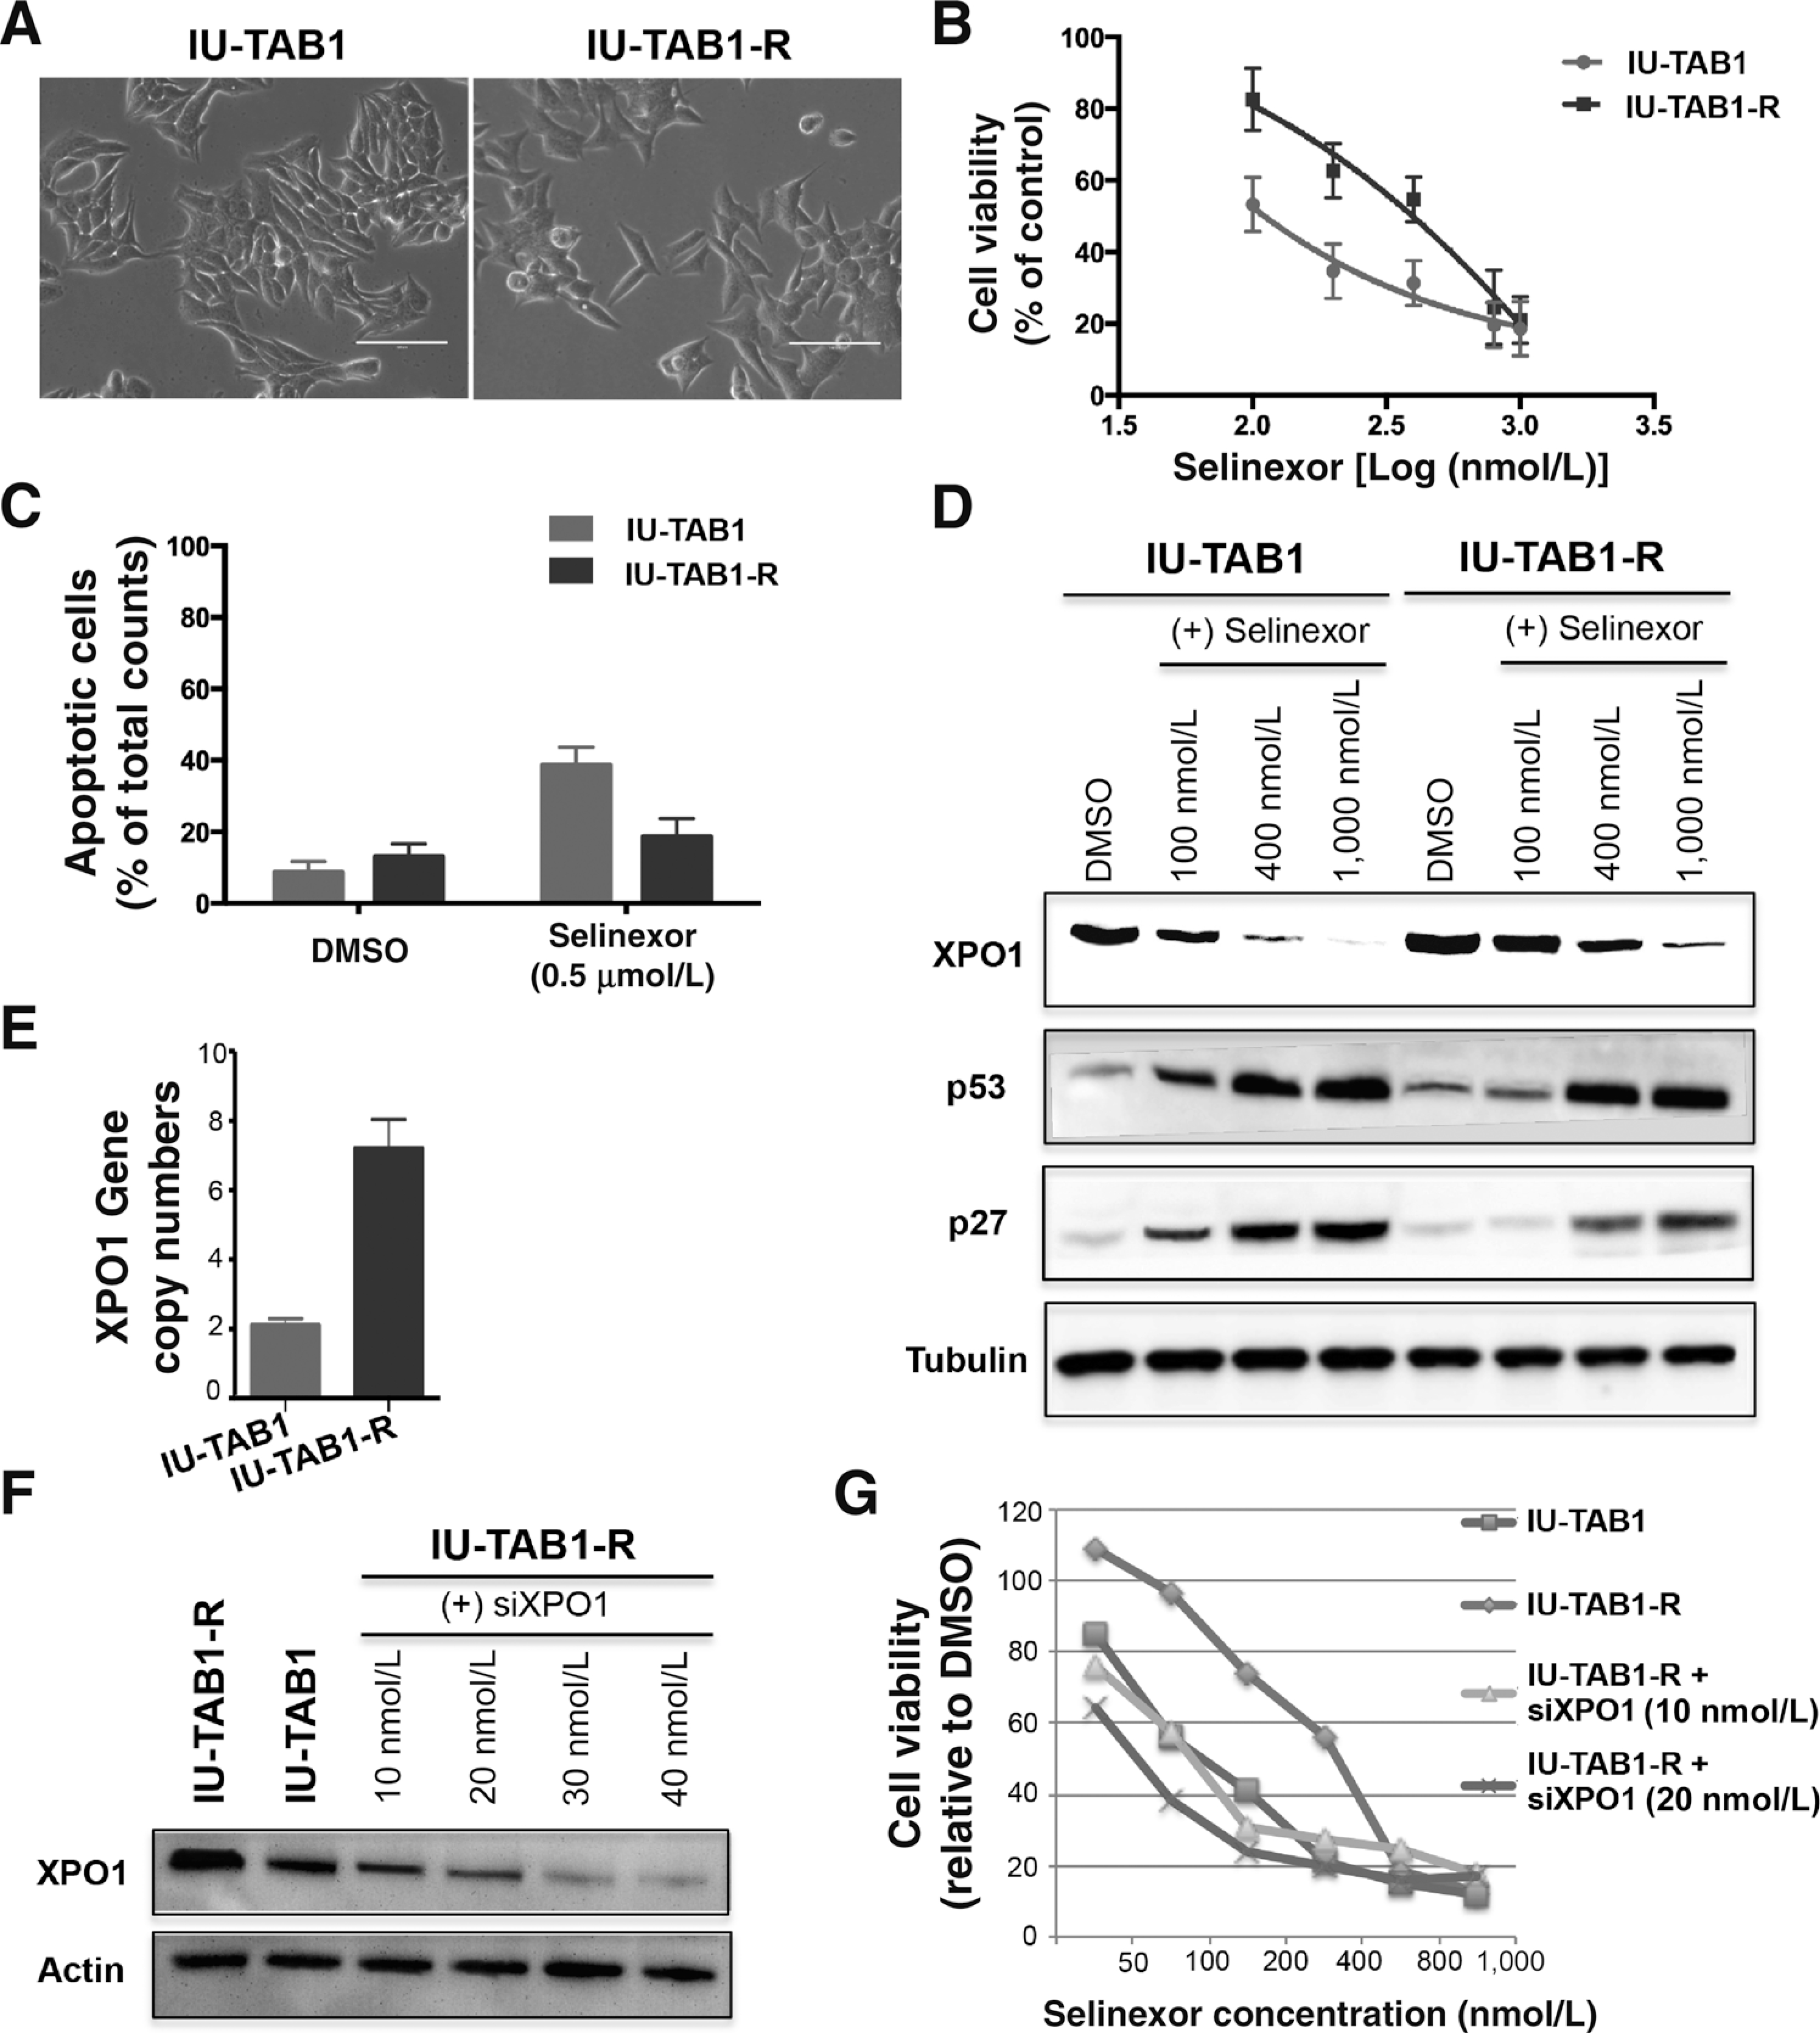
Amplification of XPO1 renders acquired resistance of IU-TAB1 cells to selinexor. A, Morphology of parental IU-TAB1 cells and the selinexor-resistant derivatives (IU-TAB1-R). B, Viability of IU-TAB1 and IU-TAB1-R cells treated with increasing concentrations of selinexor for 72 hours. C, Apoptotic rates of IU-TAB1 and IU-TAB1-R cells treated with DMSO or selinexor (0.5 μmol/L) for 72 hours, analyzed by flow cytometry-based Annexin V/PI apoptosis assay. D, Western blot detection of XPO1, p53, and p27 in IU-TAB1 and IU-TAB1-R cells treated with DMSO or the indicated concentrations of selinexor for 24 hours. E, XPO1 gene copy number quantification in IU-TAB1 and IU-TAB1-R cells by real-time PCR analysis (P = 0.001). F, Western blot evaluation of XPO1 knockdown in IU-TAB1-R cells after exposure to increasing concentrations of XPO1 siRNA for 24 hours. G, Viability of IU-TAB1-R cells treated with siCTRL or siXPO1 (10 or 20 nmol/L) in the presence of increasing concentrations of selinexor for 72 hours. IU-TAB1 cells were also assayed for drug sensitivity comparisons.
Selinexor inhibits TET xenograft tumor growth
To evaluate antitumor efficacy of selinexor, two xenograft tumor models (MP57 and T1889) were treated with two different doses of selinexor (10 and 15 mg/kg, 3 times weekly) or vehicle for 4 weeks. Both dosages were effective and led to 47% and 43% growth inhibition of MP57 tumors, and 42% and 53% growth inhibition of T1889 tumors, respectively (Fig. 5A and B). Noteworthy, both dosages were well tolerated by the mice (data not shown).
Figure 5.
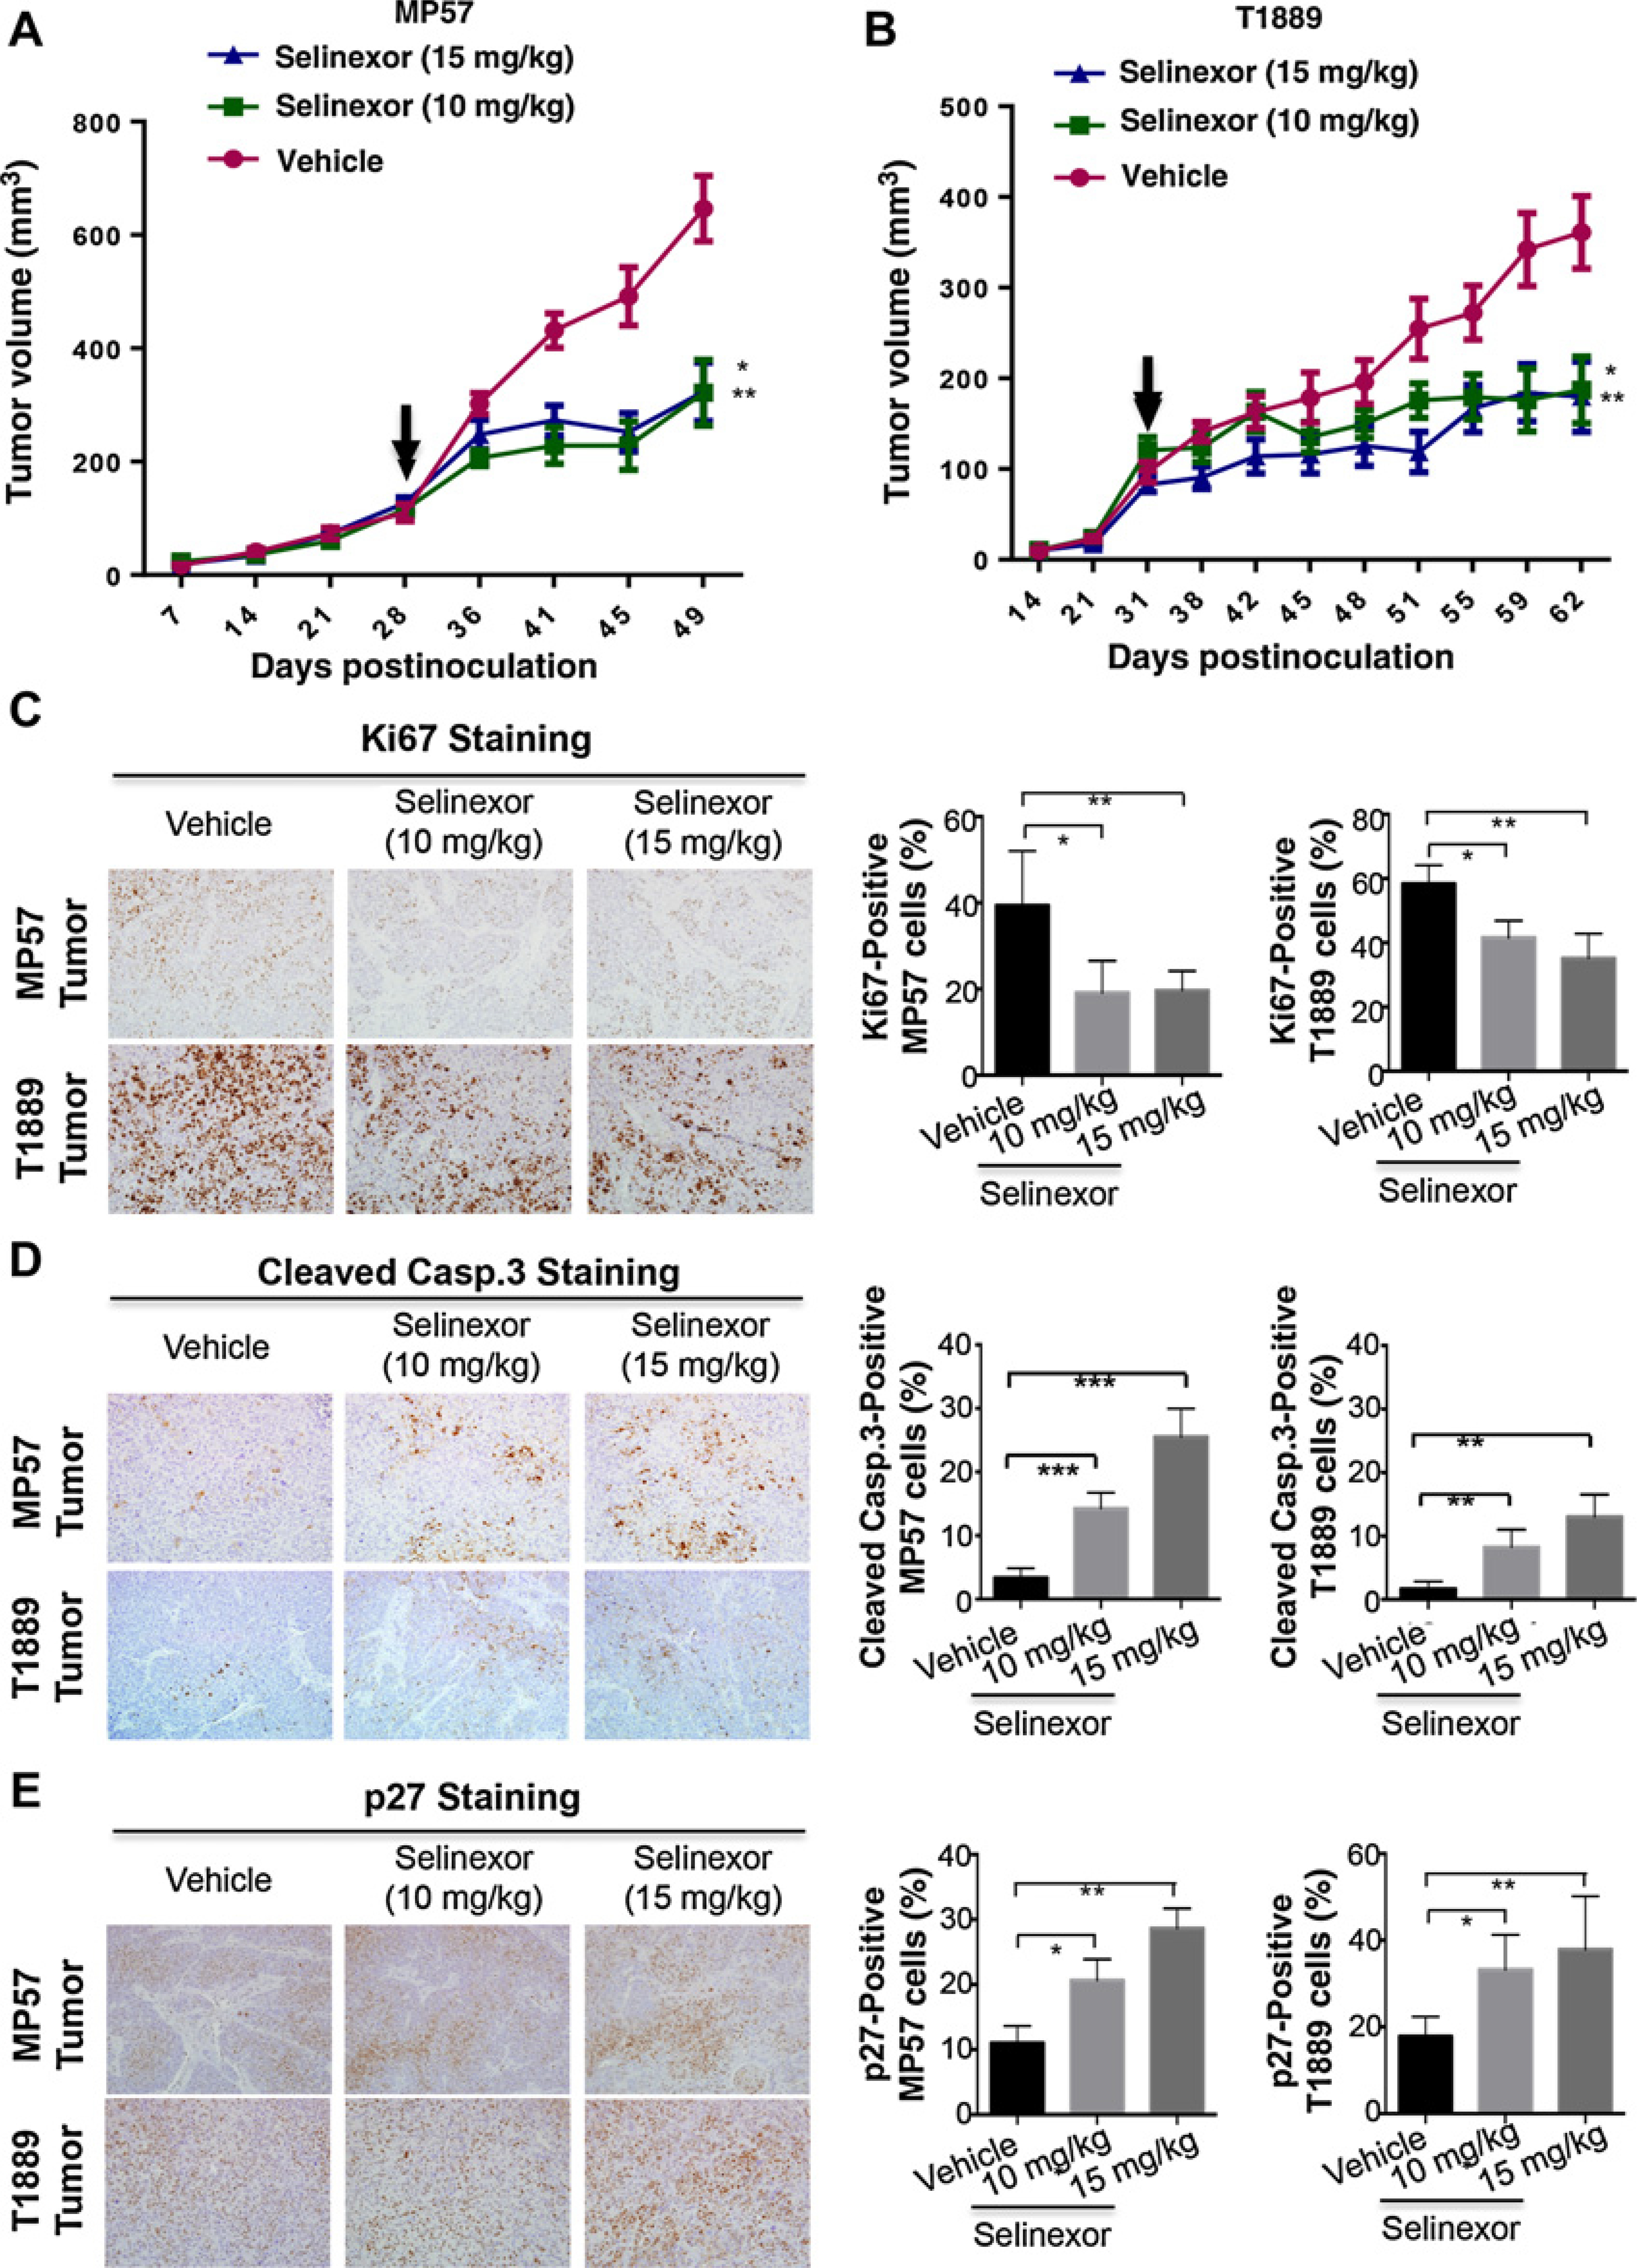
Selinexor exhibits in vivo antitumor activity against TET xenograft tumors. A and B, Growth curves of MP57 and T1889 xenograft tumors in athymic nude mice treated with vehicle or selinexor (10 mg/kg or 15 mg/kg) three times a weeks for 2 weeks. Arrows, when treatment started. Data represent the mean ± SD of tumor volumes (n = 8). *, P < 0.05; **, P < 0.01. C–E, IHC staining of Ki67 (C), cleaved caspase-3 (D), and p27 in MP57 and T1889 tumors (E) after treatment with/without selinexor for 2 weeks. Representative IHC images are shown in the left panels, and quantification of IHC staining results is shown on the right. Histograms represent mean ± SD of percentage of IHC positive cells in three tumors from each group. *, P < 0.05; **, P < 0.01; ***, P < 0.001.
To assess the effects of selinexor, we performed IHC staining of several key markers and XPO1 cargo proteins in the harvested tumors (Fig. 5C–E). Compared with the vehicle control, selinexor treatment resulted in a significant decrease of proliferating cells (Ki67-positive) and increase of apoptotic cells (cleaved caspase-3-positive; Fig. 5C and D). Furthermore, a significant increase of p27-positive cells was observed in the selinexor-treated tumors, confirming the effect of selinexor on XPO1 cargo protein in vivo (Fig. 5E). Together, these preclinical data indicate that XPO1 inhibition is effective in vivo against TETs by inhibiting cell proliferation and inducing apoptosis.
Proteomic profiling of factors and pathways affected by selinexor
To extend the understanding of selinexor antitumor activity, we performed proteomic analyses of the cytoplasmic and nuclear fractions of IU-TAB1 cells treated with DMSO (light state) and selinexor (heavy state) by SILAC approach. Subcellular fractions of nucleus and cytoplasm from each state were subjected to proteomics by digestion with trypsin/LysC, basic RPLC fractionation, and LC-MS/MS analysis. In total, 72 LC-MS/MS runs from three biological replicates resulted in the identification of 3,246 and 1,617 proteins in the nucleus and cytoplasm, respectively (Fig. 6A; Supplementary Tables S1 and S2). With 1.5 fold-change cutoff, abundance of 303 proteins was decreased and of 63 proteins increased in the nucleus, whereas abundance of 185 proteins decreased and of 19 proteins increased in the cytoplasm upon selinexor treatment (Fig. 6A). The volcano plots indicate the affected proteins in the nucleus and cytoplasm with a minimum of 1.5-fold change combined with a P < 0.05 (Fig. 6B).
Figure 6.
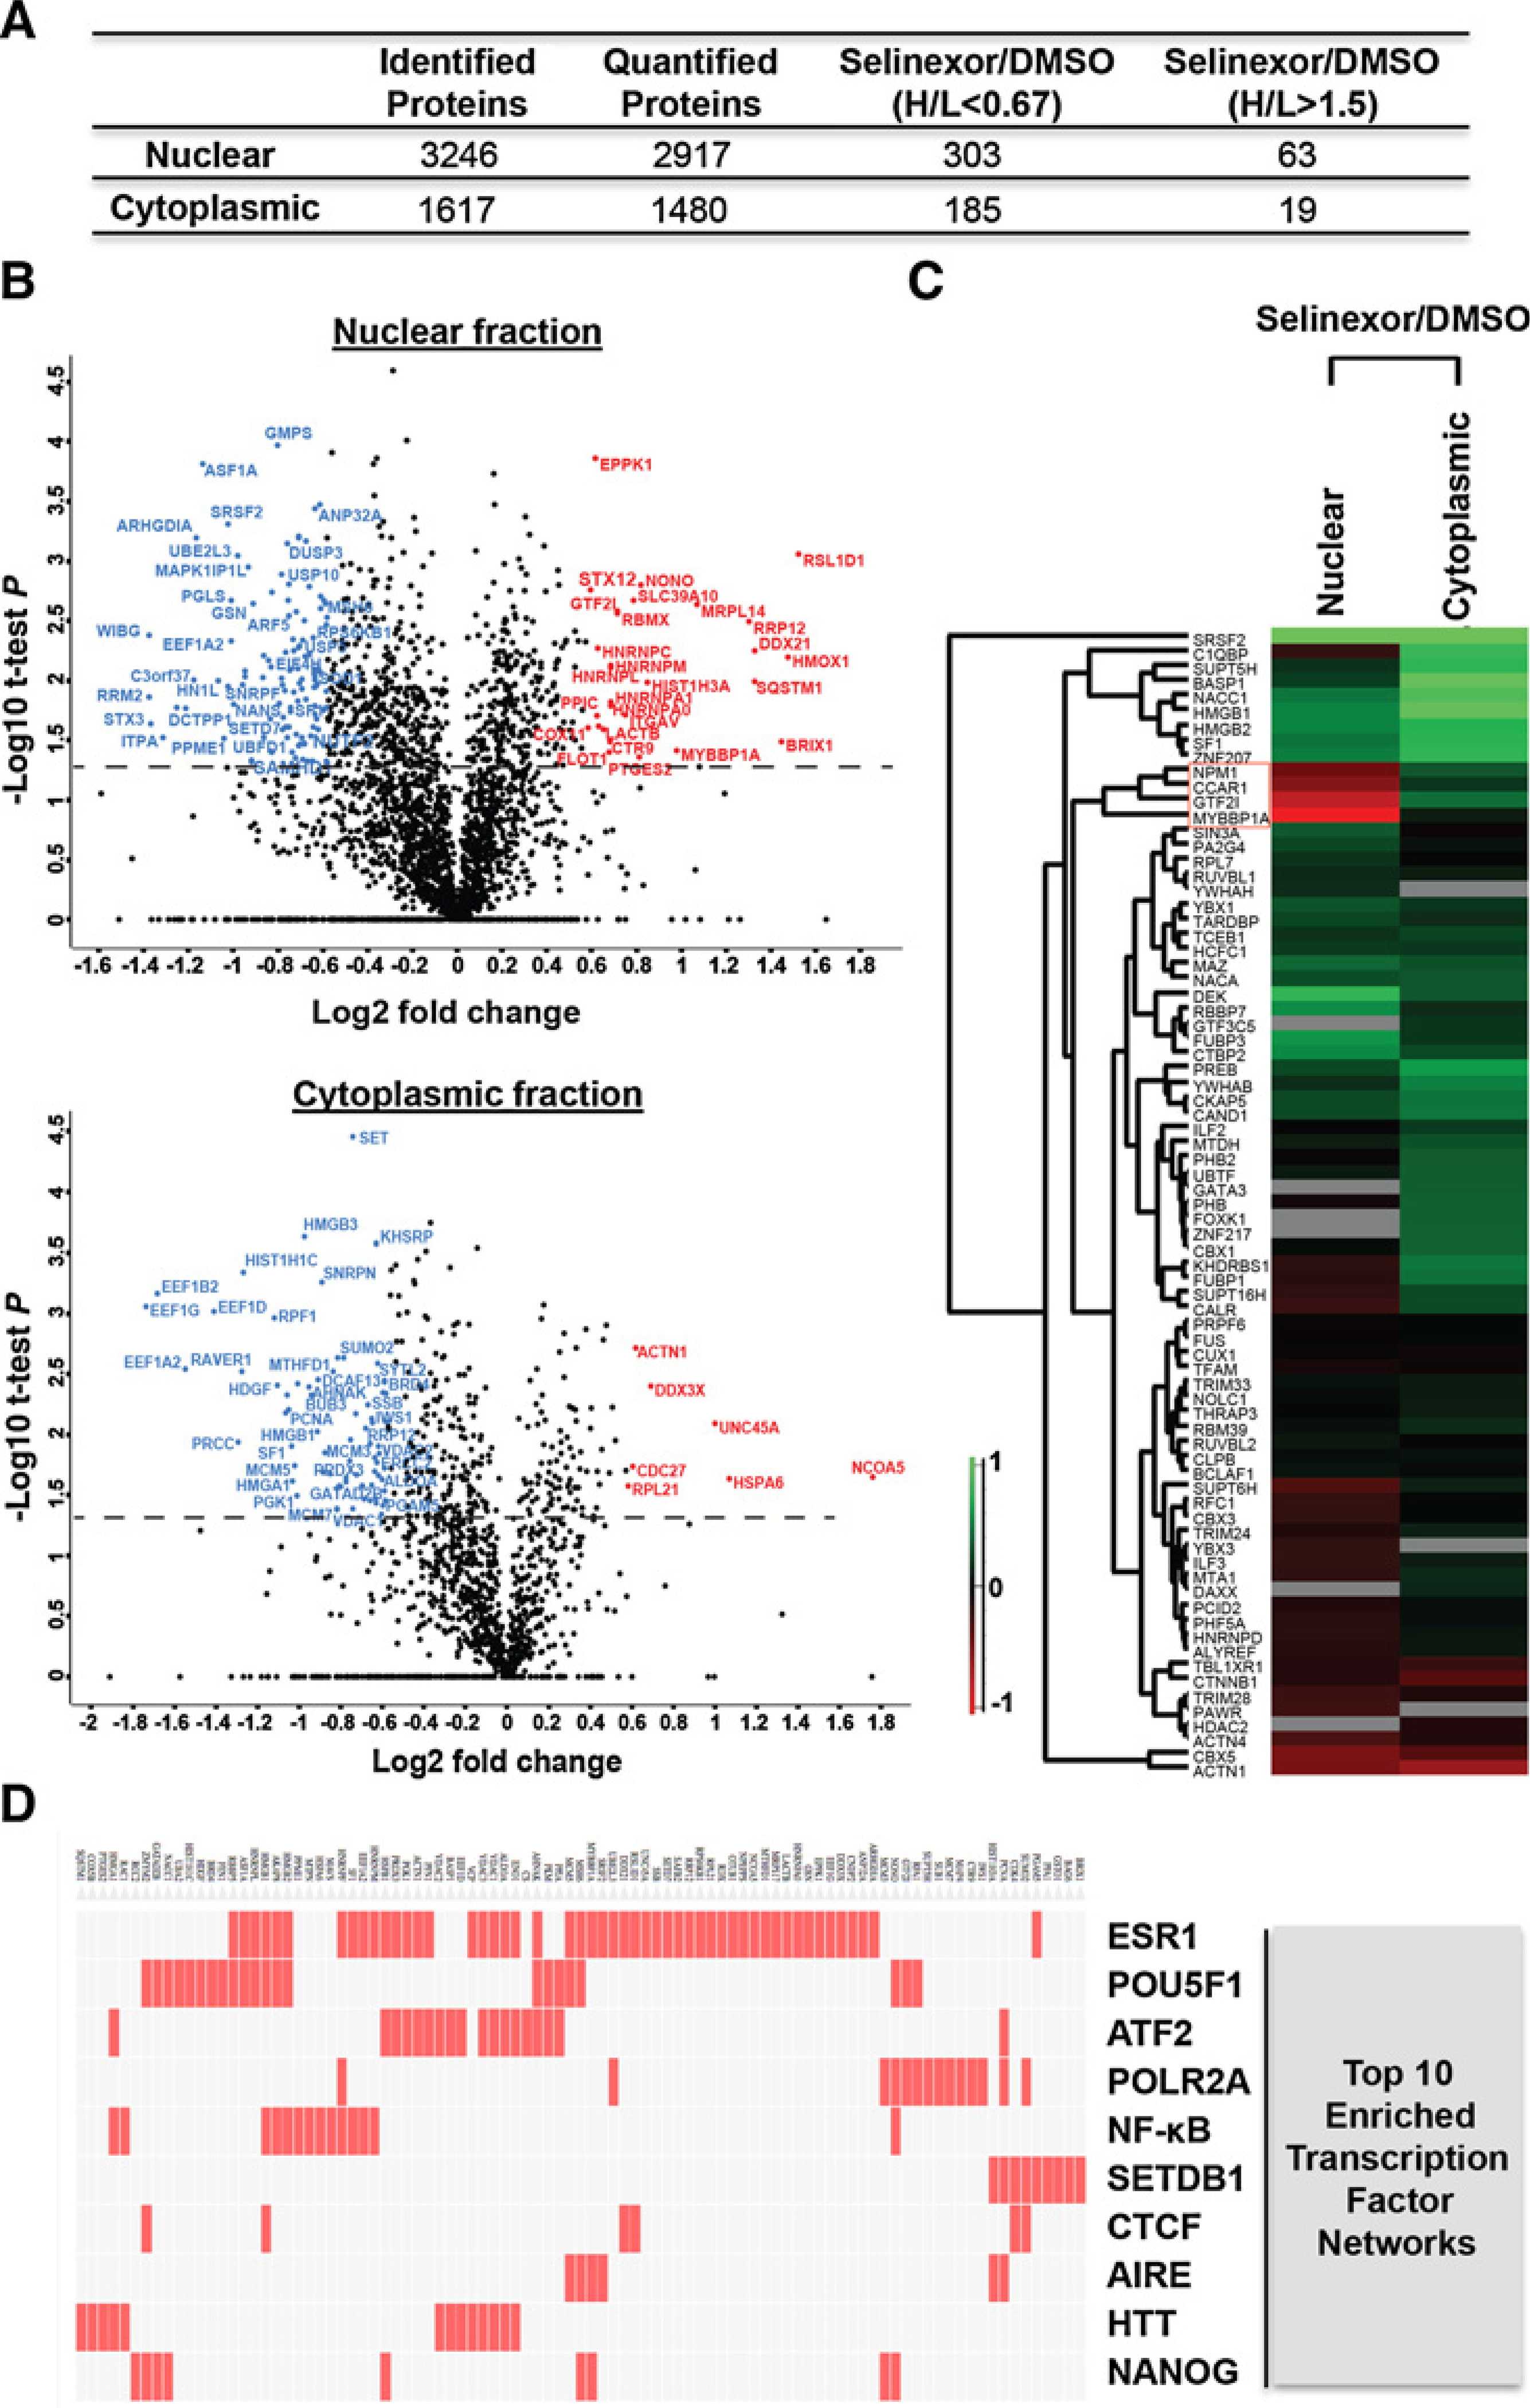
SILAC-based quantitative proteomics of nuclear and cytoplasmic fractions in IU-TAB1 cells affected by selinexor. A, Number of proteins identified and quantified from nuclear and cytoplasmic subcellular fraction of IU-TAB1 cells and the number of proteins with 1.5-fold change upon selinexor treatment (H/L >1.5 or H/L <0.67). B, Statistical analysis of the dynamic changes of the nuclear and cytoplasmic proteins affected by selinexor. Volcano plot represent the difference of protein changes in nucleus or cytoplasm between DMSO and selinexor treatment. Log2 ratios of the fold changes are plotted versus −log10 of the P values derived from a t test. Proteins with a minimum of 1.5-fold change combined with a P value smaller than 0.05 are considered significant. Blue dots, downregulated proteins; red dots, upregulated proteins. C, Hierarchical clustering of all the quantified transcription factors based on the ratios of drug treatment. Columns represent different subcellular fractions. Rows represent quantified transcription factors. D, Top 10 enriched transcription factor protein–protein interaction networks analyzed by Clustergram. Red cells in the matrix indicate significantly changed proteins that interact with the corresponding transcription factor.
Interestingly, hierarchical clustering of 78 quantified transcription factors based on the SILAC ratio of selinexor over DMSO treatment (H/L) showed specific clusters of transcription factors whose abundance significantly changed in the opposite direction between the nucleus and cytoplasm (Fig. 6C). In particular, NPM1, CCAR1, GTF2I, and MYBBP1A decreased in cytoplasm and increased in the nuclear fraction (Fig. 6C), suggesting potential enhancement of transcription of genes regulated by these transcription factors upon XPO1 inhibition. Gene set enrichment analysis using a published transcription factor protein–protein interaction library (24) identified several significantly enriched transcription factor networks, including the NF-κB (Fig. 6D). In addition, a list of p53 network proteins was also significantly altered by selinexor (Supplementary Tables S3 and S4). Furthermore, Ingenuity Pathway Analysis (IPA) identified various enriched networks and canonical pathways affected by selinexor (Supplementary Tables S3 and S5). The effect of XPO1 inhibition on these transcriptional programs and functional networks/pathways likely contributes to the antitumor activity of selinexor cumulatively.
High XPO1 expression is associated with aggressive histotypes and advanced stages of TETs and poor patient survival
To evaluate whether targeting XPO1 is clinically relevant, we assessed XPO1 expression by IHC in all 6 different histological subtypes of TETs using a tissue microarray consisting of 132 TETs and 16 histologically normal thymic tissues (Fig. 7; Supplementary Fig. S3A–S3C; ref. 14). TET samples were mainly collected from primary surgery, and survival was assessable in all patients with a median follow-up of 82 months (95% CI, 68–94 months). Fourteen samples were excluded due to poor staining quality, and a total 118 TETs were evaluated for association study (Fig. 7A).
Figure 7.
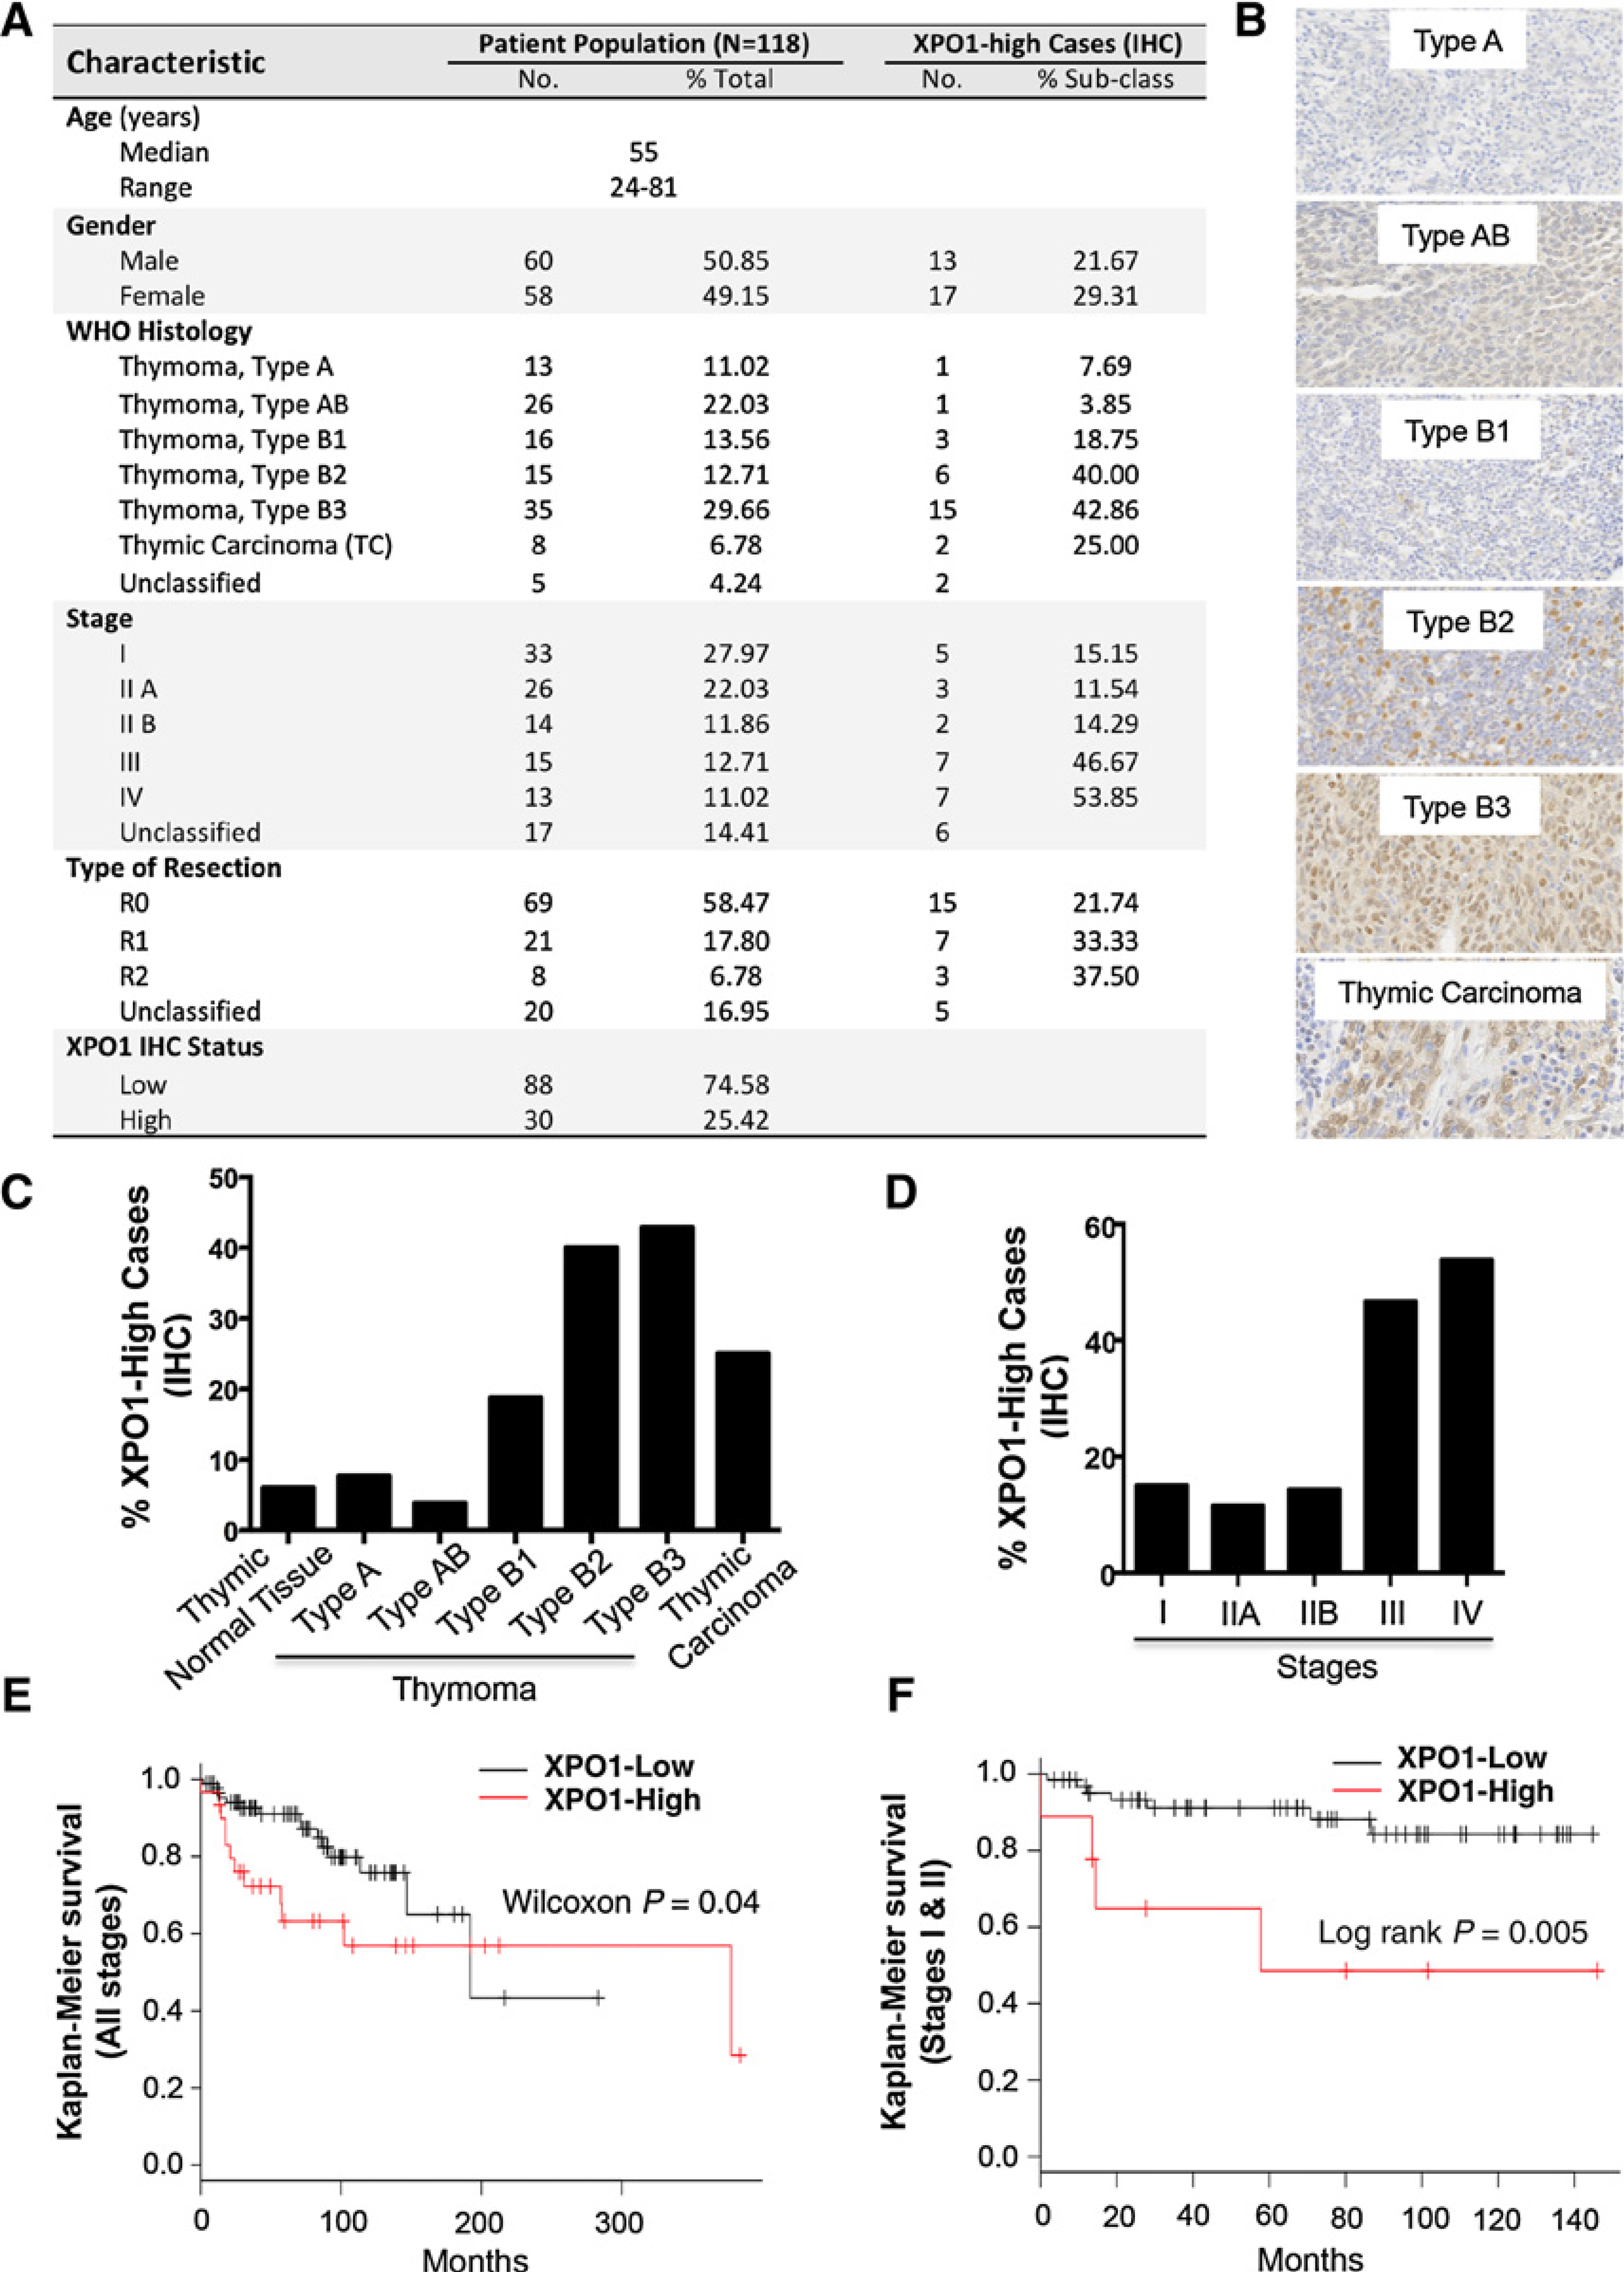
High XPO1 expression is associated with aggressive histotypes and advanced stages of human TETs as well as poorer patient survival. A, Characteristic of patient population and XPO1 expression statuses. B, Representative images of XPO1 IHC staining in different histotypes of thymomas and thymic carcinomas. C, Percentage of XPO1-high cases relative to the cases of each histological subtype. For comparison, normal thymic tissues were also examined. D, Percentage of XPO1-high cases relative to the analyzed cases of TETs in each corresponding stage. E and F, Kaplan–Meier patient survival curves plotted according to the XPO1 expression levels (XPO1-high versus XPO1-low) in the TETs at all stages (E) or at early stages (I–II; F).
Analysis of XPO1 staining took into consideration both the percentage of positive cells and intensity of the staining, as previously described (25). We defined samples with final IHC scores of 0 to 6 as XPO1-low and 7 to 12 as XPO1-high. Based on this cutoff, we found a significant association between high XPO1 and more aggressive histological subtypes of TETs (χ2 test, P = 0.003), as higher percentages of thymomas type B2, B3, and thymic carcinoma (TC) expressed high XPO1 (Fig. 7A–C). High XPO1 were also significantly correlated with advanced stages of disease (10%–15% cases in stages I–II versus 50% cases in stages III–IV; P = 0.0006; Fig. 7A and D). Furthermore, a significant association between high XPO1 and poorer overall survival (OS) was observed (Wilcoxon P = 0.04; HR 2.025; 95% CI, 0.9188–4.463; Fig. 7E). Interestingly, higher XPO1 expression was a significant predictor of worse survival for stage I–II patients (median OS not reached in XPO1-low vs. 58 months in XPO1-high; P < 0.005; Fig. 7F), but not for patients at stage III–IV (Supplementary Fig. S3C). Finally, XPO1 expression retained its prognostic value in a Cox multivariate analysis of main known prognostic factors in TETs, including histologic grade, stage of disease, and completeness of surgery (HR 3.6; 95% CI, 1.3–10.2; P = 0.01).
Discussion
TETs are rare tumors originated from thymic epithelia, and therapeutic options are limited for advanced-stage diseases (26–28). Development of targeted therapy for TETs has been hampered by insufficient knowledge of their tumor biology and scarcity of targetable oncogenic driver abnormalities (28). In this study, we took an unconventional targeted approach to explore a potential therapeutic strategy for TETs by targeting XPO1. The concept of this strategy is to boost tumor suppressor activity by inhibiting XPO1-mediated nuclear export of key TSPs, thereby eliciting antitumor activity. XPO1 is highly expressed in TETs, and its inhibitor selinexor significantly increased nuclear p53, p27, and FOXO3a and induced antitumor activities at clinically achievable concentrations (29). Importantly, selinexor displayed less cytotoxicity in normal thymic epithelial cells, indicating its specificity against tumor cells (7).
XPO1 regulates nuclear–cytoplasmic shuttling of key cell-cycle regulators with different roles in G1–S and G2–M transition (7). Indeed, XPO1 inhibition induced cell-cycle arrest, albeit with varies of G1 and/or G2 arrest in different lines, likely due to different status and/or regulation of these cell-cycle regulators under different cellular contexts. The ability of selinexor to block cell cycle is intriguing in light of the encouraging antitumor activity of the CDK-inhibitor milciclib in TETs (30).
Along with the cell-cycle effect, selinexor induced apoptosis of TET cells, a crucial aspect of the antitumor activity resulted from XPO1 inhibition. Selinexor-induced apoptosis could be explained in part by the significant induction of the proapoptotic proteins BIM and BAX, which are not directly regulated by XPO1 but transcriptionally controlled by XPO1 cargoes such as p53 and/or FOXO3a proteins (4, 7, 19, 20). Interestingly, p53 and FOXO3a appeared to be differently needed for selinexor cytotoxicity in different cell lines, a likely reflection of different statuses of p53/FOXO3a and/or of their networking molecules in the cells. Importantly in the selinexor-resistant T1682 cell line, p53 deficiency is the primary cause of resistance, and p53 reinstallation leads to selinexor resensitization. Notably, about 20% human TETs harbor p53 inactivating mutations, indicating the importance of p53 loss in TET pathogenesis (21–23). Unlike p53, the tumor suppressor activity of FOXO3a could be diminished by other mechanisms, for instance, overactivation of the PI3K–AKT pathway, which causes XPO1-dependent cytoplasmic entrapment of FOXO3a (4, 7). It is clear, however, that the antitumor activity of selinexor in TETs may depend on p53, FOXO3a, and/or other XPO1 cargo proteins, even though p53 seems to be particularly important in most cases. While loss of p53 activity can cause resistance to the XPO1 inhibitor under certain circumstances, other alterations such as XPO1 amplification may also contribute to the resistance. Our conclusions are also supported by other studies that indicated that in certain tumors, expression of certain TSPs is needed for selinexor sensitivity, whereas in other tumors, inactivation of these TSPs does not affect drug sensitivity (18, 31–34).
The SILAC-based LC-MS/MS proteomic analysis has enabled us to profile the global impact of XPO1 inhibition on cellular factors/pathways/networks in the TET cells. In line with the changes of hundreds of XPO1 cargo proteins (4, 7), we found significant enrichment of several important pathways/networks that are functionally relevant to XPO1 inhibition. Among them include networks of “DNA replication, recombination and repair,” “cellular growth and proliferation,” and “cell death and survival” (Supplementary Table S3), and the sum of these changes likely reflects the overall antitumor effect of selinexor. Nonetheless, the most interesting observation from the proteomics analysis is the deep impact of XPO1 inhibition on the transcriptional programs. Selinexor treatment causes a prominent shift in the abundance of nearly 80 different transcription factors in the nucleus and cytoplasm, with NPM1, CCAR1, GTF2I, and MYBBP1A being the most affected ones.
Both MYBBP1A and NPM1 are known XPO1 cargoes. MYBBP1A can bind to p53 and enhance the transcription of p53 target genes (35, 36), and its inhibition significantly enhanced tumorigenesis (35). MYBBP1A can also interact with NF-κB and inhibit NF-κB–dependent transcription (36). On the other hand, NPM1 is involved in many cellular functions, which require continuous nuclear–cytoplasmic shuttling of NPM1 (37). Notably, NPM1 has been characterized as the most frequently mutated gene in acute myeloid leukemia, and the most frequent frameshift mutation at its exon 12 results in an additional nuclear export signal recognized by XPO1, leading to aberrant nuclear export and stable cytosolic localization of NPM1 (37). Evidence suggests that when mislocalized in the cytoplasm NPM1 acquires oncogenic properties and alters cell-cycle and apoptotic regulation (37).
Unlike NPM1 and MABBP1A, however, GTF2I and CCAR1 are not known cargoes of XPO1. The identification of GTF2I as one of the top transcription factors in TET cells affected by XPO1 inhibition is of particular interest. In our recent study, we reported the identification of a single highly frequent mutation in the GTF2I gene in a large cohort of human TETs (22). GTF2I is a general transcription factor that regulates many target gene expression, and its two major splicing isoforms have been shown to exert opposite transcriptional activities due to differences in their subcellular localizations (38). The shift in the subcellular location of GTF2I from the cytoplasm to the nucleus after XPO1 inhibition reported in this study as well as recently documented (39) suggests that the nuclear–cytoplasmic shuttling of GTF2I is somehow regulated by XPO1. Further study will be required to determine whether nuclear entrapment of these transcription factors contributes to the antitumor activity of selinexor.
Even though the impact of selinexor on the p53 and NF-κB proteins was evident in Western blot and immunofluorescence analyses, both proteins were not identified by the LC-MS/MS approach. This is not a surprise as protein identification with mass spectrometry is a stochastic process and depends on multiple variables. Nevertheless, the proteomics analysis revealed a significant enrichment of a numbers of proteins in the networks of p53 or NF-κB. NF-κB is an important transcription factor that regulates many cellular processes including cell proliferation and survival. Although not functionally examined in this study, inhibition of NF-κB by selinexor likely plays a role in the selinexor-induced cytotoxicity in TETs as well. Recently, it was shown that a synthetic–lethal interaction of XPO1 inhibition with KRAS mutation in NSCLC cells requires its inhibition of NF-κB transcription factor activity (34).
Most importantly, targeting XPO1 in TETs is not only biologically achievable and effective but also clinically relevant. A recent phase I study indicates clinical activity of selinexor in patients with TETs. Four patients with TETs were enrolled in this trial, of which 1 patient obtained partial response, 2 patients had stable disease lasting more than 4 months, and 1 patient had stable disease lasting less than 4 months (8). Here, we demonstrated that XPO1 is highly expressed in a subset of human TETs, and overexpression of XPO1 is significantly associated with aggressive histological subtypes, advanced stage of disease, and poor patient survival. These data together with the antitumor activity of selinexor in the preclinical TET models support clinical development of XPO1 targeted therapy for the treatment of TETs. In fact, we are on the process of launching a phase II trial of selinexor in TET patients.
Supplementary Material
Acknowledgments
We thank Yossi Landesmann at the Karyopharm Therapeutics for providing critical advice and Karen Creswell and the staff at the Flow Cytometry and Cell Sorting Shared Resource of Lombardi Comprehensive Cancer Center for their technical support with FACS.
Grant Support
The study was supported by the Lombardi Comprehensive Cancer Center, Georgetown University, a funding from Karyopharm Therapeutics (to G. Giaccone), and the NCI Center for Cancer Research Intramural Research Program (to U. Guha). J.A. Rodriguez was funded by a MINECO-FEDER Grant SAF2014–57743-R.
Footnotes
Disclosure of Potential Conflicts of Interest
No potential conflicts of interest were disclosed.
Supplementary data for this article are available at Cancer Research Online (http://cancerres.aacrjournals.org/).
References
- 1.Weinstein IB, Joe AK. Mechanisms of disease: oncogene addiction—a rationale for molecular targeting in cancer therapy. Nat Clin Pract Oncol 2006;3:448–57. [DOI] [PubMed] [Google Scholar]
- 2.Hanahan D, Weinberg RA. Hallmarks of cancer: the next generation. Cell 2011;144:646–74. [DOI] [PubMed] [Google Scholar]
- 3.Tran EJ, King MC, Corbett AH. Macromolecular transport between the nucleus and the cytoplasm: advances in mechanism and emerging links to disease. Biochim Biophys Acta 2014;1843:2784–95. [DOI] [PMC free article] [PubMed] [Google Scholar]
- 4.Tan DS, Bedard PL, Kuruvilla J, Siu LL, Razak AR. Promising SINEs for embargoing nuclear–cytoplasmic export as an anticancer strategy. Cancer Discov 2014;4:527–37. [DOI] [PubMed] [Google Scholar]
- 5.Kudo N, Matsumori N, Taoka H, Fujiwara D, Schreiner EP, Wolff B, et al. Leptomycin B inactivates CRM1/exportin 1 by covalent modification at a cysteine residue in the central conserved region. Proc Natl Acad Sci U S A 1999;96:9112–7. [DOI] [PMC free article] [PubMed] [Google Scholar]
- 6.Newlands ES, Rustin GJ, Brampton MH. Phase I trial of elactocin. Br J Cancer 1996;74:648–9. [DOI] [PMC free article] [PubMed] [Google Scholar]
- 7.Conforti F, Wang Y, Rodriguez JA, Alberobello AT, Zhang YW, Giaccone G. Molecular pathways: anticancer activity by inhibition of nucleocytoplasmic shuttling. Clin Cancer Res 2015;21:4508–13. [DOI] [PubMed] [Google Scholar]
- 8.Abdul Razak AR, Mau-Soerensen M, Gabrail NY, Gerecitano JF, Shields AF, Unger TJ, et al. First-in-class, first-in-human phase i study of selinexor, a selective inhibitor of nuclear export, in patients with advanced solid tumors. J Clin Oncol 2016;34:4142–50. [DOI] [PMC free article] [PubMed] [Google Scholar]
- 9.Ehemann V, Kern MA, Breinig M, Schnabel PA, Gunawan B, Schulten HJ, et al. Establishment, characterization and drug sensitivity testing in primary cultures of human thymoma and thymic carcinoma. Int J Cancer 2008;122:2719–25. [DOI] [PubMed] [Google Scholar]
- 10.Gokmen-Polar Y, Sanders KL, Goswami CP, Cano OD, Zaheer NA, Jain RK, et al. Establishment and characterization of a novel cell line derived from human thymoma AB tumor. Lab Invest 2012;92:1564–73. [DOI] [PubMed] [Google Scholar]
- 11.Beaudette-Zlatanova BC, Knight KL, Zhang S, Stiff PJ, Zuniga-Pflucker JC, Le PT. A human thymic epithelial cell culture system for the promotion of lymphopoiesis from hematopoietic stem cells. Exp Hematol 2011;39:570–9. [DOI] [PMC free article] [PubMed] [Google Scholar]
- 12.O’Neil RT, Wei Q, Condie BG. High efficiency transfection of thymic epithelial cell lines and primary thymic epithelial cells by Nucleofection. Nature Preced. doi: 10.1038/npre.2011.6283.1. [DOI] [Google Scholar]
- 13.Alberobello AT, Wang Y, Beerkens FJ, Conforti F, McCutcheon JN, Rao G, et al. PI3K as a potential therapeutic target in thymic epithelial tumors. J Thorac Oncol 2016;11:1345–56. [DOI] [PMC free article] [PubMed] [Google Scholar]
- 14.Zucali PA, Petrini I, Lorenzi E, Merino M, Cao L, Di Tommaso L, et al. Insulin-like growth factor-1 receptor and phosphorylated AKT-serine 473 expression in 132 resected thymomas and thymic carcinomas. Cancer 2010;116:4686–95. [DOI] [PMC free article] [PubMed] [Google Scholar]
- 15.Zhang X, Belkina N, Jacob HK, Maity T, Biswas R, Venugopalan A, et al. Identifying novel targets of oncogenic EGF receptor signaling in lung cancer through global phosphoproteomics. Proteomics 2015;15(2–3):340–55. [DOI] [PMC free article] [PubMed] [Google Scholar]
- 16.R-Core-Team. R: A language and environment for statistical computing. R Foundation for Statistical Computing, Vienna, Austria; 2013. http://www.R-project.org/. [Google Scholar]
- 17.Harhaj EW, Sun SC. Regulation of RelA subcellular localization by a putative nuclear export signal and p50. Mol Cell Biol 1999;19:7088–95. [DOI] [PMC free article] [PubMed] [Google Scholar]
- 18.Kashyap T, Argueta C, Aboukameel A, Unger TJ, Klebanov B, Mohammad RM, et al. Selinexor, a Selective inhibitor of nuclear export (SINE) compound, acts through NF-kappaB deactivation and combines with proteasome inhibitors to synergistically induce tumor cell death. Oncotarget 2016;7:78883–95. [DOI] [PMC free article] [PubMed] [Google Scholar]
- 19.Monsalve M, Olmos Y. The complex biology of FOXO. Curr Drug Targets 2011;12:1322–50. [DOI] [PubMed] [Google Scholar]
- 20.Fridman JS, Lowe SW. Control of apoptosis by p53. Oncogene 2003;22:9030–40. [DOI] [PubMed] [Google Scholar]
- 21.Petrini I, Meltzer PS, Zucali PA, Luo J, Lee C, Santoro A, et al. Copy number aberrations of BCL2 and CDKN2A/B identified by array-CGH in thymic epithelial tumors. Cell Death Dis 2012;3:e351. [DOI] [PMC free article] [PubMed] [Google Scholar]
- 22.Petrini I, Meltzer PS, Kim IK, Lucchi M, Park KS, Fontanini G, et al. A specific missense mutation in GTF2I occurs at high frequency in thymic epithelial tumors. Nat Genet 2014;46:844–9. [DOI] [PMC free article] [PubMed] [Google Scholar]
- 23.Wang Y, Thomas A, Lau C, Rajan A, Zhu Y, Killian JK, et al. Mutations of epigenetic regulatory genes are common in thymic carcinomas. Sci Rep 2014;4:7336. [DOI] [PMC free article] [PubMed] [Google Scholar]
- 24.Kuleshov MV, Jones MR, Rouillard AD, Fernandez NF, Duan Q, Wang Z, et al. Enrichr: a comprehensive gene set enrichment analysis web server 2016 update. Nucleic Acids Res 2016;44(W1):W90–7. [DOI] [PMC free article] [PubMed] [Google Scholar]
- 25.Noske A, Weichert W, Niesporek S, Roske A, Buckendahl AC, Koch I, et al. Expression of the nuclear export protein chromosomal region maintenance/exportin 1/Xpo1 is a prognostic factor in human ovarian cancer. Cancer 2008;112:1733–43. [DOI] [PubMed] [Google Scholar]
- 26.Zucali PA, Di Tommaso L, Petrini I, Battista S, Lee HS, Merino M, et al. Reproducibility of the WHO classification of thymomas: practical implications. Lung Cancer 2013;79:236–41. [DOI] [PMC free article] [PubMed] [Google Scholar]
- 27.Strobel P, Hohenberger P, Marx A. Thymoma and thymic carcinoma: molecular pathology and targeted therapy. J Thorac Oncol 2010;5(10 Suppl 4):S286–90. [DOI] [PubMed] [Google Scholar]
- 28.Kelly RJ, Petrini I, Rajan A, Wang Y, Giaccone G. Thymic malignancies: from clinical management to targeted therapies. J Clin Oncol 2011;29:4820–7. [DOI] [PMC free article] [PubMed] [Google Scholar]
- 29.Lassen U, Mau-Soerensen M, Kung AL, Wen PY, Lee EQ, Plotkin SR, et al. A phase 2 study on efficacy, safety and intratumoral pharmacokinetics of oral selinexor (KPT-330) in patients with recurrent glioblastoma (GBM). 2015. J Clin Oncol. p suppl; abstract2044. [Google Scholar]
- 30.Besse B, Garassino MC, Rajan A, Novello S, Mazieres J, Weiss GJ, et al. A phase II study of milciclib (PHA-848125AC) in patients (pts) with thymic carcinoma (TC). 2014. Journal of Clinical Oncology. p suppl: abstract 7526. [Google Scholar]
- 31.Kojima K, Kornblau SM, Ruvolo V, Dilip A, Duvvuri S, Davis RE, et al. Prognostic impact and targeting of CRM1 in acute myeloid leukemia. Blood 2013;121:4166–74. [DOI] [PMC free article] [PubMed] [Google Scholar]
- 32.Yoshimura M, Ishizawa J, Ruvolo V, Dilip A, Quintas-Cardama A, McDonnell TJ, et al. Induction of p53-mediated transcription and apoptosis by exportin-1 (XPO1) inhibition in mantle cell lymphoma. Cancer Sci 2014;105:795–801. [DOI] [PMC free article] [PubMed] [Google Scholar]
- 33.Nakayama R, Zhang YX, Czaplinski JT, Anatone AJ, Sicinska ET, Fletcher JA, et al. Preclinical activity of selinexor, an inhibitor of XPO1, in sarcoma. Oncotarget 2016;7:16581–92. [DOI] [PMC free article] [PubMed] [Google Scholar]
- 34.Kim J, McMillan E, Kim HS, Venkateswaran N, Makkar G, Rodriguez-Canales J, et al. XPO1-dependent nuclear export is a druggable vulnerability in KRAS-mutant lung cancer. Nature 2016;538:114–17. [DOI] [PMC free article] [PubMed] [Google Scholar]
- 35.Akaogi K, Ono W, Hayashi Y, Kishimoto H, Yanagisawa J. MYBBP1A suppresses breast cancer tumorigenesis by enhancing the p53 dependent anoikis. BMC Cancer 2013;13:65. [DOI] [PMC free article] [PubMed] [Google Scholar]
- 36.Owen HR, Elser M, Cheung E, Gersbach M, Kraus WL, Hottiger MO. MYBBP1a is a novel repressor of NF-kappaB. J Mol Biol 2007;366:725–36. [DOI] [PubMed] [Google Scholar]
- 37.Falini B, Bolli N, Liso A, Martelli MP, Mannucci R, Pileri S, et al. Altered nucleophosmin transport in acute myeloid leukaemia with mutated NPM1: molecular basis and clinical implications. Leukemia 2009;23:1731–43. [DOI] [PubMed] [Google Scholar]
- 38.Roy AL. Biochemistry and biology of the inducible multifunctional transcription factor TFII-I. Gene 2001;274:1–13. [DOI] [PubMed] [Google Scholar]
- 39.Kirli K, Karaca S, Dehne HJ, Samwer M, Pan KT, Lenz C, et al. A deep proteomics perspective on CRM1-mediated nuclear export and nucleocytoplasmic partitioning. Elife 2015;4:e11466. doi: 10.7554/eLife.11466. [DOI] [PMC free article] [PubMed] [Google Scholar]
Associated Data
This section collects any data citations, data availability statements, or supplementary materials included in this article.