

Abstract
Purpose
Compared to their urban counterparts, U.S. residents in rural settings face an increased risk of premature mortality and health problems that have been linked to insufficient physical activity (PA) levels. There is limited literature regarding urban-rural differences in adherence to national guidelines for all three PA-related behaviors.
Methods
We investigated urban-rural differences in aerobic PA, leisure-time muscle strengthening PA, and leisure screen-time sedentary behavior in a combined data set of the 2011-2014 waves (N=14,188) of the nationally representative National Cancer Institute’s Health Information National Trends Survey.
Findings
We found no evidence of a difference between large-urban and rural residents’ aerobic PA levels. The typical number of weekly bouts of leisure-time muscle strengthening PA was 25% lower for rural residents (Incidence rate ratio (IRR) =0.751, P < .001); this relationship was no longer statistically significant after controlling for potentially confounding covariates. In adjusted models, we found rural residents to engage in 6.6% less daily leisure screen-time sedentary behavior than their large-urban counterparts (IRR =0.934, P = .031).
Conclusions
Taken together with previous literature, these results suggest that rural residents may engage in comparable levels of total PA, but less leisure-time PA than their urban counterparts.
Keywords: physical activity, resistance training, sedentary behavior, health disparities
Introduction
Compared to their urban counterparts, U.S. residents who reside in rural settings face an increased risk of premature mortality and health problems such as coronary heart disease,1-3 type II diabetes,1, 2 obesity,4 and numerous types of cancer (including cervical, colorectal, kidney, and lung cancer).5 Many of these health challenges have been linked to insufficient physical activity (PA) levels, and it may be that some of the elevated burden of morbidity and premature mortality afflicting rural communities is attributable to lifestyle factors such as lower PA levels.6 In the 2008 PA Guidelines for Americans, the U.S. Department of Health and Human Services put forth recommendations for three distinct PA-related behaviors: aerobic PA, muscle strengthening PA, and sedentary behavior.7 Adherence to recommended guidelines in the U.S. is generally low,8, 9 but these PA-related behavior patterns may vary by setting. Previous literature has indicated that rural communities, often defined as non-metropolitan counties,10 may face unique challenges to engaging in PA associated with the built environment, such as less access to: community resources such as parks/green spaces, walkable destinations, and public transportation.11, 12 Such barriers faced by rural communities may be compounded by differences in social factors, such as a lack of presence of physically active role models, increased caregiving duties, and less social support for engaging in PA.13, 14
Existing evidence indicates that rural residents may engage in less leisure-time aerobic PA than their urban counterparts.13, 15-20 However, this literature is limited for several reasons, including categorizing leisure-time aerobic PA instead of treating it as a continuous variable and using listwise deletion to handle missing data (which implicitly assumes that missing data are missing completely at random and independent of either observed or unobserved data).21, 22 Using accelerometer data of a nationally representative sample, Fan and associates (2014) found no difference between urban and rural residents’ total aerobic PA levels; these authors did note that PA patterns differed such that rural residents engaged in less vigorous-intensity PA, and suggested that urban-rural health disparities may be attributable in part to this difference, or, alternatively, due to differences in other PA-related behaviors.23
Limited literature has investigated differences in the other PA-related behaviors corresponding to national guidelines. One study conducted by Trivedi et al (2015) found U.S. rural residents to be slightly more likely to engage in four hours or more of leisure screen-time sedentary behavior (this is a subset of total sedentary behavior that may be particularly health-compromising).24-26 To our knowledge, no studies have examined urban-rural differences with respect to muscle-strengthening PA. These are noteworthy limitations in the literature because these behaviors have been directly linked to important health outcomes,27-33 and may be important factors contributing to urban-rural health disparities.
We investigated these gaps in the literature by testing for urban-rural differences in: aerobic PA levels, leisure-time muscle strengthening PA levels, and leisure screen-time sedentary behavior in a combined dataset of the 2011-2014 waves of the nationally representative National Cancer Institute (NCI)’s Health Information National Trends Survey (HINTS). Furthermore, since previous literature has indicated that urban-rural differences in leisure-time aerobic PA may be especially pronounced in the Southern U.S.,16, 18 we examined interactions between urban-rural status and PA behaviors by geographic region. We hypothesized that, compared to their counterparts in large urban areas, residents of rural (ie non-metropolitan) counties would report lower levels of aerobic and leisure-time muscle strengthening PA, and higher levels of leisure screen-time sedentary behavior; we hypothesized that these differences would persist after controlling for potentially confounding variables, and that this relationship would be especially pronounced in the Southern U.S.
Methods
Study Design and Population
HINTS 4 was a nationally representative cross-sectional survey of U.S. non-institutionalized adults conducted by NCI to gather data on patterns of health communication and information access, as well as cancer-related knowledge, behavior, and risk. The current study examined data combined from four waves of this study: HINTS 4 Cycle 1 (N=3,959; conducted from October 2011 to February 2012), HINTS 4 Cycle 2 (N=3,630; conducted from October 2012 to January 2013), HINTS 4 Cycle 3 (N=3,185; conducted from September 2013 to December 2013), and HINTS 4 Cycle 4 (N=3,677; conducted from August 2014 to November 2014). The final response rates for HINTS 4 Cycles 1, 2, 3, and 4 were 36.7%, 40.0%, 35.2%, and 34.4%, respectively. HINTS 4 Cycle 1 also contained an imbedded experiment in which for about 1/6th of households all adults were asked to complete the survey instead of only the person with the next birthday. To remove this dependency in the data, only one participant from each household, selected at random (due to not having complete birth and survey completion dates), was included in all analyses.
Survey Items
HINTS 4 survey items were derived from existing surveys (eg, The Center for Disease Control and Prevention’s Behavioral Risk Factor Surveillance System) and authored by NCI staff. NCI conducted extensive cognitive interviewing to ensure the validity of survey items.34 This process included conducting 33 interviews in English and 17 in Spanish in a factorial design, with participants testing multiple survey versions. Interviewers garnered feedback on various versions of survey items with a mix of concurrent and retrospective probes to help establish the validity of the finalized items used in the current study.
Demographics
Demographic items used in this study included participant’s self-reported age, gender, race, ethnicity, marital status, level of educational attainment, occupational status, general health status, insurance coverage status, income range, height, and weight. Body mass index (BMI) was calculated from height and weight.
Urban-rural designation
Urban-rural status categories were derived from each residence’s (2003) Rural-Urban Continuum Code (RUCC), which is set decennially by The Economic Research Service of the U.S. Department of Agriculture. There is no standard recommendation for how to categorize RUCC codes to capture urban-rural status, and substantial variation is found in existing literature.10 We defined rural residences as those in a non-metropolitan county (defined by the Office of Management and Budget, and indicated by RUCC > 3). We split metropolitan counties into two categories by population: large-urban (population of one million or more) and small-urban (population of less than one million). We chose these categories to remain consistent with previous literature on urban-rural health disparities and how The United States Department of Agriculture’s Economic Research Service states most researchers define rural America,35 to create categories with sample sizes that would allow for tests of interaction, and for clarity of interpretation.
Aerobic physical activity
We multiplied two survey items to capture participant’s typical weekly minutes of aerobic moderate-to-vigorous PA. The first item asked, “In a typical week, how many days do you do any PA or exercise of at least moderate intensity, such as brisk walking, bicycling at a regular pace, and swimming at a regular pace?” There were eight answer choices to this question, ranging from 0-7 days a week. The second item was a free response question that asked, “On the days that you do any PA or exercise of at least moderate intensity, how long do you typically do these activities?” All four HINTS waves contained these items. Preliminary data screening revealed the presence of outliers due to illogical responses to the free-response item (eg 80 hours of PA a day). In accordance with existing literature for scoring similar measures,36 we designated a cut-off of 16 hours of moderate-to-vigorous physical activity per day as the upper limit; responses that exceeded this were excluded from analysis.
Leisure-time muscle strengthening physical activity
Leisure-time muscle strengthening PA behavior was captured by a multiple choice item that asked, “In a typical week, outside of your job or work around the house, how many days do you do leisure-time physical activities specifically designed to strengthen your muscles such as lifting weights or circuit training (do not include cardio exercise such as walking, biking, or swimming)?” This is a measure of frequency that is consistent with national guidelines7, and was treated as a continuous variable. Only HINTS waves 1-3 contained this item.
Leisure screen-time sedentary behavior
Leisure screen-time sedentary behavior was captured by a free response item that asked, “Over the past 30 days, in your leisure-time, how many hours per day, on average, did you sit and watch TV or movies, surf the web, or play computer games? Do not include “active gaming” such as “Wii.” This item measured hours per day of screen-time sedentary behavior, and was treated as a continuous variable; all four HINTS waves contained this item. Preliminary data screening revealed the presence of illogical outliers (eg 90 hours of sedentary time per day). Responses that indicated more than 24 hours of screen-time sedentary behavior per day were excluded from analysis.
Statistical Methods
We combined data from HINTS 4 Cycles 1, 2, 3, and 4 into one dataset that contained all sample and replicate weights arrayed in a manner consistent with the NCI HINTS team’s recommendations.37 During preliminary data screening, we found nontrivial amounts of missing data (eg race/ethnicity and income range categories >10% missing). To address this, we used the fully conditional specification method of multiple imputation, a semi-parametric procedure which can appropriately handle the HINTS’ complex survey design.38 Due to literature indicating that geographic region may be an important moderator of urban-rural status and PA behaviors,13, 16, 18 data were imputed by geographic region strata (Northeast, Midwest, South & West). Using this procedure, we created ten multiple imputation data sets. For all analyses, we removed from the models data from participants whose dependent variables were imputed.39 This included removing HINTS 4 Cycle 4 data for the muscle strengthening PA models, and cases with missing/illogical outcome variables for all models. Final test statistics were derived from the ten multiple imputation data sets using Rubin’s rules.40
We computed descriptive statistics for sociodemographic variables, then conducted Wald’s design-based chi-square tests of independence to test for differences by urban-rural status.41 We tested for urban-rural differences in: 1) aerobic PA, 2) leisure-time muscle strengthening PA, and 3) leisure screen-time sedentary behavior. We used quasipoisson regression models to test our hypotheses. This generalized linear model form of regression analysis is an approach for dealing with overdispersion in the outcome variable that compares favorably to negative binomial and zero-inflated models: it is robust to model misspecification and readily applicable to generalized linear model extensions such as those used in this study’s complex, weighted survey design.42, 43 To obtain standard error estimates that would be robust with respect to distributional assumptions, we used a bootstrapping procedure with 2000 resamples.44 These analyses were repeated in models that adjusted for age, BMI, gender, race/ethnicity (Hispanic, non-Hispanic white, non-Hispanic Black or African American, non-Hispanic American Indian or Alaska Native, non-Hispanic Asian, non-Hispanic Native Hawaiian or other Pacific Islander, non-Hispanic multiple races mentioned), health status (excellent, very good, good, fair, poor), marital status (married, living as married, divorced, widowed, separated, single and never been married), education level (less than high school, high school graduate, some college, college graduate or more), geographic region (Northeast, Midwest, South, West), health insurance coverage (yes, no), combined family annual income category ($0-$9,999, $10,000-$14,999, $15,000-$19,999, $20,000-$34,999, $35,000-$49,999, $50,000-$74,999, $75,000-$99,999, $100,000-$199,999, $200,000 or more), occupational status (disabled, employed, homemaker, retired, student, unemployed), having ever been diagnosed with cancer (yes, no), and HINTS survey cycle (1, 2, 3, 4). Finally, we examined the interaction of urban-rural status with geographic region in both the unadjusted and adjusted models.
We conducted multiple imputation in SAS 9.3 (SAS Institute, Cary NC), and all other analyses in R using the survey45 and the mitools46 packages. We obtained all necessary approval from our institutional review boards.
Findings
Participant Characteristics
The combined 2011-2014 HINTS 4 Cycles 1-4 datasets contained completed, independent survey data from 14,188 participants. Of these, 8,034 (56.6%) resided in large-urban counties, 4,016 (28.3%) in small-urban counties, and 2,138 (15.1%) non-metropolitan counties. Wald design-based chi square tests indicated that sociodemographic characteristics differed by urban-rural status in age, marital status, race/ethnicity, education levels, BMI, self-reported health status, employment status, and by geographic region (Table 1). Rural residents were more likely to be older, married, white, less educated, obese, in poorer health, unemployed due to being disabled, and to reside in the Southern U.S.
Table 1.
Weighted sociodemographic characteristics by urban-rural status
| Large- urban |
Small- urban |
Non-metro | P valuea | ||
|---|---|---|---|---|---|
| (n=8,034) | (n=4,016) | (n=2,138) | |||
| Characteristic | Category | % | % | % | |
| Gender | 0.0248 | ||||
| Female | 49.88 | 54.26 | 53.52 | ||
| Male | 50.13 | 45.74 | 46.49 | ||
| Age Category (years) | <0.001 | ||||
| 18-34 | 30.18 | 30.26 | 24.87 | ||
| 35-49 | 29.17 | 26.28 | 25.26 | ||
| 50-64 | 24.45 | 25.63 | 28.38 | ||
| 65-74 | 8.82 | 9.77 | 11.52 | ||
| 75+ | 7.38 | 8.05 | 9.97 | ||
| Marital Status | 0.043 | ||||
| Married or living with partner | 55.54 | 56.06 | 60.88 | ||
| Not married or living with partner | 44.46 | 43.94 | 39.12 | ||
| Race/Ethnicity | <0.001 | ||||
| Hispanic | 18.93 | 13.07 | 5.10 | ||
| Asian | 7.31 | 1.94 | 1.44 | ||
| Black/AA | 13.16 | 9.89 | 7.22 | ||
| White | 58.58 | 72.51 | 83.21 | ||
| Other | 2.02 | 2.59 | 3.03 | ||
| Education Level | <0.001 | ||||
| < High School | 11.06 | 12.34 | 13.97 | ||
| HS Graduate | 18.60 | 22.17 | 29.40 | ||
| Some College | 30.83 | 35.03 | 35.40 | ||
| Bachelor's (+) | 39.51 | 30.47 | 21.23 | ||
| BMI Category | <0.001 | ||||
| Underweight | 2.26 | 1.76 | 1.62 | ||
| Normal | 34.36 | 31.76 | 27.56 | ||
| Overweight | 34.88 | 33.77 | 32.96 | ||
| Obese | 28.50 | 32.71 | 37.86 | ||
| Health Insurance? | 0.479 | ||||
| No | 16.30 | 15.79 | 18.24 | ||
| Yes | 83.69 | 84.21 | 81.76 | ||
| Health Status | 0.048 | ||||
| Excellent | 13.87 | 11.30 | 10.35 | ||
| Very Good | 36.89 | 35.94 | 34.74 | ||
| Good | 35.55 | 37.36 | 38.20 | ||
| Fair | 11.64 | 12.91 | 13.24 | ||
| Poor | 2.06 | 2.50 | 3.47 | ||
| Employment | <0.001 | ||||
| Disabled | 4.28 | 5.38 | 7.37 | ||
| Employed | 61.42 | 55.23 | 52.11 | ||
| Homemaker | 5.72 | 6.92 | 7.55 | ||
| Retired | 15.40 | 17.63 | 21.91 | ||
| Student | 5.33 | 7.96 | 4.91 | ||
| Geographic Region | <0.001 | ||||
| Midwest | 18.37 | 23.01 | 29.30 | ||
| Northeast | 22.32 | 14.52 | 11.46 | ||
| South | 32.78 | 40.86 | 44.48 | ||
| West | 26.53 | 21.62 | 14.75 | ||
| Unemployed | 7.85 | 6.89 | 6.16 |
Wald design-based chi-square tests were performed to assess independence between sample characteristic and urban-rural status.
Generalized Linear Regression Models
Aerobic physical activity
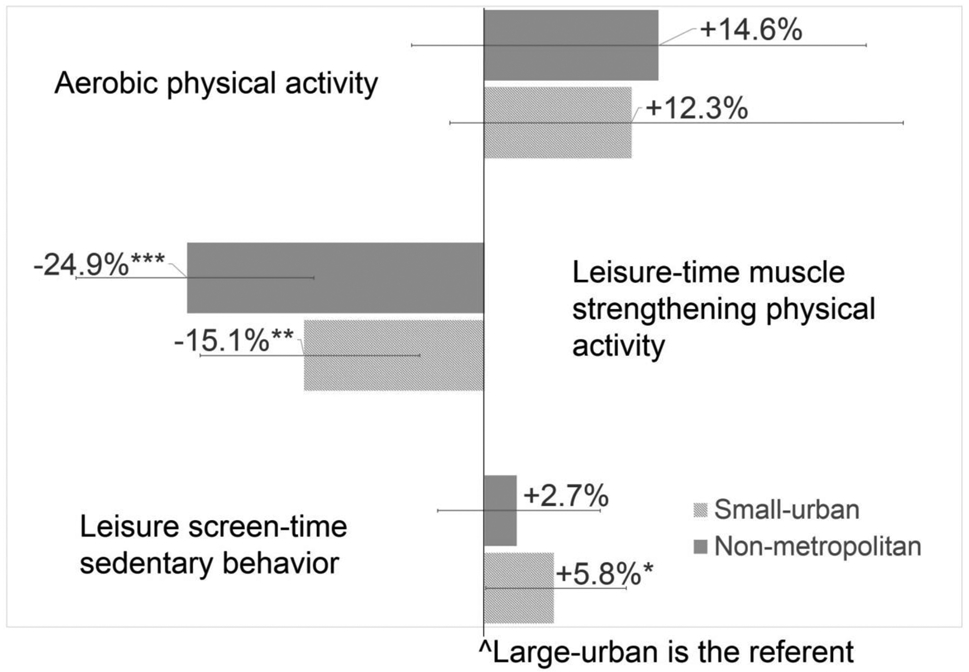
In unadjusted models, we found no statistically significant differences in the expected number of reported weekly aerobic PA minutes between large-urban, small-urban, or non-metropolitan categories at the alpha .05 level (Figure 1, Table 2). We do note a non-significant trend such that non-metropolitan and small-urban residents may engage in more aerobic PA than those in large-urban counties; residents of large-urban counties had an expected value of 247.9 minutes of weekly aerobic PA, which compares to 278.4 minutes for small-urban counties and 284.2 minutes for residents of non-metropolitan counties. In the adjusted model, compared to residents of large-urban counties, we found the expected number of reported weekly aerobic PA minutes to be 14.8% higher for residents of small-urban counties (IRR = 1.148, P = .019) (Table 2).
Figure 1.
Unadjusted incidence rate ratios with 95% confidence intervals for physical activity and sedentary behaviors by urban-rural status
Table 2.
Quasipoisson model for outcome behaviors by urban-rural status
| Unadjusted Models | Adjusted Modelsa | |||||||
|---|---|---|---|---|---|---|---|---|
| Beta (IRRb) |
Standard error |
Beta 95% CI |
P Value |
Beta (IRRb) |
Standard error |
Beta 95% CI |
P Value |
|
| Minutes of moderate-to-vigorous aerobic physical activity in a typical week | ||||||||
| Intercept | 5.513 (247.905) | 0.032 | [5.451, 5.575] | <.001 | 6.402 (603.050) | 0.253 | [5.906, 6.898] | <.001 |
| Large-urban (Ref) | - | - | - | - | - | - | - | - |
| Small-urban | 0.116 (1.123) | 0.065 | [−0.011, 0.243] | 0.074 | 0.138 (1.148) | 0.056 | [0.022, 0.253] | 0.019 |
| Non-metro | 0.137 (1.146) | 0.084 | [−0.028, 0.302] | 0.104 | 0.144 (1.155) | 0.087 | [−0.028, 0.315] | 0.100 |
| Bouts of muscle strengthening exercise in a typical week | ||||||||
| Intercept | 0.257 (1.293) | 0.030 | [0.198, 0.316] | <.001 | 1.380 (3.974) | 0.211 | [0.966, 1.793] | <.001 |
| Large-urban (Ref) | - | - | - | - | - | - | - | - |
| Small-urban | −0.164 (0.849) | 0.055 | [−0.272, −0.056] | 0.003 | −0.091 (0.913) | 0.051 | [−0.189, 0.007] | 0.070 |
| Non-metro | −0.286 (0.751) | 0.067 | [−0.419, −0.154] | <.001 | −0.122 (0.885) | 0.067 | [−0.255, 0.010] | 0.071 |
| Minutes of screen-time sedentary behavior in a typical day | ||||||||
| Intercept | 1.292 (3.639) | 0.017 | [1.258, 1.325] | <.001 | 1.300 (3.669) | 0.135 | [1.036, 1.563] | <.001 |
| Large-urban (Ref) | - | - | - | - | - | - | - | - |
| Small-urban | 0.056 (1.058) | 0.028 | [0.001, 0.112] | 0.047 | 0.005 (1.005) | 0.027 | [−0.048, 0.058] | 0.852 |
| Non-metro | 0.026 (1.027) | 0.034 | [−0.040, 0.093] | 0.434 | −0.068 (0.934) | 0.031 | [−0.129, −0.006] | 0.031 |
Adjusted for age, BMI, gender, race/ethnicity, general health, marital status, education level, geographic region, health insurance coverage, income category, occupational status, cancer survivor status, and HINTS wave
Incidence rate ratio
Leisure-time muscle strengthening physical activity
In unadjusted models we found that, compared to residents of large-urban counties, the expected number of weekly bouts of leisure-time muscle strengthening PA was 15.1% lower for residents of small-urban counties (IRR = 0.849, P = .003) and 24.9% lower for those residing in non-metropolitan counties (IRR = 0.751, P < .001) (Figure 1, Table 2). The difference between small-urban and non-metropolitan residents was not statistically significant. Residents of large-urban counties had an expected value of 1.29 weekly bouts of leisure-time muscle strengthening PA, compared to 1.10 for residents of small-urban counties and 0.97 for residents of non-metropolitan counties. These differences were no longer statistically significant after controlling for potentially confounding covariates (Table 2).
Leisure screen-time sedentary behavior
In unadjusted models we found that, compared to residents of large-urban counties, the expected number of hours of daily leisure screen-time sedentary behavior was 5.8% higher (IRR = 1.058, P = .047) for residents of small-urban counties, but no evidence of a significant difference between residents of large-urban counties vs. non-metropolitan counties (Table 2). Residents of large-urban counties had an expected value of 3.64 hours of daily leisure screen-time sedentary behavior, compared to 3.85 hours (+12.6 minutes) for residents of small-urban counties and 3.74 hours (+6 minutes) for non-metropolitan counties. In the adjusted model we found no difference in the expected number of hours of daily leisure screen-time sedentary behavior between residents of small-urban counties and large-urban counties, but that the expected number of hours of daily leisure screen-time sedentary behavior in residents of non-metropolitan counties was 6.6% lower than in residents of large-urban counties (IRR = 0.934, P =.031) (Table 2).
Tests for interaction
Tests for interaction did not produce any evidence to indicate that the relationship between urban-rural status and outcome variables differed by geographic region.
Discussion
This study complements previous literature and contributes to a body of evidence that indicates that PA patterns differ by urban-rural status. While the lack of significant differences in aerobic PA between non-metropolitan and large-urban counties (along with the trend suggesting higher aerobic PA in non-metropolitan residents) may initially seem to contradict previous literature, the results of the current study are actually not discordant and contribute to an emerging pattern. Total PA can be conceptualized as occurring in four domains: leisure-time, occupational, household, and transit-related PA.47 Most of the extant literature has exclusively examined leisure-time aerobic PA, and has consistently found that rural residents tend to report engaging in less leisure-time aerobic PA than their urban counterparts. The items used to measure aerobic PA in the current study, however, had participants more broadly consider “any physical activity or exercise”, and thus reflects total aerobic PA. Indeed, the findings of the current study are in agreement with a study by Fan, Wen, and Kowaleski-Jones (2014), in which the authors examined urban-rural differences in PA using accelerometer and survey measures.23 In their analysis of accelerometer data, these researchers found no evidence for differences between urban and rural residents when using a low-intensity cut-off point to measure total aerobic PA. They observed a pattern such that rural residents engaged in less vigorous-intensity PA than their urban counterparts, but more light-intensity PA. Analysis of their survey data indicated that rural residents reported more overall PA than their urban counterparts (consistent with the trend noted in the current study), and that the difference was primarily due to greater levels of household-related PA. Taken together with the previous literature our results indicate that, compared to individuals in urban settings, rural residents may engage in comparable total levels of aerobic PA, but proportionately less vigorous-intensity PA and less leisure-time aerobic PA.
This study further contributes to the literature with the finding that non-metropolitan residents reported engaging in less leisure-time muscle strengthening PA than their large-urban counterparts. This is an important finding because muscle strengthening is a nationally recommended behavior with well-established health benefits.7 Differences in muscle strengthening may contribute to the marked urban-rural disparity in obesity that has been identified in previous literature4 and is underscored in the current study (Table 1). Indeed, muscle strengthening is recommended for obesity management.48 It has been shown to reduce body fat and increase resting metabolic rate, as well as to confer other health benefits including reducing the risk of type 2 diabetes, reversing age-related muscle loss, and improving cardiovascular health, blood lipid profiles, vascular condition, resting blood pressure, physical functioning, bone mineral density, and mental health.49 The result indicating that non-metropolitan residents reported engaging in less leisure-time muscle strengthening PA than their large-urban counterparts was no longer statistically significant after adjusting for covariates. This suggests that this finding may be largely attributable to urban-rural differences in socio-demographic factors. Nonetheless, this finding suggests that muscle strengthening behavior should be further studied in rural residents. If future studies confirm our findings, then public health initiatives should address the muscle strengthening disparity among rural residents.
This finding further contributes to an emerging pattern suggesting that rural residents may engage in less PA in their discretionary time than their urban counterparts. This finding has important public health implications, particularly because evidence suggests that leisure-time PA may be the most salubrious domain of PA.50-52 While some studies have indicated that occupational and household-related PA are associated with a decreased risk of cardiovascular disease and overall mortality,52 others have found that they are not associated with BMI, obesity,53 or changes in biomarkers of cardiovascular disease54 and insulin resistance50; still others have found that they may be negatively associated with indicators of health.55, 56 There is limited evidence as to whether the various domains of PA may confer protective health benefits through different mechanisms, but it may be that leisure-time PA is more likely to be of higher intensity. High intensity PA has been shown to be particularly beneficial57 and is associated with long-term weight reduction.58
We found no difference in the unadjusted model for non-metropolitan residents, but the adjusted model indicated that this population may engage in less leisure screen-time sedentary behavior than their urban counterparts. This finding may be understood to fit with the emerging pattern noted above; rural residents may tend to have less discretionary time altogether, and/or higher levels of household-related PA may tend to occur in place of leisure screen-time sedentary behavior. This finding could also be attributable in part to less access to broadband internet in rural areas.59 This finding seems to contradict that of Trivedi and associates (2015), who found that rural residents may be slightly more likely to engage in four hours or more of leisure screen-time sedentary behavior. Future studies should investigate this apparent discrepancy.
Rural residents have to commute longer distances to work,60 and rural environments are less likely to feature facilities associated with leisure-time PA, such as parks and green spaces.11, 12 Such factors may be especially salient barriers to leisure-time PA in rural settings, and lower levels of this health-promoting behavior may play an important role in urban-rural health disparities. It may be particularly fruitful for future research to further explore urban-rural differences in theory-based, modifiable psychosocial constructs pertaining to leisure-time PA. Such insights would complement the growing literature base centered on urban-rural differences in the built environment; indeed, evidence indicates that targeting multiple levels of influence simultaneously can increase intervention efficacy.61
Weaknesses of this study include the cross-sectional design of the HINTS, and the measurement of PA and sedentary behaviors via self-reported items. Furthermore, the NCI HINTS’ items measured PA in terms of "any physical activity or exercise of at least a moderate intensity", and thus did not capture variation in level of PA intensity. If the data were available, we would have created a more refined composite of PA by parsing out weekly PA minutes by vigorous-, moderate-, and light-intensity, and assigned metabolic equivalent values per intensity. Intensity is an important aspect of PA and determines the extent of protective health benefits. We acknowledge this limitation of our study. Although these weaknesses leave the study prone to various threats to construct validity and preclude causal inference, these measures are nonetheless useful for national surveillance purposes. This study had a relatively low response rate; despite employing survey weights to correct for this, differences may exist between those who participated in this study and those who did not. Defining rural communities using country-level data is problematic and may mischaracterize a large proportion of participants. It is likely the case, for instance, that metropolitan statistical areas actually contain large pockets of rural communities. Furthermore, grouping together rural communities into one category may mask non-linear variations that are present by degree of rurality.62 Rurality is a complex, socially-derived construct, and quantifying it is inherently difficult. The current study highlights that PA patterns may differ with rurality broadly, but does not diminish the importance of location-specific formative work in individual communities.
Strengths of this study include the use of a large, nationally representative data set, and stronger statistical methods than have been used in past research including more extensive statistical control and the use of more sophisticated techniques to account for missing data. Furthermore, this study investigated a wider range of PA-related behaviors than previous studies that have examined urban-rural differences in PA.
This study contributes to efforts to understand the etiology of the marked health disparities that exist between U.S. urban and rural residents. Considered alongside previous literature, findings indicate that these populations may engage in comparable overall levels of total aerobic PA, but that activity patterns may differ by PA domain and intensity level. Furthermore, this study found that rural residents engage in less leisure-time muscle strengthening PA and less leisure screen-time sedentary behavior than their urban counterparts. Future studies should further develop our understanding of urban-rural lifestyle behavior differences and their corresponding psychosocial constructs, as well as investigate the extent to which these differences contribute to urban-rural health disparities.
Acknowledgements:
This study was supported by the Center for Energy Balance in Cancer Prevention and Survivorship, Duncan Family Institution for Cancer Prevention and Risk Assessment of The University of Texas MD Anderson Cancer Center.
REFERENCES
- 1.O'Connor A, Wellenius G. Rural–urban disparities in the prevalence of diabetes and coronary heart disease. Public Health. 2012;126(10):813–820. [DOI] [PubMed] [Google Scholar]
- 2.Singh GK, Siahpush M. Widening rural–urban disparities in all-cause mortality and mortality from major causes of death in the USA, 1969–2009. Journal of Urban Health. 2014;91(2):272–292. [DOI] [PMC free article] [PubMed] [Google Scholar]
- 3.Kulshreshtha A, Goyal A, Dabhadkar K, Veledar E, Vaccarino V. Urban-rural differences in coronary heart disease mortality in the United States: 1999-2009. Public Health Rep. 2014;129(1). [DOI] [PMC free article] [PubMed] [Google Scholar]
- 4.Befort CA, Nazir N, Perri MG. Prevalence of obesity among adults from rural and urban areas of the United States: findings from NHANES (2005-2008). The Journal of Rural Health. 2012;28(4):392–397. [DOI] [PMC free article] [PubMed] [Google Scholar]
- 5.Blake KD, Moss JL, Gaysynsky A, Srinivasan S, Croyle RT. Making the Case for Investment in Rural Cancer Control: An Analysis of Rural Cancer Incidence, Mortality, and Funding Trends. Cancer Epidemiol Biomarkers Prev. 2017. doi: 10.1158/1055-9965.EPI-17-0092 [doi]. [DOI] [PMC free article] [PubMed] [Google Scholar]
- 6.Garcia MC. Reducing Potentially Excess Deaths from the Five Leading Causes of Death in the Rural United States. MMWR.Surveillance Summaries. 2017;66. [DOI] [PMC free article] [PubMed] [Google Scholar]
- 7.Physical Activity Guidelines Advisory Committee. Physical activity guidelines for Americans. Washington, DC: US Department of Health and Human Services. 2008:15–34. [Google Scholar]
- 8.Schoenborn CA, Stommel M. Adherence to the 2008 adult physical activity guidelines and mortality risk. Am J Prev Med. 2011;40(5):514–521. [DOI] [PubMed] [Google Scholar]
- 9.Carlson SA, Fulton JE, Schoenborn CA, Loustalot F. Trend and prevalence estimates based on the 2008 Physical Activity Guidelines for Americans. Am J Prev Med. 2010;39(4):305–313. [DOI] [PubMed] [Google Scholar]
- 10.Hall SA, Kaufman JS, Ricketts TC. Defining urban and rural areas in US epidemiologic studies. Journal of Urban Health. 2006;83(2):162–175. [DOI] [PMC free article] [PubMed] [Google Scholar]
- 11.Frost SS, Goins RT, Hunter RH, et al. Effects of the built environment on physical activity of adults living in rural settings. Am J Health Promot. 2010;24(4):267–283. doi: 10.4278/ajhp.08040532 [doi]. [DOI] [PubMed] [Google Scholar]
- 12.Hansen AY, Meyer MRU, Lenardson JD, Hartley D. Built environments and active living in rural and remote areas: a review of the literature. Current obesity reports. 2015;4(4):484–493. [DOI] [PubMed] [Google Scholar]
- 13.Wilcox S, Castro C, King A, Housemann R, Brownson R. Determinants of leisure time physical activity in rural compared with urban older and ethnically diverse women in the United States. J Epidemiol Community Health. 2000;54(9):667–672. doi: 10.1136/jech.54.9.667. [DOI] [PMC free article] [PubMed] [Google Scholar]
- 14.Sriram U, Morgan EH, Graham ML, Folta SC, Seguin RA. Support and Sabotage: A Qualitative Study of Social Influences on Health Behaviors Among Rural Adults. The Journal of Rural Health. 2017. [DOI] [PMC free article] [PubMed] [Google Scholar]
- 15.Patterson PD, Moore CG, Probst JC, Shinogle JA. Obesity and physical inactivity in rural America. The Journal of Rural Health. 2004;20(2):151–159. [DOI] [PubMed] [Google Scholar]
- 16.Martin SL, Kirkner GJ, Mayo K, Matthews CE, Durstine JL, Hebert JR. Urban, Rural, and Regional Variations in Physical Activity. The Journal of Rural Health. 2005;21(3):239–244. doi: 10.1111/j.1748-0361.2005.tb00089.x. [DOI] [PubMed] [Google Scholar]
- 17.Parks SE, Housemann RA, Brownson RC. Differential correlates of physical activity in urban and rural adults of various socioeconomic backgrounds in the United States. J Epidemiol Community Health. 2003;57(1):29–35. [DOI] [PMC free article] [PubMed] [Google Scholar]
- 18.Reis JP, Bowles HR, Ainsworth BE, Dubose KD, Smith S, Laditka JN. Nonoccupational physical activity by degree of urbanization and U.S. geographic region. Med Sci Sports Exerc. 2004;36(12):2093–2098. doi: 00005768-200412000-00013 [pii]. [DOI] [PubMed] [Google Scholar]
- 19.Matthews KA. Health-related behaviors by Urban-Rural County Classification—United States, 2013. MMWR.Surveillance Summaries. 2017;66. [DOI] [PMC free article] [PubMed] [Google Scholar]
- 20.Trivedi T, Liu J, Probst J, Merchant A, Jhones S, Martin A. Obesity and obesity-related behaviors among rural and urban adults in the USA. Rural Remote Health. 2015;15(4):3267. [PubMed] [Google Scholar]
- 21.Rubin DB. Inference and missing data. Biometrika. 1976:581–592. [Google Scholar]
- 22.Rubin DB. Multiple imputation for nonresponse in surveys. Vol 81. John Wiley & Sons; 2004. [Google Scholar]
- 23.Fan JX, Wen M, Kowaleski-Jones L. Rural-urban differences in objective and subjective measures of physical activity: findings from the National Health and Nutrition Examination Survey (NHANES) 2003-2006. Prev Chronic Dis. 2014;11:E141. doi: 10.5888/pcd11.140189 [doi]. [DOI] [PMC free article] [PubMed] [Google Scholar]
- 24.Thorp AA, Owen N, Neuhaus M, Dunstan DW. Sedentary behaviors and subsequent health outcomes in adults: a systematic review of longitudinal studies, 1996–2011. Am J Prev Med. 2011;41(2):207–215. [DOI] [PubMed] [Google Scholar]
- 25.Bowman SA. Television-viewing characteristics of adults: correlations to eating practices and overweight and health status. Prev Chronic Dis. 2006;3(2):A38. [PMC free article] [PubMed] [Google Scholar]
- 26.Gore SA, Foster JA, DiLillo VG, Kirk K, West DS. Television viewing and snacking. Eating Behav. 2003;4(4):399–405. [DOI] [PubMed] [Google Scholar]
- 27.Patel AV, Bernstein L, Deka A, et al. Leisure time spent sitting in relation to total mortality in a prospective cohort of US adults. Am J Epidemiol. 2010;172(4):419–429. doi: 10.1093/aje/kwq155 [doi]. [DOI] [PMC free article] [PubMed] [Google Scholar]
- 28.Katzmarzyk PT, Church TS, Craig CL, Bouchard C. Sitting time and mortality from all causes, cardiovascular disease, and cancer. Med Sci Sports Exerc. 2009;41(5):998–1005. doi: 10.1249/MSS.0b013e3181930355 [doi]. [DOI] [PubMed] [Google Scholar]
- 29.Warren TY, Barry V, Hooker SP, Sui X, Church TS, Blair SN. Sedentary behaviors increase risk of cardiovascular disease mortality in men. Med Sci Sports Exerc. 2010;42(5):879–885. doi: 10.1249/MSS.0b013e3181c3aa7e [doi]. [DOI] [PMC free article] [PubMed] [Google Scholar]
- 30.Healy GN, Wijndaele K, Dunstan DW, et al. Objectively measured sedentary time, physical activity, and metabolic risk: the Australian Diabetes, Obesity and Lifestyle Study (AusDiab). Diabetes Care. 2008;31(2):369–371. doi: dc07-1795 [pii]. [DOI] [PubMed] [Google Scholar]
- 31.Hu FB, Li TY, Colditz GA, Willett WC, Manson JE. Television watching and other sedentary behaviors in relation to risk of obesity and type 2 diabetes mellitus in women. JAMA. 2003;289(14):1785–1791. [DOI] [PubMed] [Google Scholar]
- 32.Carter ND, Kannus P, Khan K. Exercise in the prevention of falls in older people. Sports Medicine. 2001;31(6):427–438. [DOI] [PubMed] [Google Scholar]
- 33.Booth FW, Roberts CK, Laye MJ. Lack of exercise is a major cause of chronic diseases. Comprehensive Physiology. 2012. [DOI] [PMC free article] [PubMed] [Google Scholar]
- 34.Hicks W, Cantor D. Health Information National Trends Survey 4 (HINTS 4) Cycle 1 Cognitive Interviewing Report. 2011. [Google Scholar]
- 35.United States Department of Agriculture. What is Rural? https://www.ers.usda.gov/topics/rural-economy-population/rural-classifications/what-is-rural/. [Google Scholar]
- 36.IPAQ Research Committee. Guidelines for data processing and analysis of the International Physical Activity Questionnaire (IPAQ)–short and long forms. Retrieved September. 2005;17:2008. [Google Scholar]
- 37.Moser RP, Naveed S, Cantor D, et al. Integrative analytic methods using population-level cross-sectional data. Hints.cancer. 2013. [Google Scholar]
- 38.Van Buuren S Multiple imputation of discrete and continuous data by fully conditional specification. Stat Methods Med Res. 2007;16(3):219–242. [DOI] [PubMed] [Google Scholar]
- 39.Von Hippel PT. Regression with missing Ys: An improved strategy for analyzing multiply imputed data. Sociological Methodology. 2007;37(1):83–117. [Google Scholar]
- 40.Rubin DB. Multiple imputation after 18 years. Journal of the American statistical Association. 1996;91(434):473–489. [Google Scholar]
- 41.Bedrick EJ. Adjusted chi-squared tests for cross-classified tables of survey data. Biometrika. 1983:591–595. [Google Scholar]
- 42.Ver Hoef JM, Boveng PL. QUASI-POISSON VS. NEGATIVE BINOMIAL REGRESSION: HOW SHOULD WE MODEL OVERDISPERSED COUNT DATA?. Ecology. 2007;88(11):2766–2772. [DOI] [PubMed] [Google Scholar]
- 43.Staub KE, Winkelmann R. Consistent Estimation Of Zero-Inflated Count Models. Health Econ. 2013;22(6):673–686. [DOI] [PubMed] [Google Scholar]
- 44.DiCiccio TJ, Efron B. Bootstrap confidence intervals. Statistical science. 1996:189–212. [Google Scholar]
- 45.Lumley T Survey: analysis of complex survey samples. 2014. R package version. 2014;3:281. [Google Scholar]
- 46.Lumley T. . mitools: Tools for multiple imputation of missing data.R-package version 2.3. 2014. [Google Scholar]
- 47.Gabriel KKP, Morrow JR Jr, Woolsey AT. Framework for physical activity as a complex and multidimensional behavior. Journal of Physical Activity and Health. 2012;9(s1):S11–S18. [DOI] [PubMed] [Google Scholar]
- 48.Strasser B, Schobersberger W. Evidence for resistance training as a treatment therapy in obesity. J Obes. 2011;2011: 10.1155/2011/482564. Epub 2010 Aug 10. doi: 10.1155/2011/482564 [doi]. [DOI] [PMC free article] [PubMed] [Google Scholar]
- 49.Westcott WL. Resistance training is medicine: effects of strength training on health. Curr Sports Med Rep. 2012;11(4):209–216. doi: 10.1249/JSR.0b013e31825dabb8 [doi]. [DOI] [PubMed] [Google Scholar]
- 50.Tsenkova VK. Leisure-time, occupational, household physical activity and insulin resistance (HOMAIR) in the midlife in the United States (MIDUS) national study of adults. Preventive Medicine Reports. 2017. [DOI] [PMC free article] [PubMed] [Google Scholar]
- 51.Samitz G, Egger M, Zwahlen M. Domains of physical activity and all-cause mortality: systematic review and dose-response meta-analysis of cohort studies. Int J Epidemiol. 2011;40(5):1382–1400. doi: 10.1093/ije/dyr112 [doi]. [DOI] [PubMed] [Google Scholar]
- 52.Autenrieth CS, Baumert J, Baumeister SE, et al. Association between domains of physical activity and all-cause, cardiovascular and cancer mortality. Eur J Epidemiol. 2011;26(2):91–99. [DOI] [PubMed] [Google Scholar]
- 53.Gutiérrez-Fisac JL, Guallar-Castillón P, Díez-Gañán L, García EL, Banegas JRB, Artalejo FR. Work-related physical activity is Not associated with body mass index and obesity. Obes Res. 2002;10(4):270–276. [DOI] [PubMed] [Google Scholar]
- 54.Koenig W, Sund M, Doring A, Ernst E. Leisure-time physical activity but not work-related physical activity is associated with decreased plasma viscosity. Results from a large population sample. Circulation. 1997;95(2):335–341. [DOI] [PubMed] [Google Scholar]
- 55.Clays E, De Bacquer D, Van Herck K, De Backer G, Kittel F, Holtermann A. Occupational and leisure time physical activity in contrasting relation to ambulatory blood pressure. BMC Public Health. 2012;12(1):1002. [DOI] [PMC free article] [PubMed] [Google Scholar]
- 56.Larsson CA, Krøll L, Bennet L, Gullberg B, Råstam L, Lindblad U. Leisure time and occupational physical activity in relation to obesity and insulin resistance: a population-based study from the Skaraborg Project in Sweden. Metab Clin Exp. 2012;61(4):590–598. [DOI] [PubMed] [Google Scholar]
- 57.Lahti J, Holstila A, Lahelma E, Rahkonen O. Leisure-time physical activity and all-cause mortality. PloS one. 2014;9(7):e101548. [DOI] [PMC free article] [PubMed] [Google Scholar]
- 58.Hankinson AL, Daviglus ML, Bouchard C, et al. Maintaining a high physical activity level over 20 years and weight gain. JAMA. 2010;304(23):2603–2610. [DOI] [PMC free article] [PubMed] [Google Scholar]
- 59.Dickes LA, Lamie D, Whitacre B. The struggle for broadband in rural America. Choices. 2010;25(4):23–34. [Google Scholar]
- 60.Umstattd Meyer MR, Moore JB, Abildso C, Edwards MB, Gamble A, Baskin ML. Rural Active Living: A Call to Action. J Public Health Manag Pract. 2016;22(5):E11–20. doi: 10.1097/PHH.0000000000000333 [doi]. [DOI] [PMC free article] [PubMed] [Google Scholar]
- 61.Cerin E, Leslie E. How socio-economic status contributes to participation in leisure-time physical activity. Soc Sci Med. 2008;66(12):2596–2609. [DOI] [PubMed] [Google Scholar]
- 62.Edwards MB, Matarrita-Cascante D. Rurality in leisure research: A review of four major journals. J Leisure Res. 2011;43(4):447. [Google Scholar]