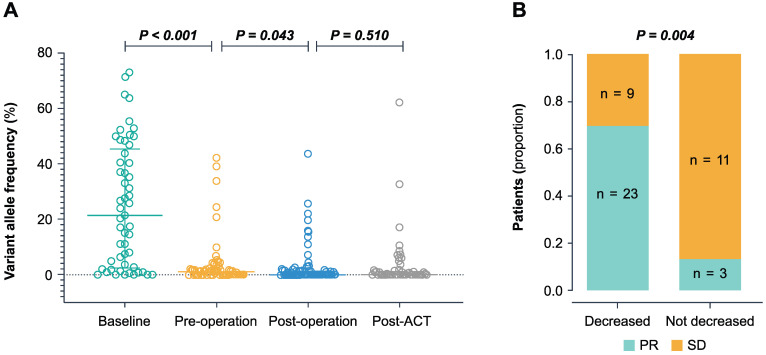
Figure 2.
The dynamic changes of the ctDNA level during treatment. (A) The ctDNA VAF in baseline, pre-operation, post-operation, and post-ACT. P-value was calculated using the Wilcoxon rank-sum test. (B) Association between decreased ctDNA VAF during the pre-operative chemotherapy and the tumor response. The decreased group represents a decrease of more than 10-fold, and the not decreased group represents an increase or a decrease of less than 10-fold. PR partial response, SD stable disease.

