

Abstract
Introduction
We tested how tube types (ethylenediaminetetraacetic acid [EDTA], serum, lithium heparin [LiHep], and citrate) and freeze–thaw cycles affect levels of blood biomarkers for Alzheimer's disease (AD) pathophysiology, glial activation, and neuronal injury.
Methods
Amyloid beta (Aβ)42, Aβ40, phosphorylated tau181 (p‐tau181), glial fibrillary acidic protein, total tau (t‐tau), neurofilament light, and phosphorylated neurofilament heavy protein were measured using single molecule arrays.
Results
LiHep demonstrated the highest mean value for all biomarkers. Tube types were highly correlated for most biomarkers (r > 0.95) but gave significantly different absolute concentrations. Weaker correlations between tube types were found for Aβ42/40 (r = 0.63–0.86) and serum t‐tau (r = 0.46–0.64). Freeze–thaw cycles highly influenced levels of serum Aβ and t‐tau (P < .0001), and minor decreases in EDTA Aβ40 and EDTA p‐tau181 were found after freeze–thaw cycle 4 (P < .05).
Discussion
The same tube type should be used in research studies on blood biomarkers. Individual concentration cut‐offs are needed for each tube type in all tested biomarkers despite being highly correlated. Serum should be avoided for Aβ42, Aβ40, and t‐tau. Freeze–thaw cycles > 3 should be avoided for p‐tau181.
Keywords: amyloid beta, biomarkers, blood, citrate, ethylenediaminetetraacetic acid, glial fibrillary acidic protein, lithium heparin, neurofilament light, phosphorylated tau, pre‐analytics, serum
1. INTRODUCTION
The development of biomarkers that are useful for detecting neurodegenerative diseases, tracking disease progression, and predicting prognosis have become a high priority. To accelerate clinical trials, there is also a need for biomarkers that provide information on target‐engagement or toxicity of the drugs tested and, importantly, biomarkers that could be used as surrogate markers. 1 Currently, there are excellent and highly specific cerebrospinal fluid (CSF) and positron emission tomography (PET)‐based biomarkers to detect Alzheimer's disease (AD) pathophysiology. 2 , 3 , 4 Both CSF and PET biomarkers are widely used in research and clinical practice, but they have some limitations that will restrict their broader implementation. CSF is obtained by lumbar puncture, which may be regarded as complicated and time consuming, and can, in a minority of patients, be associated with mild headache. 5 , 6 PET biomarkers are expensive and require specialized equipment, which are not widely accessible, and it involves radiation exposure. In recent years, there has been a considerable step forward in the identification and development of blood‐based biomarkers for AD and, to a lesser extent, for other neurodegenerative diseases. 7 The development of these blood biomarkers was previously hampered by technical difficulties, including their low concentration, lack of reproducibility of the measurement, or matrix effects. Compared to CSF and PET, blood biomarkers are more time‐ and cost‐efficient, minimally invasive, allow repeated sampling, and are more accepted by patients and research participants. 8
The most advanced blood biomarkers are neurofilament light chain (NfL), phosphorylated tau (p‐tau), amyloid beta (Aβ), and glial fibrillary acidic protein (GFAP). NfL is a general and dynamic biomarker for neurodegeneration, 9 , 10 , 11 , 12 and is now available in clinical laboratory practice in countries like Sweden, France, and the Netherlands. In addition to being a tool in the evaluation of neurodegenerative disorders, plasma NfL can act as a highly accurate predictor of neurological outcome after acute neurological injury. 13 , 14 The less studied phosphorylated neurofilament heavy protein (pNfH) is also increased in several neurodegenerative disorders, 7 in particular amyotrophic lateral sclerosis. 15 , 16 A recent major breakthrough in the AD field has been the development of blood p‐tau as a highly specific marker for AD. Blood p‐tau phosphorylated at site 181 (p‐tau181) can discriminate symptomatic AD from other neurological disease and healthy controls, and between Aβ PET‐positive and ‐negative individuals in different stages of the AD continuum. 17 , 18 , 19 , 20 , 21 , 22 , 23 Likewise, p‐tau phosphorylated at site 217 (p‐tau217) and 231 (p‐tau231) detect AD with high accuracy. 24 , 25 , 26 Blood total tau (t‐tau), in its current format, has shown little promise for neurodegenerative disorders 23 , 27 , 28 as a poor correlation exists with t‐tau in CSF. 27 Concentrations of t‐tau in blood increases rapidly after hypoxic brain injury and demonstrates a biphasic release into the bloodstream. 29 , 30 This release results in a primary (hours) and secondary (days) peaks in which the latter is predictive of neurological outcome. 30 Blood Aβ has been measured using both ultrasensitive immunoassays 31 , 32 and mass spectrometry‐based methods. 33 , 34 These studies have shown that blood Aβ42 and/or the Aβ42/Aβ40 ratio correlates with those in the CSF and with Aβ PET and can discriminate Aβ‐positive individuals from those who are Aβ‐negative. However, the different technologies to measure blood Aβ have a poor correlation between them and it warrants further investigation to clarify whether these methods are measuring different Aβ pools or there are other technical issues involved. Finally, GFAP is a glial protein with central nervous system–selective expression. It has traditionally been used as a CSF marker of astrogliosis and/or astrocytic injury but can now be reliably measured in blood with ultrasensitive immunoassays. Blood GFAP increases after acute neuronal injury due to stroke or traumatic brain injury 35 , 36 and increases more quickly than blood NfL and, after peaking, it rapidly decreases. Blood GFAP also increases in other neurodegenerative disease like AD, likely in response to Aβ pathology 23 , 32 , 37 and, particularly in frontotemporal dementia 20 due to progranulin (PGNR) mutations. 38
This multitude of work demonstrates the broad potential of blood biomarkers in having a prominent role in early detection, and diagnostic and prognostic aspects of neurological disorders. However, there are crucial preanalytical factors, the major source of variability in biomarker testing, that need to be clarified before these biomarkers can be assessed in large‐scale multicenter validation studies and ultimately clinical routine laboratories. Therefore, the main aim of our study is to determine whether the measurement of the most important blood biomarkers of neurological injury, namely NfL, pNfH, GFAP, Aβ42, Aβ42/40, t‐tau, and the recently developed p‐tau181, are affected by the main preanalytical factors. Specifically, we tested the effect of the tube type and its additives (ethylenediaminetetraacetic acid [EDTA], lithium heparin [LiHep], citrate, or serum) and of the number of freeze–thaw cycles.
RESEARCH IN CONTEXT
Systematic review: We reviewed the available scientific literature on PubMed for articles examining plasma biomarkers in Alzheimer's disease (AD) and neurodegeneration, specifically neurofilament light (NfL), phosphorylated neurofilament heavy protein, glial fibrillary acidic protein (GFAP), amyloid beta (Aβ), total tau (t‐tau), and phosphorylated tau181 (p‐tau181) measured by single molecule array. Recent publications report only the stability of plasma NfL, which is in line with our findings. Limited information on tube type and freeze–thaw cycles is available for GFAP, Aβ, t‐tau, and p‐tau181. Therefore, in this study, we investigated the most common blood biomarkers in ethylenediaminetetraacetic acid (EDTA), serum, lithium heparin (LiHep), and citrate. In addition, we demonstrated how biomarker levels change across freeze–thaw cycles in EDTA plasma and serum.
Interpretation: Our findings indicate important differences in tube types and changes in biomarker concentrations across freeze–thaw cycles. We recommend that the same tube type should be used in research studies on blood biomarkers. Individual concentration cut‐offs are needed for each tube type in all tested biomarkers despite being highly correlated. Serum should be avoided for Aβ42, Aβ40, and t‐tau. Freeze–thaw cycles > 3 should be avoided for p‐tau181.
Future directions: A large sample size was tested in freeze–thaw cycles for EDTA and serum but future investigations should include LiHep due to its potential use for biomarkers of low concentration.
2. MATERIALS AND METHODS
2.1. Participants, blood collection, and processing
We included participants from two sources. To study the tube type effect on blood biomarkers, whole blood from eight individuals was collected by venipuncture into EDTA (Vacuette® tube 6 mL, #456243, Greiner Bio‐One GmbH), serum (Vacuette® tube 5 mL, #456234, Greiner Bio‐One GmbH), LiHep (Vacuette® tube 5 mL, #456305, Greiner Bio‐One GmbH), and citrate (Vacuette® tube 2.7 mL, #364305, Greiner Bio‐One GmbH) tubes simultaneously at the Clinical Chemistry Laboratory, Sahlgrenska University Hospital, Mölndal, Sweden, as a part of routine evaluation. Blood types were centrifuged (2000 × g for 10 minutes) within 2 hours of collection, aliquoted, and stored at −80°C pending biochemical analysis.
To test the effect of freeze–thaw cycles in EDTA plasma and serum, we recruited 30 participants (n = 15 young adults, 18–25 years; n = 15 old adults ≥ 70 years) from the AlfaAge study at the Barcelonaβeta Brain Research Center (BBRC; Table S1 in supporting information). Further details regarding the AlfaAge study are detailed in the supplementary methods. Blood samples were obtained in non‐fasting conditions. Whole blood was drawn with a 20‐ or 21‐gauge needle into EDTA tubes (BD Vacutainer® Plastic K2EDTA 10 mL Hemogard closure; cat. no. 367525) and Serum Separation Tube (SST; Vacuette® TUBE 9 mL CAT Serum Separator Clot Activator; cat. no. 4550101). Tubes were gently inverted 5 to 10 times and centrifuged at 2000 × g for 10 minutes at 4°C. The supernatant was aliquoted in volumes of 0.5 mL into sterile polypropylene tubes (Sarstedt Screw Cap Micro Tube; 0.5 mL; PP; ref. 72.730.105), and immediately frozen at −80°C pending biochemical analysis. The time between collection and freezing was less than 30 minutes and the samples were kept at room temperature during their processing. Samples were shipped on dry ice from the BBRC (Barcelona, Spain) to the Clinical Neurochemistry Laboratory, Sahlgrenska University Hospital, Mölndal (Sweden), where all the measurements were performed.
2.2. Ethics approval and consent to participate
Anonymized sample collection at the Clinical Chemistry Laboratory, Sahlgrenska University Hospital was conducted in accordance with the Ethics Committee at University of Gothenburg (EPN140811). The AlfaAge study (2018/8089/I) was approved by the Independent Ethics Committee “Parc de Salut Mar,” Barcelona. All participants in the AlfaAge study signed the study's informed consent form that had also been approved by the Independent Ethics Committee “Parc de Salut Mar,” Barcelona.
2.3. Blood biomarker analysis
All biomarker analysis was performed on Simoa HD‐X Analyzers (Quanterix) at the Clinical Neurochemistry Laboratory, Sahlgrenska University Hospital, Sweden. Commercially available kits were used for NfL (NF‐light™ Advantage Kit, #103186), pNfH (pNF‐heavy Discovery Kit, #102669), GFAP (GFAp Discovery Kit, #102336), Aβ42, Aβ40, and t‐tau (Advantage Neuro 3‐plex, #101995). P‐tau181 was performed using the in‐house Simoa assay developed at the University of Gothenburg. 18 Further details about each assay are provided in Table S2 in supporting information. Internal quality controls (iQC) assessed the intra‐ and inter‐assay variability of each assay (Table S2). Prior to biomarker analysis, blood samples stored at −80°C were thawed, vortexed, and centrifuged at 4000 × g for 10 minutes. For the freeze–thawing experiment, individual aliquots mimicked the preanalytical procedures (thawed, vortexed, and centrifugation) as previously described and stored at −80°C until four freeze–thaw cycles had been achieved. Freeze–thaw cycle (1–4) for each participant were then analyzed simultaneously to avoid variability (Figure 1).
FIGURE 1.
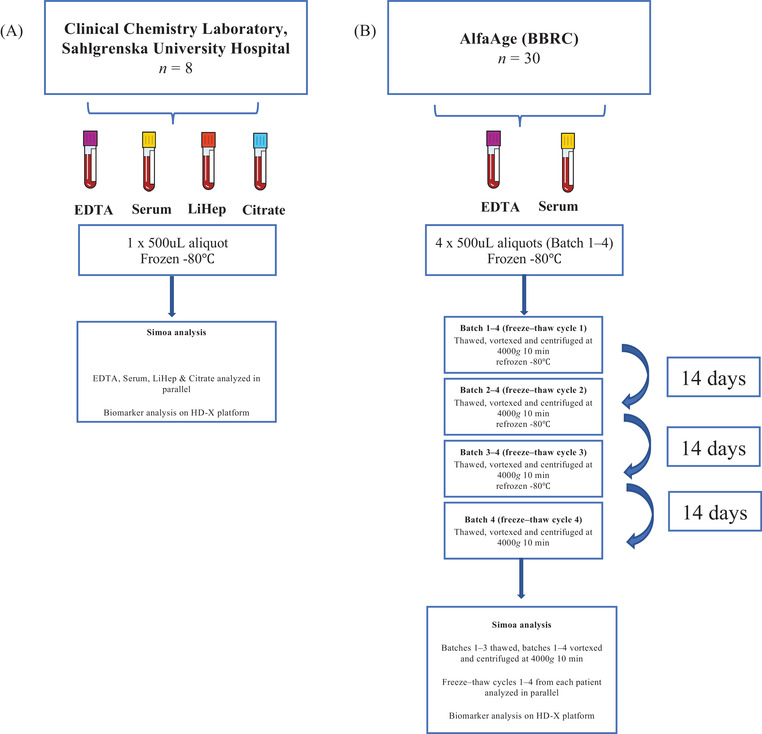
Schematic of study design. To study the tube type effect on blood biomarkers (A), whole blood from eight individuals was collected by venipuncture into ethylenediaminetetraacetic acid (EDTA), serum, lithium heparin (LiHep), and citrate tubes simultaneously at the Clinical Chemistry Laboratory, Sahlgrenska University Hospital, Mölndal. Blood types were centrifuged within 2 h of collection at 20°C, spun at 2000× g for 10 min, aliquoted into 500 μL, and stored at –80°C pending biochemical analysis. Prior to Simoa analysis, 1 × 500 μL aliquot for each patient and each tube type was thawed, vortexed, and centrifuged at 4000× g for 10 min. Tube types from a single patient were analyzed simultaneously. To test the effect of freeze–thaw cycles in EDTA plasma and serum (B), samples from 30 participants from the AlfaAge study were collected. Whole blood was drawn into EDTA and serum tubes, centrifuged at 2000× g for 10 min at 4°C, and aliquoted into 4 × 500 μL volumes and immediately frozen at −80°C. Samples were then thawed in batches (batched 1 thawed once, batched 2 thawed twice, etc.) until four freeze–thaw cycles had been achieved. At each freeze–thaw cycle, samples mimicked same preanalytical Simoa handling (vortexed and centrifuged at 4000× g for 10 min). Samples were refrozen at –80°C pending biochemical analysis. At the final freeze–thaw (no. 4) all samples were thawed and analyzed consecutively (freeze–thaw 1, 2, 3, 4) for each biomarker
2.4. Statistical analysis
Data normality was determined by the D'Agostino‐Pearson test, which demonstrated a non‐normal distribution for all blood biomarkers. The association of blood biomarkers with age (young vs. old) and sex was determined by a Mann‐Whitney U test. A Wilcoxon signed rank test was conducted to determine dependent group differences between blood biomarkers in different tube types. A Wilcoxon signed rank test also tested the concentration difference and % change (%Δ) in blood biomarker in freeze–thaw cycles compared to freeze–thaw cycle 1. Spearman's correlation assessed the relationship between continuous variables. Statistical analysis was performed using IBM SPSS Statistics, version 27 and Graph Pad PRISM 7 for visualization.
3. RESULTS
The demographic details and the association of age and sex with plasma biomarkers for the AlfaAge cohort are shown and described in Tables S3‐S4 in supporting information.
3.1. The effect of tube type on biomarker concentrations
The highest mean value for all blood biomarkers was observed in LiHep tubes (Table 1). The citrate tube type had the lowest mean concentration for NfL, pNfH, and GFAP, whereas Aβ42 and Aβ40 measures, t‐tau, and p‐tau181 were lowest for serum. All blood biomarkers demonstrated statistically different levels between tube types (Figure 2A–H). For NfL, significant differences were found between all tube types except for the analysis between serum and LiHep (Figure 2A). In contrast, only a comparison between EDTA plasma and serum were non‐significant for pNfH, while all other comparisons were significantly different (Figure 2B). GFAP demonstrated differences in comparisons that only included citrate plasma (Figure 2C). For Aβ measures, Aβ42 was statistically different between all tube types (Figure 2D), while Aβ40 showed no difference between EDTA plasma compared to LiHep and also citrate (Figure 2E). The Aβ42/40 ratio was not different between EDTA plasma and serum but significant for all other comparisons (Figure 2F). Blood t‐tau and p‐tau181 demonstrated differences between tube types, including highly significant changes between serum and LiHep (Figure 2G–H, both P < .001). Both t‐tau and p‐tau181 showed nonsignificant differences between EDTA and citrate plasma.
TABLE 1.
Mean biomarker concentrations for EDTA, serum, LiHep, and citrate tube types
| EDTA | Serum | Lithium heparin | Citrate | |
|---|---|---|---|---|
| NfL, pg/mL – mean (SD) | 46.0 (79.3) | 59.4 (111) | 60.9 (107) | 35.7 (60.8) |
| pNfH, pg/mL – mean (SD) | 92.3 (118) | 106.5 (143) | 204 (281) | 63.6 (75.1) |
| GFAP, pg/mL – mean (SD) | 217 (161) | 214 (141) | 225 (164) | 164 (110) |
| Aβ42, pg/mL – mean (SD) | 13.1 (6.4) | 11.2 (5.4) | 16.7 (8.2) | 15.1 (7.1) |
| Aβ40, pg/mL – mean (SD) | 346 (156) | 304 (146) | 357 (167) | 332 (156) |
| Aβ42/40, mean (SD) | 0.04 (0.01) | 0.04 (0.01) | 0.05 (0.01) | 0.05 (0.01) |
| t‐tau, pg/mL – mean (SD) | 2.3 (1.3) | 0.9 (0.6) | 6.2 (5.5) | 2.9 (2.0) |
| p‐tau181, pg/mL – mean (SD) | 35.2 (45.6) | 22.9 (32.5) | 88.4 (125) | 30.9 (41.8) |
Abbreviations: Aβ, amyloid beta; EDTA, ethylenediaminetetraacetic acid; GFAP, glial fibrillary acidic protein; LiHep, lithium heparin; NfL, neurofilament light; pNfH, phosphorylated neurofilament heavy protein; p‐tau181, phosphorylated tau 181; SD, standard deviation; t‐tau, total tau.
FIGURE 2.
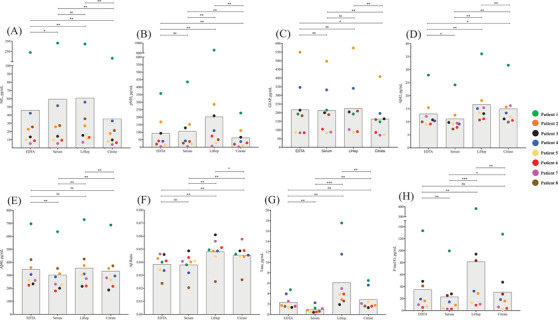
Biomarker concentrations in ethylenediaminetetraacetic acid (EDTA), serum, lithium heparin (LiHep), and citrate. Individual measurements (pg/mL) of (A) neurofilament light (NfL), (B) phosphorylated neurofilament heavy protein (pNfH), (C) glial fibrillary acidic protein (GFAP), (D) amyloid beta (Aβ)42, (E) Aβ40, (F) Aβ42/40, (G) total tau (t‐tau), and (H) phosphorylated tau 181 (p‐tau181) of eight individuals for EDTA, serum, LiHep, and citrate. Each color represents one individual. Gray boxes represent the mean pg/mL values for all eight individuals. * P < .05. ** P < .01. *** P < .001
Using EDTA plasma as the reference, the percentage change (%Δ) for serum, LiHep, and citrate was compared (Figure 3A–H). For NfL, serum and LiHep exhibited a 11.3% (standard deviation [SD] = 13.1%) and 28.2% (SD = 10.1%) increase, respectively, compared to EDTA (Figure 3A). In contrast, citrate demonstrated a more uniform decrease of 22.3% (SD = 3.1%, Figure 3A). Similar findings were observed for pNfH (Figure 3B), with a markedly more pronounced increase in LiHep (111.1%, SD = 40.3%). For GFAP, mean increases of only 3% to 6% were found for serum (SD = 10.9%) and LiHep (SD = 8.9%) but a decrease of 19.3% (SD = 13.1%) for citrate (Figure 3C). Reductions of Aβ42 (13%, SD = 7.5%) and Aβ40 (12.7%, SD = 3.1%) in serum were clear and consistent (Figure 3D–E). Increases in Aβ42 concentration was found for LiHep (27.7%, SD = 11.5%) and citrate (16%, SD = 13.5%) but inconsistencies were observed for Aβ40. The Aβ ratio did not improve the %Δ variability between tube types (Figure 3F). Both t‐tau (61.2%, SD = 10.4%) and p‐tau181 (45.8%, SD = 17.4%) had a consistent decrease in serum concentration (Figure 3G–H). In addition, both t‐tau and p‐tau181 were substantially increased in LiHep (t‐tau, 134.1%, SD = 71.2%; p‐tau181, 81.9%, SD = 53.8%). For citrate, an increase of 18.2% (SD = 32.5%) was observed for t‐tau, while p‐tau181 decreased by 27.3% (SD = 29.1%).
FIGURE 3.
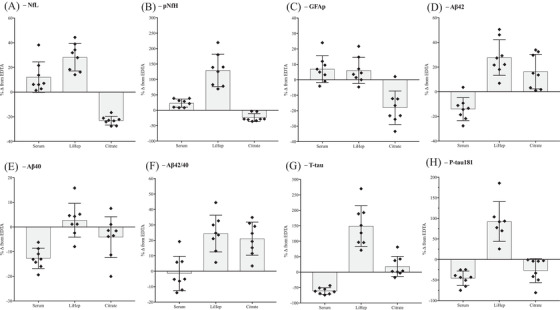
Percentage change (%Δ) from ethylenediaminetetraacetic acid (EDTA) plasma. Individual %Δ of (A) neurofilament light (NfL), (B) phosphorylated neurofilament heavy protein (pNfH), (C) glial fibrillary acidic protein (GFAP), (D) amyloid beta (Aβ)42, (E) Aβ40, (F) Aβ42/40, (G) total tau (t‐tau), and (H) phosphorylated tau 181 (p‐tau181) of eight individuals for serum, lithium heparin (LiHep), and citrate compared to EDTA. Gray boxes represent the mean %Δ for all eight individuals
All blood fractions were highly correlated with each other for NfL, pNfH, GFAP, Aβ42, Aβ40 (Figure 4A–E, r = 0.940‐1), and p‐tau181 (Figure 4H, r = 0.968–0.991). However, for Aβ42/40, blood fractions were less associated (Figure 4F, r = 0.636–0.861), which were marginally weaker for correlations involving serum. Correlations of t‐tau between EDTA, LiHep, and citrate were high (Figure 4G, r = 0.945–0.961) but were substantially weaker for correlations that included serum (Figure 4G, r = 0.459–0.643).
FIGURE 4.
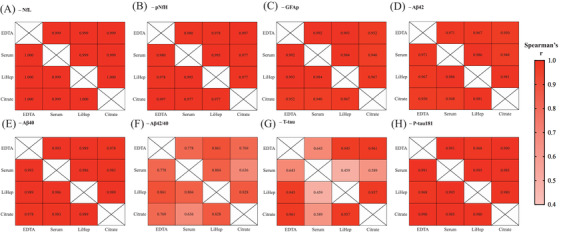
Correlation of ethylenediaminetetraacetic acid (EDTA), serum, lithium heparin (LiHep), and citrate. Heat maps represent the correlations (Spearman's rho) between tube types and (A) neurofilament light (NfL), (B) phosphorylated neurofilament heavy protein (pNfH), (C) glial fibrillary acidic protein (GFAP), (D) amyloid beta (Aβ)42, (E) Aβ40, (F) Aβ42/40, (G) total tau (t‐tau), and (H) phosphorylated tau 181 (p‐tau181). Correlations of EDTA and serum for the AlfaAge cohort can be found in Table S5
Correlations between EDTA plasma and serum were replicated in the AlfaAge cohort (Table S5 in supporting information). NfL, pNfH, and GFAP were highly correlated in the whole group (r > 0.97) and also in young and old age subgroups. For p‐tau181, high correlations of EDTA and serum were only observed in the old group (r = 0.902); weaker correlations were seen in the young group (r = 0.322). Stronger correlations in the older groups were also observed for Aβ42 and Aβ40 whereas Aβ42/40 had a similar correlation coefficient regardless of age. T‐tau demonstrated a weak correlation between EDTA and serum regardless of age group.
3.2. The effect of freeze–thaw cycles on biomarker concentrations
Finally, using samples from 30 AlfaAge study participants, we assessed whether EDTA plasma and serum biomarker concentrations were sensitive to freeze–thaw cycles.
A Wilcoxon signed rank test compared biomarker concentration and %Δ in freeze–thaw cycles 2 to 4 compared to freeze–thaw cycle 1 (Figure 5). No significant effects of repeated freeze–thawing was observed for EDTA plasma and serum NfL (Figure 5A) or pNfH (Figure 5B); however, pNfH demonstrated larger variability in %Δ compared to NfL. GFAP demonstrated no significant change compared to freeze‐thaw cycle 1 (Figure 5C). Plasma Aβ42 was shown to be stable up to freeze‐thaw cycle 4. However, serum Aβ42 concentration significantly decreased at freeze‐thaw cycle 3 (P < .0001) and freeze‐thaw cycle 4 (P < .0001) but not freeze‐thaw cycle 2 compared to freeze‐thaw cycle 1 (Figure 5D). In comparison, plasma Aβ40 was significantly decreased at freeze–thaw cycle 4 (P < .05, Figure 5E) and serum Aβ40 was significantly decreased at all freeze–thaw cycle timepoints (freeze–thaw cycle 1, P < .05; freeze–thaw cycles 2 and 3, P < .0001; Figure 5E). Importantly, the plasma Aβ42/40 ratio compensated for significant changes in plasma Aβ40 as it was shown to be stable at all freeze–thaw cycles (Figure 5F). The serum Aβ42/40 ratio, to some degree, also compensated for variability in single Aβ42 and Aβ40 measures but was still significantly changed at freeze–thaw cyclse 3 and 4 (both P < .05, Figure 5F). No significant change in concentration or %Δ of EDTA t‐tau was observed; however, significant differences were shown for serum t‐tau at freeze–thaw cycles 3 and 4 (Figure 5G). It must be noted that both EDTA and serum t‐tau values demonstrated large variability likely owing to the overall low concentrations measured in these samples. Mean concentrations of EDTA and serum for p‐tau181 decreased over freeze–thaw cycles but reached statistical difference at freeze–thaw cycle 4 for plasma (P < .01) but not serum; however, serum p‐tau181 freeze–thaw cycle 4 was approaching significance (P = .065, Figure 5H).
FIGURE 5.
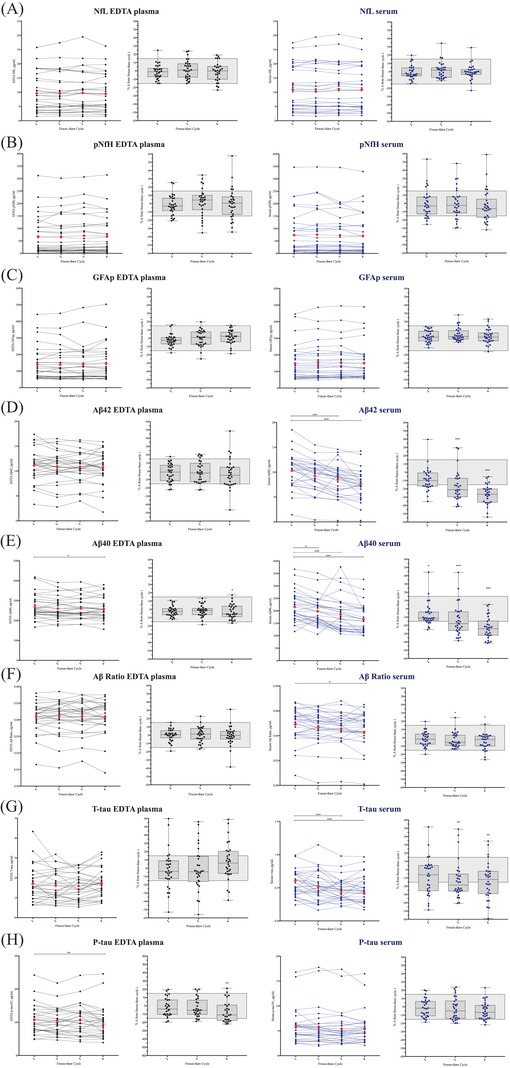
Effect of freeze–thaw cycle on ethylenediaminetetraacetic acid (EDTA) plasma and serum biomarker concentrations. The effect of freeze–thaw cycle on biomarker concentrations for (A) neurofilament light (NfL), (B) phosphorylated neurofilament heavy protein (pNfH), (C) glial fibrillary acidic protein (GFAP), (D) amyloid beta (Aβ)42, (E) Aβ40, (F) Aβ42/40, (G) total tau (t‐tau), and (H) phosphorylated tau 181 (p‐tau181). Plots 1 and 2 are for EDTA plasma and plots 3 and 4 are for serum. Plots 1 and 3 represents the pg/mL value for all 30 AlfaAge participants across four freeze–thaw cycles. The red diamond represents the mean value at each freeze–thaw cycle. Plots 2 and 4 represent the %Δ for all 30 AlfaAge participants in freeze–thaw cycles 2 to 4 compared to freeze–thaw cycles 1. The gray boxes represent a 15% change. * P < .05 compared to freeze–thaw cycle 1. ** P < .01 compared to freeze–thaw cycle 1. *** P < .001 compared to freeze–thaw cycle 1
4. DISCUSSION
The advancement of ultrasensitive immunoassays now offers a wide range of easily measurable blood biomarkers that reflect, to varying degrees, aspects of neurodegeneration, acute neurological injury, glial activity, and AD pathophysiology. There is much anticipation that these biomarkers will act as rapid pre‐screening tools in primary care, therapeutic trials, disease monitoring, or response to treatment. Yet, several methodological and pre‐analytical issues need to be clarified before these tests can be routinely performed in the clinic. In the present study, we investigated the main blood biomarkers explored in neurodegenerative disorders, and we found that the type of tube used for sample collection and the number of freeze–thaw cycles affect the measurements of some biomarkers.
First, regarding the type of tube for sample collection, EDTA plasma and LiHep were highly correlated in all scenarios investigated. However, LiHep was also shown to give the highest concentrations in all blood biomarkers in this study. Thus, biomarkers with expected low concentrations, close to the lower limit of quantification of the assay, may benefit from using LiHep. This could be of particular importance for p‐tau181 (or other p‐tau biomarkers) for which Aβ‐negative controls and non‐AD neurodegenerative disorders exhibit very low concentrations. 18 , 39 Absolute levels of LiHep, citrate, and serum samples differ considerably to EDTA plasma for some biomarkers. Particularly, NfL and GFAP concentrations in citrate plasma were > 20% lower than in EDTA plasma, and Aβ, p‐tau181, and t‐tau concentrations in serum were > 10%, > 25%, and > 50% lower than in EDTA plasma, respectively. Despite the sample size, a significant difference in biomarker concentration was found for the majority of comparisons and therefore this should be a fundamental consideration comparing blood biomarker measurements in different tube types.
Regarding freeze–thaw cycles, EDTA plasma measures of NfL, pNfH, GFAP, Aβ42, and Aβ42/40 remain stable over four freeze–thaw cycles. This demonstrates that comparing patient samples with differing freeze–thaw cycles will not have an impact on the outcome. The stability of neurofilaments in plasma has been shown previously 40 , 41 , 42 but less is reported on plasma GFAP and Aβ. We demonstrate that measurements in EDTA plasma samples that have undergone up to four freeze–thaw cycles are reliable for Aβ42, Aβ42/40, and GFAP. EDTA Aβ40 is significantly decreased at the fourth freeze–thaw cycle but can be compensated for by the Aβ42/40 ratio. EDTA plasma p‐tau181 was also shown to be stable for up to three freeze–thaw cycles, but a significant decrease was observed at freeze–thaw cycle 4. Serum p‐tau181 was not significant in this analysis but demonstrated a trend toward a significant change. Like plasma, serum measures of NfL, pNfH, and GFAP remain stable over four freeze–thaw cycles. However, serum Aβ42, Aβ40, and t‐tau were all susceptible to repeated freeze–thawing, which resulted in significantly lower concentrations after freeze–thaw cycle 2, which continued to decrease in subsequent freeze–thaw cycles. While the serum Aβ42/40 ratio partially counteracted these changes, significant decreases were observed at later freeze–thaw cycles.
There are limitations to this study. First, while we included four variables in comparing tube types, only EDTA plasma and serum were studied for the freeze–thaw cycle experiment. Therefore, we cannot conclude how LiHep and citrate concentrations change over freeze–thaw cycles. Second, every sample had undergone one freeze–thaw cycle before starting the study, thus we could not compare how biomarker concentrations change from fresh blood to the first freeze–thaw cycle. Third, this tudy preceeded the development of blood p‐tau217 or p‐tau231 and thus could not be added to our comparisons given the strict study design. We also acknowledge that there may be additional aspects to blood pre‐analytics that were not examined here, for example, storage temperature, storage time, and centrifugation speed at collection or before analysis. The main strengths of our study are that all samples were collected following standardized procedures, and that our centers (University of Gothenburg and BBRC) are highly experienced in collection and processing of blood samples. In addition, we used analytically sensitive, robust, and reproducible biomarker assays that were completed in one round of experiments, which minimized the analytical variation. All assays are now comemrically avaliable for all users.
Based on our findings, we propose the following recommendations for blood biomarker analysis in neurology: (1) EDTA, serum, LiHep, and citrate tubes cannot be used interchangeably for the examined biomarkers because they give significantly different absolute concentrations, albeit being highly correlated; (2) NfL and pNfH measures can be reliably used up to four freeze–thaw cycles; (3) serum should be avoided for Aβ42, Aβ40, and t‐tau measures due to poor correlation with other tube types and sensitivity to freeze–thaw cycles; (4) EDTA Aβ40 should be avoided > 3 freeze–thaw cycles but can be compensated for by the Aβ42/40 ratio, and (5) > 3 freeze‐thaw cycles should be avoided for p‐tau181.
CONFLICTS OF INTEREST
MSC has served as a consultant and on advisory boards for Roche Diagnostics International Ltd and has given lectures in symposia sponsored by Roche Diagnostics, S.L.U., and Roche Farma, S.A. KB has served as a consultant, on advisory boards, or on data monitoring committees for Abcam, Axon, Biogen, JOMDD/Shimadzu, Julius Clinical, Lilly, MagQu, Novartis, Roche Diagnostics, and Siemens Healthineers, and is a co‐founder of Brain Biomarker Solutions in Gothenburg AB (BBS), which is a part of the GU Ventures Incubator Program. HZ has served at scientific advisory boards for Denali, Roche Diagnostics, Wave, Samumed, Siemens Healthineers, Pinteon Therapeutics, Nervgen, and CogRx; has given lectures in symposia sponsored by Fujirebio, Alzecure, and Biogen; and is a co‐founder of Brain Biomarker Solutions in Gothenburg AB (BBS), which is a part of the GU Ventures Incubator Program.
AUTHOR CONTRIBUTIONS
NJA, MSC, KB, and HZ created the concept and design. Samples were provided by MSC, CM, KF, KB, and HZ. Data acquisition was performed by NJA, MSC, TKK, JLR, AS, MS, and JS. NJA, MSC, KB, and HZ performed data analysis and data interpretation. NJA, MSC, KB, and HZ drafted the manuscript and all authors revised. All authors read and approved the final submitted version of the manuscript.
Supporting information
Supporting information.
ACKNOWLEDGMENTS
The authors would like to express their most sincere gratitude to the AlfaAge participants. We also thank Tania Menchón, Montse Vilà, and Irina Nilsson for technical assistance. NJA is supported by the Wallenberg Centre for Molecular and Translational Medicine, the Swedish Alzheimer Foundation (Alzheimerfonden #AF‐931009), Hjärnfonden (#FO2020‐0241), the Swedish Dementia Foundation (Demensförbundet), Agneta Prytz‐Folkes and Gösta Folkes, Gun and Bertil Stohnes foundation, and Gamla Tjänarinnor. MSC received funding from the European Union's Horizon 2020 Research and Innovation Program under the Marie Sklodowska‐Curie action grant agreement No 752310, and currently receives funding from Instituto de Salud Carlos III (PI19/00155) and from the Spanish Ministry of Science, Innovation and Universities (Juan de la Cierva Programme grant IJC2018‐037478‐I). TKK holds a Brightfocus postdoctoral fellowship (#A2020812F), and was further supported by the Swedish Alzheimer Foundation (Alzheimerfonden), the Swedish Dementia Foundation (Demensförbundet), Parkinsonfonden, Gamla Tjänarinnor, the Aina (Ann) Wallströms and Mary‐Ann Sjöbloms Foundation, the Gun and Bertil Stohnes foundation, and the Anna Lisa and Brother Björnsson's Foundation. AS was supported by the Paulo Foundation, and currently receives funding from the Orion Research Foundation sr. KB is supported by the Swedish Research Council (#2017‐00915), the Alzheimer Drug Discovery Foundation (ADDF), USA (#RDAPB‐201809‐2016615), the Swedish Alzheimer Foundation (#AF‐742881), Hjärnfonden, Sweden (#FO2017‐0243), the Swedish state under the agreement between the Swedish government and the County Councils, the ALF‐agreement (#ALFGBG‐715986), the European Union Joint Program for Neurodegenerative Disorders (JPND2019‐466‐236), and the National Institute of Health (NIH), USA, (grant #1R01AG068398‐01). HZ is a Wallenberg Scholar supported by grants from the Swedish Research Council (#2018‐02532), the European Research Council (#681712), Swedish State Support for Clinical Research (#ALFGBG‐720931), the Alzheimer Drug Discovery Foundation (ADDF), USA (#201809‐2016862), the AD Strategic Fund and the Alzheimer's Association (#ADSF‐21‐831376‐C, #ADSF‐21‐831381‐C and #ADSF‐21‐831377‐C), the Olav Thon Foundation, the Erling‐Persson Family Foundation, Stiftelsen för Gamla Tjänarinnor, Hjärnfonden, Sweden (#FO2019‐0228), the European Union's Horizon 2020 research and innovation programme under the Marie Skłodowska‐Curie grant agreement No 860197 (MIRIADE), and the UK Dementia Research Institute at UCL.
Ashton NJ, Suárez‐Calvet M, Karikari TK, et al. Effects of pre‐analytical procedures on blood biomarkers for Alzheimer's pathophysiology, glial activation, and neurodegeneration. Alzheimer's Dement. 2021;13:ed212168. 10.1002/dad2.12168
REFERENCES
- 1. Lleo A, Cavedo E, Parnetti L, et al. Cerebrospinal fluid biomarkers in trials for Alzheimer and Parkinson diseases. Nat Rev Neurol. 2015;11(1):41‐55. [DOI] [PubMed] [Google Scholar]
- 2. Blennow K, Zetterberg H. Biomarkers for Alzheimer's disease: current status and prospects for the future. J Intern Med. 2018;284(6):643‐663. [DOI] [PubMed] [Google Scholar]
- 3. Scholl M, Maass A, Mattsson N, et al. Biomarkers for tau pathology. Mol Cell Neurosci. 2019;97:18‐33. [DOI] [PMC free article] [PubMed] [Google Scholar]
- 4. Leuzy A, Heurling K, Ashton NJ, Scholl M, Zimmer ER. In vivo Detection of Alzheimer's Disease. Yale J Biol Med. 2018;91(3):291‐300. [PMC free article] [PubMed] [Google Scholar]
- 5. Nath S, Koziarz A, Badhiwala JH, et al. Atraumatic versus conventional lumbar puncture needles: a systematic review and meta‐analysis. Lancet. 2018;391(10126):1197‐1204. [DOI] [PubMed] [Google Scholar]
- 6. Engelborghs S, Niemantsverdriet E, Struyfs H, et al. Consensus guidelines for lumbar puncture in patients with neurological diseases. Alzheimers Dement (Amst). 2017;8:111‐126. [DOI] [PMC free article] [PubMed] [Google Scholar]
- 7. Ashton NJ, Hye A, Rajkumar AP, et al. An update on blood‐based biomarkers for non‐Alzheimer neurodegenerative disorders. Nat Rev Neurol. 2020;16(5):265‐284. [DOI] [PubMed] [Google Scholar]
- 8. O'Bryant SE, Gupta V, Henriksen K, et al. Guidelines for the standardization of preanalytic variables for blood‐based biomarker studies in Alzheimer's disease research. Alzheimers Dement. 2015;11(5):549‐560. [DOI] [PMC free article] [PubMed] [Google Scholar]
- 9. Ashton NJ, Leuzy A, Lim YM, et al. Increased plasma neurofilament light chain concentration correlates with severity of post‐mortem neurofibrillary tangle pathology and neurodegeneration. Acta Neuropathol Commun. 2019;7(1):5. [DOI] [PMC free article] [PubMed] [Google Scholar]
- 10. Mattsson N, Andreasson U, Zetterberg H, Blennow K. Alzheimer's disease neuroimaging I. Association of Plasma Neurofilament Light With Neurodegeneration in Patients With Alzheimer Disease. JAMA Neurol. 2017;74(5):557‐566. [DOI] [PMC free article] [PubMed] [Google Scholar]
- 11. Rodrigues FB, Byrne LM, Tortelli R, et al. Mutant huntingtin and neurofilament light have distinct longitudinal dynamics in Huntington's disease. Sci Transl Med. 2020;12(574). [DOI] [PMC free article] [PubMed] [Google Scholar]
- 12. Ashton NJ, Janelidze S, Al Ahmad K, Leuzy A, Van der Ende EL, Karikari TK, Diagnostic value of plasma neurofilament light: A multicentre validation study. PREPRINT (Version 1) available at Research Square [+ https://doiorg/1021203/rs3rs‐63386/v1+]. 31 August 2020.
- 13. Wihersaari L, Ashton NJ, Reinikainen M, et al. Neurofilament light as an outcome predictor after cardiac arrest: a post hoc analysis of the COMACARE trial. Intensive Care Med. 2021;47(1):39‐48. [DOI] [PMC free article] [PubMed] [Google Scholar]
- 14. Moseby‐Knappe M, Mattsson N, Nielsen N, et al. Serum neurofilament light chain for prognosis of outcome after cardiac arrest. JAMA Neurol. 2019;76(1):64‐71. [DOI] [PMC free article] [PubMed] [Google Scholar]
- 15. Wilke C, Pujol‐Calderon F, Barro C, et al. Correlations between serum and CSF pNfH levels in ALS, FTD and controls: a comparison of three analytical approaches. Clin Chem Lab Med. 2019;57(10):1556‐1564. [DOI] [PubMed] [Google Scholar]
- 16. De Schaepdryver M, Jeromin A, Gille B, et al. Comparison of elevated phosphorylated neurofilament heavy chains in serum and cerebrospinal fluid of patients with amyotrophic lateral sclerosis. J Neurol Neurosurg Psychiatry. 2018;89(4):367‐373. [DOI] [PubMed] [Google Scholar]
- 17. Karikari TK, Benedet AL, Ashton NJ, et al. Diagnostic performance and prediction of clinical progression of plasma phospho‐tau181 in the Alzheimer's Disease Neuroimaging Initiative. Mol Psychiatry. 2021;26(2):429‐442. [DOI] [PubMed] [Google Scholar]
- 18. Karikari TK, Pascoal TA, Ashton NJ, et al. Blood phosphorylated tau 181 as a biomarker for Alzheimer's disease: a diagnostic performance and prediction modelling study using data from four prospective cohorts. Lancet Neurol. 2020;19(5):422‐433. [DOI] [PubMed] [Google Scholar]
- 19. Lantero Rodriguez J, Karikari TK, Suarez‐Calvet M, et al. Plasma p‐tau181 accurately predicts Alzheimer's disease pathology at least 8 years prior to post‐mortem and improves the clinical characterisation of cognitive decline. Acta Neuropathol. 2020;140(3):267‐278. [DOI] [PMC free article] [PubMed] [Google Scholar]
- 20. Benussi A, Ashton NJ, Karikari TK, et al. Serum glial fibrillary acidic protein (GFAP) is a marker of disease severity in frontotemporal lobar degeneration. J Alzheimers Dis. 2020;77(3):1129‐1141. [DOI] [PubMed] [Google Scholar]
- 21. Janelidze S, Mattsson N, Palmqvist S, et al. Plasma P‐tau181 in Alzheimer's disease: relationship to other biomarkers, differential diagnosis, neuropathology and longitudinal progression to Alzheimer's dementia. Nat Med. 2020;26(3):379‐386. [DOI] [PubMed] [Google Scholar]
- 22. Suarez‐Calvet M, Karikari TK, Ashton NJ, et al. Novel tau biomarkers phosphorylated at T181, T217 or T231 rise in the initial stages of the preclinical Alzheimer's continuum when only subtle changes in Abeta pathology are detected. EMBO Mol Med. 2020;12(12):e12921. [DOI] [PMC free article] [PubMed] [Google Scholar]
- 23. Simrén Joel, Leuzy Antoine, Karikari Thomas K., Hye Abdul, Benedet Andréa Lessa, Lantero‐Rodriguez Juan, Mattsson‐Carlgren Niklas, Schöll Michael, Mecocci Patrizia, Vellas Bruno, Tsolaki Magda, Kloszewska Iwona, Soininen Hilkka, Lovestone Simon, Aarsland Dag, Hansson Oskar, Rosa‐Neto Pedro, Westman Eric, Blennow Kaj, Zetterberg Henrik, Ashton Nicholas J., . The diagnostic and prognostic capabilities of plasma biomarkers in Alzheimer's disease. Alzheimer's & Dementia. 2021, 10.1002/alz.12283 [DOI] [PMC free article] [PubMed] [Google Scholar]
- 24. Barthelemy NR, Horie K, Sato C, Bateman RJ. Blood plasma phosphorylated‐tau isoforms track CNS change in Alzheimer's disease. J Exp Med. 2020;217(11). [DOI] [PMC free article] [PubMed] [Google Scholar]
- 25. Palmqvist S, Janelidze S, Quiroz YT, et al. Discriminative Accuracy of Plasma Phospho‐tau217 for Alzheimer Disease vs Other Neurodegenerative Disorders. JAMA. 2020;324(8):772‐781. [DOI] [PMC free article] [PubMed] [Google Scholar]
- 26. Ashton Nicholas J., Pascoal Tharick A., Karikari Thomas K., Benedet Andréa L., Lantero‐Rodriguez Juan, Brinkmalm Gunnar, Snellman Anniina, Schöll Michael, Troakes Claire, Hye Abdul, Gauthier Serge, Vanmechelen Eugeen, Zetterberg Henrik, Rosa‐Neto Pedro, Blennow Kaj. Plasma p‐tau231: a new biomarker for incipient Alzheimer’s disease pathology. Acta Neuropathologica. 2021, 10.1007/s00401-021-02275-6 [DOI] [PMC free article] [PubMed] [Google Scholar]
- 27. Mattsson N, Zetterberg H, Janelidze S, et al. Plasma tau in Alzheimer disease. Neurology. 2016;87(17):1827‐1835. [DOI] [PMC free article] [PubMed] [Google Scholar]
- 28. Zetterberg H, Wilson D, Andreasson U, et al. Plasma tau levels in Alzheimer's disease. Alzheimers Res Ther. 2013;5(2):9. [DOI] [PMC free article] [PubMed] [Google Scholar]
- 29. Mattsson N, Zetterberg H, Nielsen N, et al. Serum tau and neurological outcome in cardiac arrest. Ann Neurol. 2017;82(5):665‐675. [DOI] [PMC free article] [PubMed] [Google Scholar]
- 30. Randall J, Mortberg E, Provuncher GK, et al. Tau proteins in serum predict neurological outcome after hypoxic brain injury from cardiac arrest: results of a pilot study. Resuscitation. 2013;84(3):351‐356. [DOI] [PubMed] [Google Scholar]
- 31. Janelidze S, Stomrud E, Palmqvist S, et al. Plasma beta‐amyloid in Alzheimer's disease and vascular disease. Sci Rep. 2016;6:26801. [DOI] [PMC free article] [PubMed] [Google Scholar]
- 32. Verberk IMW, Thijssen E, Koelewijn J, et al. Combination of plasma amyloid beta(1‐42/1‐40) and glial fibrillary acidic protein strongly associates with cerebral amyloid pathology. Alzheimers Res Ther. 2020;12(1):118. [DOI] [PMC free article] [PubMed] [Google Scholar]
- 33. Nakamura A, Kaneko N, Villemagne VL, et al. High performance plasma amyloid‐beta biomarkers for Alzheimer's disease. Nature. 2018;554(7691):249‐254. [DOI] [PubMed] [Google Scholar]
- 34. Schindler R, Sharrett Z, Perri MJ, Lares M. Quantification of alpha‐Acids in Fresh Hops by Reverse‐Phase High‐Performance Liquid Chromatography. ACS Omega. 2019;4(2):3565‐3570. [DOI] [PMC free article] [PubMed] [Google Scholar]
- 35. Yue JK, Yuh EL, Korley FK, et al. Association between plasma GFAP concentrations and MRI abnormalities in patients with CT‐negative traumatic brain injury in the TRACK‐TBI cohort: a prospective multicentre study. Lancet Neurol. 2019;18(10):953‐961. [DOI] [PubMed] [Google Scholar]
- 36. Foerch C, Niessner M, Back T, et al. Diagnostic accuracy of plasma glial fibrillary acidic protein for differentiating intracerebral hemorrhage and cerebral ischemia in patients with symptoms of acute stroke. Clin Chem. 2012;58(1):237‐245. [DOI] [PubMed] [Google Scholar]
- 37. Chatterjee P, Pedrini S, Stoops E, et al. Plasma glial fibrillary acidic protein is elevated in cognitively normal older adults at risk of Alzheimer's disease. Transl Psychiatry. 2021;11(1):27. [DOI] [PMC free article] [PubMed] [Google Scholar]
- 38. Heller C, Chan E, Foiani MS, et al. Plasma glial fibrillary acidic protein and neurofilament light chain are measures of disease severity in semantic variant primary progressive aphasia. J Neurol Neurosurg Psychiatry. 2020. [DOI] [PubMed] [Google Scholar]
- 39. Benussi A, Karikari TK, Ashton N, et al. Diagnostic and prognostic value of serum NfL and p‐Tau181 in frontotemporal lobar degeneration. J Neurol Neurosurg Psychiatry. 2020;91(9):960‐967. [DOI] [PubMed] [Google Scholar]
- 40. Keshavan A, Heslegrave A, Zetterberg H, Schott JM. Stability of blood‐based biomarkers of Alzheimer's disease over multiple freeze‐thaw cycles. Alzheimers Dement (Amst). 2018;10:448‐451. [DOI] [PMC free article] [PubMed] [Google Scholar]
- 41. Altmann P, Leutmezer F, Zach H, et al. Serum neurofilament light chain withstands delayed freezing and repeated thawing. Sci Rep. 2020;10(1):19982. [DOI] [PMC free article] [PubMed] [Google Scholar]
- 42. Simrén Joel, Ashton Nicholas J., Blennow Kaj, Zetterberg Henrik. Blood neurofilament light in remote settings: Alternative protocols to support sample collection in challenging pre‐analytical conditions. Alzheimer's & Dementia: Diagnosis, Assessment & Disease Monitoring. 2021;13(1), 10.1002/dad2.12145. [DOI] [PMC free article] [PubMed] [Google Scholar]
Associated Data
This section collects any data citations, data availability statements, or supplementary materials included in this article.
Supplementary Materials
Supporting information.