Abstract
Photosensitizer fluorescence emission during photodynamic therapy (PDT) can be used to estimate for in vivo photosensitizer concentration. We built a surface contact probe with 405nm excitation light source to obtain Photofrin fluorescence signal during clinical PDT. The probe was equipped with multiple detector fibers that were located at distances between 0.14 to 0.87 cm laterally from the excitation source fiber. In this study, we investigated the probing depth of fluorescence in biological tissue with different source-detector separation using our contact probe setup. We used Monte Carlo method to simulate the 405nm excitation light and 630nm fluorescence probing depth at various source and detector (SD) separations. The results provided insight to the most probable depth of origin of detected fluorescence at each SD separation and help to understand the in vivo depth distribution of clinically measured Photofrin concentration.
Keywords: Photodynamic therapy, Photofrin concentration, photosensitizer fluorescence, Monte Carlo simulation, source and detector separation, probing depth
1. INTRODUCTION
Photosensitizer fluorescence emission during photodynamic therapy (PDT) can be used to estimate for in vivo photosensitizer concentration [1, 2]. To collect depth sensitive fluorescence spectra from underlying tissues/tumors, the probing depth of a surface probe can be changed by varying the distance between source and detector. Photofrin fluoresces in the 630–700 nm wavelength range and can be excited throughout the entire visible spectrum. Long wavelength (~630 nm) is frequently used as the treatment wavelength due to its greater penetration depth into biological tissue. Photofrin emits more fluorescence when excited at shorter wavelengths due to its higher coefficient of absorption. To obtain Photofrin fluorescence with higher signal-to-noise ratio (SNR) during clinical PDT, in which in vivo Photofrin concentration is typically very low, we built a fluorescence spectroscopy system, which utilizes 405nm laser as the excitation source. The system has a surface contact probe that was equipped with multiple detector fibers located at distances between 0.6 mm to 10 mm laterally from the excitation source fiber [3].
The dependence of probing depth on the distance between source and detector fibers has been previously investigated for fluorescence excitation and emission wavelength pair of 532/632.8nm [4]. However, in vivo light propagation for 405nm light can be very different from longer wavelengths due to the extremely high absorption of light by the blood in the blue region of the visible spectrum. In this study, we investigated the dependence of probing depth on source-detector separations for Photofrin fluorescence excitation/emission wavelength pair of 405/630nm. We used Monte Carlo modeling method to simulate the propagation of 405nm excitation light and the emission and propagation of its fluorescence light at 630nm in biological tissues. The simulation results show in vivo light distribution at different wavelengths and provide useful insight for the dependence of Photofrin fluorescence probing depth on the selection of source-detector separation for our contact probe design. This information is critical in understanding the in vivo depth distribution of clinically measured Photofrin concentration.
2. METHODS
2.1. Design of contact probe for fluorescence spectroscopy system
The fluorescence spectroscopy system uses a custom-built fiber-optic based optical probe, as shown in Figure 1, which is placed in physical contact with the tissue for fluorescence measurements. This probe consists of two source optical fibers, S1 and S2, and 9 detection fibers spaced nonuniformly between 0.14 and 0.88 cm away from S1. All fibers have a core diameter of 400um and numerical aperture of 0.22. The core-to-core distance between S1 and S2 is 0.07cm. This probe is designed to operate in two modes, diffuse reflectance spectroscopy and fluorescence spectroscopy. The former allows collection of diffuse reflectance using a white light source (Avalight, Avantes, Broomfield, CO) coupled to the first source fiber, and the latter allows collection of fluorescence spectra using a 405 nm excitation laser (Power Technologies, Inc., Little Rock, AK) coupled to the second source fiber. Both measurements use the same set of detection fibers, which are imaged by an integrated imaging spectrometer/multichannel CCD system (Inspectrum, Roper Scientific, Trenton, NJ).
Figure 1.
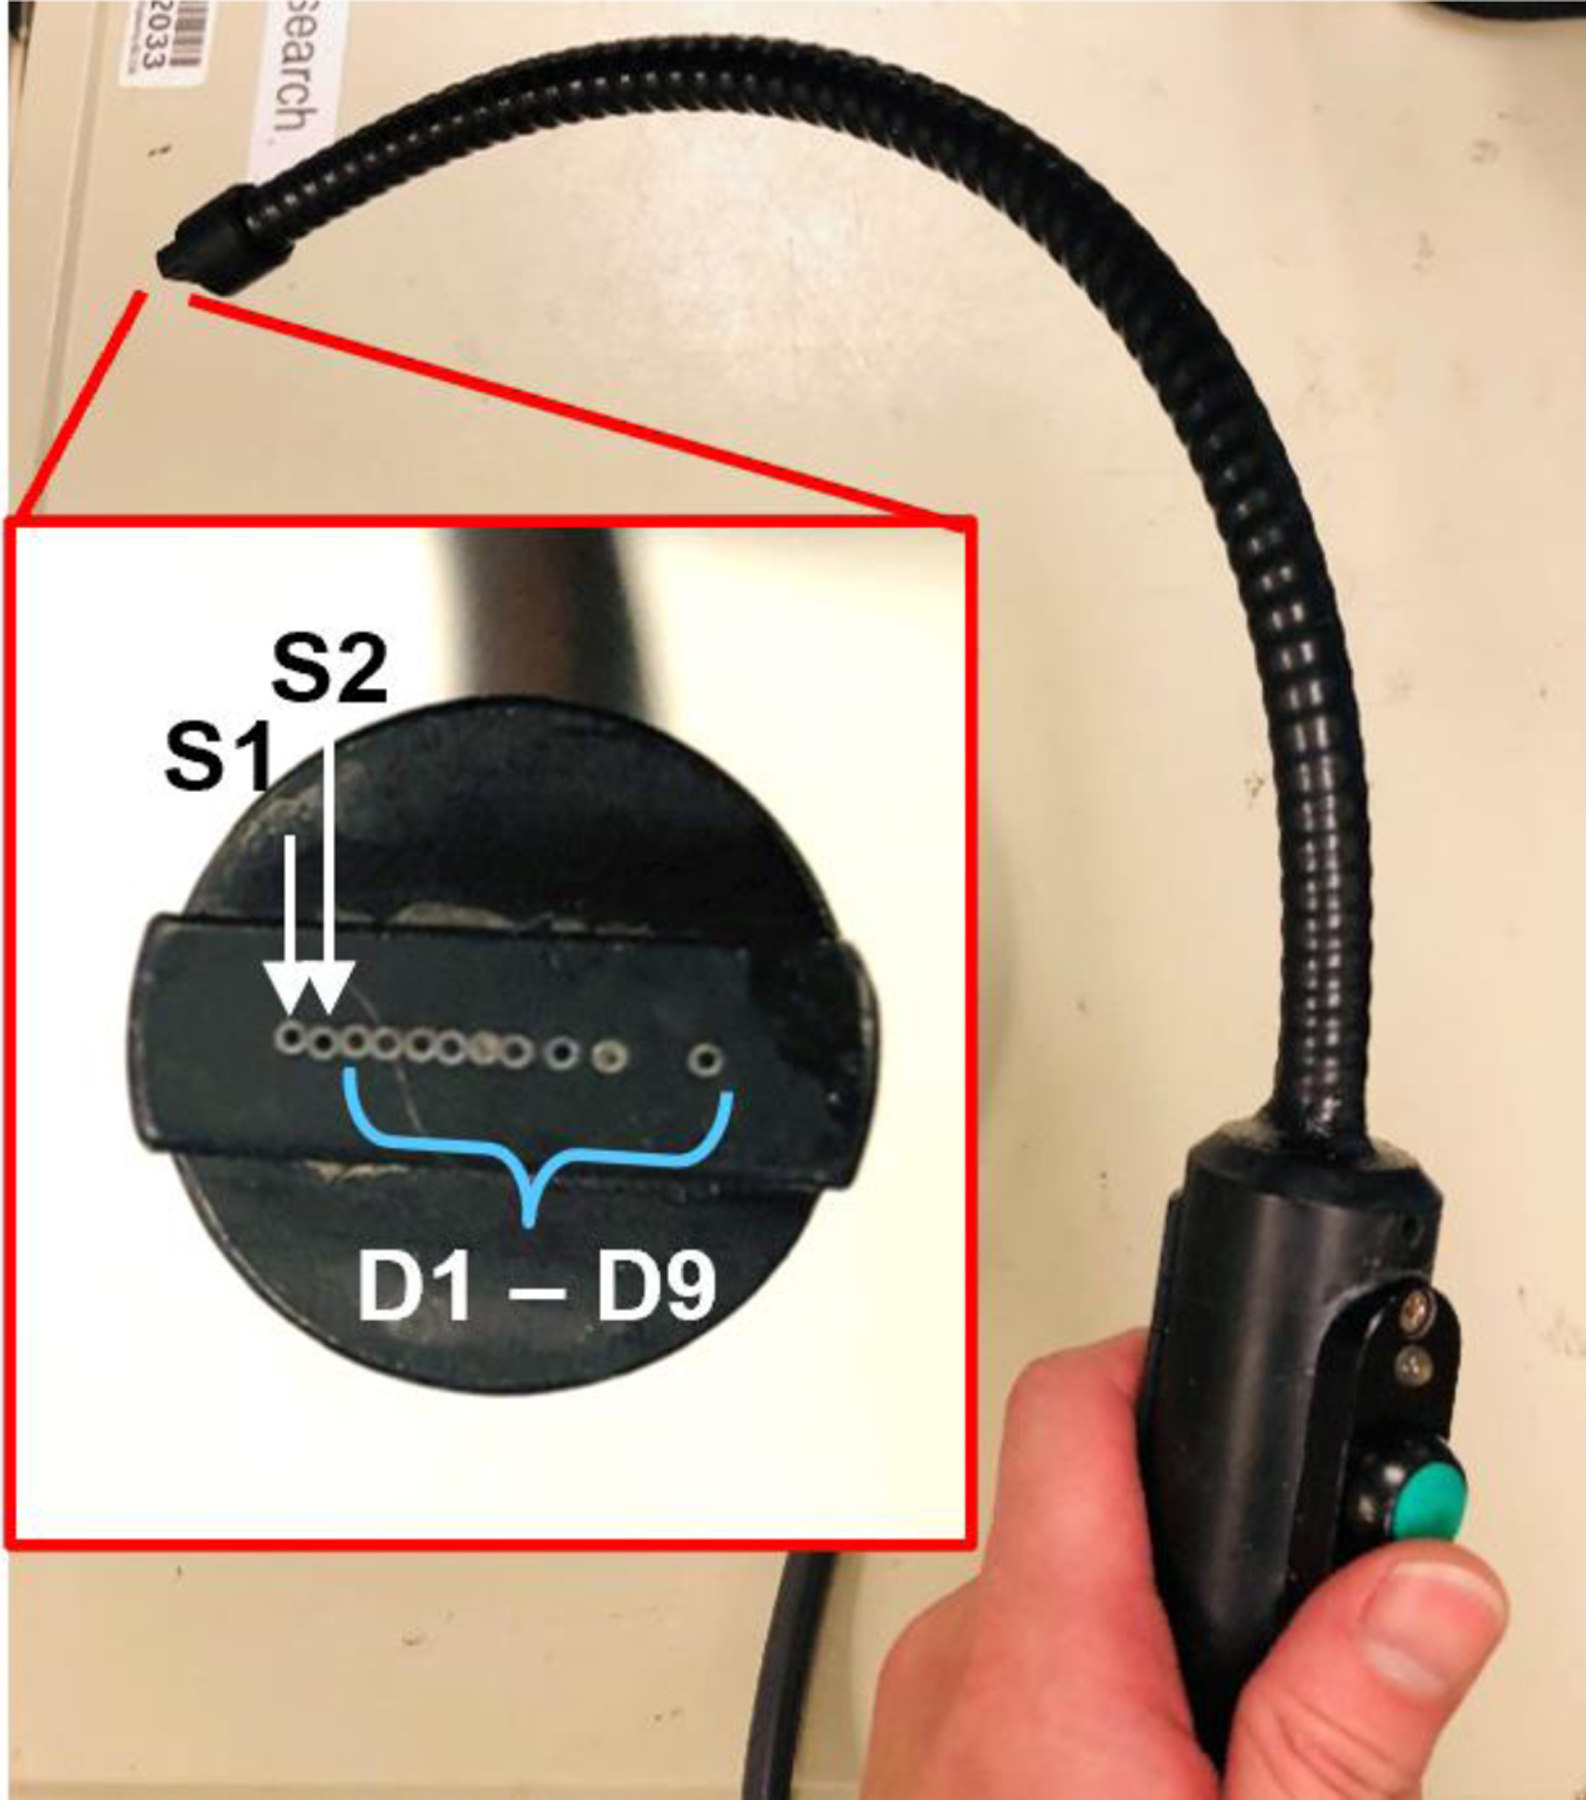
Image of surface contact probe of the fluorescence spectroscopy system and a close-up view of the optical fibers arrangements at the contact end of the probe. S1 and S2 are the source fibers. D1-D9 are the detection fibers.
2.2. Monte Carlo modeling of diffuse reflectance and fluorescence
Monte Carlo modeling was used to simulate diffuse reflectance and fluorescence spectroscopy measurements. The MC algorithm used here was written in Matlab (The Mathworks Inc., Natick, MA.) as described previously [5, 6]. The setup geometry to be calculated by Monte-Carlo simulation for a semi-infinite medium with uniform optical properties, i.e. the absorption coefficient μa, the reduced scattering coefficient , the scattering anisotropy g (= 0.9), and the index of refraction (1 for air and 1.37 for tissue) is shown in Figure 2. A source and a detector fibers were introduced at the air-tissue boundary, separated by a distance, ρ. Each fiber has a core diameter of 400μm and a numerical aperture of 0.22.
Figure 2.
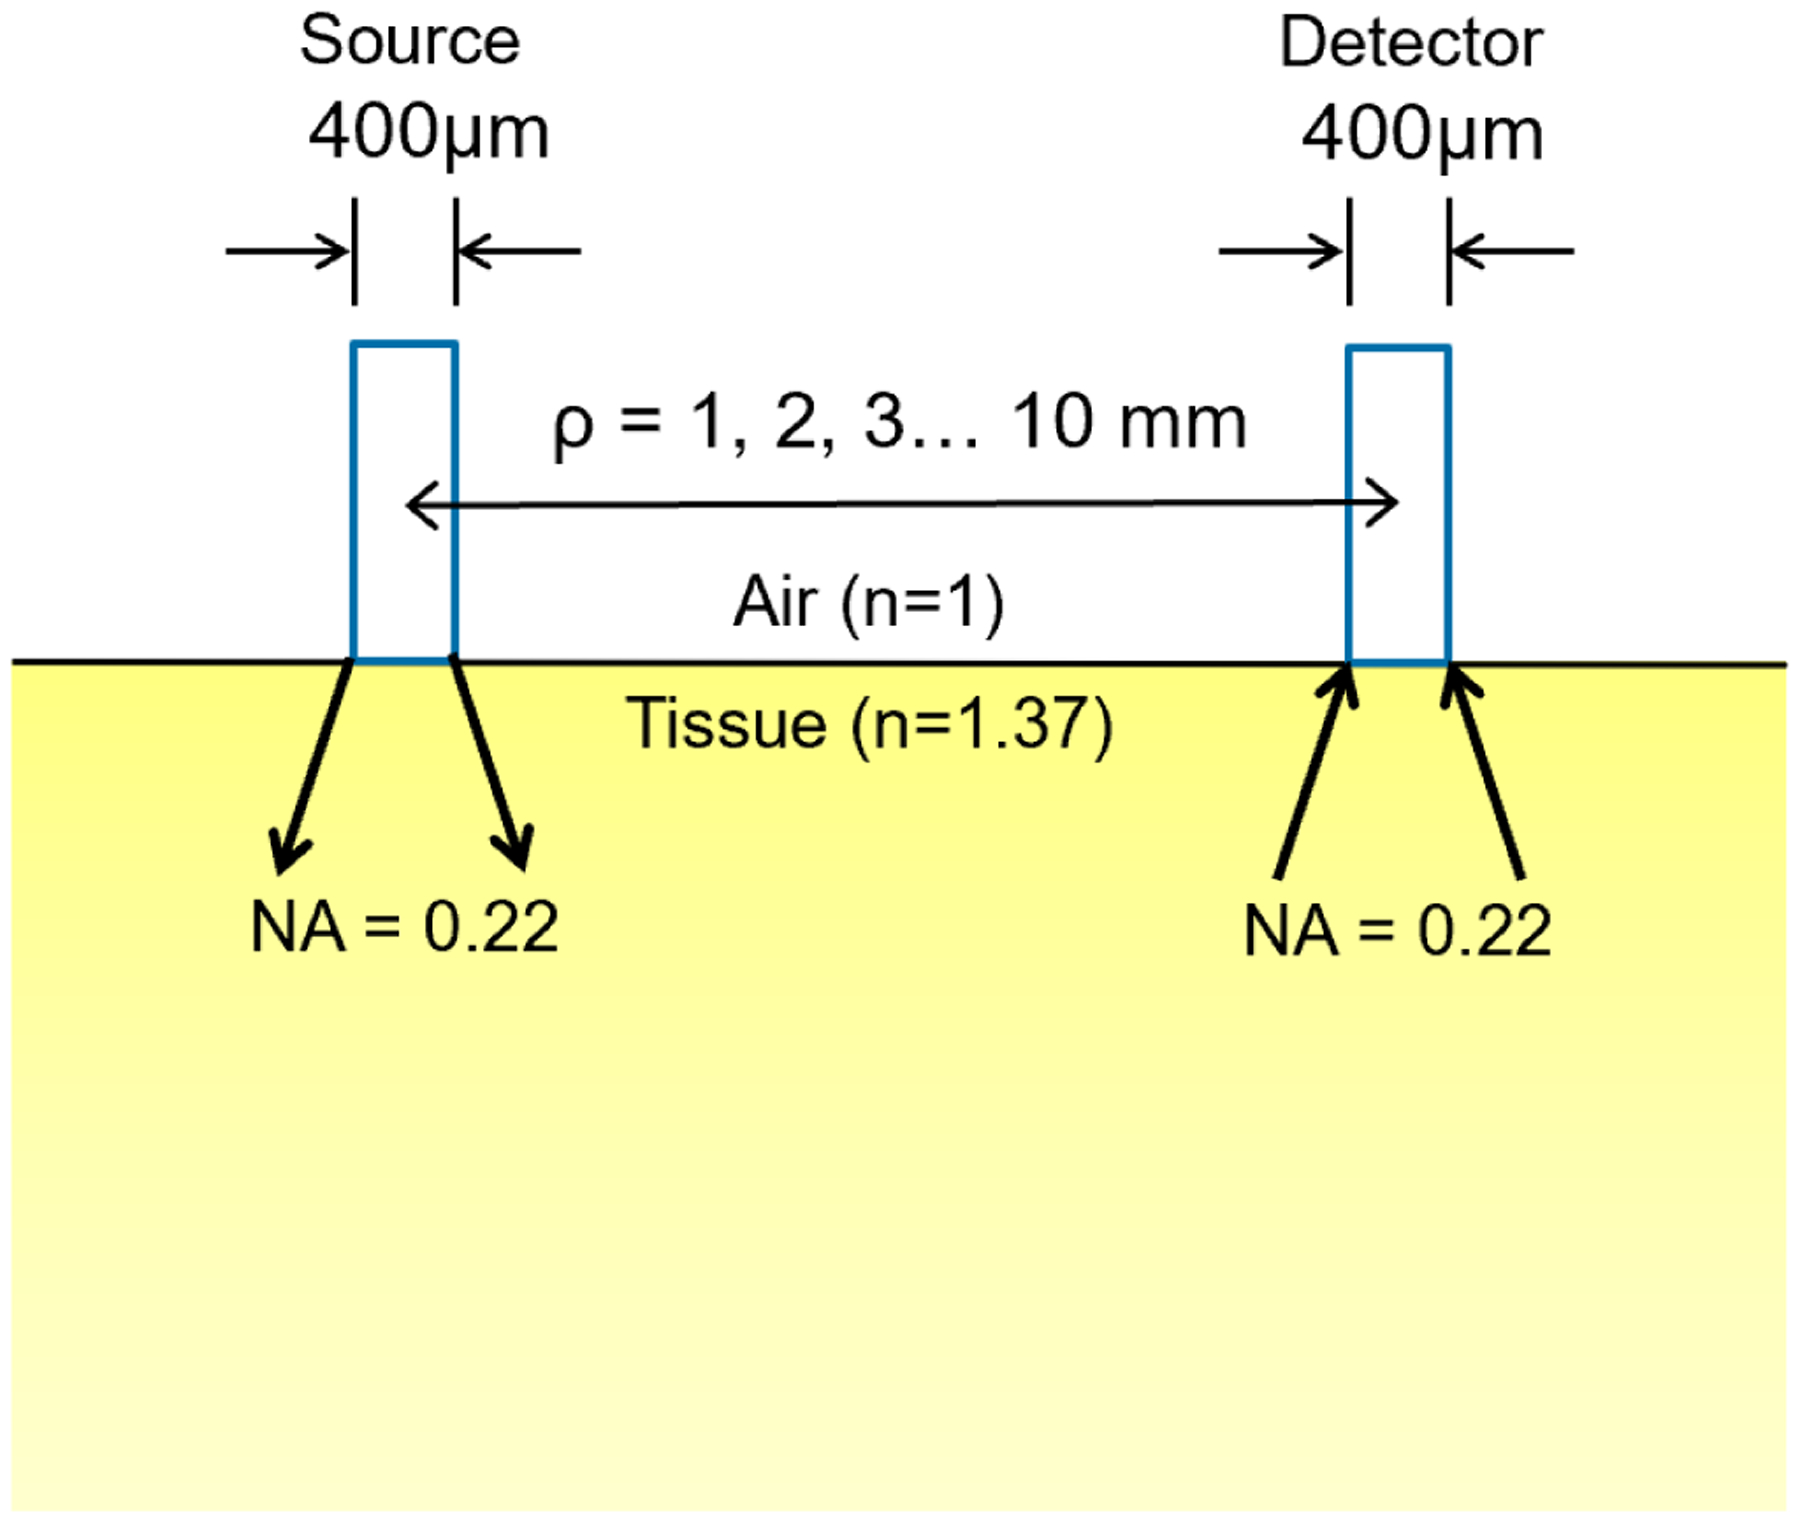
Setup geometry for the Monte Carlo simulation of contact probe measurements with different source-detector separations.
Briefly, a photon with an initial weight of 1 is launched from the source fiber into tissue within the incidence cone angle defined by numerical aperture. Each photon is traced through multiple scattering events until one of the following three scenarios is met: (1) it escapes the medium, or (2) it falls below a threshold weight and triggers a random roulette process, or (3) it reaches to the detector fiber within the acceptance cone angle defined by the numerical aperture. In the roulette process, a photon has a one in ten chance of surviving with ten times its initial weight and nine in ten chance of being terminated. At the end of each step, the photon weight is reduced by a factor of 1-a’, where () and a new scattering angle is determined based on the optical properties of the medium. The distribution of light fluence rate in the medium for photons that reach to the detector fiber is recorded. To model fluorescence, at each step taken by the excitation photon a new fluorescence photon is generated and is propagated at new optical properties defined by the fluorescence emission wavelength. To improve the scoring efficiency, the MC code only records the origins of fluorescence photons that reach to the detector fiber.
The absorption coefficients at the excitation (405nm) and emission wavelengths (630nm) were determined to be 34.1 cm−1 and 0.37−1 based on the molar extinction coefficients of oxy- (HbO2) and deoxy-hemoglobin (Hb), with tissue oxygen saturation of 70% ([HbO2)]/([HbO2)]+[Hb])=0.7) and total hemoglobin concentration (THC) of 100μM as shown in Figure 3(a). Oxy- and deoxy-hemoglobins are assumed to be the primary light absorbers in tissue. The reduced scattering coefficients at 405nm and 630nm were determined to be 15.1 cm−1 and 10 cm−1 based on Mie scattering theory, μs’ (λ) = Aλ−b as shown in Figure 3(b). The value of b used in this study was 0.838, as reported by Jacques [7] for skin epidermis and dermis tissues.
Figure 3.
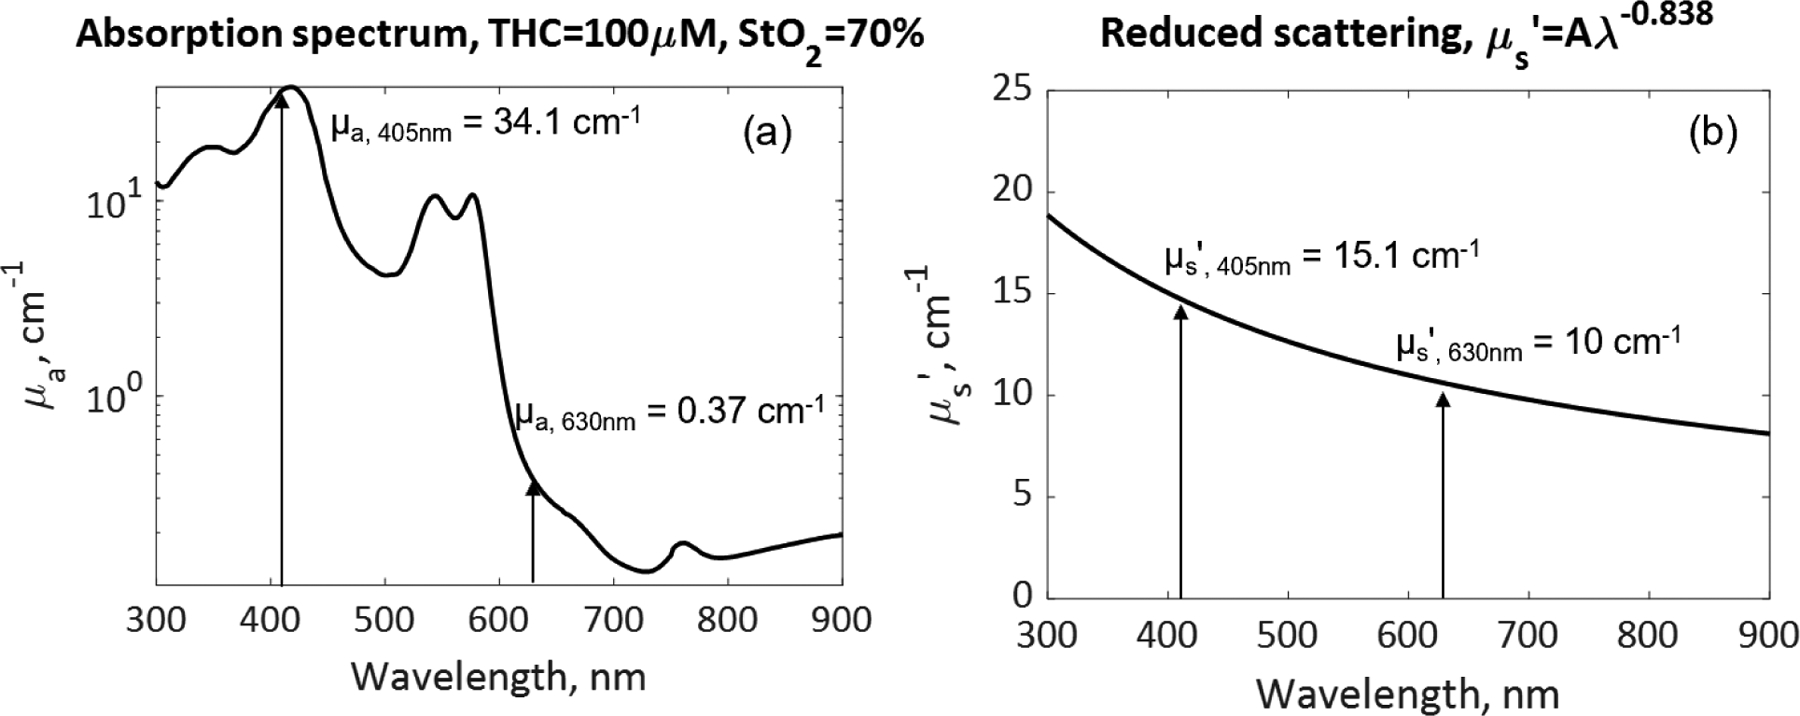
The selection of tissue optical properties: (a) absorption coefficient μa, and (b) reduced scattering coefficient μs’, for Monte Carlo simulation of excitation light at 405nm and fluorescence light at 630nm.
3. RESULTS AND DISCUSSION
Figure 4 shows the in vivo light fluence rate distribution at (a) 405nm and (b) 630nm inside tissue with optical properties as indicated. The light penetration depth can be estimated by the e−1 contour line along the central axis in each figure, which is approximately 0.9mm at 405nm and 0.47cm at 630nm, respectively. Light penetration depth is defined as the depth when incident light fluence rate drops to 1/e (or 36.8%) of its initial value.
Figure 4.
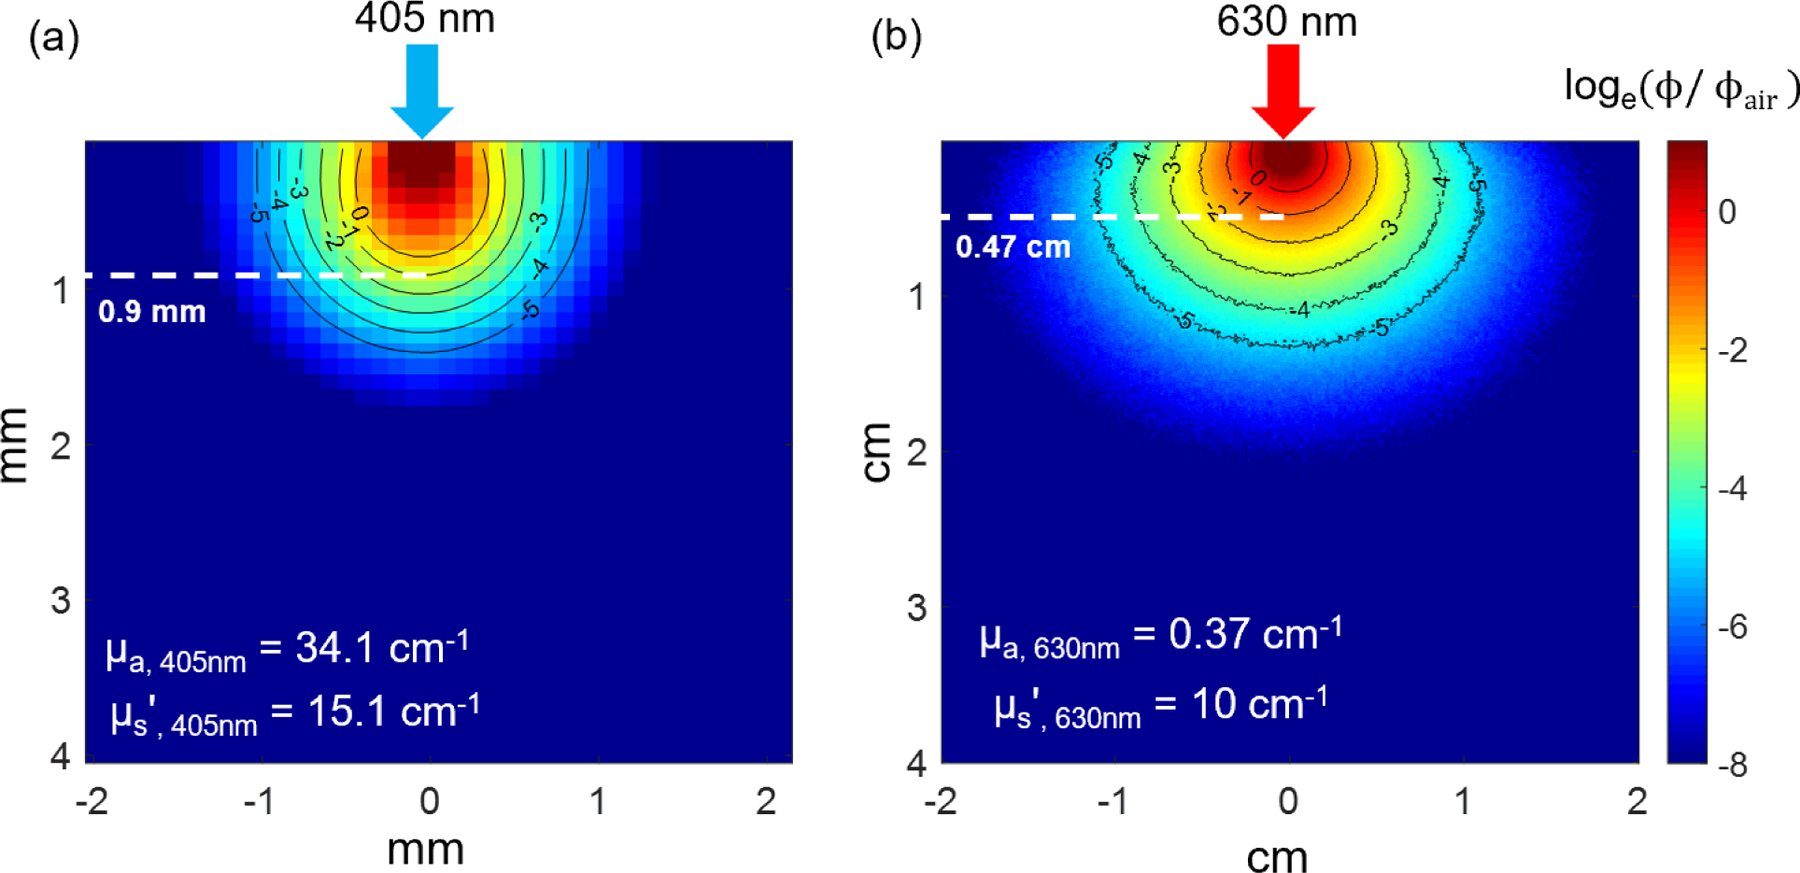
In vivo light fluence rate distribution at (a) 405nm and (b) 630nm. Dashed line indicates light penetration depth at each wavelength.
Figure 5 shows the most probable path distribution of 405nm diffuse reflected photons collected by the detector fiber placed at ρ = 1 – 4 mm away from the source fiber. At ρ = 1 mm, there is a significant amount of light reaching to the detector fiber and 99% of the detected light travelled up to 0.8 mm into the tissue. When the detector fiber was moved 2mm away from the source, as shown in Figure 5(b), the amount of detected light reduced drastically. When detector fiber was moved 3 mm and 4 mm away from the source fiber, there is hardly any diffuse reflected light that reaches to the detector as shown in Figure 5 (c) and 5 (d). These results indicate that our spectroscopy system is not able to pick up sufficient diffuse reflectance data at 405nm when source-detector separation is larger than 1mm due to the limited light penetration depth at this wavelength.
Figure 5.
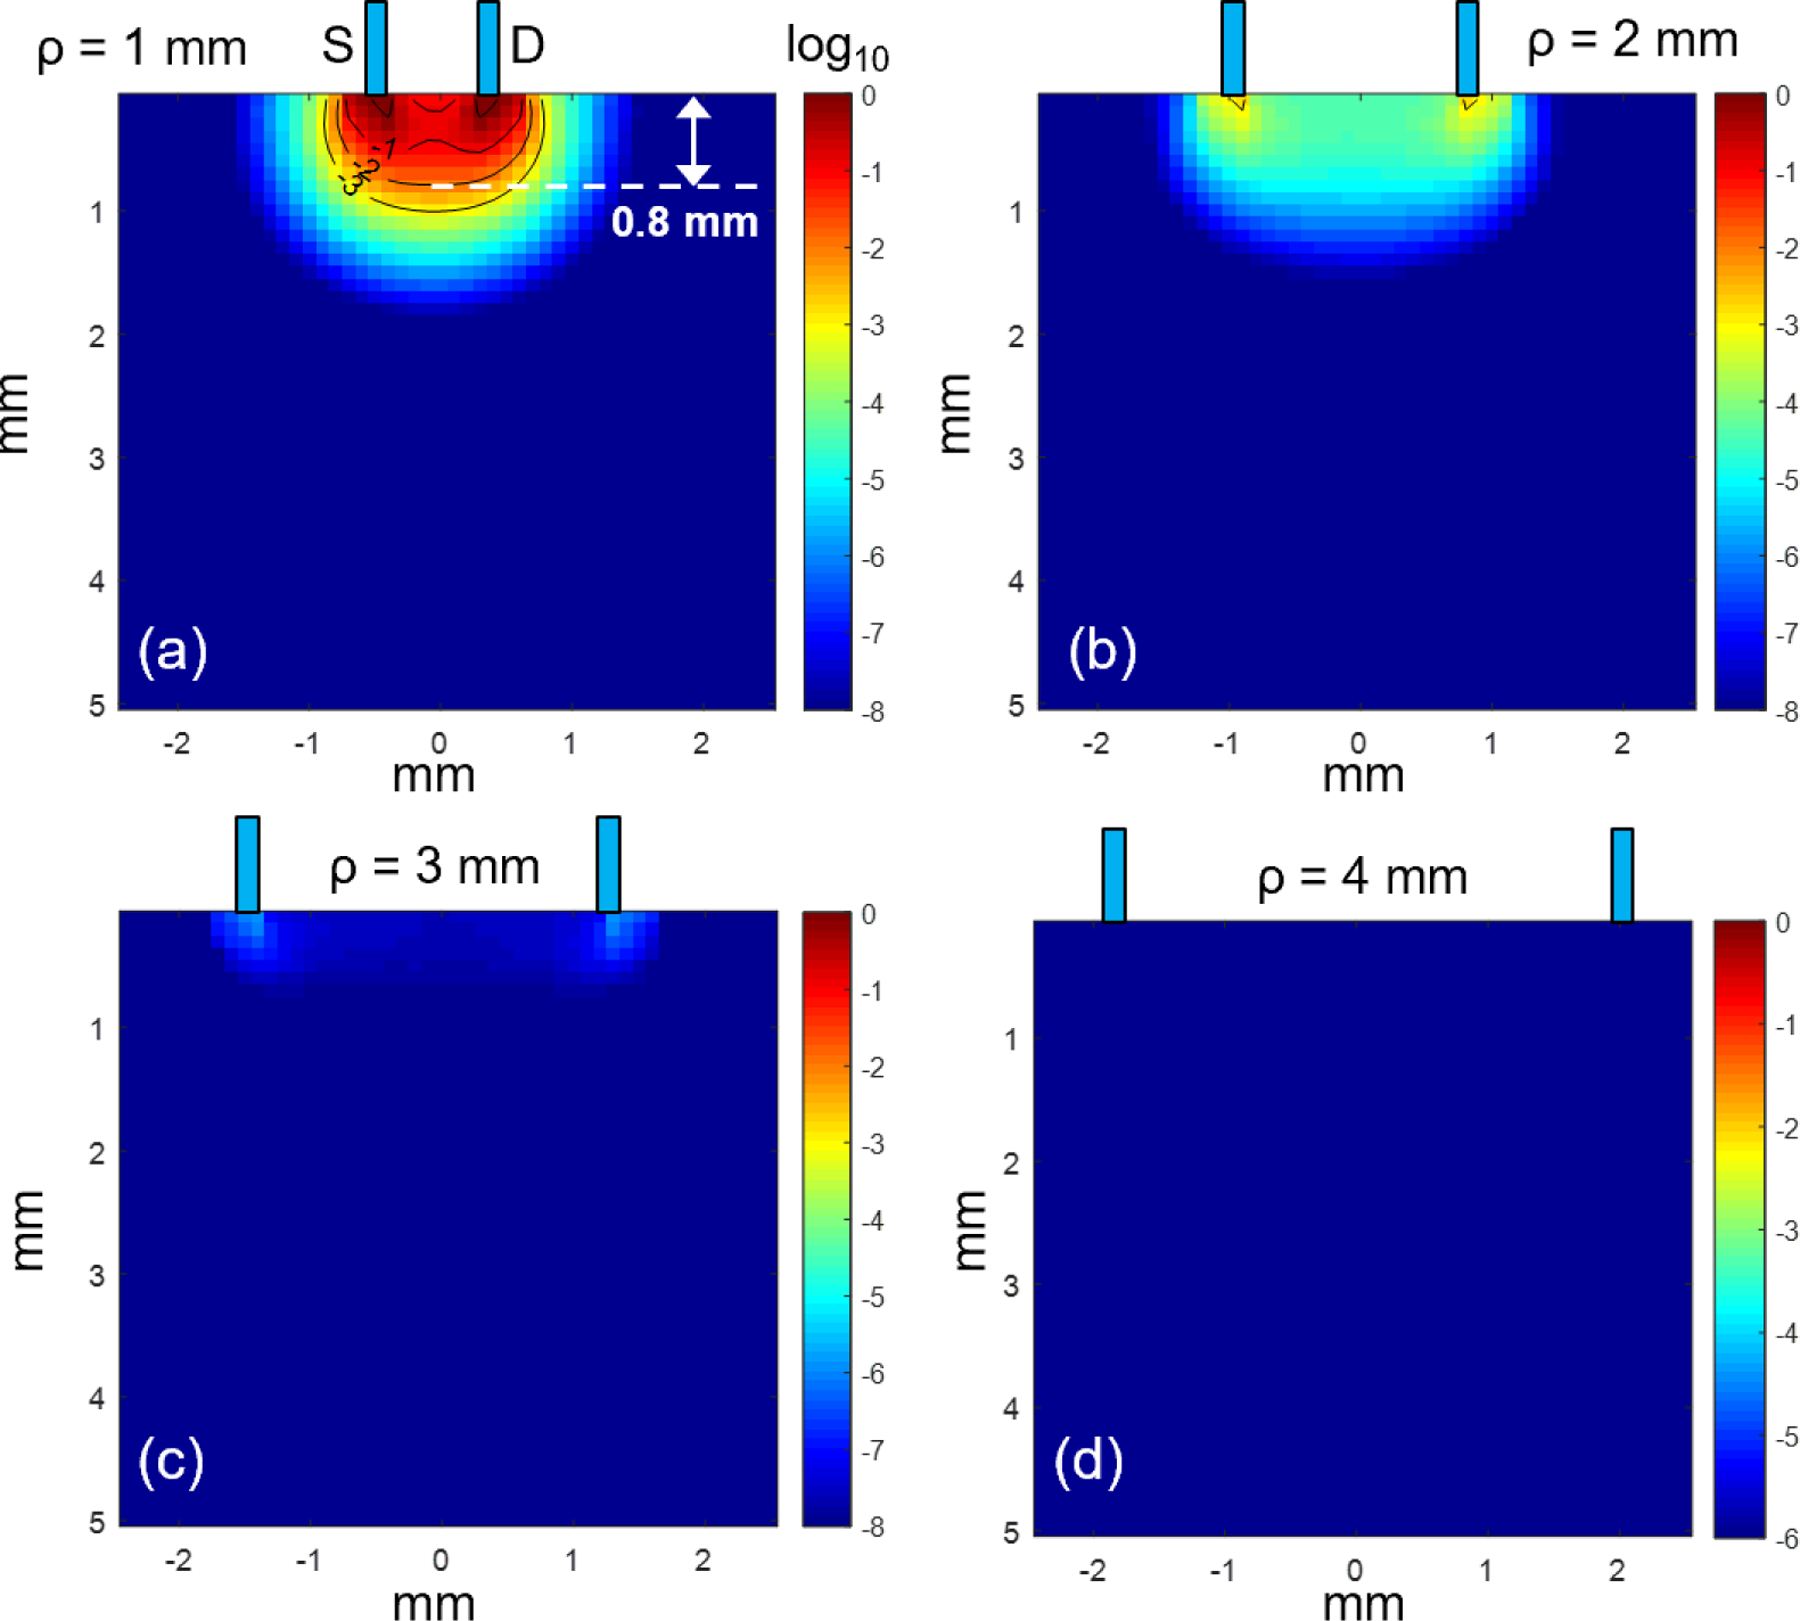
The most probable photon paths distribution at 405 nm between source and detector fibers placed at ρ = 1 – 4 mm.
Figure 6 shows the most probable path distribution of diffuse reflected light at 630nm collected by the fiber placed at ρ = 1 – 10 mm away from the source fiber. In general, 630nm light penetrates further inside of the tissue compared to 405nm light. From the simulation results, we can see that the intensity of the detected light reduces with increasing source-detector separation. Nevertheless, the results suggest a significant amount of light that can reach to detector placed at 10mm away from the source fiber. Of the detected diffuse reflected light at 630nm, about 99% travels up to 7.2 mm into the tissue when source-detector separation is 1 mm and the probing depth is around 4.3 mm when source-detector separation is increased to 10 mm.
Figure 6.
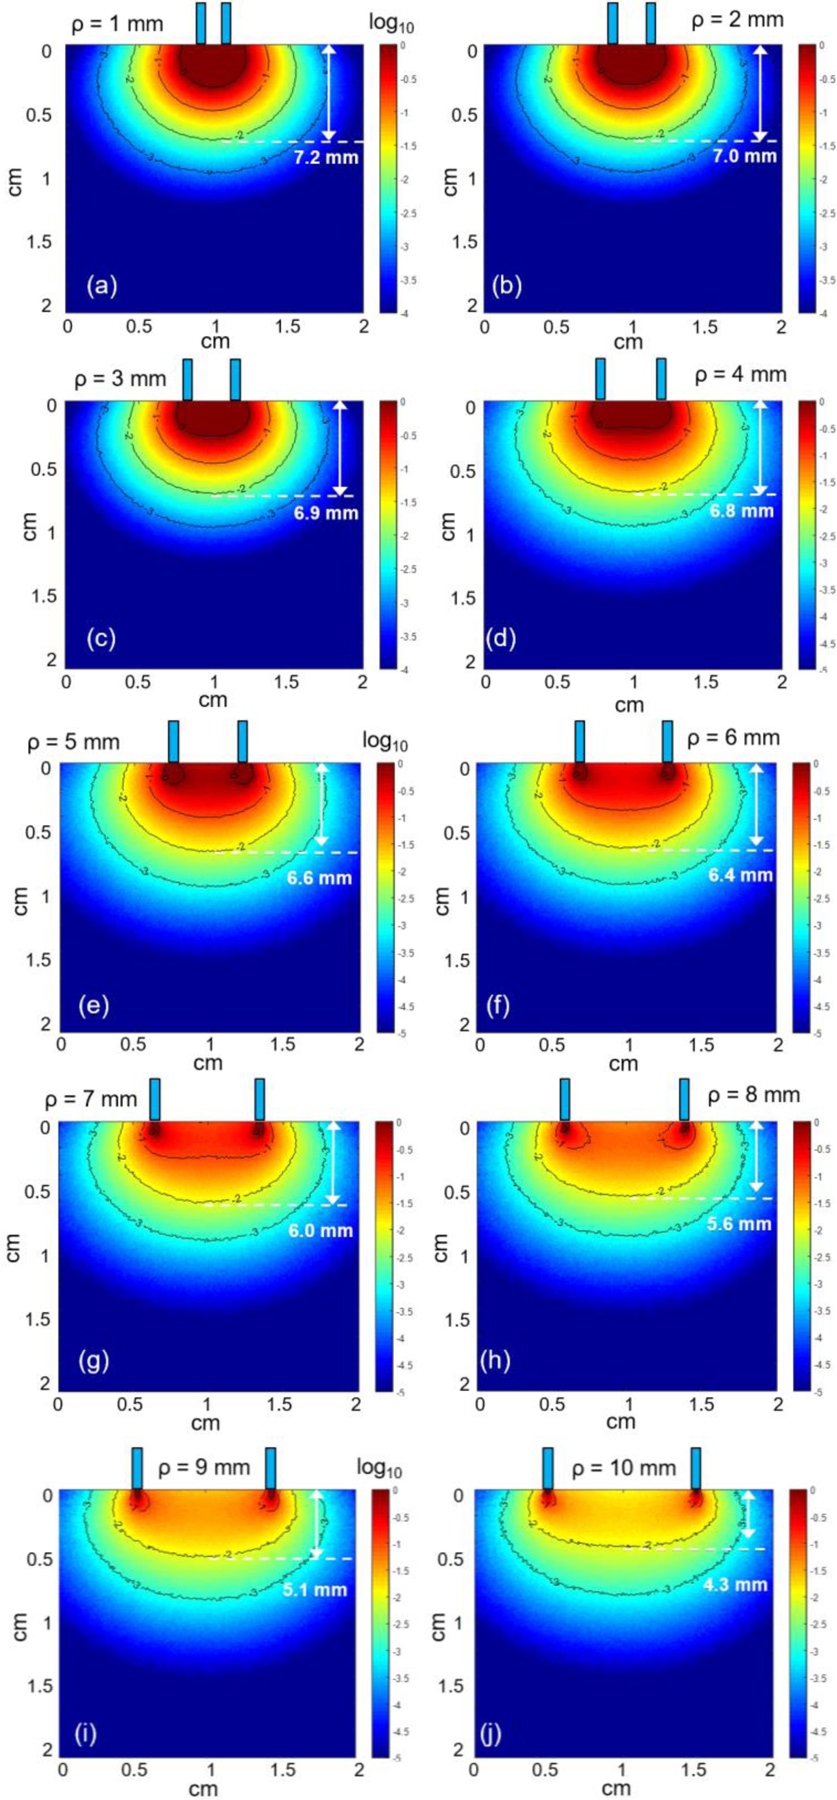
The most probable photon paths distribution at 630nm between source and detector fibers placed at ρ = 1 – 10 mm.
Figure 7 examines the origins of 630nm fluorescence excited by 405nm excitation light and collected by detector fiber placed at different ρ from the source fiber. MC simulation results reveal a consistent hot spot right at the contact between the source and tissue regardless of the location of the detector fiber. The sampling depth of fluorescence using the contact probe remains unchanged for different source and detector separation. The detected fluorescence light was confined to a small volume of tissue right at the source, due to limited light penetration depth of the blue excitation light. The fluorescence light generated was able to travel much longer distances and collected by the detector fiber placed several millimeters away from the source. However, the fluorescence intensity reduced drastically when using larger source and detector separation. Therefore, it is more practical to use short source-detector separations to improve the signal to noise ratio of the detected fluorescence.
Figure 7.
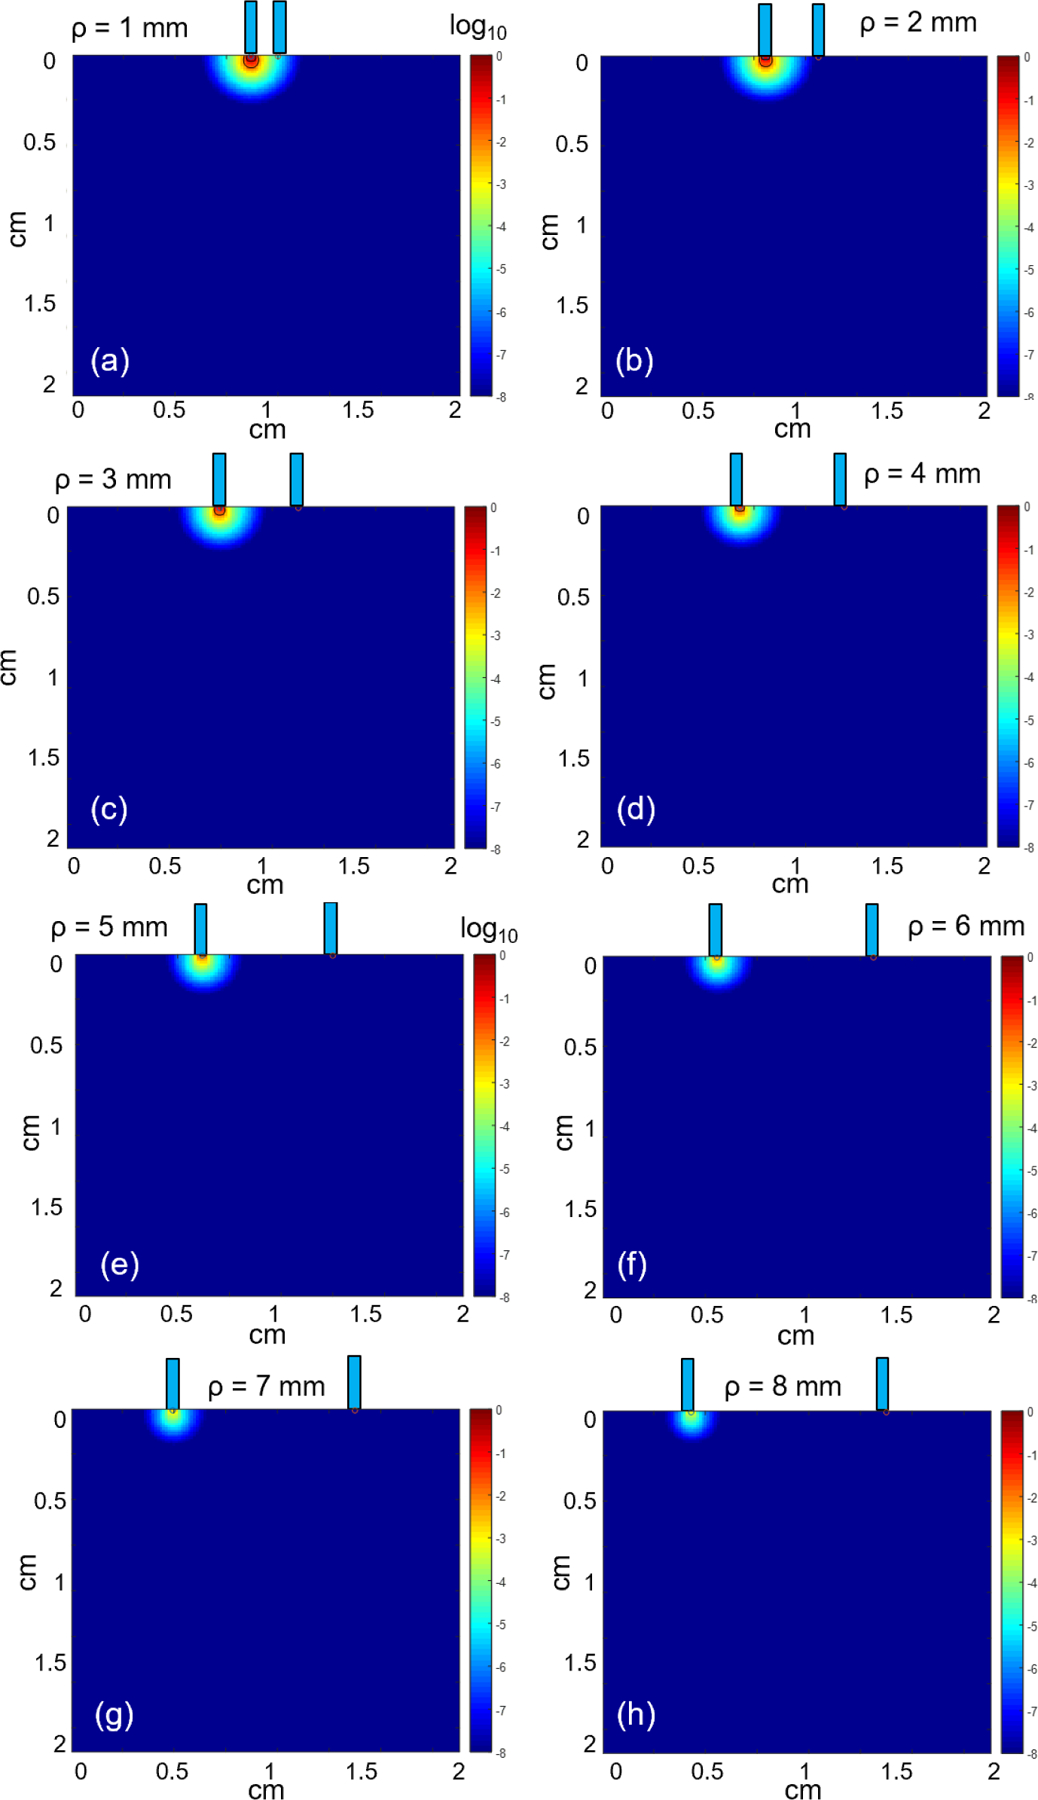
The origins of fluorescence photons reaching to the detector fiber placed at ρ = 1 – 8 mm laterally away from source fiber.
4. CONCLUSION
As a conclusion, we demonstrated a quick tool using Monte Carlo modeling to perform numerical investigation on the effect of tissue optical properties and source-detector separation on light propagation in biological tissues. Specifically, we simulated diffuse reflectance and fluorescence measurements with our contact probe design and examined the effect of varying source-detector separation on the sampling depth at 405nm/630nm wavelength pair. The results provide insight into the most probable path taken by the detected photons, thus giving us useful guidance on the selection of source-detector separations to target desired tissue depths. Most importantly, the results help in understanding and interpretation of the measured tissue properties and in vivo photosensitizer concentration.
ACKNOWLEDGEMENTS
This work was supported by NIH grants P01 CA087971, R01 EB028778, and the Department of Radiation Oncology at the University of Pennsylvania.
REFERENCES
- 1.Ong YH, Kim MM, and Zhu TC, “Photodynamic Therapy Explicit Dosimetry,” in Recent Advancement and Applications in Dosimetry, pp. 45–72, Nova Science Publishers, Inc. (2018). [Google Scholar]
- 2.Ong YH et al. , “PDT dose dosimetry for Photofrin-mediated pleural photodynamic therapy (pPDT),” Physics in Medicine & Biology 63(1), 015031 (2017). [DOI] [PMC free article] [PubMed] [Google Scholar]
- 3.Gallagher-Colombo SM et al. , “Measuring the Physiologic Properties of Oral Lesions Receiving Fractionated Photodynamic Therapy,” Photochemistry and photobiology 91(5), 1210–1218 (2015). [DOI] [PMC free article] [PubMed] [Google Scholar]
- 4.Kholodtsova MN et al. , “Scattered and Fluorescent Photon Track Reconstruction in a Biological Tissue,” International Journal of Photoenergy 2014, 517510 (2014). [Google Scholar]
- 5.Prahl S, “A Monte Carlo model of light propagation in tissue,” Proc. SPIE 10305, 1030509 (1989). [Google Scholar]
- 6.Ong YH, Finlay J, and Zhu T, “Monte Carlo modeling of fluorescence in semi-infinite turbid media,” Proc. SPIE 10492, 104920T (2018). [DOI] [PMC free article] [PubMed] [Google Scholar]
- 7.Jacques SL, “Optical assessment of cutaneous blood volume depends on the vessel size distribution: a computer simulation study,” Journal of biophotonics 3(1–2), 75–81 (2010). [DOI] [PubMed] [Google Scholar]


