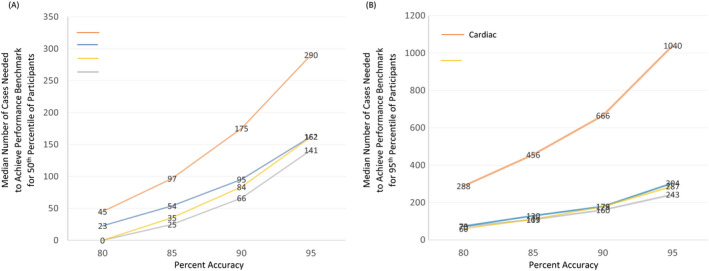
In the article by Kathy Boutis et al.,1 the part figures of A and B got flipped and the y‐axis in Figure 4 are labelled incorrectly. The corrected version of Figure 4 as follows.
Figure 4.

The x‐axis represents the benchmark level of proficiency as chosen by the educator. The y‐axis represents the predicted number of cases required to achieve that benchmark based on the logistic regression model described in the text. The two panels represent two different educational contexts. In the top panel (A), the median learner is represented : 50% of learners required fewer cases to achieve the benchmark; 50% required more. In the bottom panel (B), a higher ambition is presented: the number of cases required of the marginal learner so that 95% of the learners will have achieved the given benchmark (i.e. 95% of learners would need to do fewer; 5% would need to do even more).
AEM Education and Training. 2021;5:e10581. 10.1002/aet2.10581
REFERENCE
- 1. Kwan C, Pusic M, Pecaric M, et al. The variable journey in learning to interpret pediatric Point‐of‐care Ultrasound images: A multicenter prospective cohort study. AEM education and training. 2020;4(2):111–122. [DOI] [PMC free article] [PubMed] [Google Scholar]


