

Abstract
Glioblastoma (GBM) is the most common and deadly malignant brain tumor with short yet varied overall survival (OS) time. Per request of personalized treatment, accurate pre-operative prognosis for GBM patients is highly desired. Currently, many machine learning-based studies have been conducted to predict OS time based on pre-operative multimodal MR images of brain tumor patients. However, tumor genotype, such as MGMT and IDH, which has been proven to have strong relationship with OS, is completely not considered in pre-operative prognosis as the genotype information is unavailable until craniotomy. In this paper, we propose a new deep learning based method for OS time prediction. It can derive genotype related features from pre-operative multimodal MR images of brain tumor patients to guide OS time prediction. Particularly, we propose a multi-task convolutional neural network (CNN) to accomplish tumor genotype and OS time prediction tasks. As the network can benefit from learning genotype related features toward genotype prediction, we verify upon a dataset of 120 GBM patients and conclude that the multi-task learning can effectively improve the accuracy of predicting OS time in personalized prognosis.
Keywords: Overall survival time prediction, Glioblastoma, Genetic information
1. Introduction
Glioblastoma (GBM) is the most common grade IV malignant brain tumor. It accounts for about 30% of all primary brain tumors [1], with about 12,760 cases of GBM confirmed in the USA in 2018 [2], and 13,000 patients die each year [4]. GBM is the most deadly malignant tumors with a median survival time of merely 18–24 months [3]. Traditional treatment of GBM is surgical resection followed by radiation therapy and/or chemotherapy [5]. However, the inherent heterogeneity of GBM often causes varying prognosis, resulting in large variability of overall survival (OS) time across individuals [6]. Therefore, accurate individual pre-operative prognosis for GBM patients is highly desired for personalized treatment and precision medicine.
Recently, many deep learning (DL) based methods for pre-operative prognosis of brain tumor patients have been proposed [7, 8]. Most of them adopt the convolutional neural network (CNN) to predict OS time from pre-operative multimodal MR brain images. However, the tumor genotype (i.e., genomic biomarkers), which has been proven to be strongly related to the patient OS time, is often not considered in these studies. For example, the O-6-methylguanine-DNA methyltransferase (MGMT) promoter methylation (met) was found to be a positive factor of good prognosis of GBM patients [9], and Long-term OS time was reported to be related to the mutation (mut) of the isocitrate dehydrogenase 1/2 (IDH) [10]. Besides MGMT and IDH, which have been already recognized, other genomic biomarkers, such as the chromosomes 1p/19q and the telomerase reverse transcriptase (TERT), were also found to be related to OS time [11, 12]. The main reason of no tumor genotype considered in current pre-operative image based prognosis studies is straightforward – the tumor genotype information is unavailable until craniotomy (open-skull operation) is conducted.
In order to use the strong relationship between tumor genotype and patient prognosis for learning prognosis-related features effectively, in this paper, we propose a new DL based pre-operative OS time prediction method for GBM. The input of our method is still the pre-operative multi-modal MR brain images of GBM patients. However, in addition to outputting OS prediction, our method is unique to simultaneously derive tumor genotype in order to learn more effective prognosis-related features for better OS prediction. The joint predictions of tumor genotype and OS time are achieved by a multi-task CNN in particular. Experimental results with a single-center GBM bio-bank dataset show that our method outperforms both the state-of-the-art DL based and radiomics based pre-operative OS time prediction methods.
2. Method
We attain joint predictions of four tumor genotype (i.e., targeting the genomic biomarkers of MGMT, IDH, 1p/19q and TERT) and OS time through an integrated multi-task CNN. The features are jointly learned for accurate predictions of both the tumor genotype and OS time. Particularly, each tumor genotype prediction task is designed to predict a corresponding genomic biomarker based on the input pre-operative multi-modal MR brain images. For each genomic biomarker, there are two possible types: MGMT is either methylation (met) or unmethylation (unmet), IDH is either mutation (mut) or wild type (wt), 1p/19q is either co-deletion (cd) or wild type (wt), and TERT is either mutation (mut) or wild type (wt). The tumor genotype related features that are learned from pre-operative images are then used in the OS time prediction task, leading to much improved OS time prediction accuracy.
The structure of our network is shown in Fig. 1. The network input is a 3D multi-modal MR image patch containing a complete tumor (i.e., pre-operation). The currently used MR modalities are T1 contrast enhanced (T1c) image, and three diffusion weighted imaging (DWI) derived MR modalities (i.e., B0, FA and MD, representing different aspects of intra-tumor contents). Creating 3D multimodal MR image patches for training and testing will be presented in the experiment. In the network, after the first two common convolutional blocks, the network is split into five branches, each of which corresponds to a tumor genotype or the OS time prediction task. In the multi-task CNN, the tumor genotype related features learned from the four tumor genotype prediction tasks are fed to the fully connected (FC) layer of the OS time prediction task. Moreover, some essential clinical features, including patient age, gender, tumor size and position, are fed to the FC layer of each task. It is worth noting that the feature of tumor position is encoded by 27 binary digits (i.e., 0 or 1 at each digit). Specifically, we divide each brain into 3 × 3 × 3 non-overlap blocks. If the tumor extends to a certain block, then the corresponding digit for this block is 1, and otherwise 0.
Fig. 1.

The structure of the multi-task CNN. There are five tasks in the network: four tasks for tumor genotype prediction (only two of them are drawn in the figure) and one task for the pre-operative OS time prediction. The tumor genotype related features learned from tumor genotype prediction tasks are fed to the FC layer of the OS time prediction task.
In the training phase, labels of tumor genotype and patient OS time (in days) are known for each input 3D multimodal MR image patch. Based on the labels, the softmax loss is applied to each tumor genotype prediction task (binary prediction), while the loss function of the OS time prediction task is the Euclidean loss with respect to the clinical follow-ups (regression). It is worth noting that, in the testing phase, no tumor genotype information is needed, as our network can derive tumor genotype related features from the input images directly. In this way, we can apply our method to real scenario, as tumor genotype information is unavailable before surgery.
3. Experiments
The image dataset used in the experiment includes MR T1c and DWI images of 120 GBM patients. The image dataset was collected for routine GBM diagnosis in the collaborated hospital. All images were captured by a Siemens Verio 3T scanner using the following protocols: 3D T1c image (TR: 1900 ms, TE: 2.93 ms, TI: 900 ms, flip angle = 9°, slice number = 176, slice thickness = 1 mm, pixel spacing 1 mm × 1 mm, scanning time = 7 min 47 s), and DTI (TR: 9700 ms, TE: 87 ms, slice number = 70, slice thickness = 3 mm, pixel spacing 1.8 mm × 1.8 mm, direction = 20/30, b-value of 1000 s/mm2, scanning time around 15 min). Biopsy proven tumor genotype (MGMT, IDH, 1p/19q, and TERT) were obtained. Not all patients have complete (four) genotype information due to varied clinical requirement. Therefore, our method does not require complete data, better fitting the real clinical applications. In addition, 67 out of 120 patients have OS time (i.e., dead during follow up) and the rest 53 patients are still alive according to the latest visit (LV) time. Dataset details are summarized in Table 1.
Table 1.
Image dataset of 120 GBM patients.
| Age (years) | Gender | OS (days) | LV (days) |
|---|---|---|---|
| 51.6 ± 14.6 | 42 (F)/78 (M) | 439.0 ± 221.5 67 patients | 627.4 ± 327.1 53 patients |
| MGMT | IDH | 1p/19q | TERT |
| 63 (unmet) | 86 (wt) | 50 (wt) | 50 (wt) |
| 42 (met) | 7 (mut) | 9 (cd) | 56 (mut) |
| 15 (unknown) | 27 (unknown) | 61 (unknown) | 14 (unknown) |
As aforementioned, four image modalities (T1c, B0, FA and MD) are currently used in our study. Considering that most of the DWI-derived metrics need to be calculated in the DWI native space, in current study, images of different modalities are aligned to the corresponding B0 image (in DWI native space) using a rigid transformation. Moreover, the brain tumor mask including tumor entity and edema for each patient is manually labeled based on T1c and B0 by a senior neuro-radiologist. Examples of the four image modalities and the brain tumor mask of a GBM patient are shown in Fig. 2.
Fig. 2.
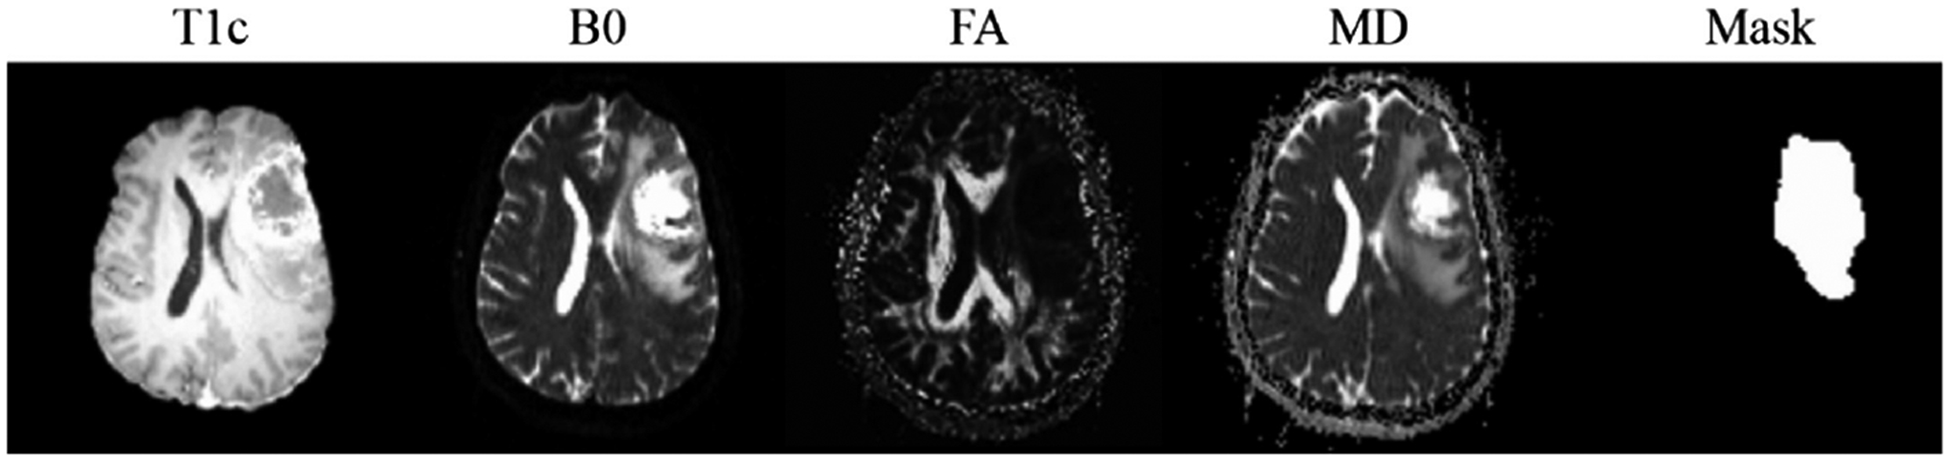
Examples of the four modalities (T1c, B0, FA and MD) and the corresponding brain tumor mask of a GBM patient.
The training and testing data of our network are 3D multimodal MR image patches containing a complete tumor cropped from the image data of GBM patients. Since we have tumor mask images for all patients, the center of each tumor and the bounding box can be calculated. By analyzing the tumor bounding boxes of all patients, the size of the 3D image patch is set to 64 × 64 × 32 voxels, which is large enough to contain complete brain tumor of each patient. Each 3D multimodal MR image patch is centered at the tumor center. For the training data, the corresponding genotype label for MGMT, IDH, 1p/19q or TERT is set to 0 (unmet or wt), 1 (met, mut or co-deletion) and −1 (unknown), respectively. The OS label is the patient OS time in days, or −1 for patients who are alive at the latest LV. To augment the training data, we rotate tumors in axial direction around the tumor center in the range of 0°–360° (step size of 10°) to get corresponding 3D multimodal MR image patches and mirror patches. Moreover, to solve the imbalanced data of IDH (86 wt to 7 mut) and 1p/19q (50 wt to 9 cd), rotation step size of 2° is used for IDH of mut and 1p/19q of cd. In this way, 12,672 3D multimodal MR image patches are available. It is worth noting that, some image patches have incomplete labels (i.e., unknown genotype or no OS time). In this case, no back propagation is proceeded in the corresponding multi-task CNN branches during the training.
We perform 10-fold cross validation to evaluate our method. In each time, 3D multimodal MR image patches with corresponding labels of 108 patients are used for training (90 patients) and validation (18 patients). The original 3D multimodal MR image patches (with no augmentation) of the remained 12 patients are used as the testing data. In addition, five mono-task CNNs, each of which handles one of the tumor genotype and OS time prediction tasks, are evaluated for comparison. The topologies of these five mono-task CNNs are the same as the branch in our multi-task CNN (see Fig. 3).
Fig. 3.

Mono-task CNN for tumor genotype and OS time prediction.
Besides deep learning based methods, radiomics (RD) with random forest (RF) based method is also compared here (denoted as RD-RF). Particularly, radiologic features of input images are first extracted using Pyradiomics [13] and then refined by feature selection with ℓ1 regularization [14]. Finally, the selected features are fed to RF for classification (tumor genotype prediction) and regression (OS time prediction), respectively. In our experiment, five RD-RFs, each of which contains 100 decision trees in RF, are trained to predict four tumor genotype and the OS time. The same 10-fold cross validation is adopted for fair comparison. The training data here are the 3D multimodal MR image patches used in mono-task CNN and our method. As RF requests complete data, we exclude patients who have missing labels of tumor genotype or OS time. In this way, image data of 105 patients are available for MGMT, 93 for IDH, 59 for 1p/19q, 106 for TERT and 67 for OS time, respectively. For each modality in the 3D multimodal MR image patch, 93 radiologic features of first-order statistics, gray-level co-occurrence matrix, gray-level size zone matrix, and gray-level run length matrix are calculated. Furthermore, 16 shape features derived from the corresponding 3D mask image and 4 clinical features (age, gender, tumor size and location) are also adopted. As a summary, each training data contains 392 features (i.e., 93 × 4 + 16 + 4). Finally, after feature selection, 47 features are preserved for MGMT, 1p/19q, and TERT, 59 features for IDH, and 62 features for OS time prediction.
The evaluation results are summarized in Table 2. The OS time of 67 patients with known OS time are predicted by different methods and compared in accordance to the root mean squared error (RMSE). The predicted tumor genotype results of 120 patients using each method under comparison are evaluated by Accuracy, Sensitivity and Specificity. We use Wilcoxon signed rank test [15] over the OS time predicted by all methods under comparison. Our method is better than the mono-task CNN (p = 0.003) and the RD-RF (p = 0.034).
Table 2.
Evaluation results of mono-task CNN, RD-RF and our method.
| MGMT | IDH | lp/19q | TERT | OS (RMSE) | ||
|---|---|---|---|---|---|---|
| Mono-task CNN | Accuracy | 0.724 | 0.925 | 0.814 | 0.632 | 261.0 ± 175.0 |
| Sensitivity | 0.730 | 0.965 | 0.880 | 0.640 | ||
| Specificity | 0.714 | 0.429 | 0.444 | 0.625 | ||
| RD-RF | Accuracy | 0.676 | 0.925 | 0.763 | 0.575 | 225.0 ± 136.0 |
| Sensitivity | 0.683 | 0.988 | 0.860 | 0.560 | ||
| Specificity | 0.667 | 0.143 | 0.222 | 0.589 | ||
| Our method | Accuracy | 0.790 | 0.946 | 0.881 | 0.660 | 177.0 ± 130.0* |
| Sensitivity | 0.794 | 0.965 | 0.920 | 0.680 | ||
| Specificity | 0.786 | 0.714 | 0.667 | 0.643 | ||
Our method have smaller difference as compared to the ground truth than the other methods with statistical significance (p<0.05 of Wilcoxon signed rank test).
Figure 4 illustrates the predicted OS times of 67 patients with known OS time using each method. The predicted result from our method is more compact in distribution and better fits the diagonal line than the other methods. In addition, we also predict the OS time for the other 53 patients with LV time (still alive). The numbers of “successful” predictions (i.e., the number of LV-only patients with predicted OS time longer than their LV time) are larger using our method than using other methods. Specifically, based on our method, 32 out of 53 patients have longer predicted OS time than their LV time, while such numbers based on mono-task CNN and RD-RF are reduced to 18 and 20, respectively.
Fig. 4.

Predicted OS time of 67 patients who have ground truth OS time (already dead) using mono-task CNN (left), RD-RF (middle) and our method (right).
The survival curves (Kaplan-Meier plot) [16] of all the 120 patients are calculated and shown in Fig. 5. Compared to the RMSE that requires all patients to have determined OS time, survival curves can be drawn using all patients with or without known OS time. Therefore, it serves a good evaluation. The survival curves calculated based on the predicted results using mono-task CNN (Fig. 5 left), RD-RF (Fig. 5 middle) and our method (Fig. 5 right) are compared with the ground truth (the red curves), respectively. The predicted survival curve of our method is much closer to the ground truth than the other two methods. Particularly, the corresponding p values from the Log-rank (Mantel-Cox) test [17] are 0.0425 (mono-task CNN), 0.1925 (RD-RF) and 0.5152 (our method). These p values can partly indicate that both the predicted survival curve based on our method is less different from (or more similar with) the ground truth compared to the other two methods.
Fig. 5.

Survival curves of 120 patients. The survival curves of mono-task CNN, RD-RF and our method are marked in blue (left), green (middle) and purple (right), respectively. Each of them is compared with the ground truth marked in red.
4. Conclusions
We proposed a new multi-task convolutional neural network (CNN) based pre-operative overall survival (OS) time prediction method, which predicts tumor genotype as separate tasks to guide feature learning for OS time prediction. Within this framework, both imaging phenotype and genotype information could be jointly learned for more accurate OS time prediction for GBM patients. Our method outperformed both the conventional mono-task CNN based method and the state-of-the-art, radiomics based random forest method. This is mainly because of the usage of tumor genotype related features, a previously unavailable features without operation or invasive biopsy. In addition, our method also outperformed the other methods on the predictions of MGMT, 1p/19q and TERT.
In our future work, we plan to introduce more prognosis related tumor genes and other high-level information, such as fiber density derived from DWI, to further improve the performance of our method.
Acknowledgements.
This work was supported in part by NIH grants AG049371 and AG041721.
References
- 1.Anil R, Colen RR: Imaging genomics in glioblastoma multiforme: a predictive tool for patients prognosis, survival, and outcome. Magn. Reson. Imaging Clin 24(4), 731–740 (2016) [DOI] [PubMed] [Google Scholar]
- 2.Ostrom QT, et al. : CBTRUS statistical report: primary brain and other central nervous system tumors diagnosed in the United States in 2010–2014. Neuro-Oncol. 19(suppl_5), v1–v88 (2017) [DOI] [PMC free article] [PubMed] [Google Scholar]
- 3.Chow D, et al. : Imaging genetic heterogeneity in glioblastoma and other glial tumors: review of current methods and future directions. Am. J. Roentgenol 210(1), 30–38 (2018) [DOI] [PubMed] [Google Scholar]
- 4.International RadioSurgery Association (2018). http://www.irsa.org/glioblastoma.html
- 5.Lefranc F, et al. : Present and potential future issues in glioblastoma treatment. Expert Rev. Anticancer Ther 6(5), 719–732 (2006) [DOI] [PubMed] [Google Scholar]
- 6.Sottoriva A, et al. : Intratumor heterogeneity in human glioblastoma reflects cancer evolutionary dynamics. Proc. Natl. Acad. Sci 110(10), 4009–4014 (2013) [DOI] [PMC free article] [PubMed] [Google Scholar]
- 7.Nie D, Zhang H, Adeli E, Liu L, Shen D: 3D deep learning for multi-modal imaging-guided survival time prediction of brain tumor patients. In: Ourselin S, Joskowicz L, Sabuncu MR, Unal G, Wells W (eds.) MICCAI 2016. LNCS, vol. 9901, pp. 212–220. Springer, Cham (2016). 10.1007/978-3-319-46723-8_25 [DOI] [PMC free article] [PubMed] [Google Scholar]
- 8.Chang P, et al. : Deep learning for prediction of survival in IDH wild-type gliomas. J. Neurol. Sci 381, 172–173 (2017) [Google Scholar]
- 9.Weller M, et al. : MGMT promoter methylation in malignant gliomas: ready for personalized medicine? Nat. Rev. Neurol 6(1), 39 (2010) [DOI] [PubMed] [Google Scholar]
- 10.Czapski B, et al. : Clinical and immunological correlates of long term survival in glioblastoma. Contemp. Oncol 22(1A), 81 (2018) [DOI] [PMC free article] [PubMed] [Google Scholar]
- 11.Hill C, Hunter SB, Brat DJ: Genetic markers in glioblastoma: prognostic significance and future therapeutic implications. Adv. Anat. Pathol 10(4), 212–217 (2003) [DOI] [PubMed] [Google Scholar]
- 12.Lee Y, et al. : The frequency and prognostic effect of TERT promoter mutation in diffuse gliomas. Acta Neuropathol. Commun 5(1), 62 (2017) [DOI] [PMC free article] [PubMed] [Google Scholar]
- 13.van Griethuysen JJ, et al. : Computational radiomics system to decode the radiographic phenotype. Cancer Res. 77(21), e104–e107 (2017) [DOI] [PMC free article] [PubMed] [Google Scholar]
- 14.Liu J, Chen J, Ye J: Large-scale sparse logistic regression. In: Proceedings of the 15th ACM SIGKDD International Conference on Knowledge Discovery and Data Mining. ACM (2009) [Google Scholar]
- 15.Woolson R: Wilcoxon signed-rank test. Wiley Encyclopedia of Clinical Trials, pp. 1–3 (2007) [Google Scholar]
- 16.Kaplan EL, Meier P: Nonparametric estimation from incomplete observations. J. Am. Stat. Assoc 53(282), 457–481 (1958) [Google Scholar]
- 17.Mantel N: Evaluation of survival data and two new rank order statistics arising in its consideration. Cancer Chemother. Rep 50, 163–170 (1966) [PubMed] [Google Scholar]