Abstract
It is increasingly recognized that immune development within mucosal tissues is under the control of environmental factors during early life. However, the cellular mechanisms that underlie such temporally and regionally restrictive governance of these processes is unclear. Here, we uncover an extrathymic pathway of immune development within the colon that is controlled by embryonic, but not bone-marrow derived, macrophages which determines the ability of these organs to receive invariant natural killer T (iNKT) cells and allow them to establish local residency. Consequently, early life perturbations of fetal-derived macrophages result in persistent decreases of mucosal iNKT cells and is associated with later life susceptibility or resistance to iNKT cell associated mucosal disorders. These studies uncover a host developmental program orchestrated by ontogenically distinct macrophages that is regulated by microbiota and reveal an important post-natal function of macrophages that emerge in fetal life.
The initial exposure of the mucosal immune system to microbes during neonatal life plays a critical role in molding the levels of specific immune cell elements and consequently the host’s response to stimuli during later life (1–8). An important cell type regulated in this manner is CD1d-restricted invariant natural killer T cells (iNKT) cells, a rare subset of T cells which function in the recognition of self and microbial lipid antigens important to the outcome of infectious, autoimmune and neoplastic disorders in organs where they exist (7–10). It is currently thought that the temporal regulation of iNKT cell levels during early life is simply a consequence of microbial exposures prevalent during this time that determine the recruitment of cells from the circulation and their local expansion upon entry into the tissues. However, it has not been considered that the regulation of iNKT cells during early life may emerge from events associated with host developmental pathways that are under the subsequent influence of postnatal environmental factors such as microbes. It is therefore interesting that certain barrier surfaces with high concentrations of microbes such as the colon and dermis are distinctive in that they are transiently occupied for the first several weeks of life by ontogenically unique macrophages of embryonic origin before weaning (11–13). The function of these embryonic macrophages within barrier tissues is unknown but their temporary presence at a time when iNKT cells are developing raises the possibility that they are involved in these processes. Here we report that colonic iNKT cell development and residency is dependent upon the control of embryonic macrophages during a specific early life time window.
Results
Colonic iNKT cell residency is established during early life
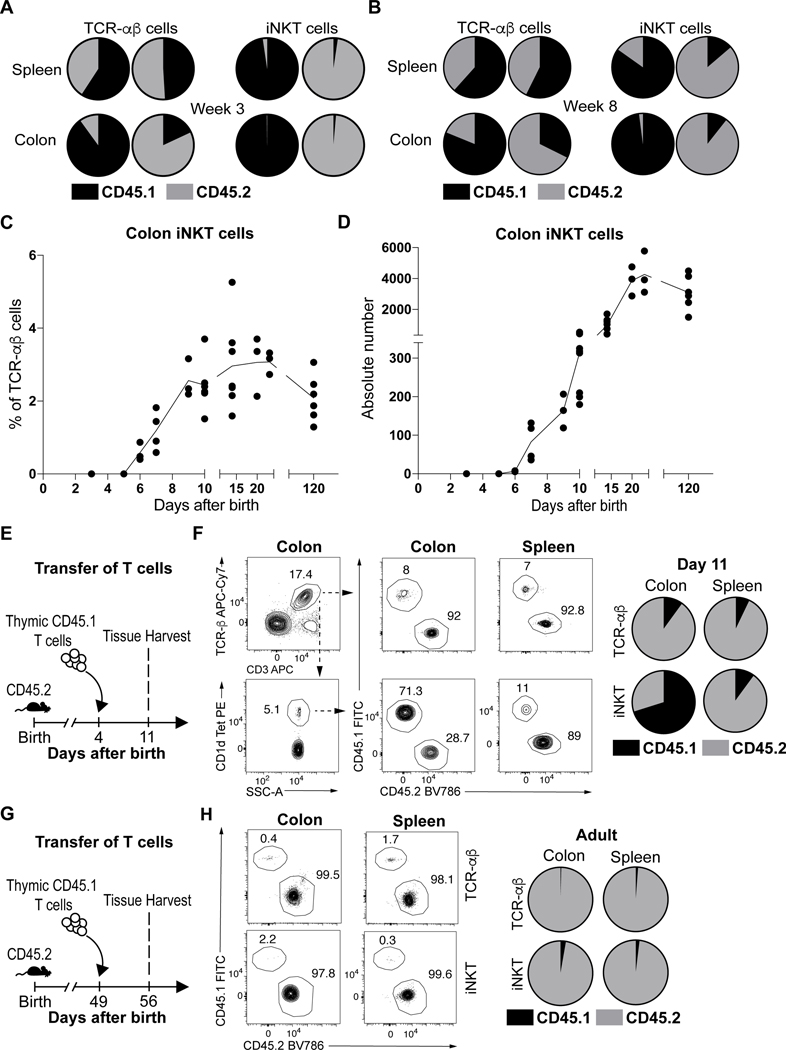
We performed parabiosis experiments to evaluate iNKT cell residency in the colon. 56 day old adult congenic mice bearing CD45.1 or CD45.2 markers were surgically joined and examined for the proportions of conventional T cell receptor (TCR)-αβ+ T cells and iNKT. Appropriate chimerism between CD45.1+ and CD45.2+ iNKT and TCR-αβ+ T cells was achieved in peripheral blood of the parabiotic hosts (Extended Data Fig. 1A). We observed very small numbers of congenic iNKT cells in the spleen (<3%) and colon (<2%) of the parabiotic partners (Fig. 1A, Extended Data Fig. 1B), which remained limited in the colon even 8 weeks after surgery (Fig. 1B). In contrast, the TCR-αβ+ T cell populations attained higher proportional levels of chimerism in the spleen (~50%) and colon (~15%) 3 weeks after surgery (Fig. 1A, Extended Data Fig. 1B). Therefore, consistent with studies in other organs (14, 15), iNKT cells exist as a predominantly tissue resident population in the adult colon lamina propria.
Fig. 1. Colonic iNKT cells emerge and expand during early life before establishing residency at steady state.
Circulatory exchange of CD45.1 (black) or CD45.2 (grey) TCR-αβ+ T (CD45+ CD3ε+ TCRβ+) and iNKT (CD45+ CD3ε+ TCRβ+ CD1d Tetramer+) cells in the spleen and colon of surgically joined CD45.1 (left) and CD45.2 (right) congenic animals (n=2) determined by flow cytometry, 3 weeks (A) and 8 weeks (B) after surgery. Circles are representative of average cell frequency. iNKT cell percentage (C) and absolute counts (D) in the colon over time. Each dot is representative of an individual mouse, line is representative of the sample means. E) Schematic of adoptive transfer strategy. (F) Adoptive transfer of CD45.1 adult thymic cells into a 4 day old CD45.2 (n=6) host followed by quantitative analyses of splenic and colonic CD45.1 (black) or CD45.2 (grey) TCR-αβ+ T and iNKT cells by flow cytometry on day 11. Representative plots (left). Circles are representative of average cell frequency (right). G) Schematic of adoptive transfer strategy. (H) Adoptive transfer of CD45.1 adult thymic cells into a 49 day old CD45.2 host (n=6) followed by quantitative analyses of splenic and colonic CD45.1 (black) or CD45.2 (grey) TCR-αβ+ T and iNKT cells by flow cytometry on day 56. Representative plots (left). Circles are representative of average cell frequency (right). Data were pooled from two experiments [(F) and (H)]. Tet, Tetramer. SSC-A, Side scatter.
This suggested that colonic iNKT cells establish residency earlier in life in a yet-to-be determined time frame. Previous studies have demonstrated that iNKT cells emerge from the thymus around day 5 after birth whereupon they populate peripheral tissues (16). We observed that iNKT cells begin to appear in the colon during the first 5–6 days after birth and rapidly expand in proportion to TCR-αβ+ T cells until approximately 10 days of life (Fig. 1C). This is followed by an intense period of expansion based upon the number of iNKT cells detected until approximately 21–28 days after birth whereupon they reach steady-state levels that were maintained into adulthood (Fig. 1D) (8). This delineated a limited time period between 5 and 10 days after birth when iNKT cells preferentially emerge in the colon relative to TCR-αβ+ T cells. To confirm and more precisely define this time period, we performed adoptive transfer of adult CD45.1+ thymic T cells in 4 day old CD45.2+ hosts and harvested colon and spleen at day 11 (Fig. 1E). We observed that congenic iNKT cells were highly enriched in the colon (~71%) compared to the spleen (~11%) of the CD45.2+ hosts at day 11 after birth while the TCR-αβ+ T cell populations exhibited limited levels of chimerism in the colon and spleen (~7–8%) (Fig. 1F). Moreover, we observed that the CD45.1+ iNKT cells but not TCR-αβ+ T cells that entered the colon during early life persisted long term in the CD45.2+ adult hosts colon (Extended Data Fig. 1C-D). This suggested that thymic iNKT cells display a strong predisposition to engraft in the colon but not the spleen compared to conventional T cells during this early period of life and establish residency. In contrast, adoptive transfer of CD45.1+ thymic T cells into adult CD45.2+ hosts (Fig. 1G) resulted in limited entry of iNKT and TCR-αβ+ T cells in the colon and spleen (<3%) (Fig. 1H). This indicates that the colon is uniquely permissive to the local establishment of thymically-derived iNKT cells during early, but not later, life resulting in establishment of long-term residency.
Macrophages regulate the abundance of early life colonic iNKT cells
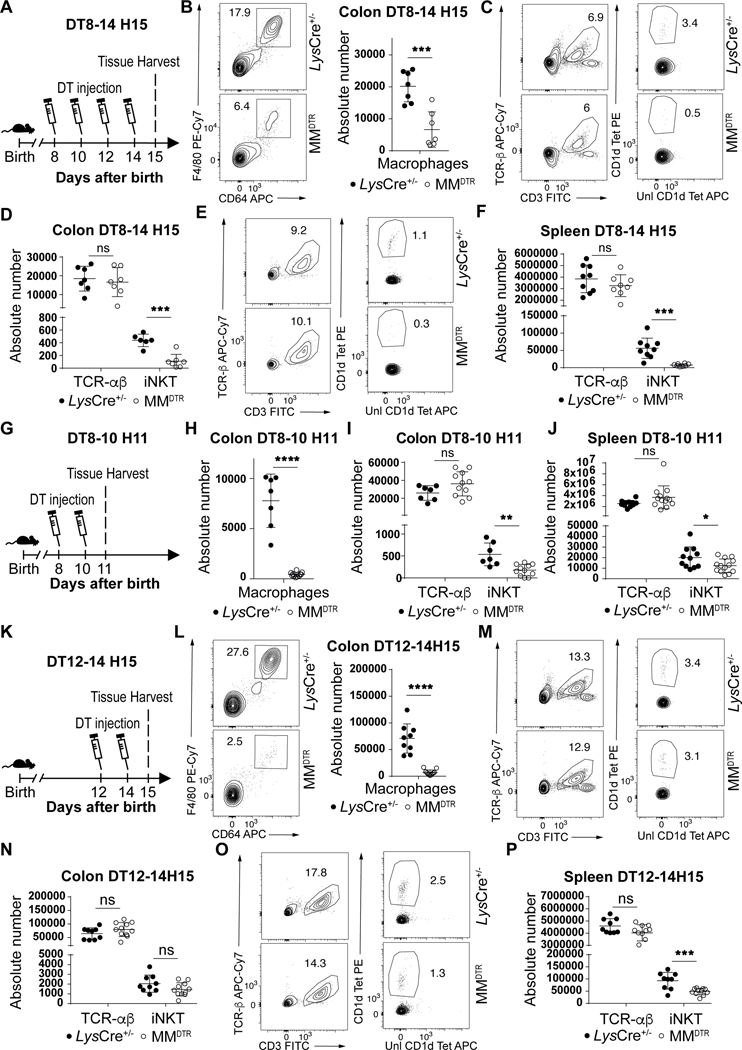
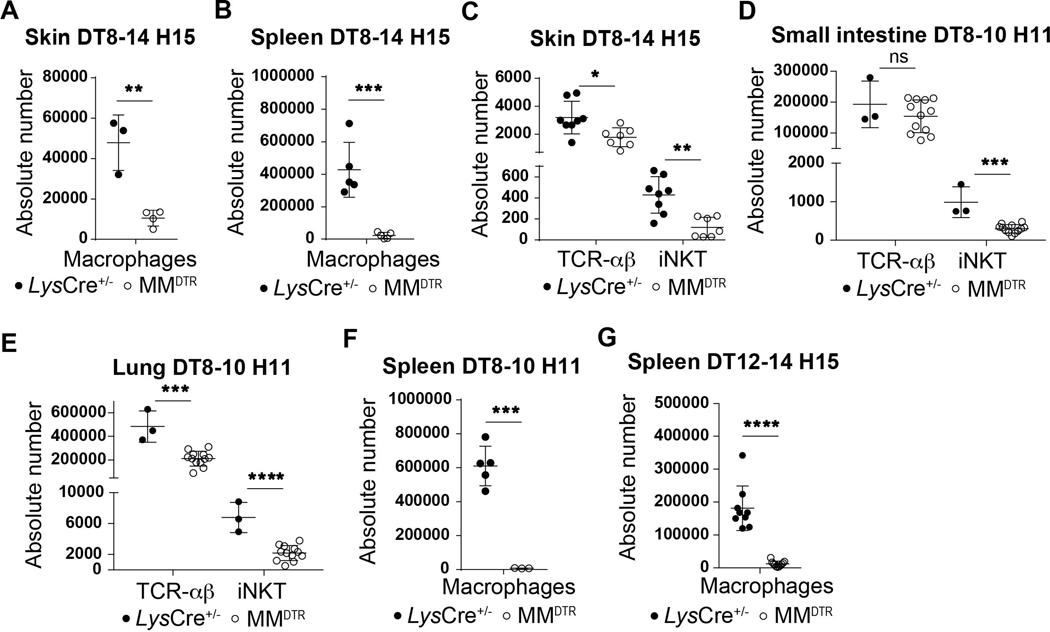
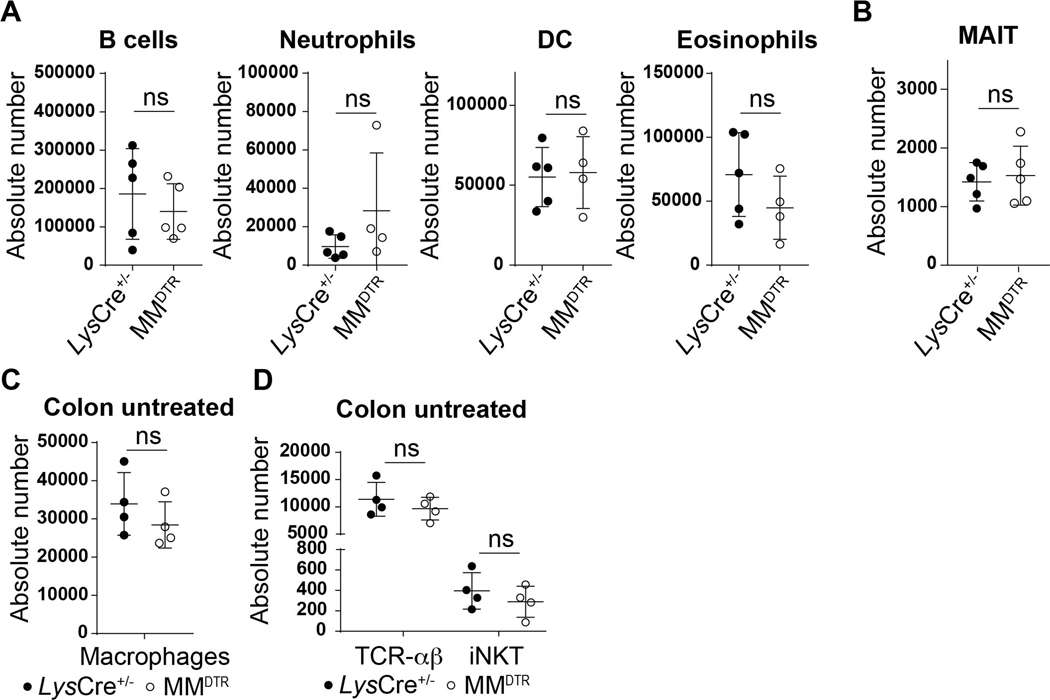
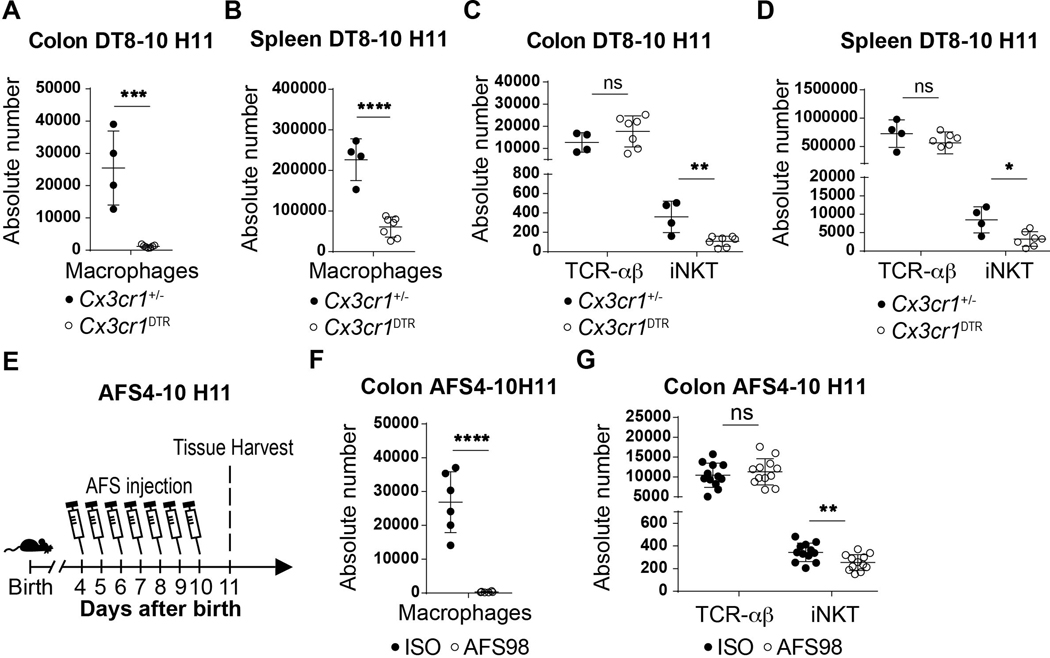
We considered whether macrophages were involved in the processes associated with establishing iNKT cell residency during early life in the colon given that embryonic macrophages transiently occupy this tissue niche for the time period when iNKT cell tissue establishment occurs (12, 13). To do so, we used a transgenic mouse model (MMDTR) in which the combined expression of Lyz2 (or Lys) and Csf1r allows the precise expression of diphtheria toxin receptor (DTR) at the surface of macrophages in vivo (17). Injection of diphtheria toxin (DT) into the MMDTR mice (LysCre+/−, Csf1rDTR+/−) results in specific cell death of monocytes and macrophages independent of their ontogeny compared to littermate controls (LysCre+/−, Csf1rDTR−/−). We performed four sets of DT injection beginning at day 8 until day 14 after birth (Fig. 2A). This regimen led to significant depletion of macrophages in MMDTR mice compared to littermate controls in the colon lamina propria, skin and spleen (Fig. 2B, Extended Data Fig. 2A-B). Remarkably, the depletion of macrophages during this critical developmental period was associated with a significant decrease in the numbers of iNKT cells in all three of these organs (Fig. 2C-F, Extended Data Fig. 2C) as well as in the small intestine and lung (Extended Data Fig. 2D-E), but without modification of splenic or colonic TCR-αβ+ T cell abundance (Fig. 2C-F). These studies suggest that macrophage depletion specifically affects iNKT cell abundance. Indeed, we observed no DT-associated depletion of other cell types, including B cells, neutrophils, dendritic cells (DC), eosinophils (Extended Data Fig. 3A) or mucosa associated invariant T (MAIT) cells in the colon (Extended Data Fig. 3B). Further, at two weeks of age in the absence of DT injection, the levels of macrophages (Extended Data Fig. 3C) and TCR-αβ+ T and iNKT cells (Extended Data Fig. 3D) were the same in MMDTR and control littermate mice, suggesting that the effects observed were dependent upon DT alone and thus macrophages. To confirm these results, we utilized Cx3cr1DTR mice as a model for macrophage depletion. Two injections of DT at day 8 and 10 after birth significantly depleted colonic and splenic macrophages in Cx3cr1DTR mice compared to littermate controls lacking the expression of the DTR locus (Extended Data Fig. 4A-B). In accordance with our observations in MMDTR mice, the depletion of macrophages by this approach was associated with decreased abundance of iNKT cells, but not TCR-αβ+ T cells, in the colon and spleen of Cx3cr1DTR mice but not in the control mice (Extended Data Fig. 4C-D). In a third approach, we administered a monoclonal antibody, AFS98, that binds to CSF-1R and is known to deplete macrophages in vivo (18, 19), between days 4 and 10 of life (Extended Data Fig. 4E). This treatment also resulted in macrophage depletion as well as a reduction in the numbers of iNKT but not TCR-αβ+ T cells in the colon at day 11 after birth compared to isotype control antibody treated mice (Extended Data Fig. 4F-G). Thus, three distinct experimental approaches reveal that macrophages control the abundance of iNKT cells in the colon, small intestine, lung, skin, and spleen in early life.
Fig. 2. Macrophages regulate the abundance of iNKT cells during early but not later life in the colon.
A) Schematic of macrophage depletion model. Representative plot (left) and absolute count (right) of macrophages (CD45+ Lin− F4/80+ CD64+ cells) on day 15 (H15) in the colon of control littermates LysCre+/− (n=7) or MMDTR (n=7) animals treated with diphtheria toxin (DT) every two days from day 8 to 14 after birth (DT8–14) (B). Representative plot and absolute count of iNKT (CD45+ CD3ε+ TCRβ+ CD1d Tetramer+) and TCR-αβ+ T (CD45+ CD3ε+ TCRβ+) cells on day 15 in the colon (C,D) or spleen (E,F) of control littermates LysCre+/− (colon n=7, spleen n=9) or MMDTR (colon n=7, spleen n=8) animals treated with DT every two days from day 8 to 14 after birth. G) Schematic of macrophage depletion model. DT administered from day 8 to 10 (DT8–10) after birth followed by quantitative analyses on day 11 (H11) of the absolute count of macrophages in the colon (H) and the absolute count of iNKT and TCR-αβ+ T cells in the colon (I) and spleen (J) of control littermate LysCre+/− (colon n=7, spleen n=11) or MMDTR (colon n=11, spleen n=12) animals. K) Schematic of macrophage depletion model. Representative plot (left) and absolute count (right) of macrophages on day 15 in the colon of control littermates LysCre+/− (n=9) or MMDTR (n=10) animals treated with DT every two days from day 12 to 14 after birth (DT12–14) (L). Representative plot and absolute count of iNKT and TCR-αβ+ T cells on day 15 in the colon (M,N) or spleen (O,P) of control littermates LysCre+/− (n=9) or MMDTR (n=10) animals treated with DT every two days from day 12 to 14 after birth. Data are representative of three experiments [(A) to (P)]. Unl, Unloaded. Tet, Tetramer. Numbers in the representative plots indicate cell frequency. Error bars indicate standard error of mean. Each dot is representative of an individual mouse. P values were calculated by unpaired two-sided Student’s t-test. *P < 0.05, **P < 0.01, ***P < 0.001, ****P < 0.0001, ns: not-significant.
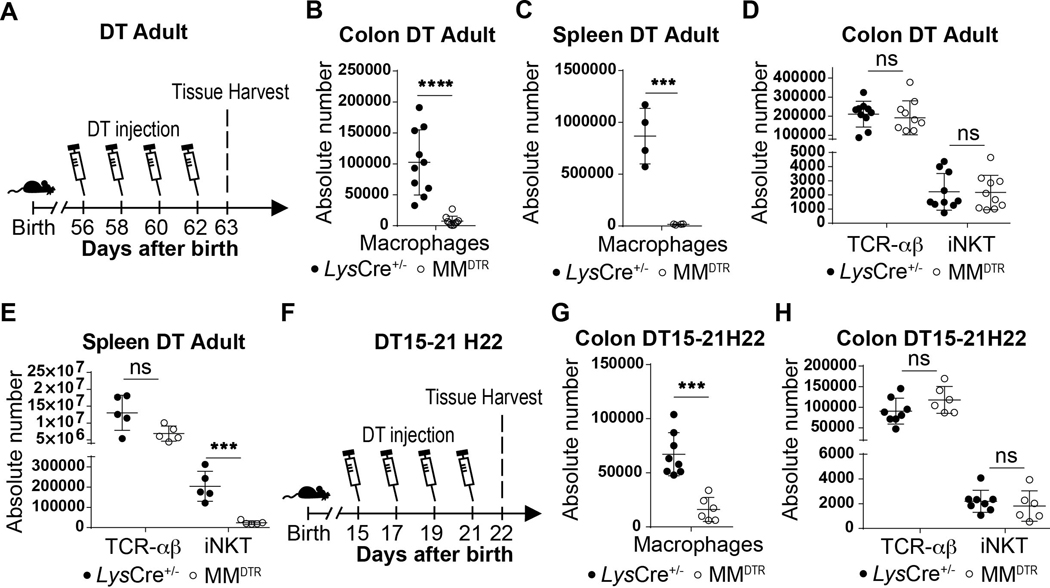
Next, we sought to define whether there were temporal restrictions in the tissue specific, macrophage-determined control of iNKT cell abundance. We observed that administration of DT to adult MMDTR mice every two days beginning at day 56 until day 62 of life (Extended Data Fig. 5A) or beginning at day 15 until day 21 after birth (Extended Data Fig. 5F) resulted in macrophage depletion (Extended Data Fig. 5B,C,G) and reduction in iNKT cell numbers in the spleen but not in the colon (Extended Data Fig. 5D,E,H). This indicated that macrophages regulate iNKT cells during the first two weeks of life but not thereafter in the colon. We therefore next empirically parsed out the window of time when macrophages were regulating iNKT cells using the MMDTR model. By this approach, we discovered that two injections of DT at day 8 and 10 (Fig. 2G) was sufficient to cause efficient macrophage depletion in the colon and spleen of MMDTR mice compared to littermate controls (Fig. 2H, Extended Data Fig. 2F) together with decreased abundance of iNKT cells but not TCR-αβ+ T cells in these organs (Fig. 2I-J). Conversely, colonic and splenic macrophage depletion between day 12 and day 14 after birth (Fig. 2K-L, Extended Data Fig. 2G), had no effect on colonic iNKT or TCR-αβ+ T cell numbers (Fig. 2M-N), in contrast to that observed in spleen where iNKT cell numbers were specifically reduced (Fig. 2O-P). Together, these results show that whereas macrophage control of iNKT cell abundance in lymphoid organs such as the spleen occurs without temporal restriction in early and later life, macrophage regulation of iNKT cell abundance in the colon is restricted to the first 11 days of life when iNKT cells first appear relative to TCR-αβ+ T cells (Fig. 1C).
Embryonic macrophages regulate early life iNKT cell abundance
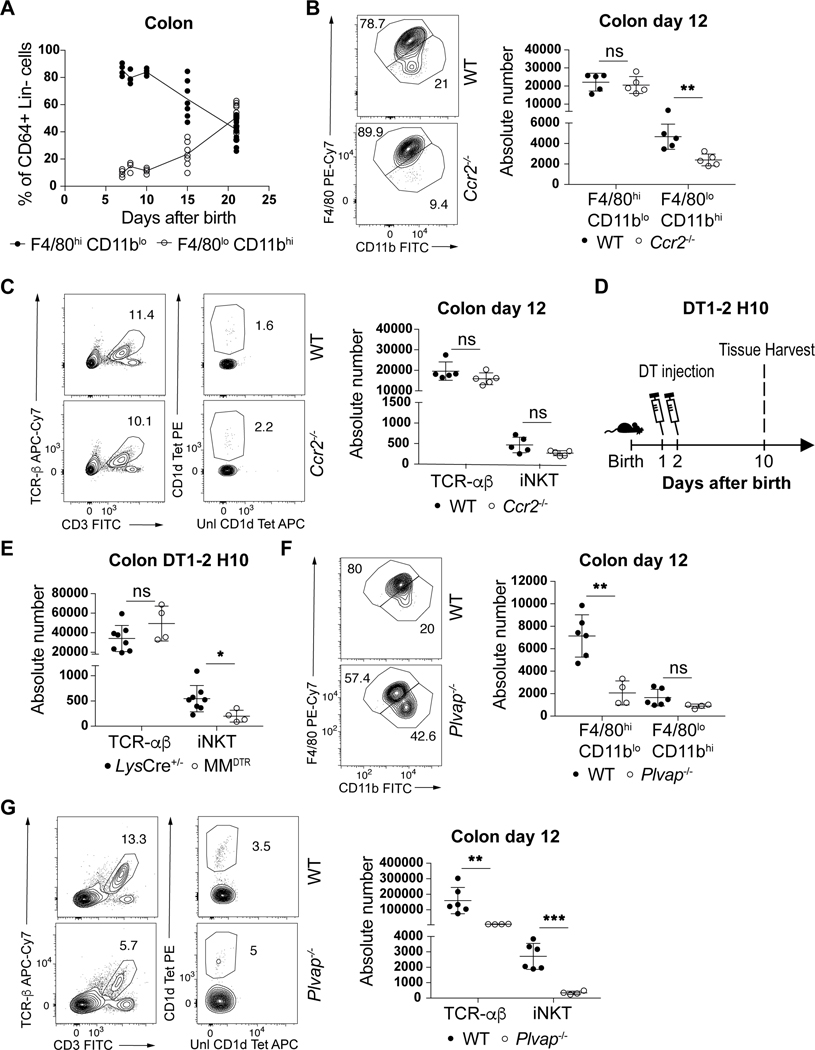
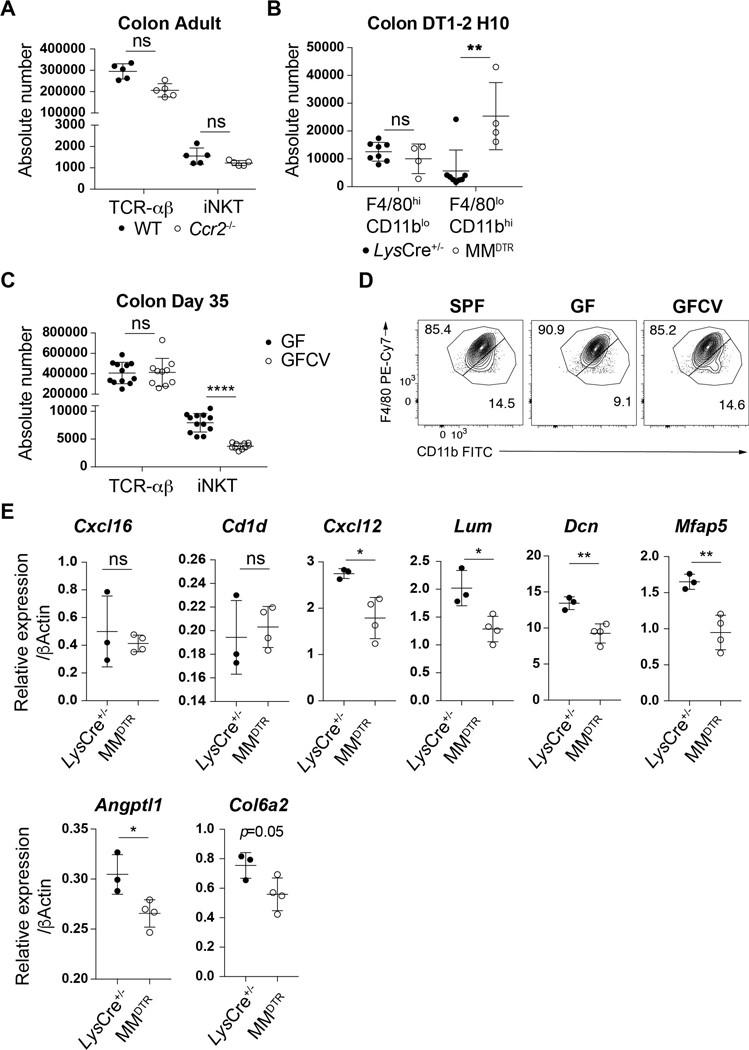
The ability of macrophages to regulate iNKT cells throughout life in the spleen but only during early life in the colon may be explained by recent observations suggesting that the developmental origins of macrophages in the colon shifts from an embryonic derived population present at birth to a predominantly bone marrow derived population over time (12). This pointed to a role for embryonic macrophages in the effects observed. We therefore monitored the kinetics of these populations using surface markers whose levels differ on macrophages of embryonic (F4/80hiCD11blo) or bone marrow (F4/80loCD11bhi) origin (12). Consistent with previous reports (12), we observed that colon macrophages were phenotypically of embryonic origin during the first 11 days of life, corresponding to the permissive window, after which their numbers begin to diminish as the number of bone marrow derived macrophages in the colon concomitantly increases (Fig. 3A). This led us to assess the relative contributions of embryonic versus bone marrow derived macrophages on the expansion of colon iNKT cells. We first examined CCR2-deficient (Ccr2−/−) mice in which bone marrow-derived monocyte recruitment to tissues is impaired (20). As expected, we observed a defect in the levels of colonic bone-marrow derived (F4/80loCD11bhi), but not embryonic-derived (F4/80hiCD11blo) macrophages in Ccr2−/− compared to control mice at day 12 after birth (Fig. 3B). However, this specific depletion in Ccr2−/− mice had no effect on iNKT and TCR-αβ+ T cell levels at day 12 of life (Fig. 3C) or in the adult (Extended Data Fig. 6A) ruling out a significant contribution of bone marrow derived macrophages on iNKT cell expansion in the colon. To more directly evaluate the role of embryonic derived macrophages we performed DT injection in MMDTR mice between day 1 and 2 after birth (Fig. 3D) which depletes macrophages present at birth and most likely prior to the influx of bone marrow derived populations in the colon (Fig. 3A). This regimen led to an early life depletion of macrophages (F4/80hiCD11blo) that was compensated at day 10 after birth by an increase in the levels of bone-marrow derived populations (F4/80loCD11bhi, Extended Data Fig. 6B). Importantly, despite this enrichment in macrophages of bone-marrow origin, we also observed a specific decrease in the numbers of iNKT cells without modification of the TCR-αβ+ T cell levels in the colon (Fig. 3E). This strongly suggests that embryonic derived macrophages present at birth preferentially regulate colon iNKT cell abundance. To investigate this further, we took advantage of PLVAP-deficient (Plvap−/−) mice that display normal levels of macrophages derived from bone marrow hematopoiesis, but show a defect in embryonic derived macrophages due to an inadequacy of macrophage progenitor egress from the fetal liver (21). We observed that Plvap−/− compared to littermate control mice exhibited decreased embryonic (F4/80hiCD11blo) but not bone-marrow (F4/80loCD11bhi) macrophage populations (Fig. 3F) resulting in a reduction of TCR-αβ+ T cells and especially iNKT cell numbers in the colon at day 12 after birth (Fig. 3G). Taken together, we conclude that embryonic rather than bone-marrow derived macrophages determine the abundance of iNKT cells in the colon lamina propria during a specific period of early life.
Fig. 3. Embryonic but not bone marrow derived macrophages regulate iNKT cell abundance in the colon.
A) Percentage of F4/80hi/CD11blo and F4/80lo/CD11bhi macrophages (CD45+ Lin− CD64+ cells) in the colon over time (day 7,8,10: n=5, day 15: n=7, day 21: n=14). B) Representative plot (left) and absolute count (right) of F4/80hi/CD11blo and F4/80lo/CD11bhi macrophages in the colon of wild type littermates (WT, n=5) or Ccr2−/− (n=5) animals at day 12 after birth. C) Representative plot (left) and absolute count (right) of iNKT (CD45+ CD3ε+ TCRβ+ CD1d Tetramer+) and TCR-αβ+ T (CD45+ CD3ε+ TCRβ+) cells in the colon of WT littermates (n=5) or Ccr2−/− (n=5) animals at day 12 after birth. D) Schematic of macrophage depletion model. DT administered at day 1 and (DT1–2) after birth followed by quantitative analyses on day 10 (H10) of the absolute count of iNKT and TCR-αβ+ T cells in the colon (E) of control littermates LysCre+/− (n=8) or MMDTR (n=4) animals. F) Representative plot (left) and absolute count (right) of F4/80hi/CD11blo and F4/80lo/CD11bhi macrophages in the colon of WT littermates (n=6) or Plvap−/− (n=4) animals at day 12 after birth. G) Representative plot (left) and absolute count (right) of iNKT and TCR-αβ+ T cells in the colon of WT littermates (n=6) or Plvap−/− (n=4) animals at day 12 after birth. Data are representative of three experiments [(B) to (E)] or were pooled from three experiments [(F) to (G)]. Unl, Unloaded. Tet, Tetramer. Numbers in the representative plots indicate cell frequency. Error bars indicate standard error of mean. Each dot is representative of an individual mouse. P values were calculated by unpaired two-sided Student’s t-test. *P < 0.05, **P < 0.01, ***P < 0.001, ns: not-significant.
Microbiota is not necessary for macrophages to regulate iNKT cells
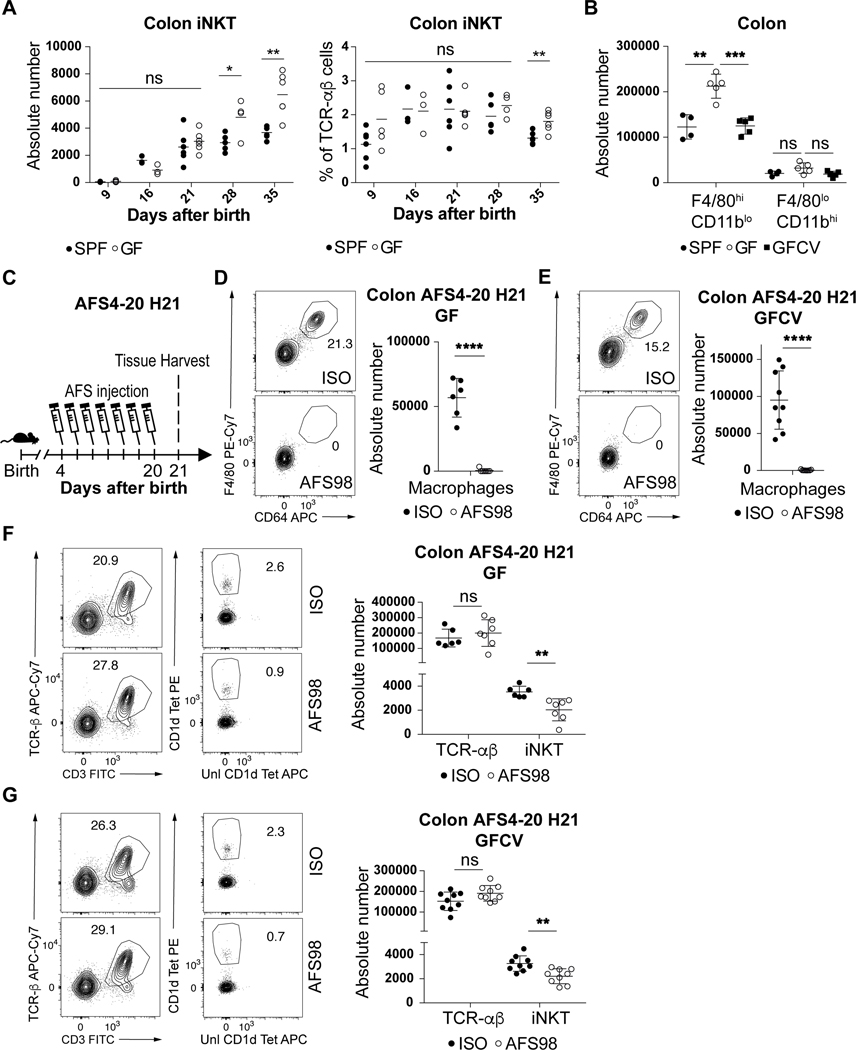
Previous studies performed in Swiss-Webster mice have shown that iNKT cells are increased in adult germ free (GF) relative to specific pathogen free (SPF) mice and that normalization of these elevated levels of iNKT cells in GF mice only occurs if microbiota are introduced in early (pre-weaned) but not later (post-weaned) life (7, 8). In mice on a C57BL/6 background that were used in the present study, we also observed elevated colonic iNKT cell levels in adult GF compared to SPF mice (Fig. 4A) which was decreased if the microbiota were reintroduced at birth (GFCV) (Extended Data Fig. 6C). It is therefore of interest we observed a significant increase in F4/80hiCD11blo (embryonic) but not F4/80loCD11bhi (bone-marrow) macrophages in GF compared to SPF mice at day 15 of life which was normalized to SPF levels in GFCV mice (Fig. 4B, Extended Data Fig. 6D). Further, administration of AFS98 in GF or GFCV mice to deplete macrophages between day 4 and 20 after birth (Fig. 4C) led to efficient macrophage depletion (Fig. 4D-E) as well as reduced iNKT cell abundance in both GF (Fig. 4F) and GFCV (Fig. 4G) mice compared to isotype control antibody treatment. These results demonstrate that microbiota repress colonic macrophage levels during early life which is associated with decreased iNKT cell levels in the adult relative to that observed in GF mice. However, a microbial signal is not required for the ability of macrophages to supervise iNKT cell levels in the colon as depletion of macrophages in GF animals results in decreased iNKT cells.
Fig. 4. Microbiota determines the quantity of but is not necessary for embryonic macrophages to regulate colonic iNKT cell levels.
(A) iNKT (CD45+ CD3ε+ TCRβ+ CD1d Tetramer+) absolute counts (left) and cell percentage (right) in the colon of specific pathogen free (SPF) and germ free (GF) mice over time (day 9,21,35: n=5, day 16: n=3, day 28: n=4). B) Absolute count of F4/80hi/CD11blo and F4/80lo/CD11bhi macrophages (CD45+ Lin− F4/80+ CD64+ cells) in the colon of SPF (n=4), GF (n=5) or GF conventionalized with SPF microbiota prior to birth (GFCV, n=5) animals at 15 days old. C) Schematic of macrophage depletion model with AFS98 antibody. Representative plot (left) and absolute count (right) of macrophages (D,E) and iNKT and TCR-αβ+ T (CD45+ CD3ε+ TCRβ+) cells (F,G) in the colon of 21 day old (H21) GF or GFCV animals treated with AFS98 (GF n=7, GFCV n=9) or Isotype control (GF n=6, GFCV n=9) antibody from day 4 to 20 (AFS4–20) after birth. Data are representative of three experiments [B] or were pooled from two experiments [(C) to (G)]. Unl, Unloaded. Tet, Tetramer. Numbers in the representative plots indicate cell frequency. Error bars indicate standard error of mean. Each dot is representative of an individual mouse. P values were calculated by unpaired two-sided Student’s t-test. *P < 0.05, **P < 0.01, ***P < 0.001, ****P < 0.0001, ns: not-significant.
Transcriptomes of early life colonic macrophages and iNKT cells
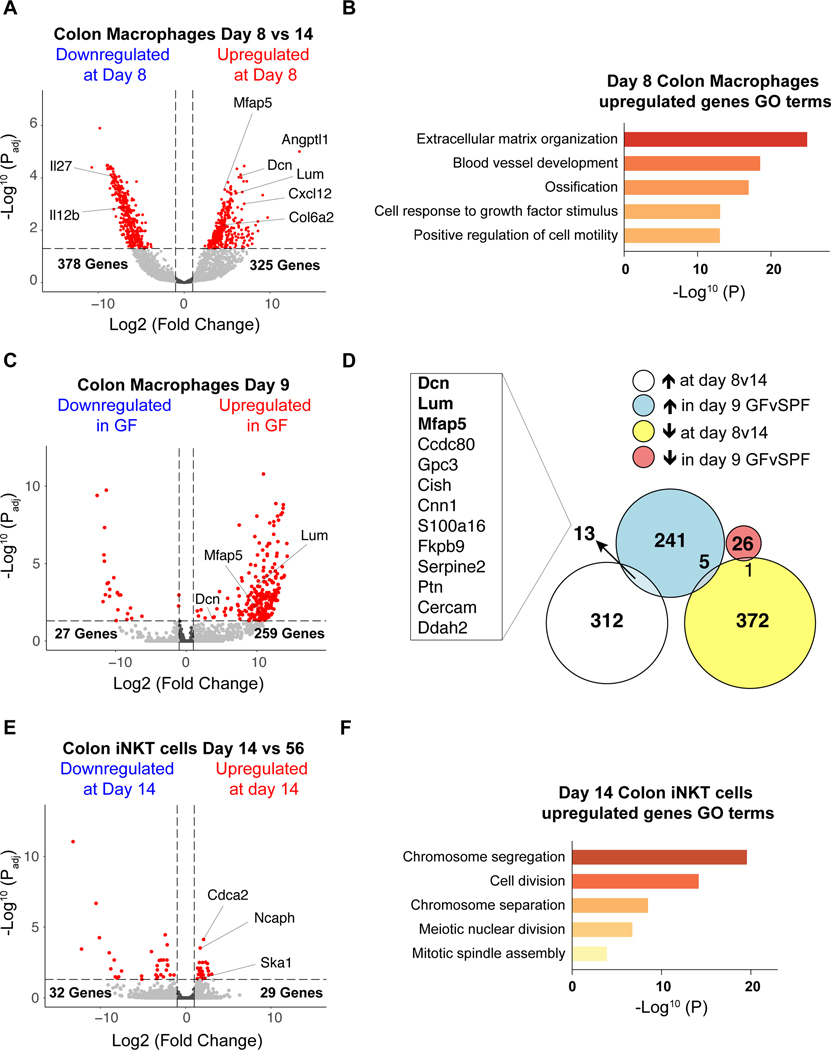
To understand the potential mechanisms by which macrophages may regulate iNKT cells in early life, we performed bulk RNA-Seq of colonic macrophages and iNKT cells. We investigated the transcriptional signatures of macrophages defined as CD64+F4/80+ at day 8 and day 14 after birth to identify transcripts specifically upregulated or downregulated during the time embryonic macrophages control iNKT cell levels in early life within the colon. We observed 325 transcripts with elevated abundance and 378 transcripts with decreased abundance in colonic macrophages purified at day 8 after birth compared to day 14 after birth (Fig. 5A, Supplementary Table. 1) suggesting a major switch in macrophage function during this period. Part of the differentially expressed genes we identified encoded secreted immune factors such as interleukins (IL) and chemokines (CXCL) which suggest an important role of macrophages in determining differentiation, proliferation and/or migration of iNKT cells. Transcripts encoding CXCL12 (Cxcl12) were enriched at day 8 while transcripts encoding IL12b (Il12b) and IL27 (Il27) were enriched at day 14 (Fig. 5A). Consistent with a potential role of one or several of these immune factors in colonic iNKT cell regulation during early life, CXCL12 has been shown to regulate iNKT cell migration in vitro (22). Further, colonic macrophages at day 8 after birth were highly enriched in transcripts encoding proteins generally associated with the extracellular matrix (ECM) such as Decorin (Dcn), Lumican (Lum), Microfibrillar-associated protein 5 (Mfap5), Collagen 6a2 (Col6a2) as well as proteins associated with angiogenesis such as Angiopoietin-related protein 1 (Angptl1) (Fig. 5A). The upregulation of genes associated with ECM formation suggest colonic macrophages at day 8 compared to day 14 may have an important role in the structural development of the colon that is unique to early life and thus involved in creating a niche conducive to iNKT cell seeding and development. In agreement with this, the Gene Ontology (GO) term analysis showed that ECM organization was the most significantly enriched biological process followed by blood vessel development in day 8 macrophages (Fig. 5B, Supplementary Table. 2).
Fig. 5. Macrophage and iNKT cell transcriptional signature during early life.
A) Transcriptome analysis of colonic macrophages (CD45+ Lin− F4/80+ CD64+ cells) from 8 and 14 day old specific pathogen free (SPF) animals (n=4). B) Pathway analysis by gene ontology enrichment of transcripts increased in colonic macrophages at day 8 compared to day 14 after birth in SPF animals. C) Transcriptome analysis of colonic macrophages from day 9 SPF (n=2) and GF (germ free, n=4) animals. D) Intersection of the differentially expressed genes identified by the transcriptome analysis of colonic macrophages from 8 and 14 day old SPF animals and the transcriptome analysis of colonic macrophages from day 9 SPF and GF animals. E) Transcriptome analysis of colonic iNKT (CD45+ CD3ε+ TCRβ+ CD1d Tetramer+) cells from 14 day old (n=3) and 56 day old (n=4) animals raised under SPF conditions. F) Pathway analysis by gene ontology enrichment of transcripts differentially expressed in colon iNKT cell populations at day 14 compared to the adult in SPF animals. Transcripts differentially expressed between groups were identified by DESeq2 analyses (log2|FC|>1, padj<0.05, red). P values for pathway analysis were calculated based on the accumulative hypergeometric distribution according to Metascape.
We also examined macrophages from SPF and GF mice at day 9 after birth. We observed 259 transcripts with elevated abundance and 27 transcripts with decreased abundance at day 9 after birth in macrophages from GF compared to SPF mice in the colon (Fig. 5C, Supplementary Table. 3), which advocate for a specific role of microbiota in regulating macrophages likely of embryonic origin during early life when the establishment of iNKT cell residency is taking place. We intersected the transcripts differentially expressed in colonic macrophages at day 8 compared to day 14 after birth (Fig. 5A) with transcripts differentially expressed in GF compared to SPF mice at day 9 after birth (Fig. 5C) and found 19 transcripts to be commonly dysregulated in these two datasets among which 13 were enriched in GF versus SPF and day 8 versus day 14 after birth (Fig. 5D). These similarities (>2.5%) between the differentially expressed genes in both datasets predicted a coincidence in their mechanisms of action. Indeed, the 13 genes commonly identified in macrophages as enriched in GF versus SPF and day 8 versus day 14 after birth included at least 3 transcripts that encoded proteins associated with ECM organization (Dcn, Lum, Mfap5), suggesting early life macrophages may participate in this process under the influence of the microbiota.
Interestingly, some of the genes we identified as differentially expressed in sorted macrophages during early life and participating to ECM organization (Dcn, Lum, Mfap5, Col6a2) or angiogenesis (Angptl1, Cxcl12) are more generally associated with non-hematopoietic cells (23, 24). This makes it possible that their enrichment in macrophages during early life were derived from recent phagocytosis of neighboring non-hematopoietic cells (25) or doublets due to strong anatomical association (26). However, we observed a significant decrease in the expression of these genes in the whole colon following specific macrophage depletion at day 8 (Extended Data Fig. 6E). This supports the notion that early life embryonic macrophages may be an alternative source of these transcripts. We did not observe differences in CXCL16 or CD1d expression by transcriptional analysis of macrophages or by quantitative PCR of the whole colon following macrophage depletion during early life (Extended Data Fig. 6E) suggesting alternative cellular sources of these factors in the regulation of iNKT cells such as the intestinal epithelium as previously shown (7, 27). Our studies thus suggest that the control of iNKT cell levels and differentiation by early life embryonic macrophages was most likely derived from a multifactorial process involving their role in sculpting the structure of the colon to create the proper niche for iNKT cell establishment and providing factors that affect iNKT cell expansion and/or differentiation.
To further investigate this, we next turned our attention to the transcriptional profiles of iNKT cells during early (day 14) and later (day 56) life by RNA-Seq and identified 61 differentially expressed transcripts (Fig. 5E, Supplementary Table. 4). Of these, 32 transcripts exhibited elevated abundance in the adult relative to day 14 of life and 29 transcripts were uniquely increased in neonatal iNKT cells. From GO term analysis, the early life iNKT cells were especially enriched in pathways associated with cell division (Fig. 5F, Supplementary Table. 5). This supports the notion that iNKT cells adopt a distinct transcriptional program during early compared to adult life consistent with cells in the process of establishing residency and point toward a potential role for proliferation of iNKT cells during this time period.
Macrophages regulate iNKT cell proliferation extrathymically
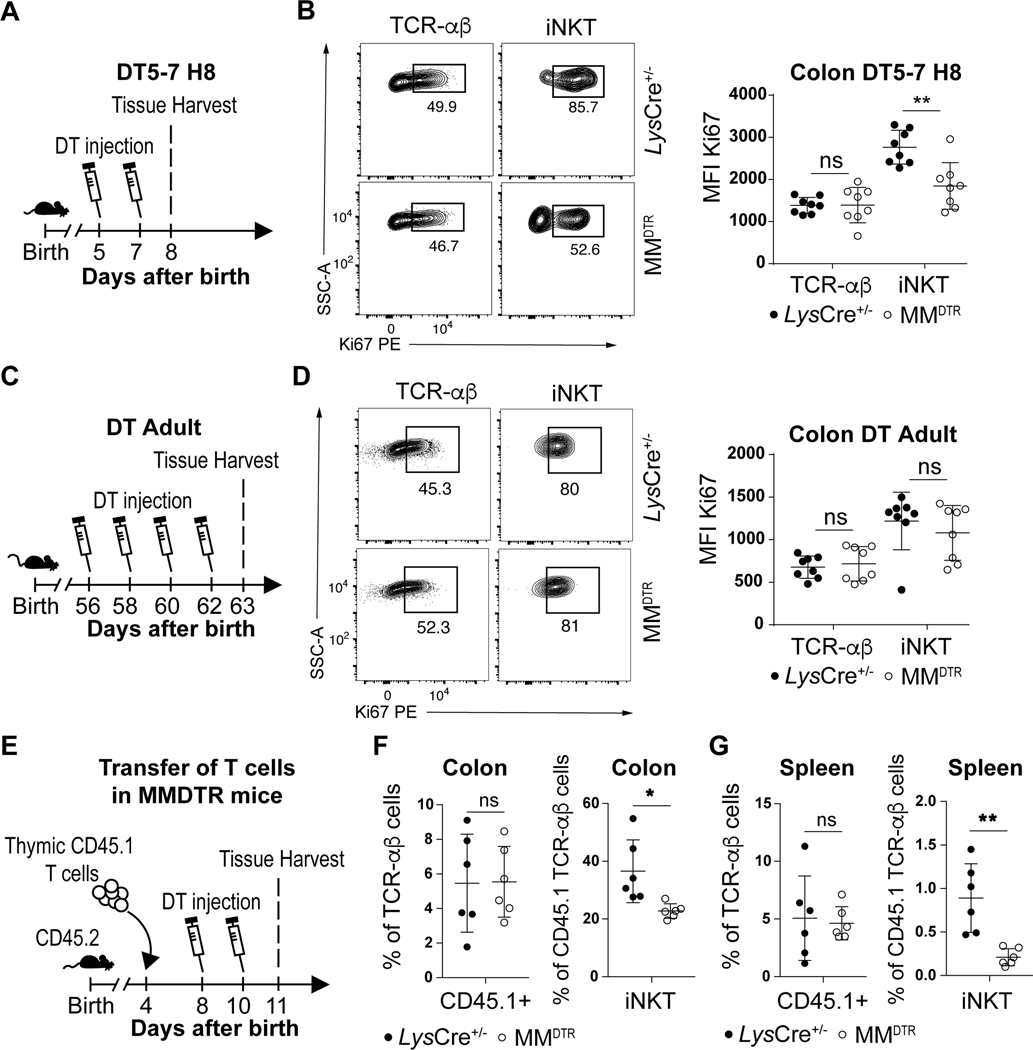
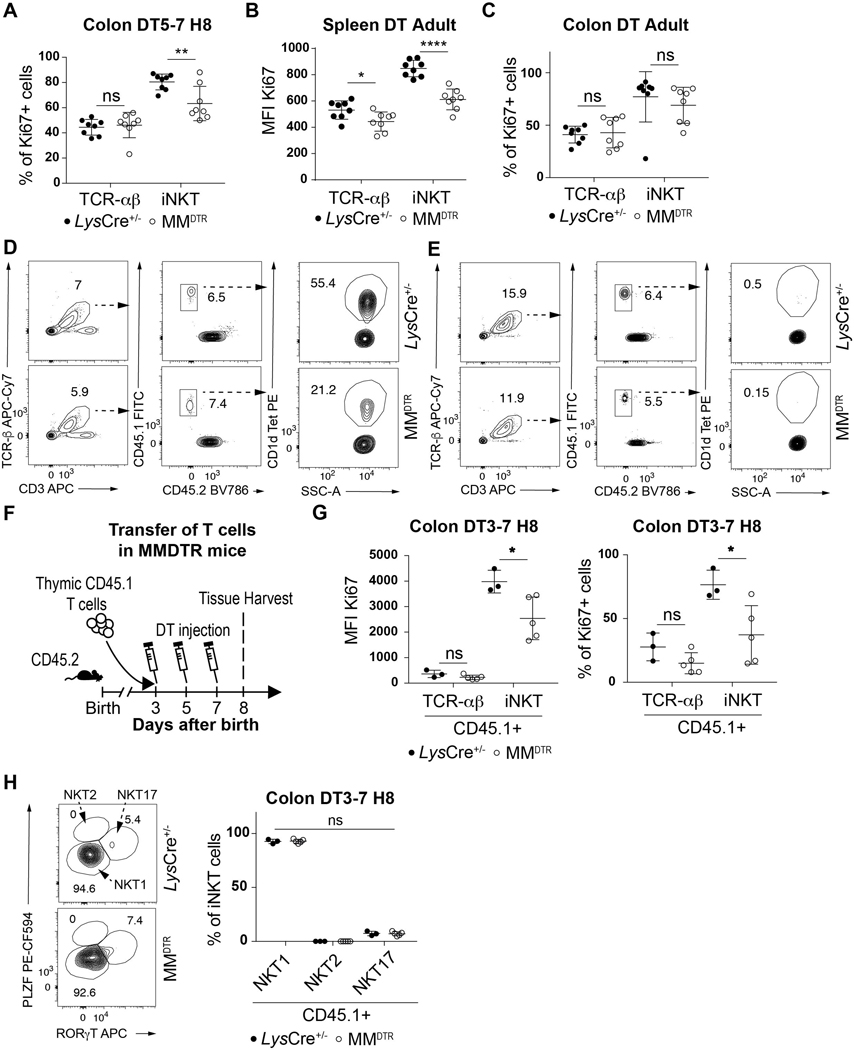
We explored the capacity of iNKT cells to proliferate during the critical period of the first 11 days of life when iNKT cells are regulated by macrophages in the colon. DT was administered on day 5 and day 7 to MMDTR and littermate control mice and the proliferation of colonic iNKT cells assessed by measuring Ki67 expression, a proliferation marker, on day 8 after birth (Fig. 6A). We observed reduced Ki67 expression in iNKT cells from mice depleted of macrophages compared to littermate controls (Fig. 6B, Extended Data Fig. 7A). Conversely, administration of DT to MMDTR mice every two days beginning at day 56 until day 62 of life (Fig. 6C) reduced Ki67 expression in splenic (Extended Data Fig. 7B) but not colonic (Fig. 6D, Extended Data Fig. 7C) iNKT cells compared to littermate controls. This suggests that embryonic macrophages can regulate colonic iNKT cell proliferation in their local environment during early life.
Fig. 6. Early life embryonic macrophages regulate iNKT cell proliferation extrathymically.
A) Schematic of macrophage depletion model. B) Representative plot (left) and Ki67 mean fluorescent intensity (MFI) (right) of TCR-αβ+ T (CD45+ CD3ε+ TCRβ+) and iNKT (CD45+ CD3ε+ TCRβ+ CD1d Tetramer+) cells on day 8 (H8) in the colon of control littermates LysCre+/− (n=8) or MMDTR (n=8) animals treated with diphtheria toxin (DT) from day 5 to 7 (DT5–7) after birth. C) Schematic of macrophage depletion model. D) Representative plot (left) and Ki67 mean fluorescent intensity (MFI) (right) of TCR-αβ+ T and iNKT cells on day 63 in the colon of control littermates LysCre+/− (n=8) or MMDTR (n=8) animals treated DT from day 56 to 62 (DT Adult) after birth. E) Schematic of adoptive transfer and macrophage depletion model. Adoptive transfer of CD45.1 adult thymic cells into a 4 day old CD45.2 control littermates LysCre+/− (n=6) or MMDTR (n=6) animals followed by DT administration from day 8 to 10 (DT8–10) after birth and quantitative analyses on day 11 (H11) of the percentage of CD45.1 expressing TCR-αβ+ T (left panel) and iNKT (right panel) cells in the colon (F) or spleen (G). Data were pooled from two experiments [(A) to (G)]. SSC-A, side scatter. Error bars indicate standard error of mean. Each dot is representative of an individual mouse. P values were calculated by unpaired two-sided Student’s t-test. *P < 0.05, **P < 0.01, ns: not-significant.
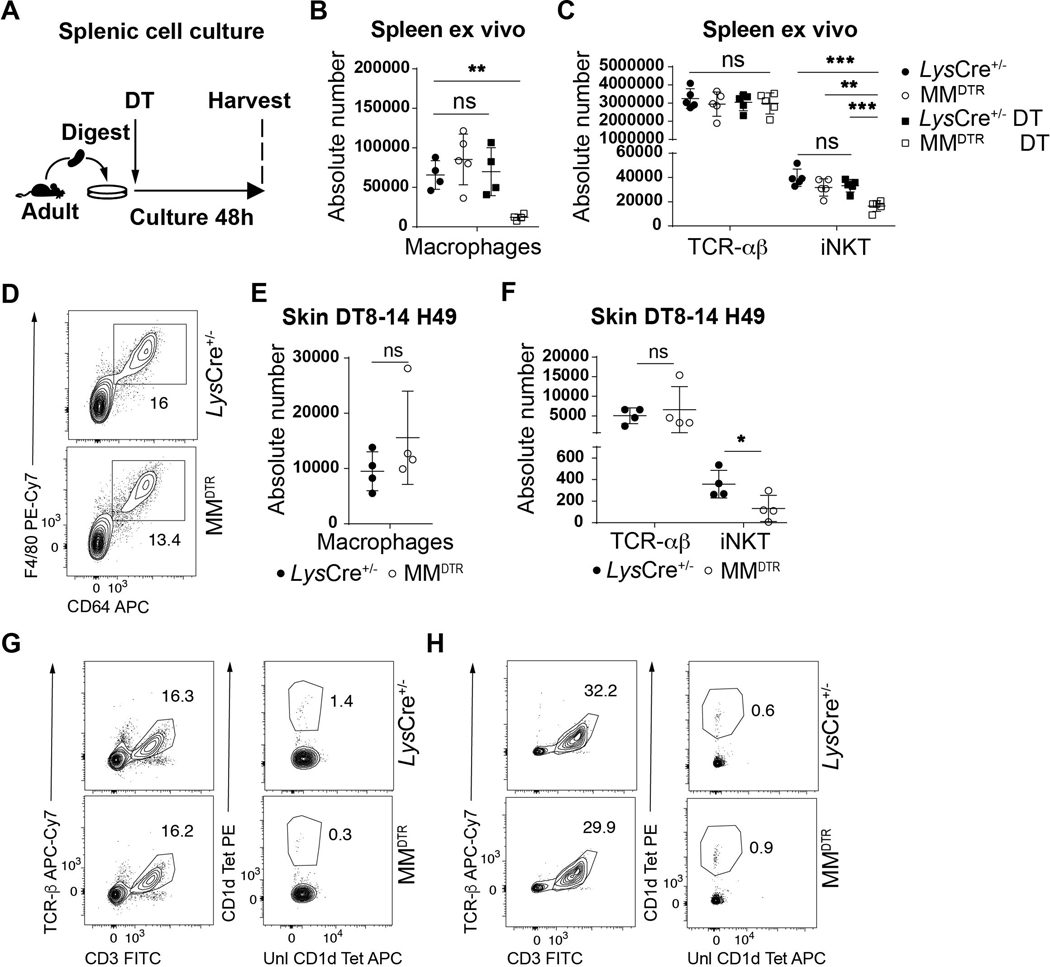
We therefore directly addressed whether macrophages affect iNKT cells proximally at the level of the tissue. We first performed adoptive transfer of enriched CD45.1+ thymic T cells in a CD45.2+ MMDTR and control host at day 4 after birth and administered DT at day 8 and day 10 after birth (Fig. 6E). This treatment resulted in macrophage depletion (Fig. 2H, Extended Data Fig. 2F), together with reduced levels of CD45.1+ iNKT but not TCR-αβ+ T cells in the colon (Fig. 6F, Extended Data Fig. 7D), and spleen (Fig. 6G, Extended Data Fig. 7E) of the recipient MMDTR CD45.2+ mice compared to similarly treated littermate controls. Similarly, we performed adoptive transfer of enriched CD45.1+ thymic T cells in a CD45.2+ MMDTR or control host at day 3 and administered DT from day 3 to 7 (Extended Data Fig. 7F). We observed reduced Ki67 expression from CD45.1+ iNKT but not TCR-αβ+ T cells in the colon of the recipient MMDTR CD45.2+ mice compared to littermate controls at day 8 after birth (Extended Data Fig. 7G). Therefore, early life embryonic macrophages can regulate extrathymic proliferation of iNKT cells. Further, we investigated the capacity of macrophages to regulate iNKT cell levels locally and cultured spleen explants from adult MMDTR mice with or without application of DT for 48h ex vivo and assessed the levels of iNKT and TCR-αβ+ T cells (Extended Data Fig. 8A). DT treatment of the explants depleted macrophages (Extended Data Fig. 8B) in association with a decrease in iNKT but not TCR-αβ+ T cells (Extended Data Fig. 8C). Therefore, we conclude that embryonic macrophages can regulate iNKT cell proliferation independently of the thymus and locally within the tissues during early life.
Early life macrophages determine iNKT cell related disease outcome
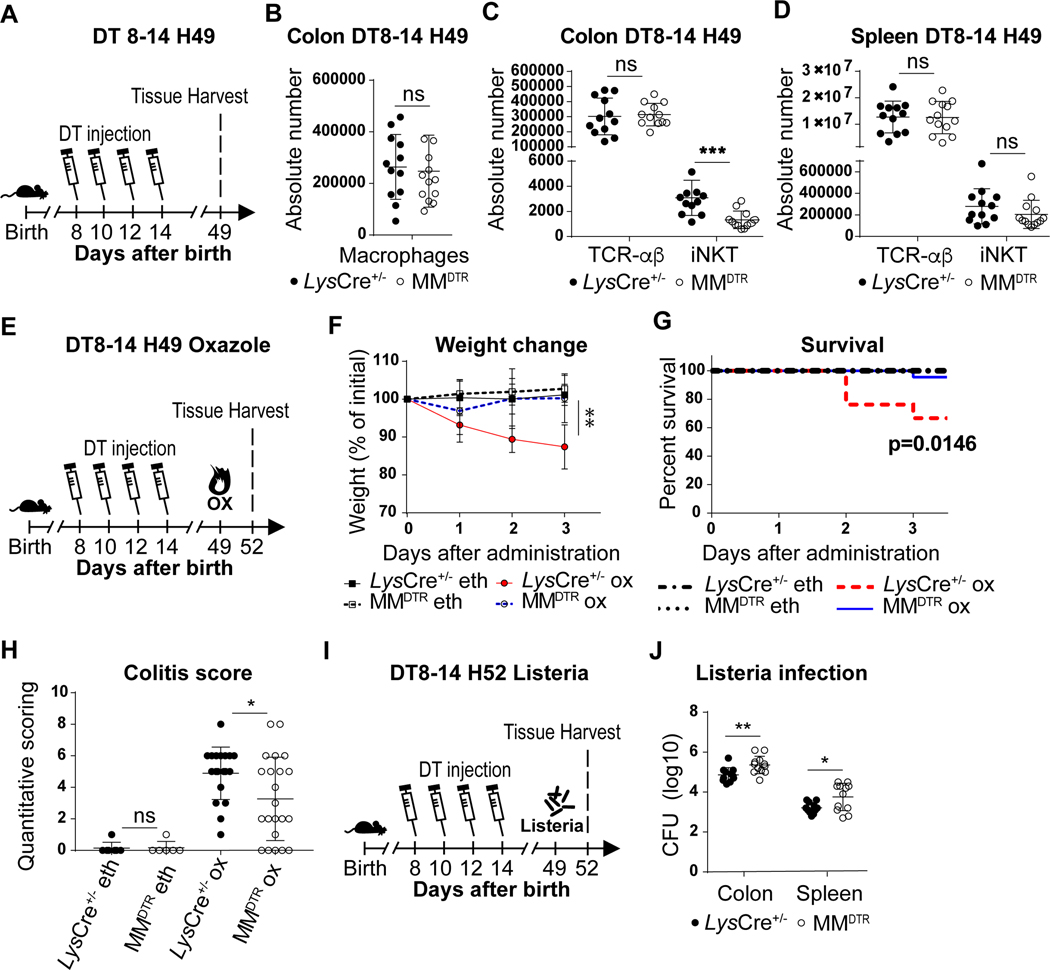
We investigated whether the consequences of embryonic macrophage depletion during early life had a durable impact which affected the host in later life. We therefore first examined whether macrophage deletion in early life caused persistent defects to occur in iNKT cells. DT was administered to MMDTR mice and littermate controls every two days beginning on day 8 until day 14 of life and the numbers of cells in the colon, skin and spleen assessed in the adult on day 49 (Fig. 7A). By five weeks after treatment (day 49), although the quantities of colonic (Fig. 7B, Extended Data Fig. 8D) or skin (Extended Data Fig. 8E) macrophages recovered to normal levels in MMDTR and control mice consistent with the influx of bone marrow-derived macrophages, the abundance of iNKT cells at these barrier sites remained significantly depressed in the MMDTR versus control mice (Fig. 7C, Extended Data Fig. 8F-G). However, the abundance of iNKT cells in the spleen was similar in DT treated MMDTR and littermate control mice (Fig. 7D, Extended Data Fig. 8H). Therefore, the effects on iNKT cell levels in the colon upon early life depletion of macrophages was durable and extended into later life.
Fig. 7. Early life embryonic macrophages set mucosal iNKT cell levels in the adult and determine later life sensitivity or resistance to enteric diseases models.
A) Schematic of macrophage depletion model. Diphtheria toxin (DT) administered from day 8 to 14 (DT8–14) after birth followed by quantitative analyses on day 49 (H49) of the absolute count of macrophages (CD45+ Lin− F4/80+ CD64+ cells) in the colon (B), and the absolute count of iNKT (CD45+ CD3ε+ TCRβ+ CD1d Tetramer+) and TCR-αβ+ T (CD45+ CD3ε+ TCRβ+) cells in the colon (C) and spleen (D) of control littermates LysCre+/− (n=12) or MMDTR (n=12) animals. E) Schematic of macrophage depletion model and oxazole experimental colitis. DT administered from day 8 to 14 after birth followed by intrarectal injection of oxazolone (ox) or ethanol (eth) on day 49 and evaluation of colitis severity of control littermates LysCre+/− or MMDTR animals 3 days after (H52), by weight change (F) (LysCre+/−: eth n=7, ox n=6, MMDTR eth: n=7, ox n=8, P value was calculated at day 3 after ox administration), survival (G) and quantitative scoring (H) (LysCre+/−: eth n=7, ox n=21, MMDTR eth: n=7, ox n=22). I) Schematic of macrophage depletion model and Listeria monocytogenes infection. DT administered from day 8 to 14 after birth followed by L. monocytogenes administration by oral gavage on day 49 and quantitative analyses of colony forming unit (CFU) in the colon and spleen of control littermates LysCre+/− (n=11) or MMDTR (n=12) animals 3 days after infection (H52) (J). Data were pooled from two experiments [(A) to (J)]. Absolute counts were determined by flow cytometry. Error bars indicate standard error of mean. Each dot is representative of an individual mouse. P values were calculated by Log rank test in figure G and unpaired two-sided Student’s t-test in other figures. *P < 0.05, **P < 0.01, ***P < 0.001, ns: not-significant.
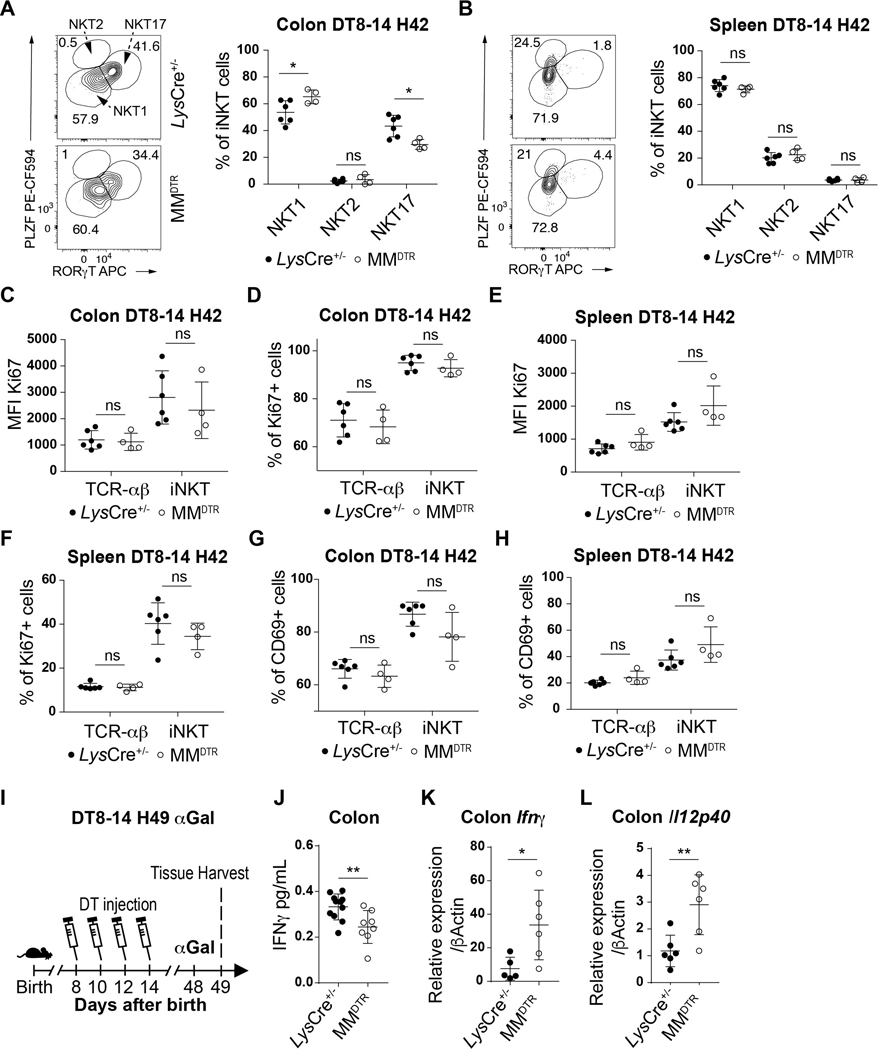
We next examined whether the function of iNKT cells were also altered in later life upon early life elimination of macrophages. We first examined iNKT cell differentiation. iNKT cells can be subdivided into 3 main differentiated subsets in tissues: NKT1, NKT2 and NKT17 (28). Although we observed similar proportions of CD45.1+ iNKT cell subsets in the colon of the MMDTR CD45.2+ recipients at day 8 of life after having received DT treatment from days 3–7 mice (Extended Data Fig. 7H), we found that the iNKT cells which survived macrophage deletion during early life exhibited a decreased proportion of NKT17 cells and a relative increase in NKT1 iNKT cell subsets in the colon but not spleen in later life (Extended Data Fig. 9A-B). However, the iNKT cells which remain within the colon in later life after early life depletion of macrophages in MMDTR mice exhibit similar levels of proliferation and activation relative to that observed in littermate controls based upon Ki67 or CD69 expression, respectively (Extended Data Fig. 9C-H). These results demonstrate that early life embryonic macrophages in the colon provide cues that determine the state of iNKT cell differentiation but not the proliferation or activation state in later life.
Next, we sought to determine if the persistently repressed levels of iNKT cells in adult life due to early life depletion of macrophages would alter iNKT cell-mediated inflammatory responses in later life. Therefore, 49-day old MMDTR mice that had been treated with DT between days 8 and 14 of life (Extended Data Fig. 9I) were exposed with α-galactosylceramide (αGal), the prototypical antigen for stimulation of iNKT cells. Although NKT1 subsets were relatively enriched as observed in Extended Data Fig. 9A, we observed that interferon (IFN)-γ production in the adult colon was lower in mice depleted of macrophages during early life (Extended Data Fig. 9J) despite the fact that the levels of macrophages had recovered (Fig 7B). These results are consistent with a persistent reduction in iNKT cells.
In view of this, we examined the effects of early-life macrophage depletion on the susceptibility of adult mice to iNKT cell-dependent diseases. Oxazole-induced colitis is an experimental model of intestinal inflammation that is highly dependent upon CD1d-restricted iNKT cells (29). DT was administered between day 8 and day 14 of life to MMDTR and littermate control mice, and the mice exposed on day 49 to oxazolone, a prototypical compound used in oxazole-induced colitis (Fig. 7E) (10, 30). In association with persistent reductions in colonic iNKT cells, MMDTR mice depleted of macrophages in early life were protected from oxazolone-induced colitis in later life as shown by significantly diminished weight loss (Fig. 7F), mortality (Fig. 7G) and pathology (Fig. 7H) relative to control mice. As oxazolone-induced colitis is known to depend upon iNKT cells (10), these observations are consistent with the protection from colitis observed. Conversely, when MMDTR and littermate control mice were treated with DT between day 8 and day 14 after birth and orally inoculated on day 49 with a modified form of Listeria monocytogenes able to infect mice (Fig. 7I), the number of L. monocytogenes colony forming units (CFU) recovered from the colon and spleen were significantly greater in MMDTR compared to littermate control mice (Fig. 7J), in association with increased levels of Ifnγ and Il12p40 mRNA expression in the colon (Extended Data Fig. 9K-L). L. monocytogenes infection in Cd1d deficient mice, that lack iNKT cells, exhibit similar findings in the colon and spleen (31) suggesting the decreased colonic iNKT cell levels observed in MMDTR mice may result in increased susceptibility to such an infection. Together, these results reveal that the embryonic macrophage-mediated control of mucosal iNKT cell proliferation during early life is associated with durable functional consequences.
Discussion
In this study, we demonstrate that embryonic macrophages which are transiently present and enriched in early life within barrier tissues such as the colon regulate the establishment of iNKT cell residency at these sites. In fact, iNKT cells can only establish a foothold in barrier sites such as the colon lamina propria during early life if embryonic macrophages are present, but not if they are absent. This macrophage-mediated process is under the control of the microbiota which determines the quantities and function of embryonic macrophages. Transcriptional profiling coupled with phenotypic and functional analyses suggest that early life macrophages are critical to the development of a niche within the colon that preferentially authorize the immigration and settlement of thymically-derived iNKT cells including those that determine the structure of the ECM. At the same time, embryonic macrophages promote the intense proliferative expansion of iNKT cells during early life and their ultimate differentiation into iNKT cell subsets which together culminate in establishing iNKT cell residency and its quantitative and functional set-point. Based upon our results in other organ systems and with Plvap−/− mice that specifically disable fetal-derived macrophage emigration into peripheral tissues, our results likely extend to iNKT cell affiliation with other organs such as the small intestine, skin and lung and potentially the development of other types of resident cells such as subsets of TCR-αβ T cells.
Although embryonic macrophage-mediated regulation of iNKT cells at barrier sites is restricted to the first 11 days of life in a rodent, these effects are profound, extending into later life where they determine the quantities of iNKT cells that the animal possesses. Consequently, early life perturbations of colonic macrophages of embryonic origin are associated with differential host susceptibility to iNKT cell-dependent responses to enteropathogens and environmental stimuli that induce inflammation which models inflammatory bowel disease. Together, our results show that ontogenically distinct macrophage subsets uniquely control host developmental programs associated with the immune system during restricted periods of life within body surfaces significantly exposed to microbes as observed in mucosal tissues. Further, they specifically demonstrate that early life control of colonic iNKT cell levels and function represents a host developmental and extrathymic process that likely begins during fetal life and is under the postnatal control of the microbiota.
Methods
Mice
Mice (C57BL/6J background) were housed in a specific pathogen-free barrier facility at Harvard Medical School under a controlled 12 hours/ 12 hours light dark cycle (light at 7am) at room temperature (22 ± 1°C) and 60 ± 5% humidity: Wild type (ref000664), CD45.1 (ref002014), Ccr2−/− (ref004999), LysCre+/+ (Cre expression is driven by Lyz2, ref004781), Cx3cr1Cre+/+ (Cre expression is driven by Cx3cr1, ref025524), Csf1rDTR+/+ (DTR expression is driven by Csf1r but is inhibited by a loxp-flanked Stop element, ref024046), Rosa26DTR+/+ (DTR expression is driven by Rosa26 but is inhibited by a loxp-flanked Stop element, ref007900), were purchased from the Jackson Laboratory. MMDTR mice (LysCre+/−, Csf1rDTR+/−) and control littermates (LysCre+/−, Csf1rDTR−/−) were generated from the cross of LysCre+/+ with Csf1rDTR+/− mice. Cx3cr1DTR mice (Cx3cr1Cre+/−, Rosa26DTR+/−) and control littermates (Cx3cr1Cre+/−, Rosa26DTR−/−) were generated from the cross of Cx3cr1Cre+/+ with Rosa26DTR+/− mice. Mice analyzed were from both sexes except for oxazolone colitis experiment which was performed in females. Specific Pathogen Free (SPF) and Germ free (GF) mice were bred and maintained in vinyl isolators in the Harvard Digestive Disease Center Gnotobiotic and Microbiology Core. For conventionalization, at gestational day 18, pregnant GF mice were transferred to a SPF isolator and co-housed with an adult female SPF mouse. Plvap−/− mice experiments were performed by Pia Rantakari and Marko Salmi’s laboratory (University of Turku) in their facility. PLVAP deficient mice and control littermates were hybrids containing a mixture of BALB/c, C57BL/6N and NMRI backgrounds obtained from heterozygous × heterozygous breedings. Diphtheria toxin from Corynebacterium was purchased from Sigma (D0564) and injected in mice subcutaneously at 4ng by gram of weight every two days by the schedule depicted in the manuscript. Date of birth was considered as day 1 after birth. AFS98 antibody was provided by Florent Ginhoux (SigN, Singapore), rat igG2a isotype control antibody was purchased from BioXcell (BE0089). Both antibodies were injected everyday intraperitoneally at 100μg per gram of weight in pups at the age described. Parabiosis surgery was performed as described in (32). All procedures were approved by the Harvard Medical Area Standing Committee on Animals.
Tissue isolation
Lamina propria cells isolation protocol was inspired from previously described methods (33). Large or small intestines were collected, fat tissue removed, the intestines cut longitudinally and washed in PBS in order to remove fecal content, cut into 30mmpieces, put into a 50mL falcon tube, shaken in 10mL HBSS (GIBCO) 2mM EDTA at 250 rpm for 15 min at 37°C, rinsed in HBSS at 37°C, shaken in 10mL HBSS 2mM EDTA at 250 rpm for 30 min at 37°C, rinsed in HBSS at 37°C. The epithelial cell fractions were discarded and the lamina propria tissues were digested in 10mL 1mg/mL Collagenase VIII (Sigma C2139) and 10μg/mL Dnase I (D5025) diluted in RPMI (Corning) 10% Fetal Bovine Serum (FBS), 1.5% HEPES (Corning) at 250 rpm for 45 min at 37°C. Lungs were collected, minced in small pieces (1–2 mm) with scissors and digested in 10mL 1mg/mL Collagenase VIII and 10μg/mL Dnase I diluted in RPMI 10% Fetal Bovine Serum, 1.5% HEPES at 250 rpm for 60 min at 37°C. Digestive enzyme activity were stopped by adding 10mL cold FACS buffer (PBS, 2% FBS,1mM EDTA), digested tissues were filtered with 70μm cell strainer, centrifuged at 1500 rpm for 5 min, filtered with 40μm cell strainer, centrifuged and stained for flow cytometry analysis.
To isolate splenic and thymic cells, tissue was mashed by plunger on 70μm cell strainers, centrifuged at 1500 rpm for 5 min, resuspended in ACK lysing buffer (GIBCO) for 2 min and washed in FACS buffer. For skin cell isolation, mouse ears were dissociated using the Multi Tissue Dissociation kit 1 in combination with the gentleMACS Dissociators (Miltenyi) according to manufacturer instructions. For adoptive transfer, CD45.1+ thymic T cells were enriched using Pan T cell Isolation kit II (Miltenyi) and injected intraperitoneally at around 107 thymic T cells by gram of mice. For tissue culture explant, isolated splenic cells were incubated 48 hours in RPMI 10%FBS, 1% Penicillin Streptomycin, 1.5% HEPES, non-essential amino acids (GIBCO) with or without Diphtheria toxin (1μg/mL) in a standard cell culture incubator at 37 °C and stained for flow cytometry analysis.
Flow cytometry and Antibodies
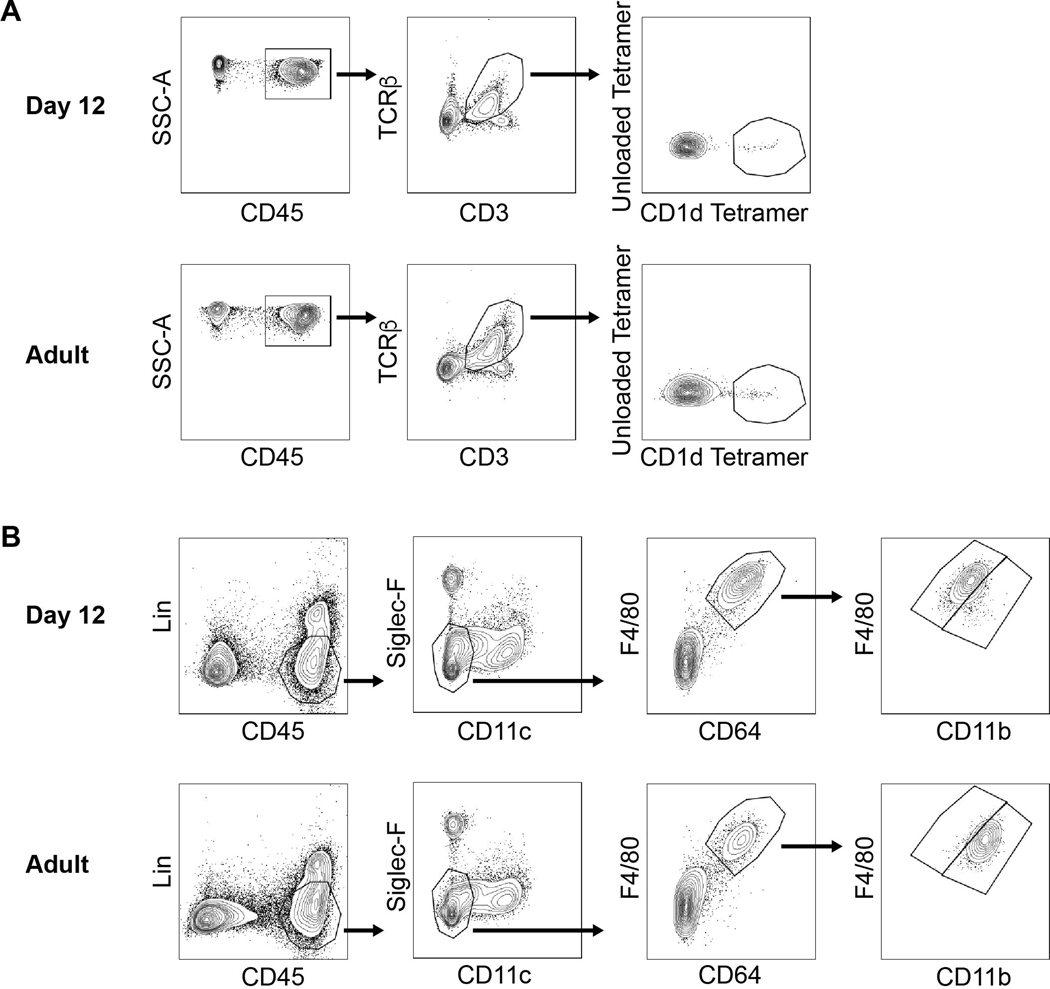
For flow cytometry analysis, isolated cells were washed, incubated with CD16/CD32 to block the Fc receptors, and then stained. iNKT cells were identified by flow cytometry as CD45, CD3ε, TCRβ, CD1d Tetramer, positive and unloaded Tetramer negative cells (Extended Data Fig. 10A). Macrophages were identified by flow cytometry as CD45, CD11b, CD11c, F4/80, CD64 positive and lineage (Lin: Ly6G, CD3ε, NK1.1, CD19, SiglecF) negative cells (Extended Data Fig. 10B). F4/80hiCD11blo and F4/80loCD11bhi macrophages were identified during early life based on F4/80 and CD11b expression in adult mice (>8 weeks old) (Extended Data Fig. 10B). Flow cytometry was performed with a BD FACSAria II cytometer located at Dana-Farber Cancer Institute (DFCI) or a Cytoflex cytometer and data were analyzed with FACSDiva and FlowJo software. Cell sorting was performed with a BD FACSAria II. The following antibodies were used: PE and APC-labeled PBS57-loaded (diluted 1:1000), PE and APC-labeled unloaded CD1d (diluted 1:1000) and PE-labeled MR1/5-OP-RU (diluted 1:200) Tetramers were provided by NIH Tetramer Core Facility, Atlanta, GA. CD16/32 (diluted 1:100), FITC-labeled CD3ε (diluted 1:100), CD45.1 (diluted 1:100), APC-labeled CD64 (diluted 1:300), CD3ε (diluted 1:100), CD45.1 (diluted 1:100), PE-labeled Ki67 (diluted 1:50), APC-Cy7-labeled Ly6G (diluted 1:300), CD3ε (diluted 1:300), NK1.1 (diluted 1:300), CD19, PE-Cy7 -labeled CD69 (diluted 1:100) antibodies were from Biolegend. APC-Cy7-labeled TCRβ (diluted 1:200), FITC-labeled CD11b (diluted 1:200), PE-labeled SiglecF (diluted 1:200), BV605-labeled CD11c (diluted 1:200), PECF594-labeled PLZF (diluted 1:50), BV786-labeled CD45 (diluted 1:400), CD45.2 (diluted 1:100) antibodies were from BD, PE-Cy7-labeled F4/80 (diluted 1:200) antibody was from Invitrogen. APC-labeled RORγt (diluted 1:50) antibody was from eBiosciences. SYTOX Blue stain (Thermofisher, diluted 1:1000) was used to identify and exclude dead cells from the analysis. For Ki67 intracellular staining, LIVE/DEAD Fixable Aqua stain (Thermofisher) was used to identify and exclude dead cells from the analysis and Cytofix/Cytoperm kit (BD) was used to fix and permeabilize the cells. For RORγt and PLZF intracellular staining, Foxp3 / Transcription Factor Staining Buffer Set Kit (eBiosciences) was used to fix and permeabilize the cells.
Protein analysis
7 weeks old mice were injected with alpha-galactosyl ceramide/KRN7000 (1μg by weight of mice). Colon was collected 16 hours after injection and homogenized in PBS with lysing matrix E tubes and FastPrep-24 homogenizer (MP Biomedicals). Homogenates were analyzed for the cytokine IFNγ by ELISA (BD).
Quantitative polymerase chain reaction assays
RNA samples were prepared using a RNeasy Mini Kit and complementary DNAs were synthesized using the Omniscript RT Kit (all Qiagen). Real-time RT-PCR was performed using a SYBR Green I Master Mix (Roche) and a CFX96 Real-Time System (Bio-Rad). Values were normalized to the expression of β-Actin for each sample. The following primers were used: Cxcl12: 5’-TGCATCAGTGACGGTAAACCA-3’ and 5’- TTCTTCAGCCGTGCAACAATC-3’; Lum: 5’-CTCTTGCCTTGGCATTAGTCG-3’ and 5’GGGGGCAGTTACATTCTGGTG-3’; Dcn: 5’-CCTTCTGGCACAAGTCTCTTGG-3’ and 5’-TCGAAGATGACACTGGCATCGG-3’; Mfap5: 5’- GTCTTGGCAATCAGCATCCC and 5’-CCAGATTAGGGTCGTCTGTGAAT-3’; Col6a2: 5’-AAGGCCCCATTGGATTCCC-3’ and 5’-CTCCCTTCCGACCATCCGAT-3’; Angptl1: 5’- GGATGTGCTGTCTAGGCAGAA-3’ and 5’-TTCATGTTCCGGCTTTCCTTT-3’; Cxcl16: 5’- CAGATACCGCAGGGTACTTTG-3’ and 5’-CTGCAACTGGAACCTGATAAAGA-3’; Cd1d1: 5’- GCAGCCAGTACGCTCTTTTC-3’ and 5’-ACAGCTTGTTTCTGGCAGGT-3’; Ifnγ: 5’-TCAGCAACAGCAAGGCGAAAAAGG-3’ and 5’-CCACCCCGAATCAGCAGCGA-3’; Il12p40: 5’-CCCCTGACTCTCGGGCAGTGAC-3’ and 5’-TCTGCTGCCGTGCTTCCAACG-3’. β-Actin: 5’-GATGCTCCCCGGGCTGTATT-3’ and 5’-GGGGTACTTCAGGGTCAGGA-3’.
Library Construction, Sequencing, and Differential Gene Expression Analyses
Between 300–3000 sorted cells were collected directly in RLT Plus Buffer (Qiagen) and RNA was isolated according to manufacturer’s instructions. Library construction was performed using the SMART-seq v4 Ultra Low Input RNA Kit (Takara) according to the manufacturer’s instruction. Single-end (50bp) sequencing was performed using Illumina NextSeq500 sequencing platform. All library construction and sequencing were conducted at the Molecular Biology Core Facilities (MBCF) at DFCI.
Reads were aligned to the mouse genome (GRCm38/mm10) with STAR (34) and expression counts were estimated with HTseq (35) using Partek Flow software v10. Differential transcript expression analysis was performed comparing invariant NKT cells purified from colon lamina propria at day 14 versus day 56 after birth in SPF mice or comparing macrophages purified from colon lamina propria of SPF and GF mice at day 9 or SPF mice at day 8 or 14 using the following parameters. Differential expression of transcripts was determined by using the R package DESeq2 version 1.26.0 (36). Differentially expressed transcripts in each cell population were selected with the threshold of log2|FoldChange| > 1 and Padj < 0.05 and then subjected to gene ontology pathway analysis using Metascape website (http://metascape.org/gp/index.html#/main/step1) (37).
Experimental oxazole colitis model
Mice were pre-sensitized by epicutaneous application of 3% w/v oxazolone (4-ethoxymethylene-2-phenyl-2-oxazolin-5-one, Sigma-Aldrich) in 100% ethanol (200 mL volume). Five days later, animals were re-challenged intra-rectally (through a 3.5F catheter) with 1% vehicle, oxazolone in 50% ethanol (5 mL/g of body weight). Weight and survival were evaluated every morning following the day of intra-rectal injection (Day 0). For colitis scoring, tissues were collected at 3 days after intra-rectal injection and embedded in paraffin, stained with hematoxylin and eosin, and examined by a pathologist (Dr. Jon Glickman) in a blinded fashion for evidence of colitis according to five established criteria: mononuclear inflammation, crypt hyperplasia, epithelial injury, neutrophilic inflammation, and hypervascularization grading on 4 point scale (0 = absent, 1 = mild, 2 = moderate, 3 = severe).
Listeria monocytogenes infection
L. monocytogenes infection was performed as previously described (38). Briefly, 7 weeks old C57BL/6 male mice were inoculated by gavage with 3 × 10⁹ CFUs of a mutated strain of L. monocytogenes with high binding affinity to mouse E-cadherin that is able to infect mice via the oral route (39). Organs and fecal pellets were collected 72h after infection and samples were analyzed for CFU enumeration and RNA quantification.
Statistical analysis
Results were statistically analyzed in GraphPad Prism. To compare the difference between two separate groups with a single variable, unpaired t test was used. Comparisons of mortality were made by analyzing Kaplan–Meier survival curves, and the log-rank test was used to assess for differences in survival. All P values were two-tailed, and statistical significance was accepted at P < 0.05.
Data availability
The datasets generated during and/or analyzed during the current study are available from the corresponding author on reasonable request. Raw fastq files and processed reads of the transcriptional analyses are accessible in the NIH GEO database: GSE167975.
Extended Data
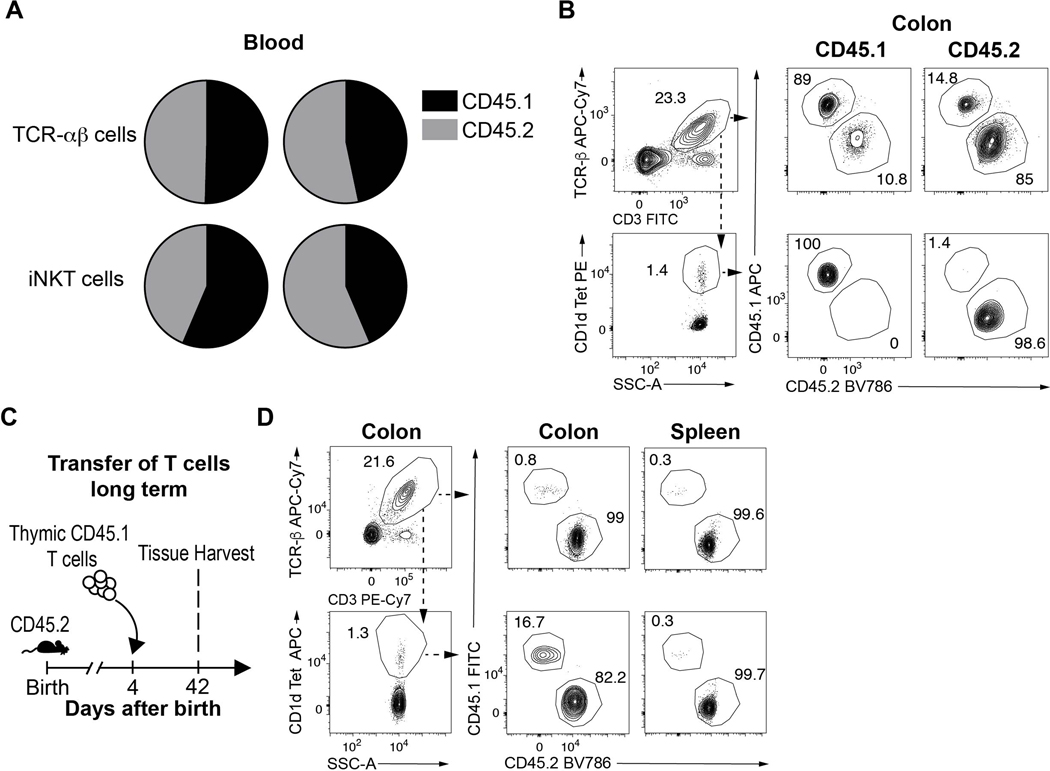
Extended Data Fig. 1.
A) Circulatory exchange of CD45.1 (black) or CD45.2 (grey) TCR-αβ+ T (CD45+ CD3ε+ TCRβ+) and iNKT (CD45+ CD3ε+ TCRβ+ CD1d Tetramer+) cells in the blood of surgically joined CD45.1 (left) and CD45.2 (right) congenic animals (n=2) determine by flow cytometry, 3 weeks after surgery. Circles are representative of average cell frequency. B) Representative plot of the circulatory exchange of CD45.1 or CD45.2 TCR-αβ+ T and iNKT cells in the colon of surgically joined congenic animals (n=2) 3 weeks after surgery. C) Schematic of adoptive transfer strategy. D) Adoptive transfer of CD45.1 adult thymic cells into a 4 day old CD45.2 host (n=1) followed by quantitative analyses of colonic CD45.1 or CD45.2 TCR-αβ+ T and iNKT cells by flow cytometry on day 42.
Extended Data Fig. 2.
Diphtheria toxin (DT) administered every two days from day 8 to 14 (DT8–14) after birth followed by quantitative analyses on day 15 (H15) of the absolute count of macrophages (CD45+ Lin− F4/80+ CD64+) in the skin (LysCre+/−: n=3, MMDTR n=4) (A) or spleen (LysCre+/−: n=5, MMDTR n=5) (B) and the absolute count of iNKT (CD45+ CD3ε+ TCRβ+ CD1d Tetramer+) and TCR-αβ+ T (CD45+ CD3ε+ TCRβ+) cells in the skin (LysCre+/−: n=8, MMDTR n=7) (C) of control littermates LysCre+/− or MMDTR animals. DT administered from day 8 to 10 (DT8–10) after birth followed by quantitative analyses on day 11 (H11) of the absolute count of iNKT and TCR-αβ+ T cells in the small intestine (D) and lung (E) of control littermates LysCre+/− (n=3) or MMDTR (n=12) animals. DT administered from day 8 to 10 (DT8–10) after birth followed by quantitative analyses on day 11 (H11) of the absolute count of splenic macrophages (F) of control littermates LysCre+/− (n=5) or MMDTR (n=3) animals. DT administered from day 12 to 14 (DT12–14) after birth followed by quantitative analyses on day 15 (H15) of the absolute count of splenic macrophages (G) of control littermates LysCre+/− (n=9) or MMDTR (n=10) animals. Absolute counts were determined by flow cytometry. Error bars indicate standard error of mean. Each dot is representative of an individual mouse. P values were calculated by unpaired two-sided Student’s t-test. *P < 0.05, **P < 0.01, ***P < 0.001, ****P < 0.0001.
Extended Data Fig. 3.
Diphtheria toxin (DT) administered every two days from day 8 to 14 after birth followed by quantitative analyses on day 15 of the absolute count of B cells (CD45+ CD19+, LysCre+/−: n=5, MMDTR n=5), neutrophils (CD45+ Ly6G+, LysCre+/−: n=5, MMDTR n=4), dendritic cells (DC) (CD45+, Lin−, CD11chi, MHCII+, CD64−, LysCre+/−: n=5, MMDTR n=4), eosinophils (CD45+, SiglecF+, LysCre+/−: n=5, MMDTR n=4) in the colon of control littermates LysCre+/− or MMDTR animals (A). DT administered every two days from day 8 to 14 after birth followed by quantitative analyses on day 42 of the absolute count of MAIT cells (CD45+ CD3ε+ TCRβ+ MR1/5-OP-RU Tetramer+) in the colon of control littermates LysCre+/− (n=5) or MMDTR (n=5) animals (B). Absolute count of macrophages (CD45+ Lin− F4/80+ CD64+) (C), iNKT (CD45+ CD3ε+ TCRβ+ CD1d Tetramer+) and TCR-αβ+ T (CD45+ CD3ε+ TCRβ+) cells (D) in the colon in the absence of DT treatment in control littermates LysCre+/− (n=4) and MMDTR (n=4) animals at 2 weeks old. Absolute counts were determined by flow cytometry. Error bars indicate standard error of mean. Each dot is representative of an individual mouse. P values were calculated by unpaired two-sided Student’s t-test. ns: not-significant.
Extended Data Fig. 4.
Diphtheria toxin (DT) administered from day 8 to 10 (DT8–10) after birth followed by quantitative analyses on day 11 (H11) of the absolute count of macrophages (CD45+ Lin− F4/80+ CD64+) in the colon (A) or spleen (B) and the absolute count of iNKT (CD45+ CD3ε+ TCRβ+ CD1d Tetramer+) and TCR-αβ+ T (CD45+ CD3ε+ TCRβ+) cells in the colon (C) and spleen (D) of control littermates Cx3cr1+/− (n=4) or Cx3cr1DTR (n=7) mice. E) Schematic of macrophage depletion model with AFS98 antibody. AFS98 or Isotype control antibody administered from day 4 to 10 (AFS4–10) after birth followed by quantitative analyses on day 11 (H11) of the absolute count of macrophages (n=6 per group) (F), and the absolute count of iNKT and TCR-αβ+ T cells (n=12 per group) (G) in the colon of injected animals. Absolute counts were determined by flow cytometry. Error bars indicate standard error of mean. Each dot is representative of an individual mouse. P values were calculated by unpaired two-sided Student’s t-test. *P < 0.05, **P < 0.01, ***P < 0.001, ****P < 0.0001, ns: not-significant.
Extended Data Fig. 5.
A) Schematic of macrophage depletion model. Diphtheria toxin (DT) administered every two days from day 56 to 62 (DT Adult) after birth followed by quantitative analyses at day 63 of the absolute count of macrophages (CD45+ Lin− F4/80+ CD64+) in the colon (B) and spleen (C), and the absolute count of iNKT (CD45+ CD3ε+ TCRβ+ CD1d Tetramer+) and TCR-αβ+ T (CD45+ CD3ε+ TCRβ+) cells in the colon (D) and spleen (E) of control littermates LysCre+/− (colon n=10, spleen n=5) or MMDTR (colon n=10, spleen n=5) animals. F) Schematic of macrophage depletion model. DT administered from day 15 to 21 (DT15–21) after birth followed by quantitative analyses on day 22 (H22) of the absolute count of macrophages (G) and the absolute count of iNKT and TCR-αβ+ T cells in the colon (H) of control littermates LysCre+/− ( n=8) or MMDTR (n=6) animals. Absolute counts were determined by flow cytometry. Error bars indicate standard error of mean. Each dot is representative of an individual mouse. P values were calculated by unpaired two-sided Student’s t-test. ***P < 0.001, ****P < 0.0001, ns: not-significant.
Extended Data Fig. 6.
A) Absolute count of iNKT (CD45+ CD3ε+ TCRβ+ CD1d Tetramer+) and TCR-αβ+ T (CD45+ CD3ε+ TCRβ+) cells in the colon of wild type (WT, n=5) littermates or Ccr2−/− (n=5) animals at day 56 after birth. B) Diphtheria Toxin (DT) administered at day 1 and (DT1–2) after birth followed by quantitative analyses on day 10 (H10) of the absolute count of F4/80hi/CD11blo and F4/80lo/CD11bhi macrophages (CD45+ Lin− F4/80+ CD64+) in the colon of control littermates LysCre+/− (n=8) or MMDTR (n=4) animals. C) Absolute count of iNKT and TCR-αβ+ T cells in the colon of germ-free (GF, n=12) and GF conventionalized with specific pathogen free (SPF) microbiota prior to birth (GFCV, n=10) animals at 35 days of life. D) Representative plot of F4/80hi/CD11blo and F4/80lo/CD11bhi macrophages in the colon of SPF, GF or GFCV animals at 15 days old. E) DT administered from day 5 to 7 after birth followed by the analysis of Cxcl16, Cd1d, Cxcl12, Lum, Dcn, Mfap5, Angptl1 and Col6a2 transcript expression by quantitative polymerase chain reaction in the colon of control littermates LysCre+/− (n=3) or MMDTR (n=4) animals. Numbers in the representative plots indicate cell frequency. Error bars indicate standard error of mean. Each dot is representative of an individual mouse. P values were calculated by unpaired two-sided Student’s t-test. *P < 0.05, **P < 0.01, ****P < 0.0001. ns: not-significant.
Extended Data Fig. 7.
A) Percentage of Ki67 positive TCR-αβ+ T (CD45+ CD3ε+ TCRβ+) and iNKT (CD45+ CD3ε+ TCRβ+ CD1d Tetramer+) cells on day 8 (H8) in the colon of control littermates LysCre+/− (n=8) or MMDTR (n=8) animals treated with diphtheria toxin (DT) from day 5 to 7 (DT5–7) after birth. B) DT administered from day 56 to 62 (DT Adult) after birth followed by analyses at day 63 of the Ki67 mean fluorescent intensity (MFI) of TCR-αβ+ T and iNKT cells in the spleen of control littermates LysCre+/− (n=8) or MMDTR (n=8) animals. C) Percentage of Ki67 positive TCR-αβ+ T and iNKT cells on day 63 in the colon of control littermates LysCre+/− (n=8) or MMDTR (n=8) animals treated DT from day 56 to 62 after birth. Representative plot of TCR-αβ+ T and iNKT cells from 11 day old CD45.2 control littermates LysCre+/− or MMDTR animals adoptively transferred with CD45.1 adult thymic cells at 4 days old and treated with DT from day 8 to 10 (DT8–10) after birth in the colon (D) or spleen (E). F) Schematic of adoptive transfer and macrophage depletion model. G) Adoptive transfer of CD45.1 adult thymic cells into 3 day old CD45.2 control littermates LysCre+/− (n=3) or MMDTR (n=5) animals followed by DT administration from day 3 to 7 (DT3–7) after birth and quantitative analyses on day 8 (H8) of the Ki67 MFI (left) and percentage (right) of CD45.1 expressing TCR-αβ+ T and iNKT cells in the colon. H) Representative plot (left) and cell percentage (right) of iNKT cell subsets (NKT1, NKT2, NKT 17) from 8 day old CD45.2 control littermates LysCre+/− (n=3) or MMDTR (n=5) animals adoptively transferred with CD45.1 adult thymic cells at 3 days old and treated with DT from day 3 to 7 (DT3–7) after birth in the colon. SSC-A, side scatter. Numbers in the representative plots indicate cell frequency and were determined by flow cytometry. Error bars indicate standard error of mean. Each dot is representative of an individual mouse. P values were calculated by unpaired two-sided Student’s t-test. *P < 0.05, **P < 0.01, ****P < 0.0001, ns: not-significant.
Extended Data Fig. 8.
A) Schematic of macrophage depletion model ex vivo. Adult spleen from control littermates LysCre+/− or MMDTR animals, digested and cultured for 48 hours with Diphtheria toxin (DT) followed by quantitative analyses of the absolute count of macrophages (CD45+ Lin− F4/80+ CD64+, LysCre+/−: n=4, MMDTR n=5) (B), and the absolute count of iNKT (CD45+ CD3ε+ TCRβ+ CD1d Tetramer+) and TCR-αβ+ T (CD45+ CD3ε+ TCRβ+) (LysCre+/−: n=5, MMDTR n=5) cells (C). D) Representative plot of macrophages on day 49 in the colon of control littermates LysCre+/− (n=4) or MMDTR (n=4) animals treated with DT from day 8 to 14 after birth. DT administered from day 8 to 14 (DT8–14) after birth followed by quantitative analyses on day 49 (H49) of the absolute count of macrophages (E), and the absolute count of iNKT and TCR-αβ+ T cells in the skin (F) of control littermates LysCre+/− or MMDTR animals. Absolute counts were determined by flow cytometry. Error bars indicate standard error of mean. Each dot is representative of an individual mouse. P values were calculated by unpaired two-sided Student’s t-test. *P < 0.05, ***P < 0.001, ns: not-significant. Representative plot of TCR-αβ+ T and iNKT cells on day 49 in the colon of control littermates LysCre+/− or MMDTR animals treated with DT from day 8 to 14 after birth in the colon (G) and spleen (H). Unl, Unloaded. Tet, Tetramer. Numbers in the representative plots indicate cell frequency.
Extended Data Fig. 9.
Representative plot (left) and cell percentage (right) of iNKT cell subsets (NKT1, NKT2, NKT 17) from 42 day old control littermates LysCre+/− (n=6) or MMDTR (n=4) animals treated with DT from day 8 to 14 (DT8–14) after birth in the colon (A) or spleen (B). Mean fluorescent intensity (MFI) of Ki67, percentage of Ki67+ and CD69+ TCR-αβ+ T (CD45+ CD3ε+ TCRβ+) and iNKT (CD45+ CD3ε+ TCRβ+ CD1d Tetramer+) cells on day 42 (H42) in the colon (C,D,G) or spleen (E,F,H) of control littermates LysCre+/− (n=6) or MMDTR (n=4) animals treated with diphtheria toxin (DT) from day 8 to 14 after birth. I) Schematic of macrophage depletion model and αGalactosylceramide (αGal) treatment. DT administered from day 8 to 14 after birth followed by αGal regimen on day 49 and quantitative analyses 16 hours after, of the IFNγ protein level in the colon of control littermates LysCre+/− (n=10) or MMDTR (n=8) animals by enzyme-linked immunosorbent assay (ELISA) (J). DT administered from day 8 to 14 after birth followed by Listeria monocytogenes administration by oral gavage on day 49 and analyses of Ifnγ (K) or Il12p40 (L) mRNA expression in the colon of control littermates LysCre+/− (n=6) or MMDTR (n=6) animals 3 days after infection by quantitative polymerase chain reaction analysis. Numbers in the representative plots indicate cell frequency and were determined by flow cytometry. Error bars indicate standard error of mean. Each dot is representative of an individual mouse. P values were calculated by unpaired two-sided Student’s t-test. *P < 0.05, **P < 0.01, ns: not-significant. Numbers in the representative plots indicate cell frequency.
Extended Data Fig. 10.
A) Gating strategy for iNKT (right panel) and TCR-αβ+ T (middle panel) cells identification by flow cytometry in the colon at day 12 (top) and day 49 (Adult) (bottom) after birth. B) Gating strategy for F4/80hi/CD11blo and F4/80lo/CD11bhi macrophages (right panel) identification by flow cytometry in the colon at day 12 (top) and day 49 (Adult) (bottom) after birth.
Supplementary Material
Supplementary Table. 1: Differentially expressed transcripts comparing colonic macrophages from 8 day old and 14 day old SPF animals by RNAseq. DESeq analysis (Padj<0.05). P values calculated by the Wald test are corrected for multiple testing using the Benjamini and Hochberg method.
Supplementary Table. 2: Gene ontology term analysis of the enriched transcripts in colonic macrophages at 8 day old compared to 14 day old.
Supplementary Table. 3: Differentially expressed transcripts comparing colonic macrophages from 9 day old SPF and GF animals by RNAseq. DESeq analysis (Padj<0.05). P values calculated by the Wald test are corrected for multiple testing using the Benjamini and Hochberg method.
Supplementary Table. 4: Differentially expressed transcripts comparing colonic iNKT cells from 14 day old and 56 day old adult animals by RNAseq. DESeq analysis (Padj<0.05). P values calculated by the Wald test are corrected for multiple testing using the Benjamini and Hochberg method.
Supplementary Table. 5: Gene ontology term analysis of the enriched transcripts in colonic iNKT cells at 14 day old compared to 56 day old.
Acknowledgements:
RSB is supported by NIH grants DK044319, DK053056, DK051362, DK088199, and 5P01AI073748 and the Harvard Digestive Diseases Center (P30DK034854). TG is supported by the Crohn’s and Colitis Foundation of America Research Fellow Award (418509). We thank Blumberg laboratory members for assistance in manuscript preparation. We thank Shankar S. Iyer for organizing the RNA sequencing at the core facility and helping with the oxazolone colitis. We thank Heidi Gerke for her assistance in performing the Plvap−/− experiments and Rebecca Baron for assistance in the isolation of lung cells.
Footnotes
Competing interests: no competing interests exist.
References
- 1.Gensollen T, Iyer SS, Kasper DL, Blumberg RS, How colonization by microbiota in early life shapes the immune system. Science (80-. ). 352 (2016). [DOI] [PMC free article] [PubMed] [Google Scholar]
- 2.Schuijs MJ et al. , Farm dust and endotoxin protect against allergy through A20 induction in lung epithelial cells. Science (80-. ). 349, 1106–1110 (2015). [DOI] [PubMed] [Google Scholar]
- 3.Shaw SY, Blanchard JF, Bernstein CN, Association Between the Use of Antibiotics in the First Year of Life and Pediatric Inflammatory Bowel Disease. Am. J. Gastroenterol 105, 2687–2692 (2010). [DOI] [PubMed] [Google Scholar]
- 4.Cahenzli J, Köller Y, Wyss M, Geuking MB, McCoy KD, Intestinal microbial diversity during early-life colonization shapes long-term IgE levels. Cell Host Microbe. 14, 559–70 (2013). [DOI] [PMC free article] [PubMed] [Google Scholar]
- 5.Elahi S et al. , Immunosuppressive CD71+ erythroid cells compromise neonatal host defence against infection. Nature. 504, 158–62 (2013). [DOI] [PMC free article] [PubMed] [Google Scholar]
- 6.Gollwitzer ES et al. , Lung microbiota promotes tolerance to allergens in neonates via PD-L1. Nat. Med 20, 642–7 (2014). [DOI] [PubMed] [Google Scholar]
- 7.Olszak T et al. , Microbial Exposure During Early Life Has Persistent Effects on Natural Killer T Cell Function. Science (80-. ). 336, 489–493 (2012). [DOI] [PMC free article] [PubMed] [Google Scholar]
- 8.An D et al. , Sphingolipids from a symbiotic microbe regulate homeostasis of host intestinal natural killer T cells. Cell. 156, 123–133 (2014). [DOI] [PMC free article] [PubMed] [Google Scholar]
- 9.Nieuwenhuis EES et al. , Cd1d-dependent regulation of bacterial colonization in the intestine of mice. J. Clin. Invest 119, 1241–1250 (2009). [DOI] [PMC free article] [PubMed] [Google Scholar]
- 10.Heller F, Fuss IJ, Nieuwenhuis EE, Blumberg RS, Strober W, Oxazolone colitis, a Th2 colitis model resembling ulcerative colitis, is mediated by IL-13-producing NK-T cells. Immunity. 17, 629–638 (2002). [DOI] [PubMed] [Google Scholar]
- 11.Ginhoux F, Guilliams M, Tissue-Resident Macrophage Ontogeny and Homeostasis. Immunity. 44, 439–449 (2016). [DOI] [PubMed] [Google Scholar]
- 12.Bain CC et al. , Constant replenishment from circulating monocytes maintains the macrophage pool in the intestine of adult mice. Nat. Immunol 15 (2014), doi: 10.1038/ni.2967. [DOI] [PMC free article] [PubMed] [Google Scholar]
- 13.Tamoutounour S et al. , Origins and functional specialization of macrophages and of conventional and monocyte-derived dendritic cells in mouse skin. Immunity. 39, 925–38 (2013). [DOI] [PubMed] [Google Scholar]
- 14.Thomas SY et al. , PLZF induces an intravascular surveillance program mediated by long-lived LFA-1-ICAM-1 interactions. J. Exp. Med 208, 1179–1188 (2011). [DOI] [PMC free article] [PubMed] [Google Scholar]
- 15.Lynch L et al. , Regulatory i NKT cells lack expression of the transcription factor PLZF and control the homeostasis of T reg cells and macrophages in adipose tissue, 1–12 (2015). [DOI] [PMC free article] [PubMed] [Google Scholar]
- 16.Pellicci DG et al. , A natural killer T (NKT) cell developmental pathway iInvolving a thymus-dependent NK1.1(−)CD4(+) CD1d-dependent precursor stage. J. Exp. Med 195, 835–44 (2002). [DOI] [PMC free article] [PubMed] [Google Scholar]
- 17.a Schreiber H et al. , Intestinal monocytes and macrophages are required for T cell polarization in response to Citrobacter rodentium. J. Exp. Med 210, 2025–39 (2013). [DOI] [PMC free article] [PubMed] [Google Scholar]
- 18.Sudo T et al. , Functional hierarchy of c-kit and c-fms in intramarrow production of CFU-M. Oncogene. 11, 2469–76 (1995). [PubMed] [Google Scholar]
- 19.Squarzoni P et al. , Microglia modulate wiring of the embryonic forebrain. Cell Rep. 8, 1271–9 (2014). [DOI] [PubMed] [Google Scholar]
- 20.V Serbina N, Pamer EG, Monocyte emigration from bone marrow during bacterial infection requires signals mediated by chemokine receptor CCR2. Nat. Immunol 7, 311–317 (2006). [DOI] [PubMed] [Google Scholar]
- 21.Rantakari P et al. , Fetal liver endothelium regulates the seeding of tissue-resident macrophages. Nature. 538, 392–396 (2016). [DOI] [PubMed] [Google Scholar]
- 22.Johnston B, Kim CH, Soler D, Emoto M, Butcher EC, Differential chemokine responses and homing patterns of murine TCR alpha beta NKT cell subsets. J. Immunol 171, 2960–2969 (2003). [DOI] [PubMed] [Google Scholar]
- 23.Chakravarti S et al. , Lumican regulates collagen fibril assembly: skin fragility and corneal opacity in the absence of lumican. J. Cell Biol 141, 1277–86 (1998). [DOI] [PMC free article] [PubMed] [Google Scholar]
- 24.Bleul CC, Fuhlbrigge RC, Casasnovas JM, Aiuti A, Springer TA, A highly efficacious lymphocyte chemoattractant, stromal cell-derived factor 1 (SDF-1). J. Exp. Med 184, 1101–9 (1996). [DOI] [PMC free article] [PubMed] [Google Scholar]
- 25.Haimon Z et al. , Re-evaluating microglia expression profiles using RiboTag and cell isolation strategies. Nat. Immunol 19, 636–644 (2018). [DOI] [PMC free article] [PubMed] [Google Scholar]
- 26.Boisset J-C et al. , Mapping the physical network of cellular interactions. Nat. Methods 15, 547–553 (2018). [DOI] [PubMed] [Google Scholar]
- 27.Olszak T et al. , Protective mucosal immunity mediated by epithelial CD1d and IL-10. Nature. 509, 497–502 (2014). [DOI] [PMC free article] [PubMed] [Google Scholar]
- 28.Constantinides MG, Bendelac A, Transcriptional regulation of the NKT cell lineage. Curr. Opin. Immunol 25, 161–7 (2013). [DOI] [PMC free article] [PubMed] [Google Scholar]
- 29.Iyer SS et al. , Dietary and Microbial Oxazoles Induce Intestinal Inflammation by Modulating Aryl Hydrocarbon Receptor Responses In Brief. Cell. 173, 1123–1128.e11 (2018). [DOI] [PMC free article] [PubMed] [Google Scholar]
- 30.Boirivant M, Fuss IJ, Chu A, Strober W, Oxazolone colitis: A murine model of T helper cell type 2 colitis treatable with antibodies to interleukin 4. J. Exp. Med 188, 1929–39 (1998). [DOI] [PMC free article] [PubMed] [Google Scholar]
- 31.Arrunategui-Correa V, Sil Kim H, The role of CD1d in the immune response against Listeria infection. Cell. Immunol 227, 109–120 (2004). [DOI] [PubMed] [Google Scholar]
Methods References
- 32.Kamran P et al. , Parabiosis in Mice: A Detailed Protocol. J. Vis. Exp, e50556 (2013). [DOI] [PMC free article] [PubMed] [Google Scholar]
- 33.Tamoutounour S et al. , CD64 distinguishes macrophages from dendritic cells in the gut and reveals the Th1-inducing role of mesenteric lymph node macrophages during colitis. Eur. J. Immunol 42, 3150–3166 (2012). [DOI] [PubMed] [Google Scholar]
- 34.A D et al. , STAR: ultrafast universal RNA-seq aligner. Bioinformatics. 29 (2013), doi: 10.1093/BIOINFORMATICS/BTS635. [DOI] [PMC free article] [PubMed] [Google Scholar]
- 35.Anders S, Pyl PT, Huber W, HTSeq--a Python framework to work with high-throughput sequencing data. Bioinformatics. 31, 166–169 (2015). [DOI] [PMC free article] [PubMed] [Google Scholar]
- 36.MI L, H. W AS, Moderated estimation of fold change and dispersion for RNA-seq data with DESeq2. Genome Biol. 15 (2014), doi: 10.1186/S13059-014-0550-8. [DOI] [PMC free article] [PubMed] [Google Scholar]
- 37.Y Z et al. , Metascape provides a biologist-oriented resource for the analysis of systems-level datasets. Nat. Commun 10 (2019), doi: 10.1038/S41467-019-09234-6. [DOI] [PMC free article] [PubMed] [Google Scholar]
- 38.Zhang T et al. , Deciphering the landscape of host barriers to Listeria monocytogenes infection. Proc. Natl. Acad. Sci. U. S. A 114, 6334–6339 (2017). [DOI] [PMC free article] [PubMed] [Google Scholar]
- 39.T W et al. , Extending the host range of Listeria monocytogenes by rational protein design. Cell. 129 (2007), doi: 10.1016/J.CELL.2007.03.049. [DOI] [PubMed] [Google Scholar]
Associated Data
This section collects any data citations, data availability statements, or supplementary materials included in this article.
Supplementary Materials
Supplementary Table. 1: Differentially expressed transcripts comparing colonic macrophages from 8 day old and 14 day old SPF animals by RNAseq. DESeq analysis (Padj<0.05). P values calculated by the Wald test are corrected for multiple testing using the Benjamini and Hochberg method.
Supplementary Table. 2: Gene ontology term analysis of the enriched transcripts in colonic macrophages at 8 day old compared to 14 day old.
Supplementary Table. 3: Differentially expressed transcripts comparing colonic macrophages from 9 day old SPF and GF animals by RNAseq. DESeq analysis (Padj<0.05). P values calculated by the Wald test are corrected for multiple testing using the Benjamini and Hochberg method.
Supplementary Table. 4: Differentially expressed transcripts comparing colonic iNKT cells from 14 day old and 56 day old adult animals by RNAseq. DESeq analysis (Padj<0.05). P values calculated by the Wald test are corrected for multiple testing using the Benjamini and Hochberg method.
Supplementary Table. 5: Gene ontology term analysis of the enriched transcripts in colonic iNKT cells at 14 day old compared to 56 day old.
Data Availability Statement
The datasets generated during and/or analyzed during the current study are available from the corresponding author on reasonable request. Raw fastq files and processed reads of the transcriptional analyses are accessible in the NIH GEO database: GSE167975.


