

Abstract
We investigated genome folding across the eukaryotic tree of life. We find four general manifestations of genome organization at chromosome-scale that each emerge and disappear repeatedly over the course of evolution. The type of genome folding an organism possesses correlates with the absence of condensin II subunits. Condensin II depletion indeed converts the folding of the human genome to a state that resembles genome organization in organisms such as fungi or insects. In this state centromeres cluster together at nucleoli, and heterochromatin domains merge. We propose a physical model in which lengthwise compaction of chromosomes by condensin II during mitosis determines chromosome-scale genome organization, which is retained during the subsequent interphase. This mechanism likely is conserved since the last common ancestor of all eukaryotes.
One Sentence Summary:
Comparison of species from across the tree of life reveals that chromosome-scale genome organization during interphase is established by mitotic condensin II.
The mechanisms controlling nuclear architecture at the scale of whole chromosomes remain poorly understood. To learn about general principles of genome folding, we performed in situ Hi-C (1) on 24 species, representing all subphyla of chordates, all 7 extant vertebrate classes, and 7 out of 9 major animal phyla, as well as plants and fungi (Table S1, Figure S1 and S2). For 14 species, there was no existing chromosome-length reference genome assembly. We then either upgraded an existing, highly fragmented, genome assembly, or assembled a reference genome entirely from scratch (Materials & Methods, Table S2). Together, these species offer a comprehensive overview of nuclear organization since the last common ancestor of all eukaryotes.
The resulting maps reveal four striking features of nuclear architecture at whole-chromosome scale (Figure 1, Figure S1). First, some species, such as the red piranha, exhibit enhanced contact frequency between loci on the same chromosome. This is consistent with existence of classical chromosome territories, in which a chromosome occupies a discrete volume in the nucleus, excluding other chromosomes. We will refer to this Hi-C-based feature as “chromosome-territory-like”, to indicate that it is similar, but not necessarily identical to chromosome territories as traditionally observed by cytogenetics (2). Second, some species, such as the mosquitoes, exhibit prominent contacts between centromeres, indicating that centromeres tend to co-localize in these species. Third, some species, such as the ground peanut, exhibit prominent contacts between telomeres. Finally, in some species, such as bread wheat, an X-shape appears on the chromosomal map. These observations are consistent with an architecture in which the two arms of each chromosome fold back onto each other (Figure 1, Figure S1, S2, S3 and S4). The latter three features are reminiscent of the Rabl chromosome configuration (3), in which centromeres cluster and chromosome arms are arranged in parallel. We will call these features “Rabl-like”.
Figure 1. A comprehensive overview of genome organization across evolution.

Aggregate chromosome analysis (ACA) on Hi-C maps of 24 species. ACA involves the scaling of chromosome arms to a uniform length and aggregating the signal of all intra- and inter-chromosomal contacts. The depicted species represent three kingdoms: animals (yellow), fungi (blue) and plants (green), whose evolutionary relationship is presented in the phylogenetic tree. Each corner shows an example ACA map and a schematic drawing of one of the four chromosome-scale features. Presence of the condensin II subunits in each species is indicated by solid black circles. Left to right: SMC2/SMC4/CAP-H2/CAP-G2/CAP-D3.
To identify chromosome-scale folding features in an unbiased fashion, we developed a method dubbed “Aggregate chromosome analysis” (ACA), and assigned scores for each chromosome-scale feature (Materials & Methods, Figure S3 and S6, Table S3). All non-holocentric species exhibit at least one chromosome-scale feature. Notably, the genome folding features can be divided into two types, based on how likely the features are to co-occur (Figure S7, Table S4). Type-I includes the three Rabl-like features: centromere clustering, telomere clustering, and a telomere-to-centromere axis. Type-II includes only the presence of chromosome territories. Consequently, species can also be subdivided into two groups, based on which class of features is more strongly exhibited (Table S3).
Homologs tend to be separated or paired, depending on the species. Interestingly, we found that Type-II species typically exhibit homolog separation, whereas homolog separation is less frequent among Type-I species. We exploited this separation, when present, to assign variants to individual homologs, producing chromosome-length haploblocks for multiple species (Figure S8 and S9, Table S5). Taken together, the data are consistent with a model in which individual chromosomal folding features appeared and disappeared over billions of years, as lineages switch between Rabl-like organization and territorial organization.
What then regulates the transition between Rabl-like and territorial architecture? We noted that mosquitoes display Type-I features (Figure 1) and interestingly lack a subunit of the condensin II complex (4). This complex is conserved throughout most eukaryotes and promotes mitotic chromosome compaction (5). We thus wondered whether condensin II also controls interphase genome organization.
We therefore searched for condensin II subunits in the genomes of all 24 species and found that 8 species lacked condensin II subunit(s) (Table S6). Strikingly, all of these 8 species (the fruit fly, moss animal, oriental liver fluke, common mushroom, tardigrade and baker’s yeast and the two mosquitos) exhibited Rabl-like features (Table S3). Given that these organisms lie so far apart on the evolutionary tree, the loss of condensin II subunits appears to have co-evolved multiple times with Type-I features. This is consistent with a model in which condensin II strengthens of chromosome territories, and counteracts Rabl-like features.
Notably, of the 8 species, 5 missed all condensin II subunits, whereas the other three species only missed CAP-G2. Previous work shows that condensin complexes lacking the G-subunit still localize to DNA, but yield elongated chromosomes (6). We therefore speculate that condensin complexes in these species may be, at least partially, impaired in their ability to shorten chromosomes.
Humans are a Type-II species, insofar that human cells exhibit strong chromosomal territories, and no Rabl-like features (Figure 2A). Humans moreover harbor all condensin II subunits. Would disruption of condensin II in human cells then interfere with chromosome territories and enhance the strength of Type-I features? To test this, we performed in situ Hi-C on Hap1 cells in which the condensin II subunit CAP-H2 was knocked out (Figure 2A, Figure S14, S15 and Table S7).
Figure 2. Condensin II prevents centromeric clustering and keeps apart heterochromatin domains.

(a) Hi-C matrices of the depicted genotypes in Hap1 cells. (b) Immunofluorescence of centromeres (CREST) and DNA (DAPI), as quantified in (c). (d) Difference in DamID score relative to distance to centromere. Zoom-in includes 95% confidence interval of the mean in grey. (e) Immunofluorescence of centromeres (CREST), nucleoli (Nucleolin) and DNA (DAPI) (f) Quantification of the fraction of centromere intensity within 0.4 μm of nucleoli as shown in (e). (g) Immunofluorescence of centromeres (CenpA), heterochromatin (H3K9me3) and DNA (DAPI), as quantified in (h).
Strikingly, ΔCAP-H2 cells exhibited weaker chromosome territories, and much stronger contacts between centromeres in trans (Figure 2A, Figure S15B and C, Table S8). Immunofluorescence microscopy revealed that in ΔCAP-H2 cells the centromeres are indeed clustered together. Disruption of condensin II thus radically transforms the folding of the human genome into a configuration that resembles Type-I organisms, such as mosquitoes and fungi (Figure 2B and C, Figure S16).
These findings are in line with earlier observations across various species. In Arabidopsis, condensin II regulates spacing of rDNAs and centromeric regions (7, 8), while in mouse cells condensin II regulates nuclear distribution of chromocenters (9). Fruit flies lack a condensin II subunit and exhibit centromeric clustering naturally (Figure 1). Interestingly, additional depletion of the remaining condensin II subunits affects spatial distribution of pericentromeric heterochromatin, and leads to intermixing of chromosome territories, hereby further strengthening the Rabl-like features already present (10, 11).
To address how nuclear architecture of human cells is further affected by condensin II loss, we performed a set of experiments to investigate large-scale genome architecture. First, to discern which DNA segments are associated with the nuclear lamina (LADs), we performed DamID of LaminB1 (12) (Figure S17A). LADs localizing up to 25 Mb from the centromeres appeared to move away from the lamina (Figure 2D, Figure S17B and C). Centromere repositioning in absence of condensin II thus also moderately affects the lamina association of the regions flanking the centromeres.
In fruit flies, centromeres naturally cluster and localize to the nucleolus (13). In ΔCAP-H2 human cells, we observed that centromeres also cluster mostly in or around the nucleolus (Figure 2E and F). However, disrupting the nucleolar structure did not affect centromeric clustering (Figure S18A and B). The close proximity of centromere clusters to the nucleolus can instead be explained by the fact that rDNA sequences lie on the short arm of the acrocentric chromosomes in human cells. rDNAs are the genomic component of the nucleolus, so when centromeres cluster they are likely to do so near the nucleolus (Figure S18C).
Regions surrounding centromeres are enriched for heterochromatin and were found to cluster upon condensin II depletion in mice and fruit flies (9, 10). We therefore tested whether nuclear distribution of heterochromatin was also changed in ΔCAP-H2 cells. Condensin II deficiency led to severe clustering of H3K9me3-containing heterochromatin (Figure 2G and H). Condensin II therefore plays a conserved role in the spatial organization of this repressive epigenetic mark.
Condensin II deficiency did not affect smaller-scale 3D genome organization at the level of chromatin loops (Figure S19A and B). Also compartmentalization was only mildly affected, specifically in regions surrounding the centromeres (Figure S19C and D). This demonstrates that drastic large-scale reorganization need not bring about major changes in smaller-scale structures.
RNA-sequencing revealed that condensin II deficiency affected the expression of only a small fraction of genes (Figure 3A and B). The genes that were differentially expressed were enriched within LADs (Figure 3C) and near LAD borders (Figure S20B and C), and specifically those genes that were downregulated moved towards the lamina (Figure 3D). We propose that genes that are near or within LADs in wild type cells can occupy the space that is vacated by the centromeres moving to the inner nucleus upon condensin II loss. The increased lamina association of these genes could in turn lead to their transcriptional repression, although the gain in lamina interactions could also be the consequence of the reduced expression of these genes (14, 15) (Figure 3E).
Figure 3. Massive 3D genome changes hardly affect gene expression.

(a) Gene expression of wild type relative to ΔCAP-H2. Unaffected genes depicted in grey, upregulated genes in blue and downregulated in red. (b) Number of genes in each category. (c) Percentage of active genes overlapping with LADs. (d) Intersection of differences in gene expression with differences in lamina association, depicting active genes within LADs. (e) Schematic model of centromeres (red) moving to the inner nucleus, and silenced genes that now localize to the lamina.
When does condensin II then act to alter interphase chromatin architecture? Condensin II is nuclear throughout the cell cycle (16, 17) and may thus exert its role in unclustering centromeres during interphase. It is also possible that the action of condensin II during mitosis determines the 3D genome organization of the subsequent interphase. To distinguish between these two scenarios, we acutely depleted condensin II in HCT116 cells (18) at the G1/S transition and either halted the cells prior to mitotic entry, or allowed the cells to progress through mitosis (Figure 4A and B, Figure S21A). When condensin II-depleted cells were halted prior to mitosis, centromeres did not cluster, consistent with a recent preprint showing that condensin II depletion in post-mitotic cells does not change the 3D genome (19). By stark contrast, progression through mitosis led to clear centromeric clustering in the subsequent G1 phase. This demonstrates that condensin II must act in mitosis, or directly thereafter, to establish 3D genome organization for the next interphase (Figure S21B).
Figure 4. Centromeric clustering is counteracted by lengthwise compaction and requires mitosis-to-interphase transition.
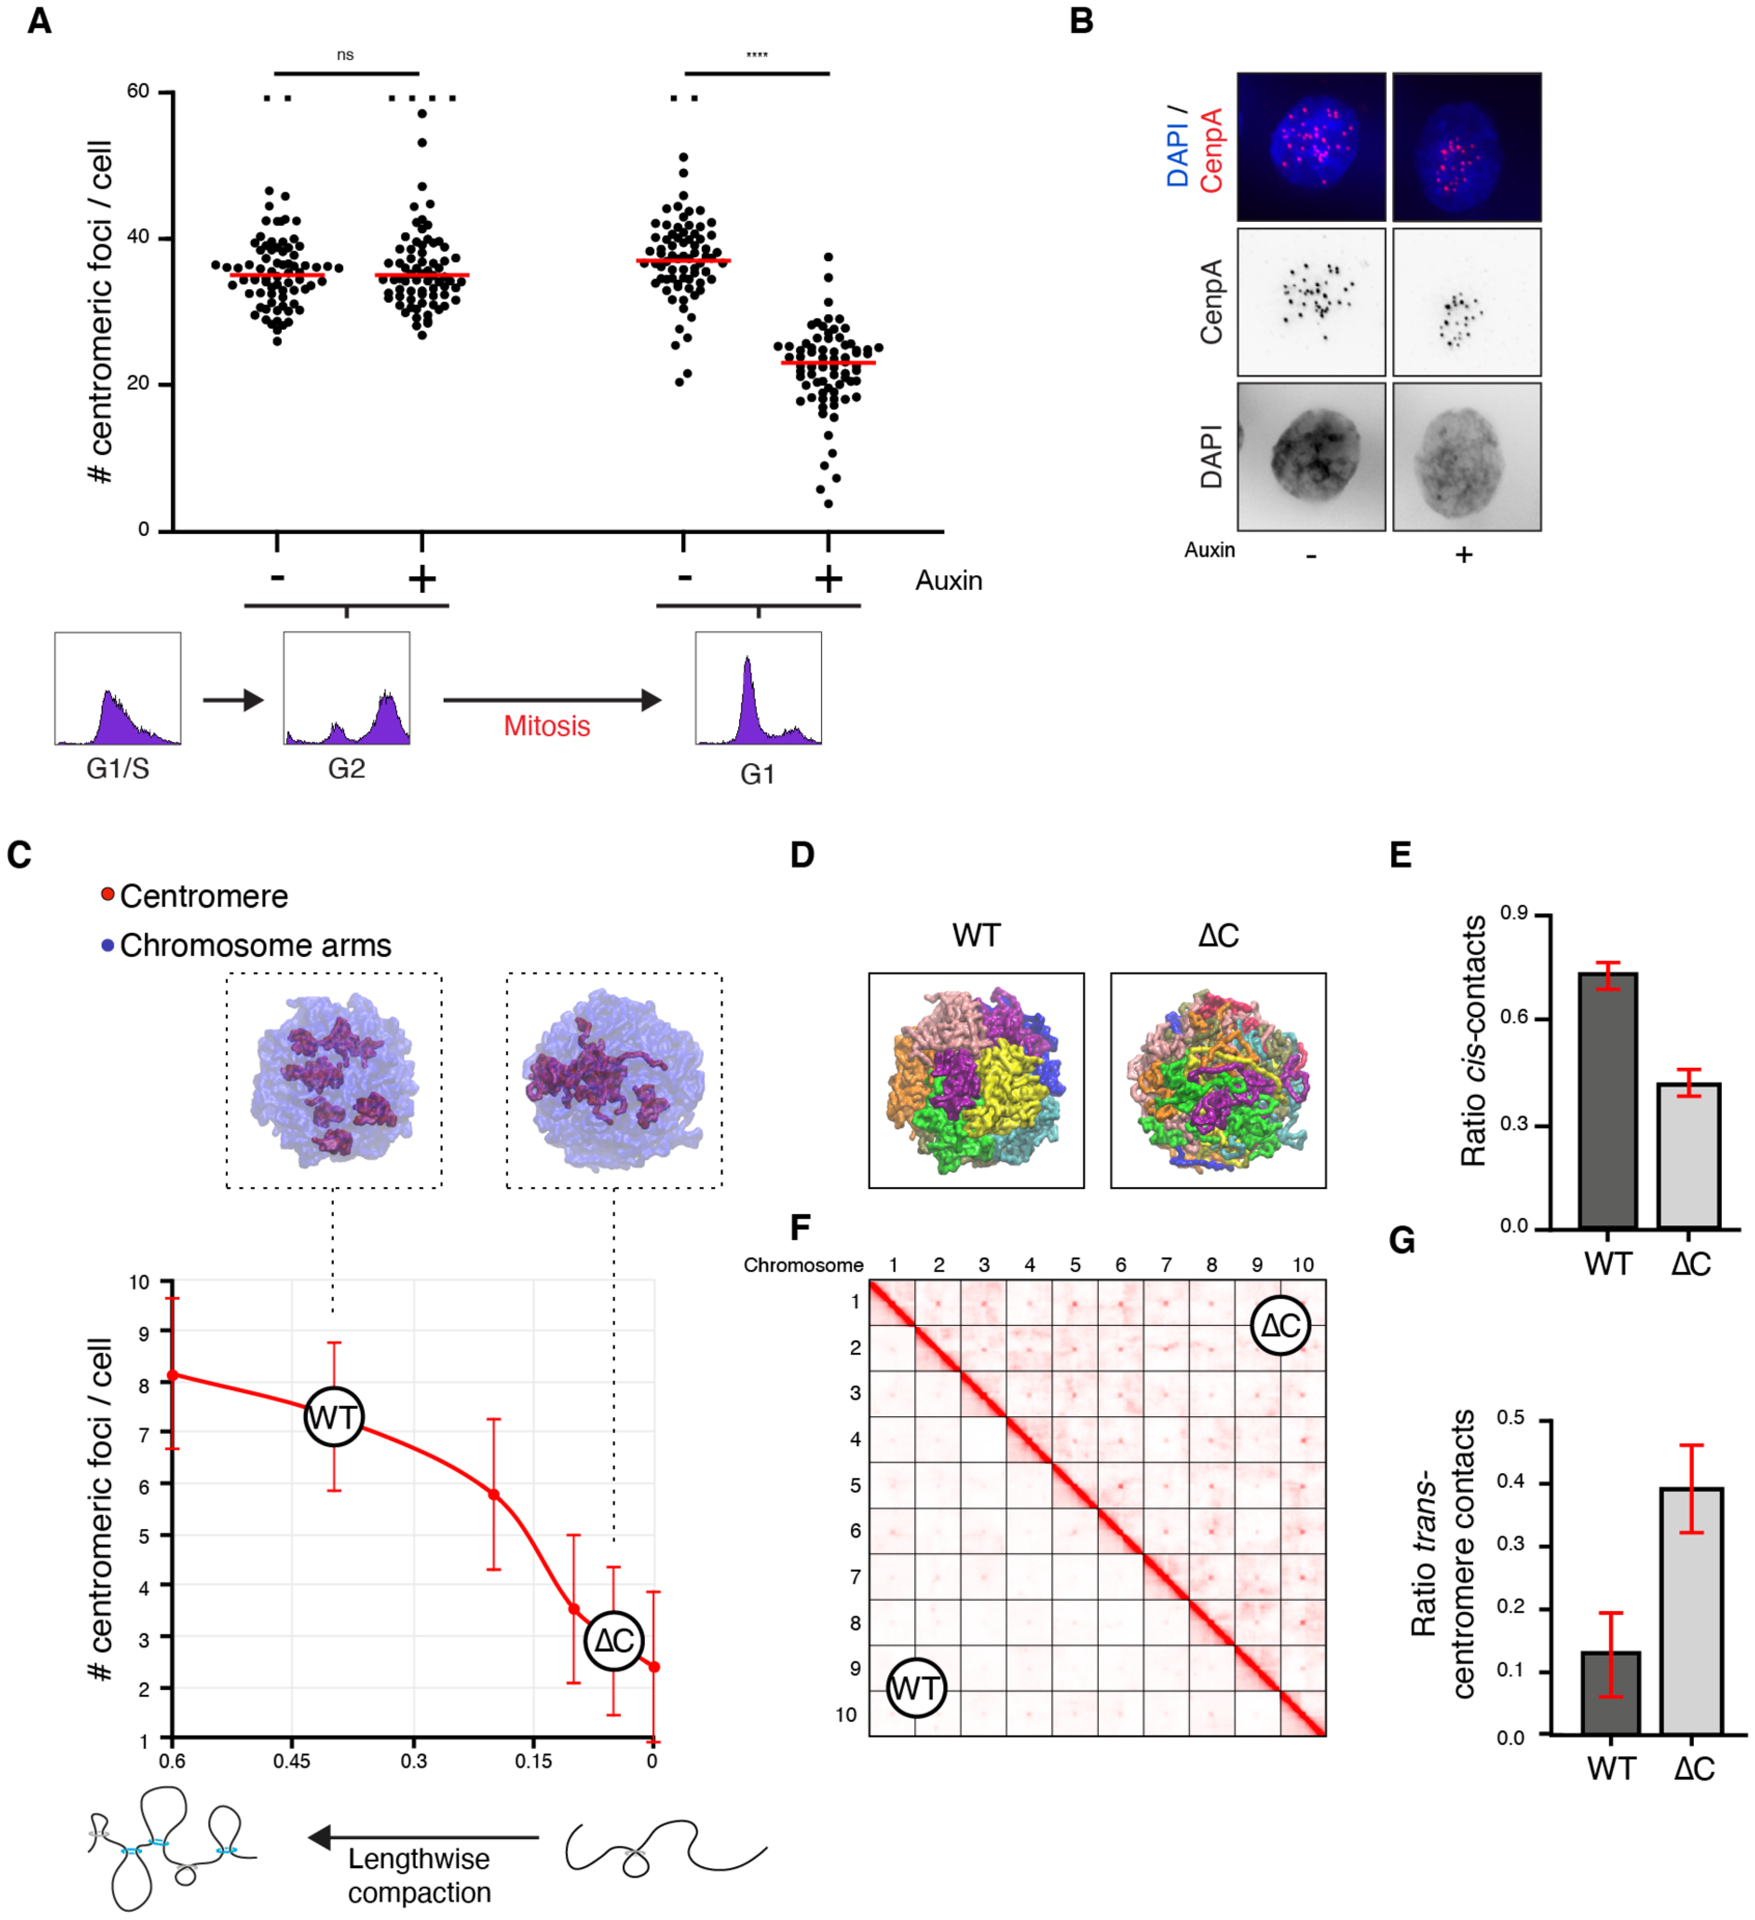
(a) Quantification of centromeric foci before or after mitotic progression with/without condensin II. FACS plots depict cell cycle stages. Outliers (>60) were truncated and depicted as squares. (b) Example images of G1 cells as quantified in (a). (c-g) Simulation modeling using ten polymer chains as chromosomes. (c) Number of centromere clusters upon varying lengthwise compaction. ‘WT’ and ‘ΔC’ correspond to higher and lower lengthwise compaction, best recapitulating the experimental data observed in wild type and ΔCAP-H2 cells. Top: representative models for both states. (d) Representative simulation snapshots depicting ten chromosomes in different colors. (e) Quantification of the ratio of cis-contacts. (f) Simulated Hi-C matrices depicting contacts between the respective chromosomes. (g) Quantification of the proportion of trans-centromeric contacts.
Finally, we wondered how condensin II alters chromosome-scale nuclear architecture. In mitosis, condensin II compacts the chromosomes in a lengthwise manner through the formation of chromatin loops (20–22). To investigate whether this lengthwise compaction could in principle explain the role of condensin II in genome folding we used physical simulations. Here, chromosomes are represented by a polymer with a centrally located centromere. These chromosomes are shaped by two forces. First, lengthwise compaction, which we implement using the concept of ideal chromosome potential (23, 24), models condensin II action. And second, centromeric self-adhesion, which models heterochromatin’s natural tendency to cluster (25–27), and stabilizes inter-centromeric contacts in our setup. We simulated ten chromosomes with fixed centromere self-adhesion, and decreased lengthwise compaction to model condensin II depletion (Figure 4C–G, Figure S22, Table S9).
Under high lengthwise compaction (i.e., when condensin II is active) the chromosomes form non-overlapping entities and hinder the spatial clustering of centromeres. Correspondingly, lower lengthwise compaction (i.e., when condensin II is depleted), leads to intermingling between chromosomes and centromere clustering. The physical model illustrates how the loss of lengthwise compaction might explain the observed clustering of centromeres.
Condensin I and condensin II together drive mitotic chromosome condensation (Figure S23A and B). In contrast to condensin II, condensin I primarily decreases the width of the chromosome (20, 21). If condensin II-driven lengthwise compaction was thus the key factor leading to territorialization, then condensin I depletion would not lead to a shift from territorial to Rabl-like architecture. Correspondingly, acute depletion of the condensin I subunit CAP-H did not lead to centromeric clustering (Figure S23C and D).
As an interesting side note, evolution has performed a related experiment in which chromosome length varies due to chromosome fusions, rather than loss of condensin II. Specifically, the Chinese muntjac has 46 short chromosomes that have merged, in the Indian muntjac, into six chromosomes (in females). By assembling the muntjac genomes, we found that dramatic increase in chromosome length in the Indian muntjac coincides, as expected, with the appearance of centromeric clustering (Figure S25).
Taken together, a model emerges in which condensin II has a crucial role in establishing chromosome-scale interphase 3D genome organization. By lengthwise compaction during mitosis, condensin II counteracts Rabl-like Type-I features, and instead promotes the formation of chromosome territories (10). Mitosis brings together centromeres of different chromosomes. We propose that the shortening of chromosomes interferes with centromeric self-adhesion, enabling distribution of the centromeres over the newly formed nuclei. Defined chromosome territories could then simply be the result of decondensation of these separate mitotic chromosomes.
Indeed, this role of condensin II in establishing the overall architecture of the genome is among the most ancient capabilities defining genome folding in the eukaryotic lineage. We find that changes in condensin II have likely contributed to dramatic shifts from chromosome territories, to Rabl-like features throughout the tree of life. It will be interesting to investigate whether and how condensin II is regulated to adjust genome organization in different tissues, developmental stages, and disease.
Supplementary Material
Acknowledgments
Chinese muntjac cells were kindly provided by Dr. William R. Brinkley. Skin fibroblasts of Indian muntjac were obtained from JCRB (9100). We thank Masatoshi Takagi from the Cellular Dynamics Laboratory at RIKEN for sharing the CAP-H2-AID and the CAP-H-AID cell lines; Marjolijn Mertz from the NKI BioImaging Facility for advice on image analyses; the NKI Genomics core facility for sequencing; O.D. and E.L.A thank Erich Jaeger and Feng Chen (Illumina, Inc.) for fruitful discussions on chromosome-length genome phasing; Robin B. Gasser and Pasi K. Korhonen, Faculty of Veterinary and Agricultural Sciences, University of Melbourne, for their help with the oriental liver fluke sample; Naoki Watanabe at Kyoto University for providing the African clawed frog cell line to the Kornberg lab; Vipulkumar Patel at Baylor Genetics for help with sequencing; and Adam Fotos from adamfotos.com for help with Figure 1 and S25.
Funding
C.H. is supported by the Boehringer Ingelheim Fonds, C.H., Á.S.C. and B.D.R are supported by an ERC CoG (772471, ‘CohesinLooping’), A.M.O.E. and B.D.R. by the Dutch Research Council (NWO-Echo), J.A.R and R.H.M by the Dutch Cancer Foundation (KWF). T.v.S. and B.v.S supported by NIH Common Fund “4D Nucleome” Program grant U54DK107965. H.T. and E.d.W. are supported by an ERC StG (637597, ‘HAP-PHEN’). J.A.R., T.v.S., H.T., R.H.M., B.v.S., E.d.W. are part of the Oncode Institute, which is partly financed by the Dutch Cancer Society. Work at the Center for Theoretical Biological Physics sponsored by the NSF (Grant PHY-2019745), by NSF- CHE 1614101 and by the Welch Foundation (Grant C-1792). V.G.C. is funded by FAPESP (São Paulo State Research Foundation and Higher Education Personnel) Grants 2016/13998-8 and 2017/09662-7. J.N.O. is a CPRIT Scholar in Cancer Research. E.L.A. was supported by an NSF Physics Frontiers Center Award (PHY1427654), the Welch Foundation (Q-1866), a USDA Agriculture and Food Research Initiative Grant (2017-05741), and an NIH Encyclopedia of DNA Elements Mapping Center Award (UM1HG009375). Hi-C data for the 24 species were created by the DNA Zoo Consortium (www.dnazoo.org). DNA Zoo sequencing effort is supported by Illumina, Inc. P.K. is supported by the University of Western Australia with additional computational resources and support from the Pawsey Supercomputing Centre with funding from the Australian Government and the Government of Western Australia. L.L.M. was supported by NIH (1R01NS114491) and NSF awards (1557923,1548121,1645219) and Human Frontiers Science Program (RGP0060/2017). J.L.G.-S. received funding from the ERC (Grant Agreement No. 740041), the Spanish Ministerio de Economía y Competitividad (Grant No. BFU2016-74961-P) and the institutional grant Unidad de Excelencia María de Maeztu (MDM-2016-0687). R.D.K. is supported by NIH grant RO1DK121366. K.M. is supported by a MEXT grant (20H05936). This is a SeaWorld Technical manuscript contribution number 2020-12. M.C.W is supported by the NIH grants R01AG045183, R01AT009050, R01AG062257, DP1DK113644 and Welch Foundation. M.C.W is a Howard Hughes Medical Institute Investigator.
Footnotes
Competing interests
All authors declare that they have no competing interests.
Data and materials availability
The Hi-C, RNA-sequencing and DamID data generated in Hap1 cells has been deposited in GEO, accession number GSE16364 (token: atqbsmamzbazluf). The rest of the data is available from NCBI under BioProject PRJNA512907 and via dnazoo.org. Alignments from the conservation analysis have been deposited in Harvard dataverse (https://doi.org/10.7910/DVN/UROKAG). The Hap1 cell lines are available from B.D.R. under a material transfer agreement with the Netherlands Cancer Institute.
Supplementary Materials:
Materials and Methods
Figs. S1 to S25
Tables S1 to S10
References and Notes:
- 1.Rao SSP et al. , Cell. 159, 1665–1680 (2014). [DOI] [PMC free article] [PubMed] [Google Scholar]
- 2.Cremer T, Cremer M, Cold Spring Harb. Perspect. Biol 2, 1–22 (2010). [DOI] [PMC free article] [PubMed] [Google Scholar]
- 3.Rabl C, Morphol. Jahrb 10, 214–330 (1885). [Google Scholar]
- 4.King TD et al. , Mol. Biol. Evol 36, 2195–2204 (2019). [DOI] [PMC free article] [PubMed] [Google Scholar]
- 5.Hirano T, Cell. 164, 847–857 (2016). [DOI] [PubMed] [Google Scholar]
- 6.Kinoshita K, Kobayashi TJ, Hirano T, Dev. Cell 33, 94–106 (2015). [DOI] [PubMed] [Google Scholar]
- 7.Schubert V, Lermontova I, Schubert I, Chromosoma. 122, 517–533 (2013). [DOI] [PubMed] [Google Scholar]
- 8.Sakamoto T, Sugiyama T, Yamashita T, Matsunaga S, Nucleus. 10, 116–125 (2019). [DOI] [PMC free article] [PubMed] [Google Scholar]
- 9.Nishide K, Hirano T, PLoS Genet. 10, e1004847 (2014). [DOI] [PMC free article] [PubMed] [Google Scholar]
- 10.Bauer CR, Hartl TA, Bosco G, PLoS Genet. 8, e1002873 (2012). [DOI] [PMC free article] [PubMed] [Google Scholar]
- 11.Rosin LF, Nguyen SC, Joyce EF, Bosco G, PLoS Genet. 14, 1007393 (2018). [DOI] [PMC free article] [PubMed] [Google Scholar]
- 12.Guelen L et al. , Nature. 453, 948–951 (2008). [DOI] [PubMed] [Google Scholar]
- 13.Padeken J et al. , Mol. Cell 50, 236–249 (2013). [DOI] [PubMed] [Google Scholar]
- 14.Brueckner L et al. , EMBO J. 39 (2020), doi: 10.15252/embj.2019103159. [DOI] [PMC free article] [PubMed] [Google Scholar]
- 15.van Steensel B, Belmont AS, Cell. 169, 780–791 (2017). [DOI] [PMC free article] [PubMed] [Google Scholar]
- 16.Ono T, Fang Y, Spector DL, Hirano T, Mol. Biol. Cell 15, 3296–3308 (2004). [DOI] [PMC free article] [PubMed] [Google Scholar]
- 17.Hirota T, J. Cell Sci 117, 6435–6445 (2004). [DOI] [PubMed] [Google Scholar]
- 18.Takagi M et al. , J. Cell Sci 131, jcs212092 (2018). [DOI] [PubMed] [Google Scholar]
- 19.Abdennur N et al. , bioRxiv, 437459 (2018). [Google Scholar]
- 20.Shintomi K, Hirano T, Genes Dev. 25, 1464–1469 (2011). [DOI] [PMC free article] [PubMed] [Google Scholar]
- 21.Green LC et al. , J. Cell Sci 125, 1591–1604 (2012). [DOI] [PMC free article] [PubMed] [Google Scholar]
- 22.Gibcus JH et al. , Science. 359, eaao6135 (2018).29348367 [Google Scholar]
- 23.Zhang B, Wolynes PG, Phys. Rev. Lett 116, 248101 (2016). [DOI] [PubMed] [Google Scholar]
- 24.Di Pierro M, Zhang B, Aiden EL, Wolynes PG, Onuchic JN, PNAS. 113, 12168–12173 (2016). [DOI] [PMC free article] [PubMed] [Google Scholar]
- 25.Larson AG et al. , Nature. 547, 236–240 (2017). [DOI] [PMC free article] [PubMed] [Google Scholar]
- 26.Strom AR et al. , Nature. 547, 241–245 (2017). [DOI] [PMC free article] [PubMed] [Google Scholar]
- 27.Falk M et al. , Nature. 570, 395–399 (2019). [DOI] [PMC free article] [PubMed] [Google Scholar]
Associated Data
This section collects any data citations, data availability statements, or supplementary materials included in this article.