Abstract
Background
There is little evidence on the performance of non‐invasive prenatal testing (NIPT) for the detection of fetal sex chromosomal imbalances. In this review, we aimed to appraise and synthesize the literature on the performance of NIPT for the prenatal detection of fetal sex chromosome aneuploidies.
Methods
We performed our literature search in PubMed, Embase, Cochrane Library, Web of Science, and CADTH. Study selection and data extraction were performed by two reviewers independently. There were no restrictions on the study population. Meta‐analyses were performed with “R” software. Pooled sensitivities and specificities with their 95% CI were estimated using a random‐effects model. Heterogeneity between studies was assessed by a Q test.
Results
Based on 11 studies in high prior risk pregnancies, including 116 affected fetuses in aggregate, Massively Parallel Shotgun Sequencing (MPSS) had a sensitivity of 93.9% (95% CI 84.1%, 97.8%) and a specificity of 99.6% (95% CI 98.7%, 99.9%) for the detection of 45,X. Based on four studies in high‐risk pregnancies, with 83 affected fetuses in aggregate, Targeted Massively Parallel Sequencing (TMPS) had a sensitivity of 83.2% (95% CI 49.6%, 96.2%) and specificity was 99.8% (95% CI 98.3%, 100%) for the detection of 45,X. In mixed‐risk pregnancies, the sensitivity of TMPS for the detection of 45,X was 90.9% (2 studies; 95% CI 70%, 97.7%) and specificity 99.9% (2 studies; 95% CI 99.4%, 100%); MPSS data were not available in such pregnancies. Based on smaller numbers of studies, and small numbers of affected fetuses in either high‐risk or mixed‐risk pregnancies (using either MPSS or TMPS), the sensitivities and specificities were equal to or greater than 76.2% for 47,XXX, 47,XXY and 47, XYY. The test failures for SCAs were 0.2% (95% CI 0%, 13.6%) for MPSS and 5.6% (95% CI 3.7%, 8.4%) for TMPS.
Conclusion
High‐quality studies are still desirable in order to estimate the performance of NIPT for the detection of sex chromosome imbalances.
Keywords: aneuploidies, cell‐free nucleic acids, noninvasive prenatal testing, sex chromosome disorders
MPSS based‐NIPT can be considered as performant for the detection of 45,X in high‐risk pregnancies, although this result is based on studies that might contain biases. For the other SCAs including 47,XXX, 47,XXY, and 47,XYY, more quality studies are still needed.
1. BACKGROUND
High‐income countries have prenatal screening programs for the detection of chromosomal anomalies of the fetus. However, the population target and the health conditions screened vary from one program to another (Benn et al., 2015).
Until recently, prenatal detection of chromosomal anomalies mainly relied on biochemical tests performed on pregnant women, ultrasounds of the fetus, and amniocentesis or chorionic villus sampling. Chromosomal anomalies can now be detected by a relatively new technology called non‐invasive prenatal testing (NIPT) that allows analyzing cell‐free placental DNA present in the maternal blood (Alldred et al., 2017; Bianchi & Chiu, 2018). In many health care jurisdictions, NIPT is generally offered as a screening test for the three most common autosomal trisomies (T21, T18, and T13), based on evidence of high sensitivity and specificity (Badeau et al., 2017).
NIPT could potentially be extended to offer the possibility of detecting other chromosomal conditions, such as sex chromosome aneuploidies (SCAs), that is, 45,X (Turner syndrome), 47,XXX (trisomy X syndrome), 47,XXY (Klinefelter syndrome), 47,XYY and 48,XXYY (Skuse et al., 2018). Some of these SCAs are associated with congenital anomalies. For instance, Turner Syndrome is associated with heart defects such as the coarctation of the aorta (Surerus et al., 2003), Klinefelter Syndrome could lead to hypogonadism, and cognitive impairment in males (Groth et al., 2013), and females with trisomy X syndrome have a high risk of suffering from infertility (Rafique et al., 2019). Knowing that a fetus is affected by SCAs can help parents and health care providers, therefore, to identify sooner what healthcare interventions are needed. This might benefit the health of the child. However, evaluations of NIPT for SCA differ by the type of technological platform used, nature of the population in which testing is performed, and the type of SCA included. Thus, the evidence is fragmented.
1.1. Objectives
The general objective of this work was to review the literature on the performance of NIPT for the prenatal detection of fetal sex chromosome aneuploidies, in order to identify the potential clinical value of including them in NIPT‐based prenatal screening programs.
2. METHODS
The study protocol was published in PROSPERO (registration number: CRD42019118785). We now report the study according to the PRISMA guideline (PRISMA, 2015).
2.1. Eligibility criteria
The eligibility criteria relied on the PICOS approach for diagnostic accuracy studies:
Participants/population: We took into consideration all pregnant women with singleton pregnancies whatever their risk level of having a child with an SCA or any of the three main autosomal abnormalities (T21, T18, T13) who provided a plasma sample for NIPT analysis and who also underwent to a confirmation test for fetal chromosomal anomalies.
Index test: The NIPT‐based molecular approach offered to the women was either targeted massively parallel sequencing (TPMS: SNP‐based) and/or massively parallel shotgun sequencing (MPSS: random throughout the genome).
Reference standard: The comparator was a karyotyping performed on samples obtained by amniocentesis, chorionic villus sampling or from the infant postnatally.
Target outcomes: The outcomes were sensitivity, specificity, and the test failure rate. The following reasons of test failure, fetal fraction DNA, sequencing process, quality control, assay failure were extracted.
Study design: Diagnostic test accuracy (DTA) studies were considered. We included non‐experimental cross‐sectional studies, and retrospective and prospective case‐control studies.
Studies for which it was not possible to extract or derive the number of true positives, false positives, false negatives, and true negatives were excluded.
2.2. Information sources
The literature search was performed in the following databases: PubMed, Embase, Cochrane Library, Web of Science, CADTH, and the references lists of published articles. The search was first performed on October 2, 2018, and updated on June 11, 2020. The literature search was not limited in time. We considered the literature from the first publication on NIPT for the detection of chromosomal imbalances. Only articles written in English were considered.
2.3. Search strategies
The relevant keywords that were used for the search are described in Table A1. Based on the PICOS approach, the search focused on five components: pregnancy, non‐invasive prenatal testing, test accuracy, reference test, and diagnostic test accuracy studies. An epidemiologist and a geneticist were consulted to improve the search strategy. The strategy was validated by a librarian. Moreover, the sensitivity of the search strategy was investigated by pre‐identifying some relevant studies and verifying if the search strategy was able to detect these studies.
2.4. Data management
The list of articles found was imported into EndNote (version 19.2.0.13018). Duplicates were identified and removed manually.
2.5. Selection of studies
A pilot selection was made by two reviewers (BS and CL). The pilot selection was carried out on 10% of the total number of articles identified as potentially eligible (320 of 3214 articles). Both researchers reviewed the titles and abstracts independently. Any article that got at least one "No" in the list of inclusion questions was excluded. The Kappa of the pilot selection between the two reviewers was ≥0.8, which was considered acceptable (McHugh, 2012). Thereafter, the two reviewers completed the selection of the studies independently with a kappa of 0.85. In case of a discrepancy, discussions were held in order to reach a consensus. A third reviewer (DR) was involved when a consensus could not be reached.
The full‐text study selection was performed by two reviewers (BS and CL) independently. Any disagreement between reviewers was settled, as for the title and abstract search, with the help of the third researcher (DR).
2.6. Data extraction
Our data extraction was performed on Review Manager 5.4. The same two reviewers as involved in title and abstract screening (BS and CL) extracted the data from all included studies independently. Our data extraction included the following items:
Reference details enabling the publication to be accessed (first author, publication year, etc.);
Study design: retrospective/prospective, blinded/unblinded, case‐control/non‐case‐control;
Population characteristics: total number of pregnant women, prior risk.
-
Features of the index test:
Test‐specific details: TMPS or MPSS, cutpoint, and test failure rate.
Features of the reference standard: fetal karyotyping, diagnostic sample.
-
Outcome characteristics:
Information on specific types of SCAs: the total number of cases of SCAs;
Test performance: true positive, false positive, true negative, false negative, and test failure.
All extracted data were cross‐checked. Disagreements were solved by discussion and search of a consensus between the two reviewers (BS and CL). A third reviewer (DR) was involved in the case a consensus could not be reached.
2.7. Risk of bias and applicability
The QUADAS‐2 tool for the assessment of diagnostic accuracy study was used to assess the quality of the methodology of the included studies (Whiting et al., 2011). This was the basis for a series of signaling questions (see Table A2) each of which was answered as "yes," "no," or "unclear." The reason for each judgment on the risk of bias and applicability was recorded. A study was classified as "low risk of bias" when a "yes" to all signaling questions was recorded. It was classified as of "high risk of bias" when a "no" was recorded for one or more signaling questions. It was classified as "unclear risk of bias" when an "unclear" for one or more signaling questions were recorded. In addition, the study was classified as “ high risk of bias” when at least a “no” and an “unclear” were recorded. Applicability concerns were judged according to our review questions. Each study was classified as "low, high, or unclear concern." A study that had insufficient information was classified as "unclear concern." The two reviewers (BS and CL) applied the QUADAS‐2 tool to each included study independently. A pilot assessment was performed with three studies. Disagreements were resolved by discussion and search for a consensus. A third reviewer (FR) was consulted in case of doubt.
2.8. Statistical analyses and data synthesis
Review Manager 5.4 was used to synthesize the qualitative evidence of the included studies. Each included study was systematically and comprehensively assessed. The features of the studies, including study population, index test, reference standard, and outcome, were described.
The main statistical analyses aimed to examine the performance of the NIPT to detect target SCAs, both individually and globally for each condition. Two‐by‐two tables were constructed with the main outcomes (true positive, false positive, true negative, and false negative) in order to calculate the individual studies’ sensitivity, specificity, and false‐positive rate. True positives consisted of the fetus with the SCAs under analysis. True negatives consisted of unaffected fetus and fetus with chromosomal abnormalities other than the ones under analysis.
Meta‐analyses were performed with R software (version 3.6.1) when there were two or more studies on a specific chromosomal anomaly detected using a specific platform. When there were three or more studies, we performed a leave‐out‐one‐study sensitivity analysis in order to determine how each individual study might affect the overall estimates. The pooled sensitivities and specificities with their 95% CI were estimated using a random‐effects model because we assumed that all included studies in our meta‐analyses were a random sample of all possible studies that might meet our inclusion criteria and because the performance of NIPT might vary across studies due to differences in study populations and study protocols (Riley et al., 2011). Hierarchical summary receiver operation (HSROC) model was performed in some cases in order to take into account the correlation between sensitivity and specificity. The heterogeneity among the studies was assessed by the Q test and was quantified by an I‐square test. Furthermore, the between‐studies variation was estimated by a tau‐square test.
We performed two sub‐group analyses regarding the prior risk (high vs. mixed) of having a child with aneuploidy of any type and NIPT‐based methods (MPSS vs. TMPS) separately because it was expected that the performance of NIPT would be different.
3. RESULTS
3.1. Search
The PRISMA Flow Diagram for the selection of studies is presented in Figure 1. After the elimination of duplicates, 3214 articles were identified, of which 185 met the eligibility criteria based on the titles and the abstract. A review of the full text of these 185 articles resulted in the inclusion of 21 articles; reasons for exclusion of the other 164 articles are summarized in Figure 1.
FIGURE 1.
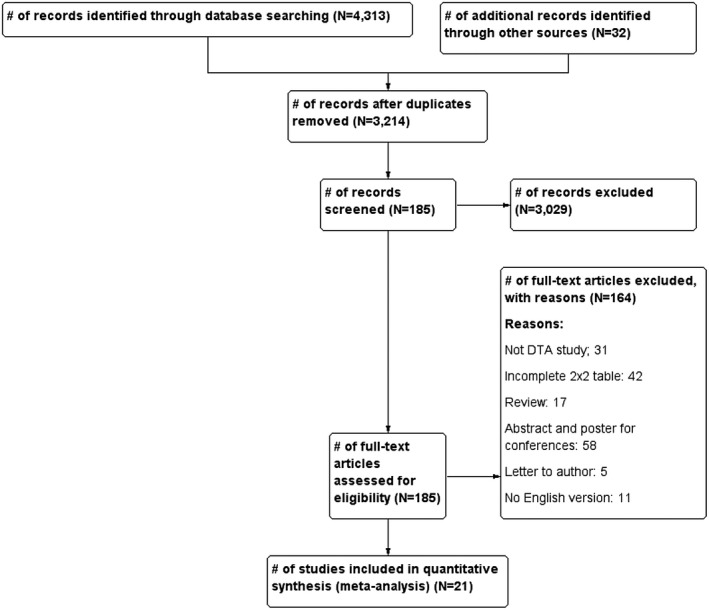
PRISMA Flow Diagram for the selection of studies
3.2. Basic features of included articles
Studies were classified into two groups: massively parallel shotgun sequencing (MPSS) (15 studies) and targeted massively parallel sequencing (TMPS) (6 studies). The studies were conducted both retrospectively and prospectively. The majority of the studies used Illumina sequencing to screen for chromosome abnormalities. All of the studies used fetal karyotype as the reference for SCAs (Table 1). Details regarding the performance of individual studies for each condition in high‐risk pregnancies are summarized in Figures 2 and 3 and in mixed‐risk pregnancies in Figure 4. In addition, studies were classified into two groups; high and mixed risk pregnancy.
TABLE 1.
Basic features of included studies, N = 21
| Study ID | Condition a | Study design and participants | Prior risk | Index test | Threshold | Reference standard |
|---|---|---|---|---|---|---|
| Massively Parallel Shotgun Sequencing (MPSS), N = 15 | ||||||
| Bianchi (2012) | 45,X |
|
High |
|
NCV chrom X < −4.0 and NCV chrom Y < 2.5 | Karyotype |
| Bianchi (2013) | 45,X |
|
High | Illumina TrueSeq 3.0 sequencing chemistry | NCV chrom X < −3.0 and NCV chrom Y < 3.0 | Karyotype |
| Ivashchenko (2019) | 47,XXX |
|
High | Next‐Generation Sequencing | Z‐score <−3 or >3 | Karyotype, FISH |
| Jiang (2012) | 45,X, 47,XXY, 47,XYY |
|
High |
Illumina Genome Analyzer IIx or HiSeq 2000 sequencer in multiplex |
t score <−2.5 for 47,XXX and 45,X t score >2.5 for 47,XXY and 47,XYY |
Karyotype |
| Lau (2012) | 45,X, 47,XXX, 47XXY, 47,XYY |
|
High | Illumina HiSeq 2000 sequencer in 12‐plex |
Z‐score of [−3.5; −2.5] for 45,X, and 47,XXX ‐Z‐score of [2.5;3.5] for 47,XXY, and 47,XYY |
Karyotype |
| Liu (2012) | 45,X, 47,XXX, 47XXY, 47,XYY |
|
High |
Illumina HiSeq sequencer in multiplex |
Z score ≥3 | Karyotype |
| Liang (2013) | 45,X, 47,XXX, 47,XXY, 47,XYY |
|
High | v2 Illumina HiSeq 2000 sequencer in 8‐plex or 12‐ plex |
Z‐score of −2.91 for 45,X, and 47,XXX Z‐score of 3 for 47,XXY, and 47,XYY |
Karyotype |
| Lefkowitz (2016) | 45,X, 47,XXX, 47,XXY, 47,XYY |
|
High |
Illumina HiSeq 2000 sequencer in 6‐plex or uniplex |
Z‐score of [−3.5; −2.5] for 45,X, and 47,XXX Z‐score of [2.5;3.5] for 47,XXY, and 47,XYY |
G‐band karyotype |
| Li (2018) | 45,X, 47,XXX, 47,XXY, 47,XYY |
|
High | BGISEQ‐500 sequencer | Z‐score <−3 or >3 | Karyotype |
| Mazloom (2013) | 45,X, 47,XXX, 47,XXY, 47,XYY |
|
High | Illumina v3 HiSeq 2000 sequencer in 12‐plex |
‐Z‐score of [−3.5; −2.5] for 45,X, and 47,XXX ‐Z‐score of [2.5;3.5] for 47,XXY, and 47,XYY |
Karyotype |
| Porreco (2014) | 45,X, 47,XXX, 47,XXY, 47,XYY |
|
High | Illumina HiSeq 2000 sequencer in 12‐plex |
‐Z‐score of [−3.5; −2.5] for 45,X, and 47,XXX ‐Z‐score of [2.5;3.5] for 47,XXY, and 47,XYY |
Karyotype |
| Sehnert (2011) | 45,X |
|
High | Illumina Genome Analyzer IIx sequencer in uniplex | NCV <−3 | Karyotype |
| Shaw (2014) | 45,X, 47,XXX, 47,XXY, 47,XYY |
|
Mixed | v2 Illumina HiSeq 2000 sequencer in 12‐plex |
Z‐score of [−3.5; −2.5] for 45,X, and 47,XXX ‐Z‐score of [2.5;3.5] for 47,XXY, and 47,XYY |
Karyotype |
| Song (2015) |
45,X, 47,XXX, 47,XXY |
|
High | Illumina v2 HiSeq 2000 sequencer in 12‐plex |
Z‐score of −3 for 45,X and 47,XXX ‐Z‐score of 3 for 47,XYY |
Karyotype |
| Zhu (2019) |
45,X, 47,XXY |
|
High |
Next‐Generation Sequencing (Ion Proton sequencing) |
Z absolute <1.96 or >3 | Karyotype |
| Targeted Massively Parallel Sequencing (TMPS), N = 6 | ||||||
| Hooks (2014) | 45,X, 47,XXX, 47,XXY, 47,XYY |
|
High |
DANSR™ Assay and algorithm (FORTETM) |
NR | Karyotype |
| Nicolaides (2013) | 45,X, 47,XXX, 47,XXY, 47,XYY |
|
High |
SNP‐based Method (NATUS algorithm), Illumina Genome Analyzer IIx or HiSeq sequencer, 19,488‐plex targeted PCR |
NR | Karyotype |
| Nicolaides (2014) | 45,X, 47,XXX, 47,XXY, 47,XYY |
|
High | DANSR™ assay (FORTE), Illumina HiSeq 200 in 96‐plex | FORTE risk score of 1% | Karyotype |
| Pergament (2014) | 45,X |
|
Mixed | The Next‐generation Aneuploidy Test Using SNPs algorithm | NR | Karyotype |
| Persico (2016) | 45,X, 47,XXX, 47,XXY, 47,XYY |
|
High |
SNP‐based Method (NATUS algorithm), Illumina Genome Analyzer IIx or HiSeq sequencer, 19,488‐plex targeted PCR |
A risk score of 1% | Karyotype |
| Samango‐Sprouse (2013) | 45,X, 47,XXX, 47,XXY, 47,XYY |
|
Mixed |
SNP‐based Method (NATUS algorithm), Illumina HiSeq sequencer, 19,488‐plex targeted PCR |
NR | Karyotype |
Abbreviation: NCV, normalized chromosome value.
The conditions presented in this review.
FIGURE 2.
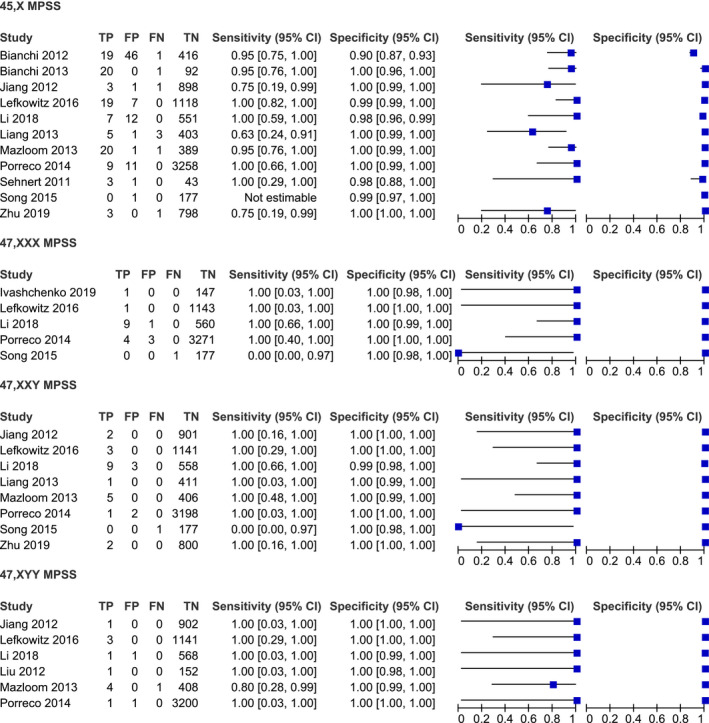
Performance of MPSS in the detection of 45,X, 47,XXX, 47,XXY, and 47,XYY in high‐risk pregnancy
FIGURE 3.
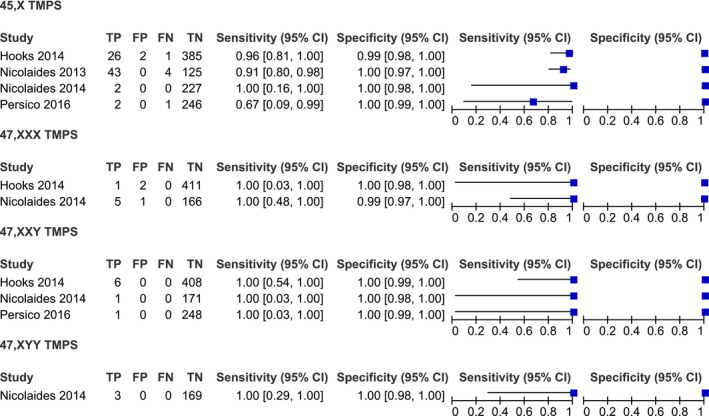
Performance of TMPS in the detection of 45,X, 47,XXX, 47,XXY, and 47,XYY in high‐risk pregnancy
FIGURE 4.
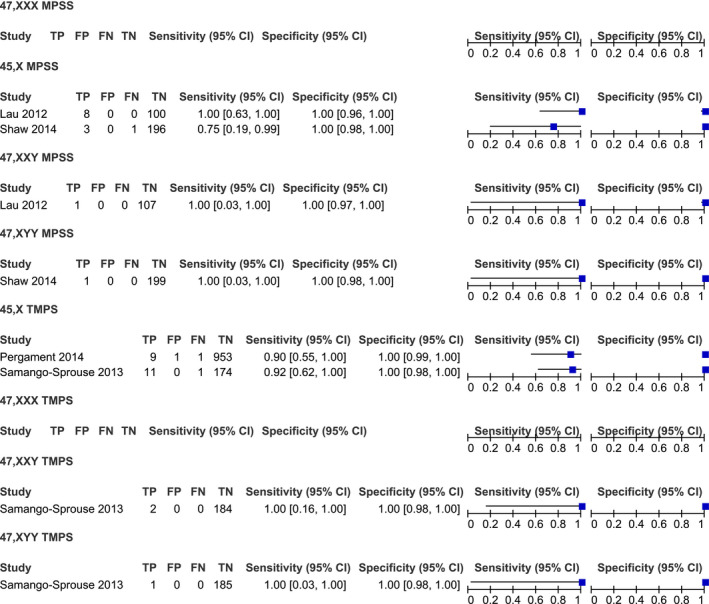
Performance of MPSS and TMPS in the detection of 45,X, 47,XXX, 47,XXY, and 47,XYY in mixed‐risk pregnancy
3.3. Performance of NIPT in high‐risk pregnancy
3.3.1. 45,X syndrome
MPSS platform
A total of 11 studies were included in the meta‐analysis on the MPSS platform. The sample consisted of 116 affected and 8224 unaffected fetuses. Sensitivities in individual studies ranged from 63% to 100% (Figure 2). The pooled sensitivity was 93.9% (95% CI 84.1%–97.8%). The pooled specificity was 99.6% (95% CI 98.7%–99.8%), with high heterogeneity (Table 2).
TABLE 2.
HSROC model for high‐risk pregnancy
| Performance | 45,X syndrome (MPSS) (Affected = 116, Unaffected = 8224) | 47,XXX (TMPS) (Affected = 6, Unaffected = 580) | 47,XXY (TMPS) (Affected = 8, Unaffected = 827) |
|---|---|---|---|
| Sensitivity (95% CI) | 93.9% (84.1%, 97.8%) | 76.2% (36%, 94.8%) | 82.9% (38.2%, 97.4%) |
| Specificity (95% CI) | 99.6% (98.7%, 99.9%) | 99.5% (98.4%, 99.8%) | 99.9% (99.1%, 100%) |
TMPS platform
The meta‐analysis was performed on four studies. The sample consisted of 83 affected and 985 unaffected fetuses. The pooled sensitivity and specificity were 83.2% (95% CI 49.6%–96.2%), with considerable heterogeneity and 99.8% (95% CI 98.3%–100%), respectively (Figure 5, 6).
FIGURE 5.

Forest plot of the sensitivity of TMPS for 45,X in high‐risk pregnancy
FIGURE 6.

Forest plot of the specificity of TMPS for 45,X in high‐risk pregnancy
3.3.2. 47,XXX syndrome (triple X syndrome)
MPSS platform
A total of five studies were included in a meta‐analysis on the MPSS platform. The sample consisted of 16 affected and 5302 unaffected fetuses. The pooled sensitivity was 99.5% (95% CI 0.1%–100%), with high heterogeneity (Figure 7). The pooled specificity was 99.9% (95% CI 99.8%–100%) (Figure 8).
FIGURE 7.

Forest plot of the sensitivity of MPSS for 47,XXX in high‐risk pregnancy
FIGURE 8.
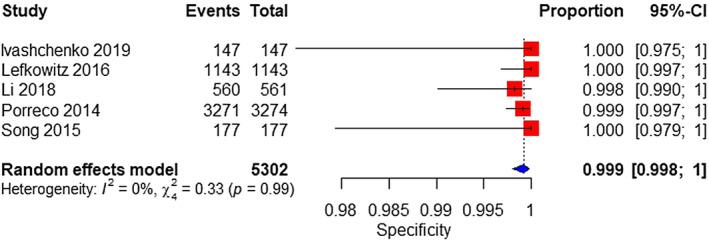
Forest plot of the specificity of MPSS for 47,XXX in high‐risk pregnancy
TMPS platform
Two studies were analyzed. The sample consisted of 6 affected and 580 unaffected fetuses. The pooled sensitivity was 76.2% (95% CI 36%–94.8%). The pooled specificity was 99.5% (95% CI 98.4%–99.8%) (Table 2).
3.3.3. 47,XXY syndrome (Klinefelter syndrome)
MPSS platform
Eight studies were included in the meta‐analysis. The sample consisted of 24 affected and 7597 unaffected fetuses. The pooled sensitivity was 100% (95% CI 0%–100%), with high heterogeneity (Figure 9). The pooled specificity was 100% (95% CI 99.6%–100%) (Figure 10).
FIGURE 9.
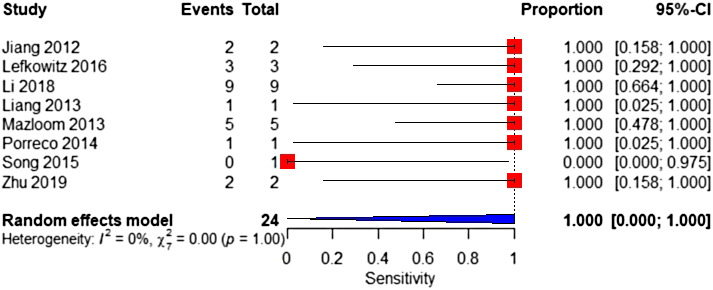
Forest plot of the sensitivity of MPSS for 47,XXY in high‐risk pregnancy
FIGURE 10.
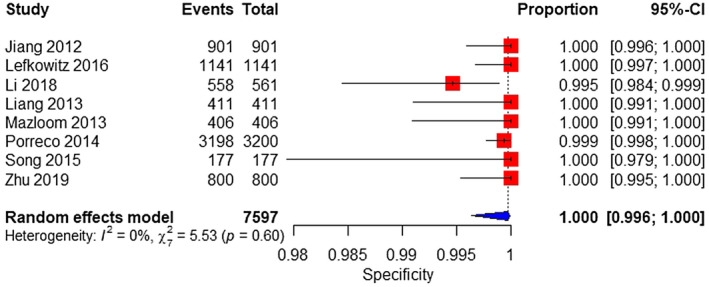
Forest plot of the specificity of MPSS for 47,XXY in high‐risk pregnancy
TMPS platform
A total of three studies were analyzed. The sample consisted of 8 affected and 827 unaffected fetuses. The pooled sensitivity and specificity were 82.9% (95% CI 38.2%–97.4%) and 99.9% (95% CI 99.1%–100%), respectively (Table 2).
3.3.4. 47,XYY syndrome
MPSS platform
A total of six studies were analyzed. The sample consisted of 12 affected and 6373 unaffected fetuses. The pooled sensitivity was 91.7% (95% CI 58.7%–98.8%) (Figure 11). The pooled specificity was 100% (95% CI 99.9%–100%) (Figure 12).
FIGURE 11.
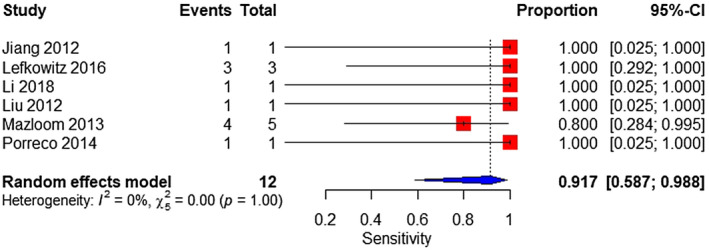
Forest plot of the sensitivity of MPSS for 47,XYY in high‐risk pregnancy
FIGURE 12.
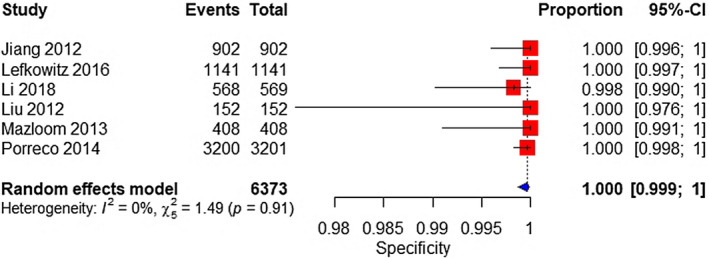
Forest plot of the specificity of MPSS for 47,XYY in high‐risk pregnancy
TMPS platform
Based on a single study, consisting of 3 affected and 169 unaffected fetuses. The sensitivity for the detection of 47,XYY syndrome was 100% (95% CI 29% to 100%). The specificity was 100% (95% CI 99.8%–100%) (Figure 3).
3.4. Performance of NIPT in mixed‐risk pregnancy
3.4.1. 45,X syndrome
MPSS platform
Based on two studies, consisting of 12 affected and 296 unaffected fetuses. The sensitivity and specificity ranged from 75% to 100% (95% CI 19%–100%) and 100% (95% CI 96%–100%), respectively (Figure 4).
TMPS platform
Two studies were analyzed. The sample consisted of 22 affected and 1128 unaffected fetuses. The pooled sensitivity and specificity was 90.9% (95% CI 70%–97.7%) (Figure 13) and 99.9% (95% CI 99.4%–100%), respectively (Figure 14).
FIGURE 13.

Forest plot of the sensitivity of TMPS for 45,X in mixed‐risk pregnancy
FIGURE 14.

Forest plot of the specificity of TMPS for 45,X in mixed‐risk pregnancy
3.4.2. 47,XXY syndrome (Klinefelter syndrom)
MPSS platform
According to the result of one study, performing with one affected and 107 unaffected fetuses, the sensitivity of the MPSS platform for the detection of 47,XXY syndrome was 100% (95% CI 3%–100%) and its specificity was 100% (95% CI 97%–100%) (Figure 4).
TMPS platform
Based on one study, conducted with two affected and 184 unaffected fetuses, the sensitivity was 100% (95% CI 16%–100%), and the specificity was 100% (95% CI 98%–100%) (Figure 4).
3.4.3. 47,XYY syndrome
MPSS platform
The sensitivity and specificity of the MPSS platform for the detection of 47,XYY syndromes were 100% (95% CI 3% to 100%) and 100% (95% CI 98%–100%), respectively, according to the result of a single study, conducting with one affected and 199 unaffected fetuses (Figure 4).
TMPS platform
The result of one study conducting with 1 affected and 185 unaffected fetuses showed that the sensitivity of the TMPS platform was 100% (95% CI 3%–100%). The specificity was 100% (95% CI 98%–100%) (Figure 4).
3.5. Test failure
In these analyses, we included only studies that reported the test failure rate. Many studies were, therefore, excluded.
3.5.1. MPSS platform
Based on eight and three studies, the test failure rate was 0.3% (95% CI 0%–1.6%) for all aneuploidies (Figure 15) and 0.2% (95% CI 0%–13.6%) for SCAs (Figure 16), respectively.
FIGURE 15.
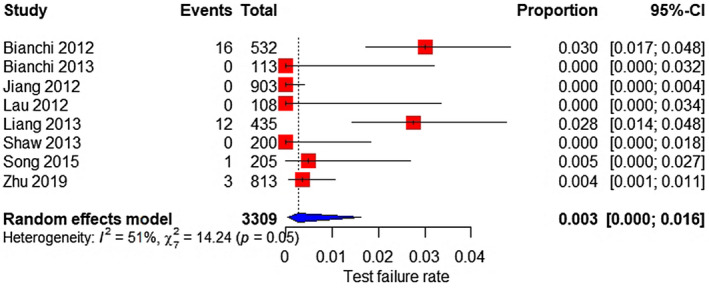
Forest plot of the test failure rate of MPSS for all aneuploidy.
FIGURE 16.

Forest plot of the test failure rate of MPSS for sex chromosome aneuploidy
3.5.2. TMPS platform
Two studies were included; the test failure rate was 4.6% (95% CI 3.1%–6.8%) for all aneuploidies (Figure 17). Besides, based on four studies, the test failure rate for SCAs was 5.6% (95% CI 3.7%–8.4%) (Figure 18).
FIGURE 17.

Forest plot of the test failure rate of TMPS for all aneuploidy
FIGURE 18.

Forest plot of the test failure rate of TMPS for sex chromosome aneuploidy
3.6. Sensitivity analyses
The results of the sensitivity analyses for TMPS and MPSS platforms are presented in Tables 3 and 4, respectively. Using the leave‐out‐one study approach resulted in little change in the pooled estimates of clinical sensitivities and specificities.
TABLE 3.
Sensitivity analysis of MPSS platform in high‐risk pregnancy
| Performance | 45,X syndrome | Sensitivity analysis | 47,XXX syndrome | Sensitivity analysis | 47,XXY syndrome | Sensitivity analysis | 47,XYY syndrome | Sensitivity analysis |
|---|---|---|---|---|---|---|---|---|
| Sensitivity (95% CI) | 93.9% (84.1%, 97.8%) | 93.6% (82.3%, 98%) | 99.5% (0.1%, 100%) | 100% (0%, 100%) | 100% (0%, 100%) | 100% (0%, 100%) | 91.7% (58.7%, 98.8%) | 92.1% (0%, 100%) |
| Specificity (95% CI) | 99.6% (98.7%, 99.9%) | 99.2% (97.3%, 99.8%) | 99.9% (99.8%, 100%) | 99.2% (99.8%, 100%) | 100% (99.8%, 100%) | 100% (98.4%, 100%) | 100% (99.9%, 100%) | 100% (99.8%, 100%) |
TABLE 4.
Sensitivity analysis of TMPS platform in high‐risk pregnancy
| Performance | 45,X syndrome | Sensitivity analysis | 47,XXY syndrome | Sensitivity analysis |
|---|---|---|---|---|
| Sensitivity (95% CI) | 83.2% (49.6%, 96.2%) | 86.5% (45%, 97.7%) | 82.9% (38.2%, 97.4%) | 76.7% (9.4%, 99.3%) |
| Specificity (95% CI) | 99.8% (98.3%, 100%) | 99.8% (0%, 100%) | 99.9% (99.1%, 100%) | 99.9% (0%, 100%) |
3.7. Quality assessment of the studies
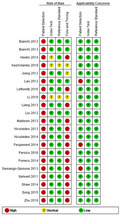
The methodology of each included study was assessed for its potential biases and applicability concerns. The results of this assessment are presented in Figures 19 and 20. Based on QUADAS‐2 criteria, all studies were classified as high risk of bias. All 21 studies (100%) were classified as high risk of bias regarding their patient selection. Three studies (14.3%) were considered to have a high applicability concern.
FIGURE 19.
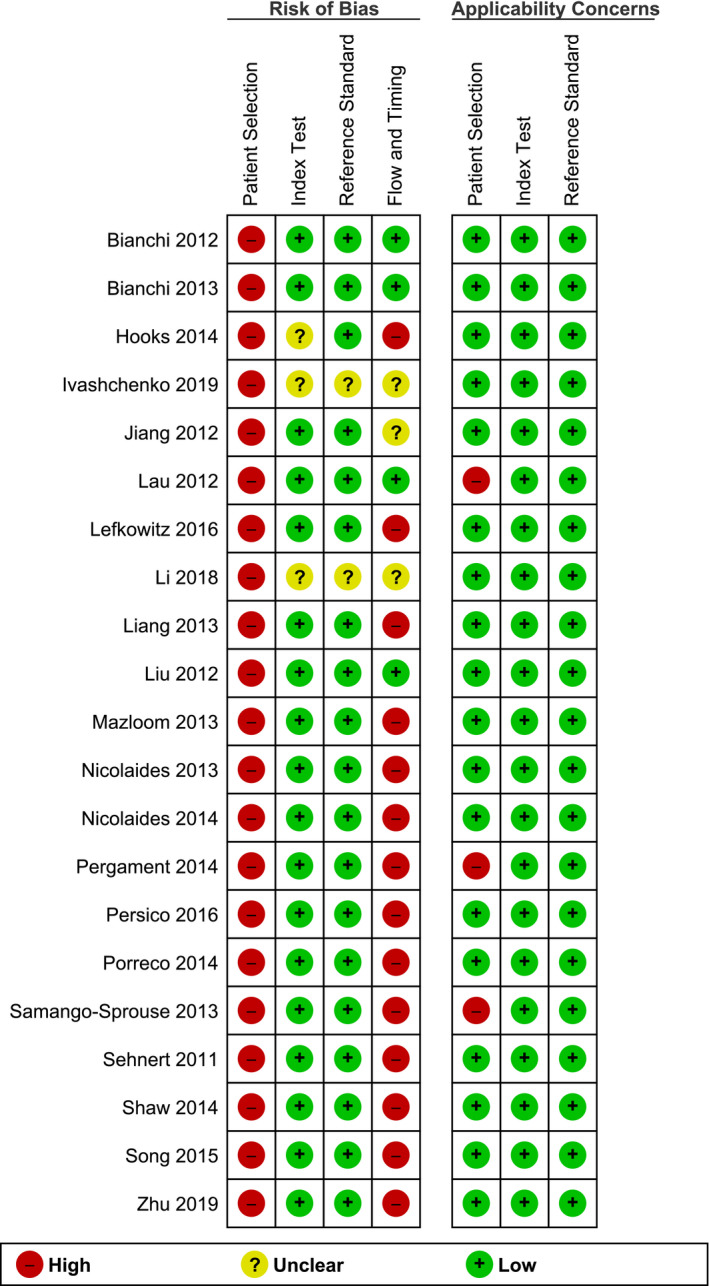
Risk of bias and applicability concerns of the studies based on the QUADAS‐2 criteria
FIGURE 20.

Summary of risk of bias and applicability concerns of the studies based on the QUADAS‐2 criteria
4. DISCUSSION
4.1. Principal findings
Twenty‐one studies were included in this review; 15 studies were conducted with the MPSS platform and six studies with the TMPS platform. Massively Parallel Shotgun Sequencing (MPSS) had a sensitivity of 93.9%, 99.5%, 100% and 91.7% and had a specificity of 99.6%, 99.9%, 100% and 100%, respectively, for the detection of 45,X, 47,XXX, 47,XXY and 47,XYY in high prior risk pregnancies. Targeted Massively Parallel Sequencing (TMPS) had a sensitivity of 83.2%, 76.2%, 82.9% and 100%. Its specificity was 99.8%, 99.5%, 99.9%, and 100%, respectively, for the detection of these SCAs in the high‐risk pregnant women. The test failure of NIPT on all aneuploidy was 0.3% and 4.6% for MPSS and TMPS, respectively. Meanwhile, the test failure rates for SCAs exclusively were 0.2% and 5.6%, respectively.
4.2. Interpretation of the findings
The performance of NIPT for the detection of common aneuploidies (trisomy 21, 18, and 13) has been well studied, and NIPT is now considered as accurate and cost‐effective for these chromosomal conditions when used as a 2nd‐tier screening test (Badeau et al., 2017; Gil et al., 2017). The test is non‐invasive, more sensitive, and specific than traditional screening tests performed with biochemical markers and ultrasounds. One wonders now if it should not be used for the screening of conditions beyond T21, 13, and 18 (Alldred et al., 2012).
The results of this review confirm and extend the findings of another review performed on NIPT for the detection of common sex chromosome aneuploidies (Badeau et al., 2017), especially the NIPT failure rate for SCAs. The accuracy of the test depended on the conditions searched and the NIPT method. According to our meta‐analysis, both platforms have an acceptable sensitivity for the detection of 45,X in high‐risk pregnancy. However, these results are based on studies that might contain biases. For the other SCAs, that is, 47,XXX, 47,XXY, and 47,XYY, more quality studies are still needed. From a clinical perspective, effectively, having a clear idea of the performance of NIPT, hence its added‐value, is of interest. Knowing that a fetus is affected with an SCA can help parents and health care providers to better plan relevant healthcare interventions, for instance, fetal echocardiograms to make sure that there are no cardiac abnormalities in fetuses with 45,X (Turner syndrome) (Surerus et al., 2003) or blood tests to diagnose hypogonadism in children with a 47,XXY condition (Klinefelter syndrome). The detection at a prenatal stage allows the implementation of interventions such as testosterone supplements earlier on after birth, which can improve the health outcome of affected males (Groth et al., 2013).
Yet, in many health care jurisdictions, an economic evaluation is an important step and has to be performed before considering expanding the conditions listed in a NIPT‐based screening program. A current study showed that adding SCAs in a first‐tier NIPT‐based program increased the screening cost (Xie et al., 2020). However, due to the low external validity of the economic evaluation, economic evaluations should be performed in every health care jurisdiction.
Our study aimed to compare the performance of MPSS versus TMPS One significant difference was the test failure rate of NIPT additional to SCAs which was lower in MPSS than TMPS, 0.2% (95% CI 0% to 13.6%) versus 5.6% (95% CI 3.7%, 8.4%). One major factor in explaining this difference was that MPSS included studies that did not measure fetal fraction (Palomaki & Kloza, 2018), while the main cause of test failure is known to be a low fetal fraction (Pergament et al., 2014). Recently, a review published their results in terms of failure rate (ranged from 0.9% to 5.6%) ("Noninvasive Prenatal Testing for Trisomies 21, 18, and 13, Sex Chromosome Aneuploidies, and Microdeletions: A Health Technology Assessment," 2019), nevertheless, they did not do a subgroup analysis (MPSS vs. TMPS). Therefore, we cannot compare our results directly with them. In addition, one study reported a 0.2% additional failure rate due to 45,X (Pergament et al., 2014).
In brief, our results of suggesting that clinicians should be cautious about not overstating the benefits of NIPT for the detection of SCAs.
4.3. Strengths of the study
The first strength lies in the fact that the protocol had been validated by experts and published in PROSPERO (March 19, 2019). The search for data was performed in relevant databases without any restriction on time, NIPT methods, SCAs, and population. Selection of studies, data extraction, and quality assessment of studies’ methodology was performed independently by two reviewers.
The second strength of the study is the strict use of karyotyping as the gold standard for the diagnosis of an SCA.
The last strength is related to the data analyses. We performed a stratified‐analysis on two NIPT platforms, and different risk groups of pregnancy, allowing us to explore and compare their performance for the detection of SCAs. Besides, we strengthened the results of our meta‐analysis by performing a sensitivity analysis using a leave‐one‐out approach. This analysis suggested that our results were not due to a single study.
4.4. Limitations of the study
The first limitation of this study comes from the fact that there was a limited number of studies for 47,XXX, 47,XXY and 47,XYY, especially when the TMPS platform was used. Our meta‐analyses performed for the above conditions also were also limited by the number of affected cases. Consequently, the 95% CI of the sensitivities of NIPT to detect those conditions were wide.
The second limitation is related to the quality of the studies’ methodology. The QUADAS‐2 criteria suggested that all of the studies included in this review were at high risk of bias. Therefore, our review might fall under or overestimated the performance of NIPT for the screening of SCAs.
The third limitation is the heterogeneity of the included studies. In Table 1, we can see some differences between studies, for instance, regarding the cutoff points and index tests. There was a high I‐square score at the forest plots. The high I‐square score suggests the presence of heterogeneity between the included studies. Nevertheless, when the number of studies is small, the I‐square test might suggest heterogeneity when there is no variation in the outcome considered between the studies or a homogeneity when there is large heterogeneity between studies (von Hippel, 2015).
5. CONCLUSIONS
5.1. Implication for practice
Based on the results of our meta‐analysis MPSS based‐NIPT can be considered as performant for the detection of 45,X in high‐risk pregnancies. However, this result is based on studies that might contain biases. Moreover, for the other SCAs including 47,XXX, 47,XXY, and 47,XYY, more quality studies are still needed to include in the meta‐analysis in order to ensure the statistical power of the meta‐analysis.
5.2. Implication for research
The results of our review showed that the MPSS NIPT‐based platform had a better performance to detect SCAs in high‐risk pregnancies. Moreover, its test failure rate for SCAs was lower compared to TMPS. Nevertheless, one should note that all of the studies included in the meta‐analysis were susceptible to bias. Therefore, future research should ensure to avoid biases that might occur.
CONFLICT OF INTEREST
The authors confirm that there was no conflict of interest in this project.
AUTHORS’ CONTRIBUTIONS
DR initiated the project. BS drafted the protocol. The protocol was approved by all the authors. BH and CL performed the study's selection, data extraction and assessed the methodological quality of the included studies. SL and FR provided their expertise to validate the clinical and laboratory information to be extracted. JL provided his expertise to validate the statistical approach. BH analyzed the data and finalized the review. All authors critically commented on the manuscript. The manuscript was approved by all authors.
ACKNOWLEDGMENTS
Authors would like to thank the Canadian Institutes for Health Research (CIHR), grant # GP1‐155869 for the financial support.
1.
TABLE A1.
Search strategy
| Database/consultation date | # | Concept | Search strategy | Results | Combination of concepts | |
|---|---|---|---|---|---|---|
| # | Total | |||||
| PubMed/20200611 | #1 | Participant =Pregnancy | Pregnan*[TIAB] OR Gestation[TIAB] OR Fetus*[TIAB] OR “Fetal Structures” [TIAB] OR “Fetal Structure”[TIAB] OR “Fetal Tissue”[TIAB] OR “Fetal Tissues”[TIAB] OR “Pregnancy”[MeSH] OR “Pregnant Women”[MeSH] OR Fetus[MeSH] | 1,110,096 |
#1 AND #2 AND #3 AND #4 |
2,034 |
| #2 | Index test = Non‐invasive prenatal test | “Non‐invasive prenatal test”[TIAB] OR NIPT[TIAB] OR “Cell Free Nucleic Acid”[TIAB] OR “Circulating Nucleic Acids”[TIAB] OR “Cell Free DNA”[TIAB] OR cfDNA[TIAB] OR cirDNA[TIAB] OR “Cell Free Deoxyribonucleic Acid”[TIAB] OR “Circulating DNA”[TIAB] OR “Cell Free RNA”[TIAB] OR cfRNA[TIAB] OR cirRNA[TIAB] OR “Cell Free Ribonucleic Acid”[TIAB] OR “Circulating RNA”[TIAB] OR “Prenatal Diagnosis”[TIAB] OR “Prenatal Diagnoses”[TIAB] OR “Intrauterine Diagnosis”[TIAB] OR “Intrauterine Diagnoses”[TIAB] OR “Antenatal Diagnosis”[TIAB] OR “Antenatal Diagnoses”[TIAB] OR “Prenatal Screening”[TIAB] OR “Antenatal Screening”[TIAB] OR “Prenatal Diagnosis”[MeSH] OR “Cell‐Free Nucleic Acids”[MeSH] | 88,361 | |||
| #3 | Outcome 1 = Test accuracy | "test accuracy"[TIAB] OR sensitivity[TIAB] OR specificity[TIAB] OR “positive predictive value”[TIAB] OR “negative predictive value”[TIAB] OR “sensitivity and specificity”[MeSH] OR “Predictive Value of the Test”[TIAB] | 1,436,981 | |||
| #4 | Outcome 2 = Chromosome Disorders | “Chromosome Disorder”[TIAB] OR “Chromosome Disorders”[TIAB] OR “Chromosomal Disorder”[TIAB] OR “Chromosome Disorders”[TIAB] OR “Chromosome Aberration”[TIAB] OR “Chromosome Aberrations”[TIAB] OR “Chromosomal Aberration”[TIAB] OR “Chromosomal Aberrations”[TIAB] OR “Chromosome Abnormality”[TIAB] OR “Chromosome Abnormalities”[TIAB] OR “Chromosomal Abnormality”[TIAB] OR “Chromosomal Abnormalities”[TIAB] OR “Cytogenetic Abnormality”[TIAB] OR “Cytogenetic Abnormalities”[TIAB] OR “Cytogenetic Aberration”[TIAB] OR “Cytogenetic Aberrations”[TIAB] OR “Autosome Abnormality”[TIAB] OR “Autosome Abnormalities”[TIAB] OR Aneuploid*[TIAB] OR “chromosome imbalance”[TIAB] OR “chromosomal imbalance”[TIAB] OR "Chromosome Disorders"[MeSH] OR “Chromosome Aberrations”[MeSH] OR Aneuploidy[MeSH] | 216,262 | |||
| Embase/20200611 | #1 | Participant =Pregnancy | Pregnan*:ti,ab OR Gestation:ti,ab OR Fetus*:ti,ab OR “Fetal Structure*”:ti,ab OR “Fetal Tissue*”:ti,ab OR “pregnancy”/exp OR “pregnant woman”/exp OR Fetus/exp | 1,224,399 |
#1 AND #2 AND #3 AND #4 |
1,919 |
| #2 | Index test = Non‐invasive prenatal test | “Non‐invasive prenatal test*”:ti,ab OR NIPT:ti,ab OR “Cell Free Nucleic Acid*”:ti,ab OR “Circulating Nucleic Acid*”:ti,ab OR “Cell Free DNA”:ti,ab OR cfDNA:ti,ab OR cirDNA:ti,ab OR “Cell Free Deoxyribonucleic Acid”:ti,ab OR “Circulating DNA”:ti,ab OR “Cell Free RNA”:ti,ab OR cfRNA:ti,ab OR cirRNA:ti,ab OR “Cell Free Ribonucleic Acid”:ti,ab OR “Circulating RNA”:ti,ab OR “Prenatal Diagnos*”:ti,ab OR “Intrauterine Diagnos*”:ti,ab OR “Antenatal Diagnos*”:ti,ab OR “Prenatal Screening”:ti,ab OR “Antenatal Screening”:ti,ab OR “Prenatal Diagnosis”/exp OR “Cell‐Free Nucleic Acids”/exp | 129,350 | |||
| #3 | Outcome 1 = Test accuracy | “test accuracy”:ti,ab OR sensitivity:ti,ab OR specificity:ti,ab OR “positive predictive value*”:ti,ab OR “negative predictive value*”:ti,ab OR “predictive value of test*”:ti,ab OR “sensitivity and specificity”/exp OR “predictive value”/exp | 1,551,179 | |||
| #4 | Outcome 2 = Chromosome Disorders | “Chromosom* Disorder*”:ti,ab OR “Chromosom* Aberration*”:ti,ab OR “Chromosom* Abnormalit*”:ti,ab OR “Cytogenetic Abnormalit*”:ti,ab OR “Cytogenetic Aberration*”:ti,ab OR “Autosome Abnormalit*”:ti,ab OR Aneuploid*:ti,ab OR “chromosom* imbalance”:ti,ab OR “Chromosome Disorders”/exp OR “Chromosome Aberrations”/exp OR Aneuploidy/exp | 255,660 | |||
| Cochrane Library/20200611 | #1 | Participant =Pregnancy | (Pregnan*):ti,ab,kw OR (Gestation):ti,ab,kw OR (Fetus*):ti,ab,kw OR (“Fetal Structure*”):ti,ab,kw OR (“Fetal Tissue*”):ti,ab,kw OR [mh “pregnancy”] OR [mh “pregnant woman”] OR [mh “Fetus”] | 66,902 |
#1 AND #2 AND #3 AND #4 |
23 |
| #3 | Index test = Non‐invasive prenatal test | (“Non‐invasive prenatal test*”):ti,ab,kw OR (NIPT):ti,ab,kw OR (“Cell Free Nucleic Acid*”):ti,ab,kw OR (“Circulating Nucleic Acid*”):ti,ab,kw OR (“Cell Free DNA”):ti,ab,kw OR (cfDNA):ti,ab,kw OR (cirDNA):ti,ab,kw OR (“Cell Free Deoxyribonucleic Acid*”):ti,ab,kw OR (“Circulating DNA”):ti,ab,kw OR (“Cell Free RNA”):ti,ab,kw OR (cfRNA):ti,ab,kw OR (cirRNA):ti,ab,kw OR (“Cell Free Ribonucleic Acid*”):ti,ab,kw OR (“Circulating RNA”):ti,ab,kw OR (“Prenatal Diagnos*”):ti,ab,kw OR (“Intrauterine Diagnos*”):ti,ab,kw OR (“Antenatal Diagnos*”):ti,ab,kw OR (“Prenatal Screening”):ti,ab,kw OR (“Antenatal Screening”):ti,ab,kw OR [mh “Prenatal Diagnosis”] OR [mh “Cell‐Free Nucleic Acids”] | 1,028 | |||
| #5 | Outcome 1 = Test accuracy | (“test accuracy”):ti,ab,kw OR (sensitivity):ti,ab,kw OR (specificity):ti,ab,kw OR (“positive predictive value”):ti,ab,kw OR (“negative predictive value”):ti,ab,kw OR (“predictive value of tests”):ti,ab,kw OR [mh “sensitivity and specificity”] OR [mh “predictive value”] | 65,443 | |||
| #7 | Outcome 2 = Chromosome Disorders | (“Chromosom* Disorder*”):ti,ab,kw OR (“Chromosom* Aberration*”):ti,ab,kw OR (“Chromosom* Abnormalit*”):ti,ab,kw OR (“Cytogenetic Abnormalit*”):ti,ab,kw OR (“Cytogenetic Aberration*”):ti,ab,kw OR (“Autosome Abnormalit*”):ti,ab,kw OR (Aneuploid*):ti,ab,kw OR (“chromosom* imbalance”):ti,ab,kw OR [mh “Chromosome Disorders”] OR [mh “Chromosome Aberrations”] OR [mh “Aneuploidy”] | 1,625 | |||
| Web of Sciences/20200611 | #1 | Participant =Pregnancy | TS=(Pregnan* OR Gestation OR Fetus* OR “Fetal Structure*” OR “Fetal Tissue*”) | 1,070,478 |
#1 AND #2 AND #3 AND #4 |
337 |
| #2 | Index test =Non‐invasive prenatal test | TS=(“Non‐invasive prenatal test” OR NIPT OR “Cell Free Nucleic Acid*” OR “Circulating Nucleic Acid*” OR Cell “Free DNA OR cfDNA” OR cirDNA OR “Cell Free Deoxyribonucleic Acid*” OR “Circulating DNA OR Cell Free RNA” OR cfRNA OR cirRNA OR “Cell Free Ribonucleic Acid*” OR “Circulating RNA OR Prenatal Diagnos*” OR “Intrauterine Diagnos*” OR “Antenatal Diagnos*” OR “Prenatal Screening” OR “Antenatal Screening”) | 9,049 | |||
| #3 | Outcome 1 = Test accuracy | TS=(“test accuracy” OR sensitivity OR specificity OR “positive predictive value*” OR “negative predictive value*” OR “predictive value of tests”) | 1,858,994 | |||
| #4 | Outcome 2 = Chromosome Disorders | Ts=(“Chromosom* Disorder*” OR “Chromosom* Aberration*” OR “Chromosom* Abnormalit*” OR “Cytogenetic Abnormalit*” OR “Cytogenetic Aberration*” OR “Autosome Abnormalit*” OR Aneuploid* OR “chromosom* imbalance”) | 107,251 |
TABLE A2.
QUADAS‐2 tool for assessing the methodological quality of included studies
| Domain | Patients selection | Index test | Reference standard | Flow and timing |
|---|---|---|---|---|
| Signaling Question (yes, no, or unclear) | Was a consecutive or random sample of patients enrolled? | Were the index test results interpreted without knowledge of the results of the reference standard? | Is the reference standard likely to correctly classify the target condition? | Was there an appropriate interval between gNIPT and reference standard? |
| Was a case‐control design avoided? | If a threshold was used, was it pre‐specified? | Were the reference standard results interpreted without knowledge of the results of the index test? | Did all analyzed patients receive the reference standard? | |
| Did the study avoid inappropriate exclusions? | Were all patients included in the analysis? | |||
| Risk of bias (high, low or, unclear) | Could the selection of patients have introduced bias? | Could the conduct or interpretation of the index test have introduced bias? | Could the reference standard, its conduct, or its interpretation have introduced bias? | Could the patient flow have introduced bias? |
| Concerns about Applicability (high, low or, unclear) | Are there concerns that the included patients and setting do not match the review question? | Are there concerns that the index test, its conduct, or interpretation differ from the review question? | Are there concerns that the target condition as defined by the reference standard does not match the review question? |
Funding information
Canadian Institutes for Health Research (CIHR), grant # GP1‐155869.
DATA AVAILABILITY STATEMENT
The data that support the findings of this study are available from the corresponding author upon reasonable request.
REFERENCES
- Alldred, S. K. , Deeks, J. J. , Guo, B. , Neilson, J. P. , & Alfirevic, Z. (2012). Second trimester serum tests for Down's Syndrome screening. Cochrane Database of Systematic Reviews, (6, 6), Cd009925. 10.1002/14651858.Cd009925 [DOI] [PMC free article] [PubMed] [Google Scholar]
- Alldred, S. K. , Takwoingi, Y. , Guo, B. , Pennant, M. , Deeks, J. J. , Neilson, J. P. , & Alfirevic, Z. (2017). First and second trimester serum tests with and without first trimester ultrasound tests for Down's syndrome screening. Cochrane Database Systematic Review, 3, Cd012599. 10.1002/14651858.Cd012599 [DOI] [PMC free article] [PubMed] [Google Scholar]
- Badeau, M. , Lindsay, C. , Blais, J. , Nshimyumukiza, L. , Takwoingi, Y. , Langlois, S. , Légaré, F. , Giguère, Y. , Turgeon, A. F. , Witteman, W. , & Rousseau, F. (2017). Genomics‐based non‐invasive prenatal testing for detection of fetal chromosomal aneuploidy in pregnant women. Cochrane Database Systematic Review, 11, Cd011767. 10.1002/14651858.CD011767.pub2 [DOI] [PMC free article] [PubMed] [Google Scholar]
- Benn, P. , Borrell, A. , Chiu, R. W. K. , Cuckle, H. , Dugoff, L. , Faas, B. , Gross, S. , Huang, T. , Johnson, J. , Maymon, R. , Norton, M. , Odibo, A. , Schielen, P. , Spencer, K. , Wright, D. , & Yaron, Y. (2015). Position statement from the Chromosome Abnormality Screening Committee on behalf of the Board of the International Society for Prenatal Diagnosis. Prenatal Diagnosis, 35(8), 725–734. 10.1002/pd.4608 [DOI] [PubMed] [Google Scholar]
- Bianchi, D. W. , & Chiu, R. W. K. (2018). Sequencing of circulating cell‐free DNA during pregnancy. New England Journal of Medicine, 379(5), 464–473. 10.1056/NEJMra1705345 [DOI] [PMC free article] [PubMed] [Google Scholar]
- Bianchi, D. W. , Platt, L. D. , Goldberg, J. D. , Abuhamad, A. Z. , Sehnert, A. J. , & Rava, R. P. (2012). Genome‐wide fetal aneuploidy detection by maternal plasma DNA sequencing. Obstetrics and Gynecology, 119(5), 890–901. [DOI] [PubMed] [Google Scholar]
- Bianchi, D. W. , Prosen, T. , Platt, L. D. , Goldberg, J. D. , Abuhamad, A. Z. , Rava, R. P. , & Sehnert, A. J. (2013). Massively parallel sequencing of maternal plasma DNA in 113 cases of fetal nuchal cystic hygroma. Obstetrics and Gynecology, 121(5), 1057–1062. [DOI] [PubMed] [Google Scholar]
- Gil, M. M. , Accurti, V. , Santacruz, B. , Plana, M. N. , & Nicolaides, K. H. (2017). Analysis of cell‐free DNA in maternal blood in screening for aneuploidies: updated meta‐analysis. Ultrasound in Obstetrics and Gynecology, 50(3), 302–314. 10.1002/uog.17484 [DOI] [PubMed] [Google Scholar]
- Groth, K. A. , Skakkebæk, A. , Høst, C. , Gravholt, C. H. , & Bojesen, A. (2013). Klinefelter syndrome—A clinical update. The Journal of Clinical Endocrinology & Metabolism, 98(1), 20–30. 10.1210/jc.2012-2382 [DOI] [PubMed] [Google Scholar]
- Hooks, J. , Wolfberg, A. J. , Wang, E. T. , Struble, C. A. , Zahn, J. , Juneau, K. , Mohseni, M. , Huang, S. , Bogard, P. , Song, K. , Oliphant, A. , & Musci, T. J. (2014). Non‐invasive risk assessment of fetal sex chromosome aneuploidy through directed analysis and incorporation of fetal fraction. Prenatal Diagnosis, 34(5), 496–499. [DOI] [PubMed] [Google Scholar]
- Ivashchenko, T. E. , Vashukova, E. S. , Kozyulina, P. Y. , Dvoynova, N. M. , Talantova, O. E. , Koroteev, A. L. , Pendina, A. A. , Tikhonov, A. V. , Chiryaeva, O. G. , Petrova, L. I. , Dudkina, V. S. , Efimova, O. A. , Baranov, V. S. , & Glotov, A. S. (2019). Noninvasive prenatal testing using next generation sequencing: Pilot experience of the D.O. Ott research institute of obstetrics, gynecology and reproductology. Russian Journal of Genetics, 55(10), 1208–1213. [Google Scholar]
- Jiang, F. , Ren, J. , Chen, F. , Zhou, Y. , Xie, J. , Dan, S. , Su, Y. , Xie, J. , Yin, B. , Su, W. , Zhang, H. , Wang, W. , Chai, X. , Lin, L. , Guo, H. , Li, Q. , Li, P. , Yuan, Y. , Pan, X. , … Zhang, X. (2012). Noninvasive Fetal Trisomy (NIFTY) test: an advanced noninvasive prenatal diagnosis methodology for fetal autosomal and sex chromosomal aneuploidies. BMC Medical Genomics, 5, 57. [DOI] [PMC free article] [PubMed] [Google Scholar]
- Lau, T. K. , Chen, F. , Pan, X. , Pooh, R. K. , Jiang, F. , Li, Y. , Jiang, H. , Li, X. , Chen, S. , & Zhang, X. (2012). Noninvasive prenatal diagnosis of common fetal chromosomal aneuploidies by maternal plasma DNA sequencing. The Journal of Maternal‐Fetal & Neonatal Medicine, 25(8), 1370–1374. [DOI] [PubMed] [Google Scholar]
- Lefkowitz, R. B. , Tynan, J. A. , Liu, T. , Wu, Y. , Mazloom, A. R. , Almasri, E. , Hogg, G. , Angkachatchai, V. , Zhao, C. , Grosu, D. S. , McLennan, G. , & Ehrich, M. (2016). Clinical validation of a noninvasive prenatal test for genomewide detection of fetal copy number variants. American Journal of Obstetrics and Gynecology, 215(2), 227.e221‐227.e216. [DOI] [PubMed] [Google Scholar]
- Liang, D. , Lv, W. , Wang, H. , Xu, L. , Liu, J. , Li, H. , Hu, L. , Peng, Y. , & Wu, L. (2013). Non‐invasive prenatal testing of fetal whole chromosome aneuploidy by massively parallel sequencing. Prenatal Diagnosis, 33(5), 409–415. [DOI] [PubMed] [Google Scholar]
- Li, H. , Lei, Y. , Zhu, H. , Luo, Y. , Qian, Y. , Chen, M. , Sun, Y. , Yan, K. , Yang, Y. , Liu, B. , Wang, L. , Huang, Y. , Hu, J. , Xu, J. , & Dong, M. (2018). The application of NIPT using combinatorial probe‐anchor synthesis to identify sex chromosomal aneuploidies (SCAs) in a cohort of 570 pregnancies. Molecular Cytogenetics, 11, 59. [DOI] [PMC free article] [PubMed] [Google Scholar]
- Liu, H. Y. , Wu, D. , Li, H. , Guo, S. K. , Zhang, C. Y. , Liao, S. X. , & Wang, Y. T. (2012). Significance of detecting free DNA from maternal plasma for the diagnosis of fetal chromosomal aneuploidies. Zhonghua Yi Xue Yi Chuan Xue Za Zhi, 29(4), 435–438. [DOI] [PubMed] [Google Scholar]
- Mazloom, A. R. , Dzakula, Z. , Oeth, P. , Wang, H. , Jensen, T. , Tynan, J. , McCullough, R. , Saldivar, J. S. , Ehrich, M. , van den Boom, D. , Bombard, A. T. , Maeder, M. , McLennan, G. , Meschino, W. , Palomaki, G. E. , Canick, J. A. , & Deciu, C. (2013). "Noninvasive prenatal detection of sex chromosomal aneuploidies by sequencing circulating cell‐free DNA from maternal plasma. Prenatal Diagnosis, 33(6), 591–597. [DOI] [PubMed] [Google Scholar]
- McHugh, M. L. (2012). Interrater reliability: the kappa statistic. Biochemia Medica (Zagreb), 22(3), 276–282. [PMC free article] [PubMed] [Google Scholar]
- (2019). Noninvasive prenatal testing for trisomies 21, 18, and 13, sex chromosome aneuploidies, and microdeletions: A health technology assessment. Ontario Health Technology Assessment Series, 19(4), 1–166. [PMC free article] [PubMed] [Google Scholar]
- Nicolaides, K. H. , Musci, T. J. , Struble, C. A. , Syngelaki, A. , & Gil, M. M. (2014). Assessment of fetal sex chromosome aneuploidy using directed cell‐free DNA analysis. Fetal Diagnosis and Therapy, 35(1), 1–6. [DOI] [PubMed] [Google Scholar]
- Nicolaides, K. H. , Syngelaki, A. , Gil, M. , Atanasova, V. , & Markova, D. (2013). Validation of targeted sequencing of single‐nucleotide polymorphisms for non‐invasive prenatal detection of aneuploidy of chromosomes 13, 18, 21, X, and Y. Prenatal Diagnosis, 33(6), 575–579. [DOI] [PubMed] [Google Scholar]
- Palomaki, G. E. , & Kloza, E. M. (2018). Prenatal cell‐free DNA screening test failures: a systematic review of failure rates, risks of Down syndrome, and impact of repeat testing. Genetics in Medicine, 20(11), 1312–1323. 10.1038/gim.2018.22 [DOI] [PubMed] [Google Scholar]
- Pergament, E. , Cuckle, H. , Zimmermann, B. , Banjevic, M. , Sigurjonsson, S. , Ryan, A. , Hall, M. P. , Dodd, M. , Lacroute, P. , Stosic, M. , Chopra, N. , Hunkapiller, N. , Prosen, D. E. , McAdoo, S. , Demko, Z. , Siddiqui, A. , Hill, M. , & Rabinowitz, M. (2014). Single‐nucleotide polymorphism‐based noninvasive prenatal screening in a high‐risk and low‐risk cohort. Obstetrics and Gynecology, 124(2 Pt 1), 210–218. [DOI] [PMC free article] [PubMed] [Google Scholar]
- Persico, N. , Boito, S. , Ischia, B. , Cordisco, A. , De Robertis, V. , Fabietti, I. , Periti, E. , Volpe, P. , Fedele, L. , & Rembouskos, G. (2016). Cell‐free DNA testing in the maternal blood in high‐risk pregnancies after first‐trimester combined screening. Prenatal Diagnosis, 36(3), 232–236. [DOI] [PubMed] [Google Scholar]
- Porreco, R. P. , Garite, T. J. , Maurel, K. , Marusiak, B. , Ehrich, M. , van den Boom, D. , Deciu, C. , & Bombard, A. (2014). Noninvasive prenatal screening for fetal trisomies 21, 18, 13 and the common sex chromosome aneuploidies from maternal blood using massively parallel genomic sequencing of DNA. American Journal of Obstetrics and Gynecology, 211(4), 365.e361–312. [DOI] [PubMed] [Google Scholar]
- PRISMA . (2015). PRISMA Checklist. http://www.prisma‐statement.org/PRISMAStatement/Checklist
- Rafique, M. , AlObaid, S. , & Al‐Jaroudi, D. (2019). 47, XXX syndrome with infertility, premature ovarian insufficiency, and streak ovaries. Clinical Case Reports, 7(6), 1238–1241. 10.1002/ccr3.2207 [DOI] [PMC free article] [PubMed] [Google Scholar]
- Riley, R. D. , Higgins, J. P. T. , & Deeks, J. J. (2011). Interpretation of random effects meta‐analyses. BMJ, 342, d549. 10.1136/bmj.d549 [DOI] [PubMed] [Google Scholar]
- Skuse, D. , Printzlau, F. , & Wolstencroft, J. (2018). Sex chromosome aneuploidies. Handbook of Clinical Neurology, 147, 355–376. 10.1016/b978-0-444-63233-3.00024-5 [DOI] [PubMed] [Google Scholar]
- Samango‐Sprouse, C. , Banjevic, M. , Ryan, A. , Sigurjonsson, S. , Zimmermann, B. , Hill, M. , Hall, M. P. , Westemeyer, M. , Saucier, J. , Demko, Z. , & Rabinowitz, M. (2013). SNP‐based non‐invasive prenatal testing detects sex chromosome aneuploidies with high accuracy. Prenatal Diagnosis, 33(7), 643–649. [DOI] [PMC free article] [PubMed] [Google Scholar]
- Sehnert, A. J. , Rhees, B. , Comstock, D. , de Feo, E. , Heilek, G. , Burke, J. , & Rava, R. P. (2011). Optimal detection of fetal chromosomal abnormalities by massively parallel DNA sequencing of cell‐free fetal DNA from maternal blood. Clinical Chemistry, 57(7), 1042–1049. [DOI] [PubMed] [Google Scholar]
- Shaw, S. W. , Hsiao, C. H. , Chen, C. Y. , Ren, Y. , Tian, F. , Tsai, C. , Chen, M. , & Cheng, P. J. (2014). Noninvasive prenatal testing for whole fetal chromosomal aneuploidies: a multicenter prospective cohort trial in Taiwan. Fetal Diagnosis and Therapy, 35(1), 13–17. [DOI] [PubMed] [Google Scholar]
- Song, Y. , Huang, S. , Zhou, X. , Jiang, Y. , Qi, Q. , Bian, X. , Zhang, J. , Yan, Y. , Cram, D. S. , & Liu, J. (2015). Non‐invasive prenatal testing for fetal aneuploidies in the first trimester of pregnancy. Ultrasound in Obstetrics and Gynecology, 45(1), 55–60. [DOI] [PubMed] [Google Scholar]
- Surerus, E. , Huggon, I. C. , & Allan, L. D. (2003). Turner's syndrome in fetal life. Ultrasound in Obstetrics and Gynecology, 22(3), 264–267. 10.1002/uog.151 [DOI] [PubMed] [Google Scholar]
- von Hippel, P. T. (2015). The heterogeneity statistic I(2) can be biased in small meta‐analyses. BMC Medical Research Methodology, 15, 35. 10.1186/s12874-015-0024-z [DOI] [PMC free article] [PubMed] [Google Scholar]
- Whiting, P. F. , Rutjes, A. W. , Westwood, M. E. , Mallett, S. , Deeks, J. J. , Reitsma, J. B. , & Bossuyt, P. M. (2011). QUADAS‐2: a revised tool for the quality assessment of diagnostic accuracy studies. Annals of Internal Medicine, 155(8), 529–536. 10.7326/0003-4819-155-8-201110180-00009 [DOI] [PubMed] [Google Scholar]
- Xie, X. , Wang, M. , Goh, E.‐Y. , Ungar, W. J. , Little, J. , Carroll, J. C. , Okun, N. , Huang, T. , Rousseau, F. , Dougan, S. D. , Tu, H. A. , Higgins, C. , Holubowich, C. , Sikich, N. , Dhalla, I. A. , & Ng, V. (2020). Noninvasive prenatal testing for trisomies 21, 18, and 13, sex chromosome aneuploidies, and microdeletions in average‐risk pregnancies: A cost‐effectiveness analysis. Journal of Obstetrics and Gynaecology Canada, 42(6), 740–749.e12. 10.1016/j.jogc.2019.12.007 [DOI] [PubMed] [Google Scholar]
- Zhu, Y. , Shan, Q. , Zheng, J. , Cai, Q. , Yang, H. , Zhang, J. , Du, X. , & Jin, F. (2019). Comparison of efficiencies of non‐invasive prenatal testing, karyotyping, and chromosomal micro‐array for diagnosing fetal chromosomal anomalies in the second and third trimesters. Frontiers in Genetics, 10, 69. [DOI] [PMC free article] [PubMed] [Google Scholar]
Associated Data
This section collects any data citations, data availability statements, or supplementary materials included in this article.
Data Availability Statement
The data that support the findings of this study are available from the corresponding author upon reasonable request.


