

Abstract
In this study, we focus on the following question: do genomic regions enriched in cancer variant mutations have significantly different chromatin folding patterns? We utilize publicly available Hi-C data to characterize chromatin folding patterns in healthy (GM12878) and cancer (K562) cells based on status of A/B compartmentalization and random vs non-random chromatin physical interactions. We then perform statistical testing to assess if chromatin folding patterns in cancer variant-enriched loci are significantly different from non-enriched loci. Our results indicate that loci with cancer variant status have significantly altered (FDR < 0.05) chromatin folding patterns.
Index Terms—: Chromatin folding, Hi-C, Nuclear organization, Cancer
I. Introduction
Nuclear organization plays a fundamental role in genomic regulation. To understand this organization, analysis of 3-D chromatin structure is important as it allows insight into important cellular processes such as DNA replication and gene transcription [1].
Advances in experimental techniques, such as high-throughput chromosome conformation capture (3C, 5C, Hi-C) [2], [3], have increased our understanding of nuclear organization by quantifying pairwise interaction frequencies among genomic loci. Coarse-grained analysis of Hi-C interaction data has revealed the presence of two primary genomic compartments: 1) the A compartment associated with gene rich regions undergoing active gene transcription; 2) the B compartment associated with gene poor regions and relatively inactive gene transcription [3]. Furthermore, genomic regions with the same compartment status were found to preferentially interact with each other [3].
In this study, we explore how cancer-associated mutations in non-coding regions are related to nuclear organization. With the rapid advent of cancer genome projects, many mutation variants have been identified in different cancer types. Previous studies on cancer-related variants in chromatin structure have focused on topologically associated domains (TADs) [4], specifically, whether TAD boundaries are disrupted in cancer cells [5]. The effects of cancer somatic mutation rates on genomic A/B compartments has also been examined [15].
While most variants in tumor samples lie in non-coding regions [8], to the best of our knowledge, their roles in nuclear organization have not been elucidated. In this work, we analyze publicly available Hi-C data from healthy GM12878 cells and cancerous K562 cells [17]. Both cell lines are of haematopoietic origin and provide a basis for comparing how chromatin folding patterns between cancer variant-enriched loci may differ from non-variant loci. Our results indicate that loci enriched in cancer variant mutations have statistically different folding patterns.
II. Method
In this paper, we develop a technique to assess whether chromatin folding patterns in cancer mutation-enriched loci are significantly different from those in non-mutated loci. At a given locus, we define a chromatin folding state based on two considerations: 1) whether it is within an A or B compartment, and 2) whether it is enriched with non-random, physical chromatin interactions. We are especially interested in loci experiencing folding transitions - namely, the locus folding state is altered when the locus transitions from a healthy state to a cancerous state during oncogenesis.
As there are 4 different folding states depending on A/B compartment status and random/non-random nature, there are in turn 16 different folding state transitions a locus may undergo when a cell progresses from healthy to cancerous. Specifically, at a given locus, a folding state transition is defined as the pairwise combination of the chromatin folding state in the healthy cell along with the folding state in the cancer cell. For a given transition type, we summarize all occurrences of this transition along a chromosome and consider the chromatin transition pattern as the aggregated transition counts of this type relative to all other 15 transition types. We then stratify these chromatin transition patterns based on cancer-variant status to determine if there is a significant difference among mutated loci relative to non-mutated loci. Fig. 1 summarizes our analysis pipeline.
Fig. 1:
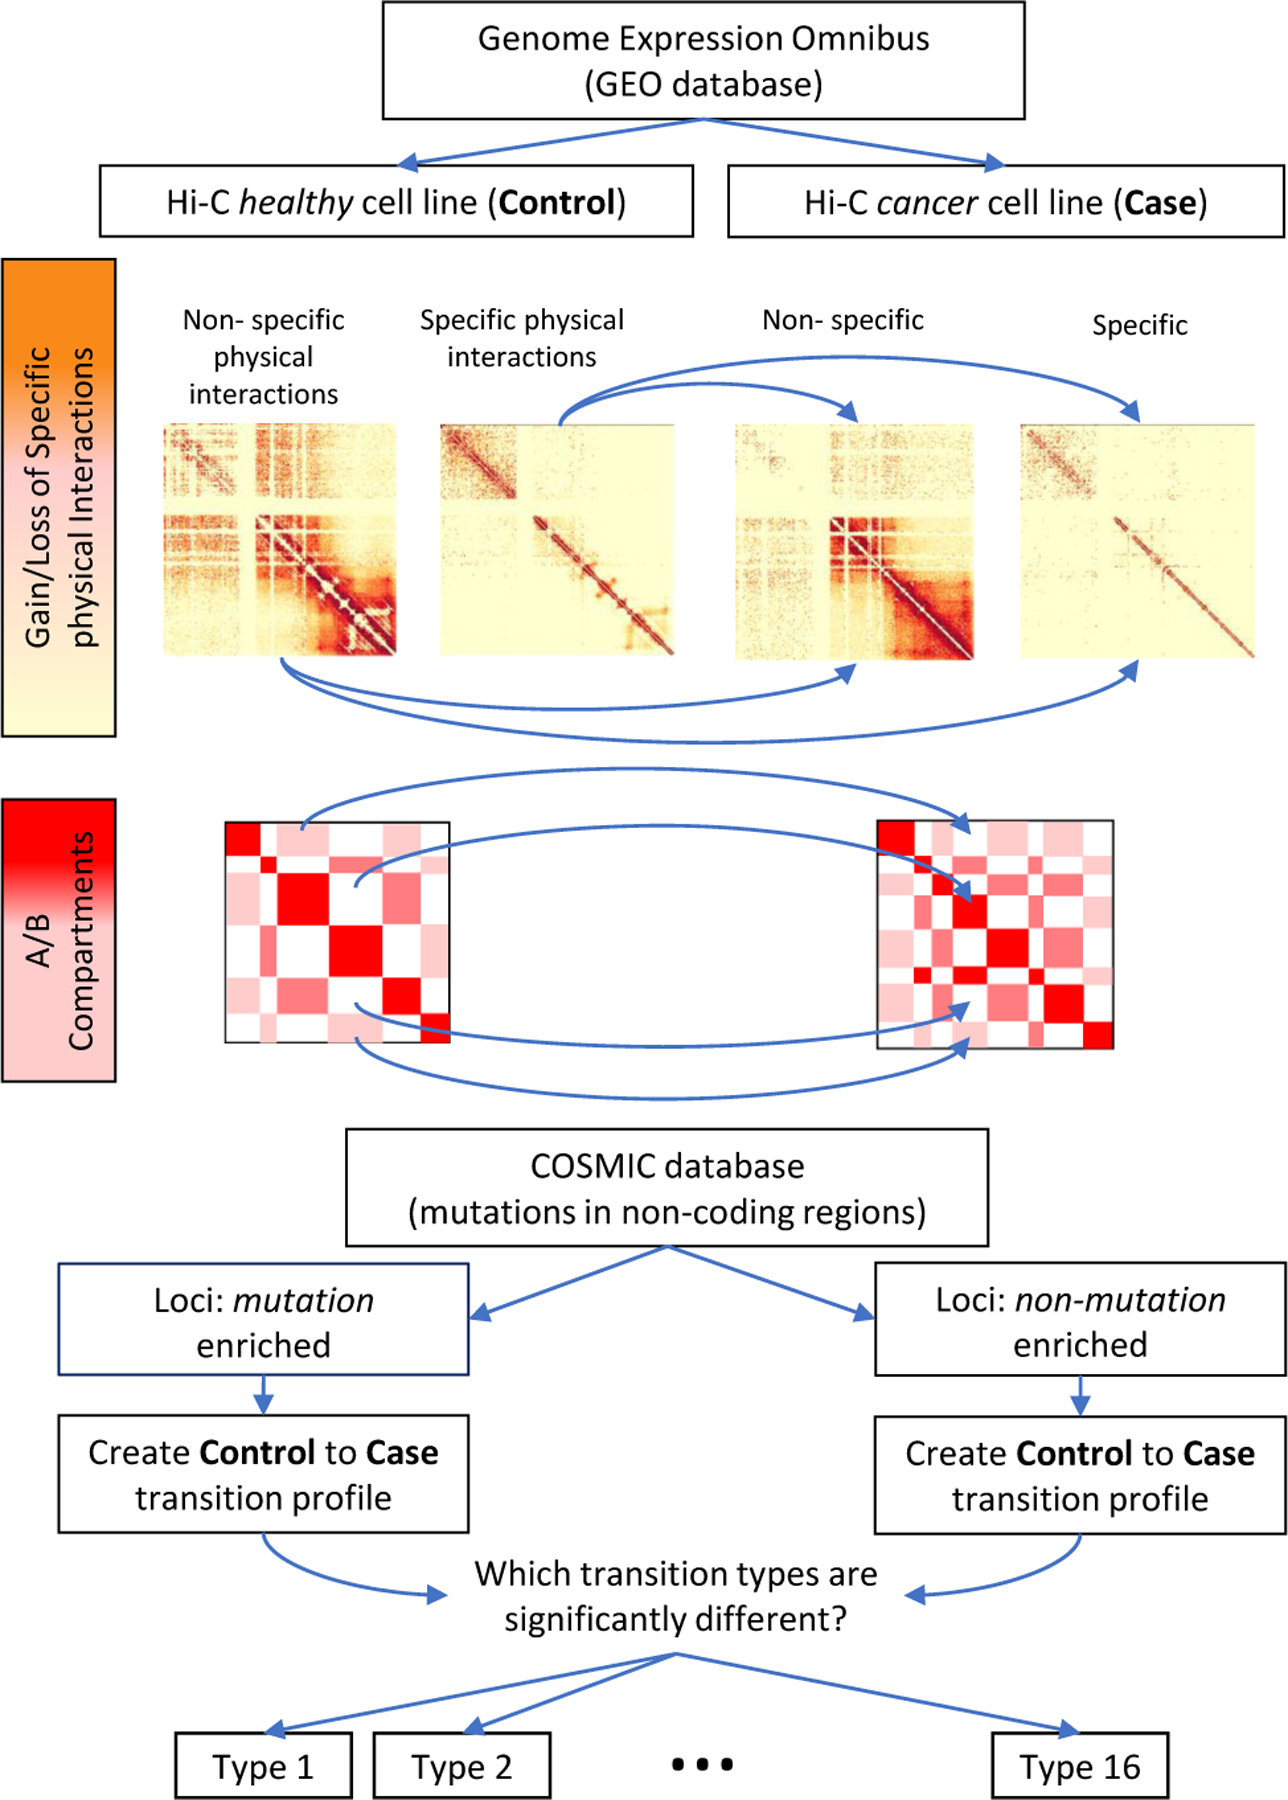
Overview of analysis pipeline
A. Classification of A/B Compartments
Lieberman-Aiden et al divided the genome into A and B compartments based on principal component analysis of Hi-C pairwise interaction frequencies [3]. Clustering-based compartment designation for the GM12878 cell line is available from data in [17]. As no such classification is publicly available for the K562 cell line, we instead used JUICER to classify genomic regions into A and B compartments for both GM12878 and K562 cell lines [20]. Cross-examination showed that JUICER can provide reliable A/B classification, with a similarity of 81%, 90%, and 94% for chromosomes 1, 20, and 22, respectively, when compared with the clustering A/B designations reported in [17].
B. Identification of Specific Physical Interactions
A significant challenge in interpreting data from chromosome conformation capture studies such as Hi-C is the presence of large amounts of non-specific (i.e. random) interactions (~77–87% according to [9]). These non-specific interactions are likely due to the effects of polymer connectivity, nuclear confinement, and excluded volume; often, these interactions are of limited biological significance [6].
We followed the general approach of [6] with an 11 nanometer fiber model [21] to distinguish specific physical interactions from non-specific interactions, see Fig. 2. Briefly, we generated two random ensembles for GM12878 and K562, each with 10,000 polymer chains consisting of 400 spherical monomer nodes. Individual monomer nodes had a diameter of approximately 40 nanometers and represented roughly 5 kilobases of DNA, the resolution of the Hi-C data; this equates to each polymer chain representing a single locus consisting of 2 megabases of DNA. To model the effects of confinement and volume exclusion, we constrained each polymer chain to reside within a spherical nuclear volume and also to be self-avoiding. Nuclear diameters for GM12878 and K562 were based on measurements reported in [18] and [19] respectively; the nuclear diameters were scaled to approximately 520 nm and 950 nm to preserve a constant base pair density relative to the entire genome.
Fig. 2:
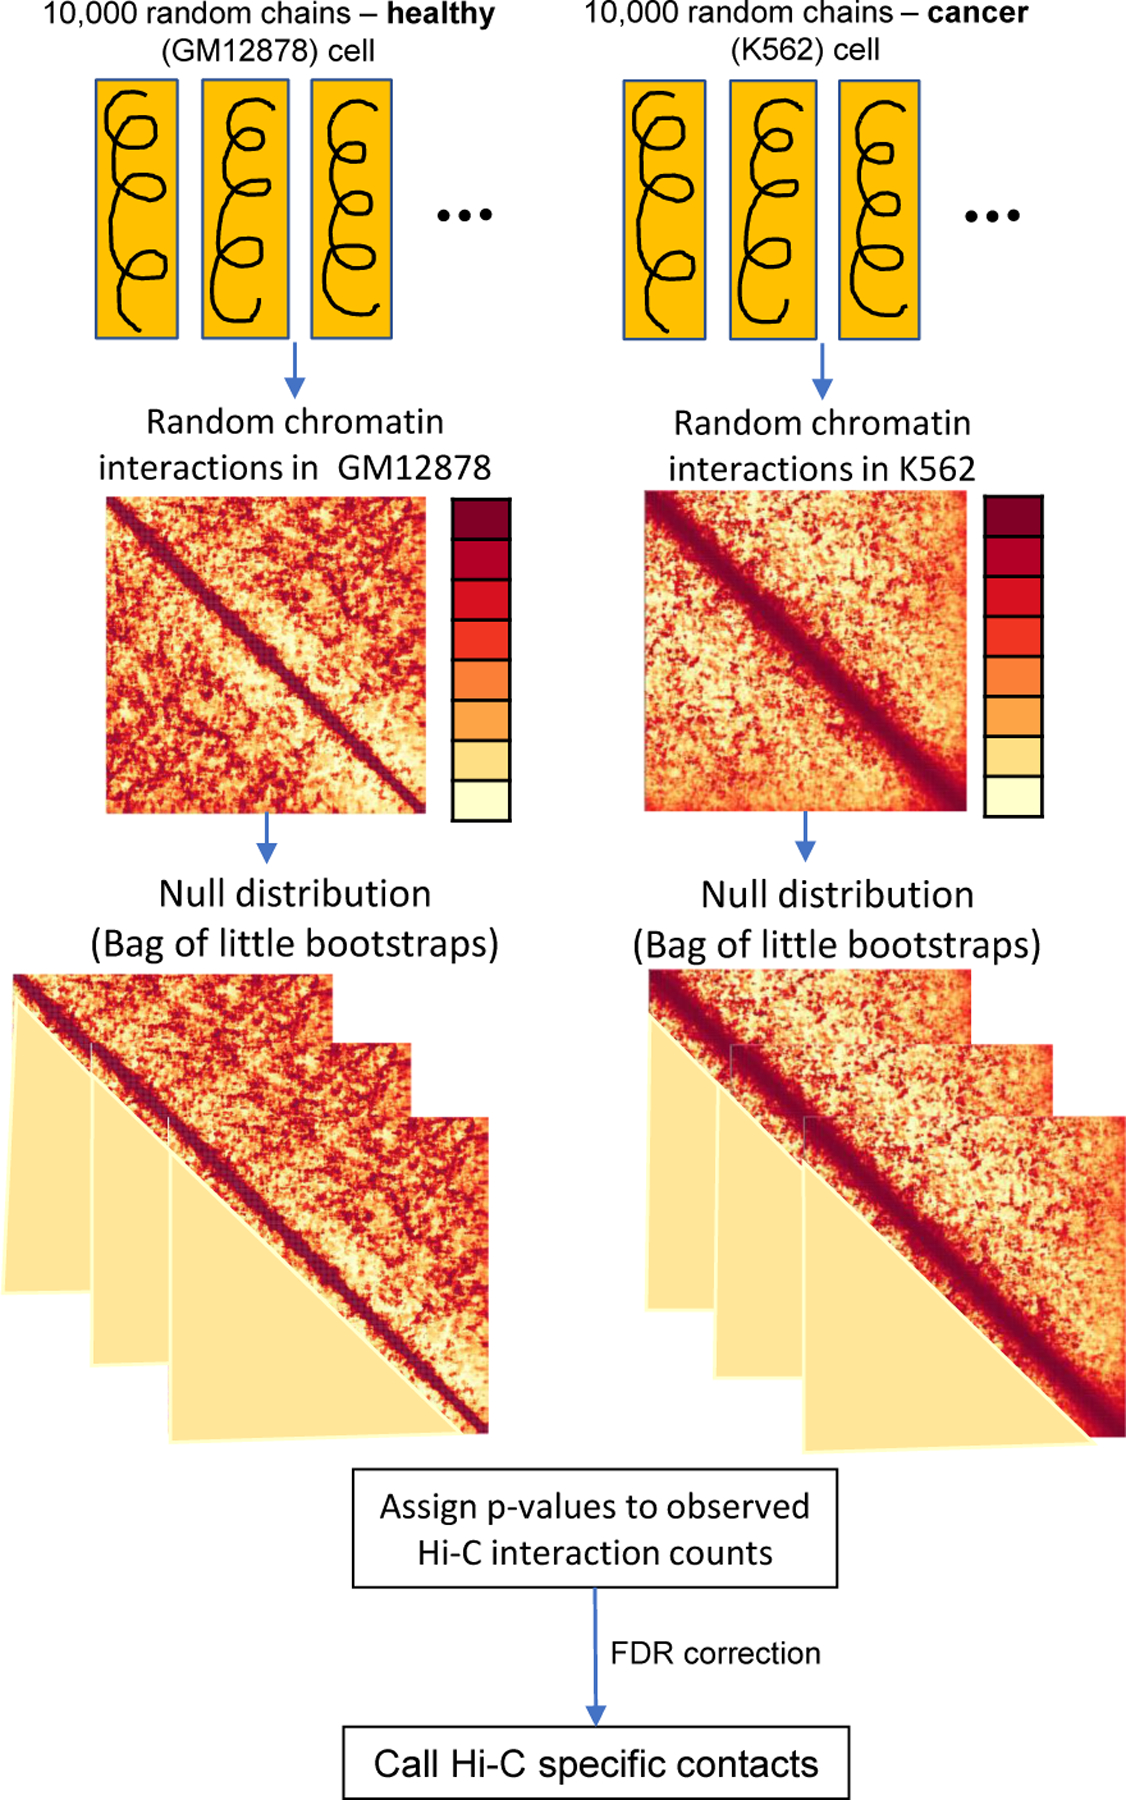
Polymer modeling procedure for identifying specific (i.e. non-random) interactions in healthy (GM12878) and cancer (K562) cells.
For each ensemble (GM12878 and K562), we used Bag of Little Bootstraps [23] resampling - with 5,000 outer replicates consisting of approximately 4,000 unique polymers per replicate - to generate a null distribution over random chromatin interactions; where, following [22], two chromatin nodes are interacting if their Euclidean distance is ≤ 80 nanometers. We assigned p-values to the observed Hi-C interaction frequencies according to the proportion of same genomic-distance interactions in the bootstrap null distribution that exceeded the observed Hi-C value. After multiple test correction [24], we call specific chromatin physical contacts as those with false discovery rate (FDR) below a significance threshold α. To account for uncertainty in the significance threshold, we used two α values of 0.01 and 0.05.
C. Locus Enrichment of Specific Physical Interactions
Based on the chosen α significance threshold, we tabulated the number of specific interactions assigned to each 5 KB interval along the entire length of the chromosome. Note, specific interactions are limited to within 2 MB of each 5 KB bin. We then labeled each 5 KB bin as specific if its participation exceeded a threshold number of specific contacts. To account for uncertainty in the precise threshold parameter, we used multiple threshold counts. These correspond to the 50%, 75%, 90%, and 95% quantiles among the observed distribution of specific interaction counts at each 5 KB locus.
D. Locus Enrichment of COSMIC Cancer Mutations
Using the COSMIC database [26], we mapped each cancer variant mutation to its corresponding 5 KB bin to match the resolution of the Hi-C data. We then labeled each 5 KB bin (i.e. locus) as mutation-enriched if the number of mutations exceeded a threshold count. For our study, we used several thresholds to account for uncertainty. We used threshold counts corresponding to the 1%, 5%, 10%, 25%, 50%, 75%, and 90% quantiles among the observed distribution of mutation counts at each 5 KB locus.
E. Contingency Table Analysis
For a given transition type at a chromosome, we examine different choices of α (if a Hi-C contact pair is specific), the threshold determining if a locus is enriched with non-random physical interactions, and the threshold determining if this locus is enriched in cancer-variants. We record i) the counts of this transition type and ii) all other transition types, and then stratify into a) counts from mutation-enriched loci and b) counts from control (non-enriched) loci.
These counts are organized into a 2×2 contingency table. With different α values and enrichment thresholds, we have altogether 2×4×7 (α, quantiles for physical interactions in a locus, and quantiles for cancer-variant enrichment) = 56 contingency tables (see Fig. 3B for a representative contingency table). We carry out this analysis for all 16 transition types over 22 chromosomes (excluding 9 and Y chromosomes).
Fig. 3:
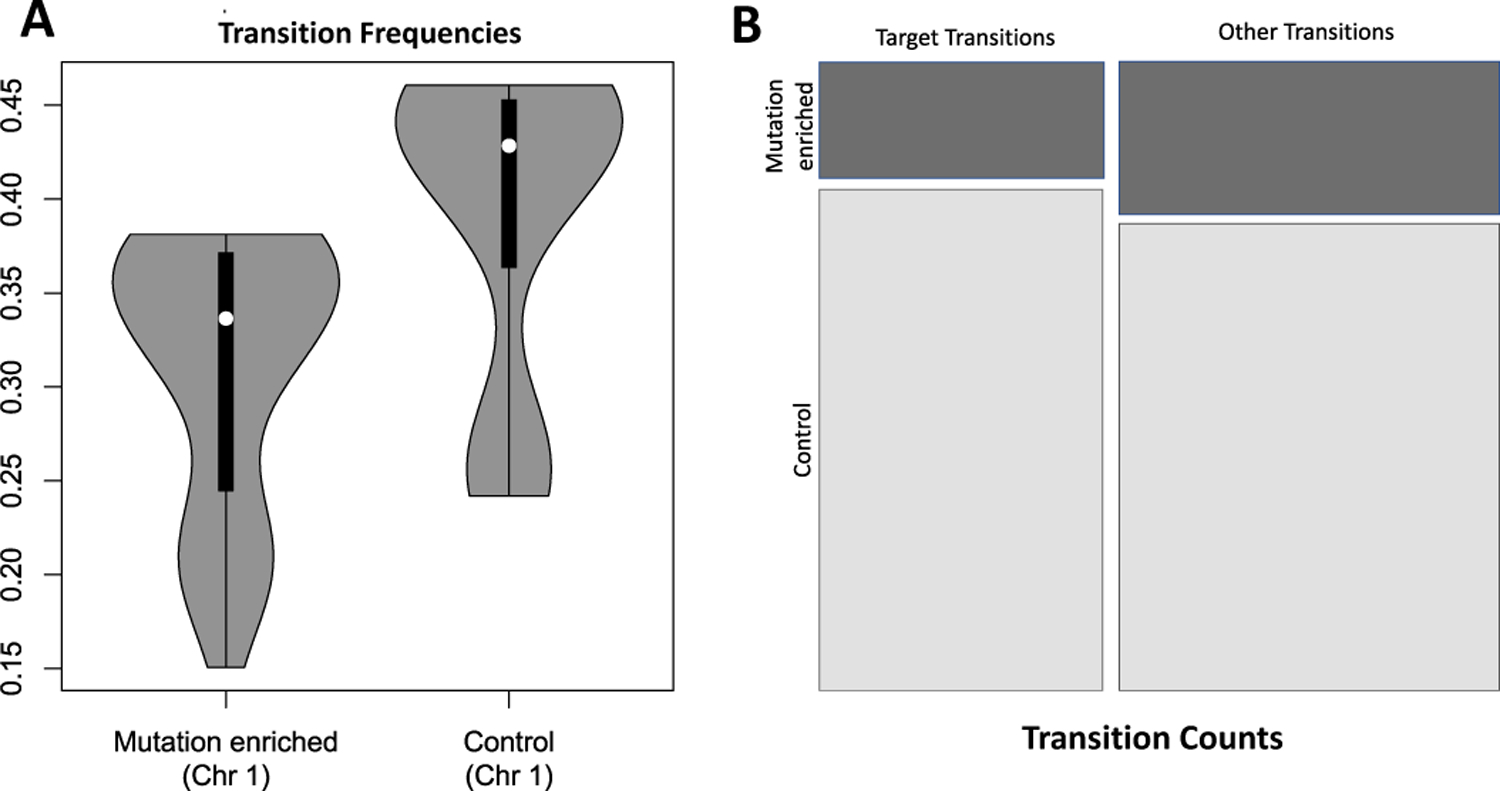
(A) Violin plot of (B, non-specific) self transition frequency in Chr. 1; (B) Mosaic plot of a representative 2×2 contingency table
We then use a Fisher exact test to determine if there exists significant association in the transition count to the cancer-variant mutation status. To balance statistical power with the pitfalls of a large number (16×1232) of dependent hypothesis tests, we use false discovery rate correction for all tests on the same chromosome following [25].
III. Results and Discussion
Our main finding is that there exists significant differences between mutation-enriched loci and non-enriched loci in preserving the chromatin folding state of B-compartment and non-specific interactions. That is, at the level of FDR <0.05, cancer-variant enriched loci are far less likely to preserve this chromatin state of B-compartment (inactive gene transcription) and enriched non-specific interactions. Fig. 3A summarizes the distribution of transition frequencies from the (B, non-specific) chromatin folding state in healthy GM12878 cells to the same (B, non-specific) chromatin folding state in cancerous K562 cells on chromosome 1. We can see clearly that the frequency at which cancer-variant enriched loci on chromosome 1 preserving the same (B, non-specific) chromatin folding state is markedly decreased compared to non-mutation enriched loci. Our findings are consistent with the hypothesis that during the process of oncogenesis, the (B, non-specific) chromatin folding state is less likely to be preserved in cancer mutated loci relative to non-mutated loci.
In light of this finding, we examined genomic regions containing known oncogenes to see if their folding state may undergo transitions from (B, non-specific) in healthy cells to alternate chromatin folding states in cancerous cells. Our preliminary results indicate that non-state preserving transitions may indeed be occurring in oncogenic regions. For instance, the oncogene ERBB4 [27], a membrane protein in the tyrosine kinase family, is found to transition from (B, non-specific) in healthy GM12878 cells to (A, specific) in cancerous K562 cells. Although this gene is not directly linked to oncogenesis in chronic myeloid leukemia – the cancer present within K562 cells – this finding does serve to illustrate that genomic regions associated with cancer drivers are more likely to exhibit altered chromatin folding patterns.
One possible confounding effect is the cancerous K562 cell line is a not a direct ancestor of the healthy GM12878 cell line. Specifically, GM12878 cells are of lymphocytic lineage whereas K562 cells are of granulocytic lineage; however, both cell lines do share a common hematopoietic precursor. Though we are limited based on the availability of public Hi-C data sets, we feel that GM12878 and K562 cell lines serve as reasonable surrogates for studying chromatin folding alterations during oncogenesis.
IV. Conclusion
By combining biophysical modeling of chromatin folding with statistical analysis of folding state transitions, we have demonstrated the existence of significant alterations in the folding patterns of cancer mutation-enriched loci relative to non-enriched loci. Specifically, we found the self-transition from the (B, non-specific) chromatin folding state is significantly altered in cancer mutation-enriched loci. For chromosome 1, we found this particular self-transition frequency to be markedly decreased. For future work, we will repeat this analysis for other cancer types contingent on data availability; additionally, we will delve into how alterations in chromatin folding patterns may lead to oncogensis.
Acknowledgments
This work is supported by NIH grants R21 AI126308, R35GM127084 and R01CA204962-01A1.
References
- [1].Fraser P and Bickmore W ”Nuclear organization of the genome and the potential for gene regulation.” Nature, 447, 413417, 2007. [DOI] [PubMed] [Google Scholar]
- [2].Dekker Job, Rippe Karsten, Dekker Martijn, and Kleckner Nancy. ”Capturing chromosome conformation.” science 295, no. 5558 (2002): 1306–1311. [DOI] [PubMed] [Google Scholar]
- [3].Lieberman-Aiden Erez, Van Berkum Nynke L., Williams Louise, Imakaev Maxim, Ragoczy Tobias, Telling Agnes, Amit Ido et al. ”Comprehensive mapping of long-range interactions reveals folding principles of the human genome.” science 326, no. 5950 (2009): 289–293. [DOI] [PMC free article] [PubMed] [Google Scholar]
- [4].Dixon Jesse R., Selvaraj Siddarth, Yue Feng, Kim Audrey, Li Yan, Shen Yin, Hu Ming, Liu Jun S., and Ren Bing. ”Topological domains in mammalian genomes identified by analysis of chromatin interactions.” Nature 485, no. 7398 (2012): 376. [DOI] [PMC free article] [PubMed] [Google Scholar]
- [5].Valton Anne-Laure, and Dekker Job. ”TAD disruption as oncogenic driver.” Current opinion in genetics development 36 (2016): 34–40. [DOI] [PMC free article] [PubMed] [Google Scholar]
- [6].Gursoy Gamze, Xu Yun, Kenter Amy L., and Liang Jie. ”Spatial confinement is a major determinant of the folding landscape of human chromosomes.” Nucleic acids research 42, no. 13 (2014): 8223–8230. [DOI] [PMC free article] [PubMed] [Google Scholar]
- [7].Schmitt Anthony D., Hu Ming, and Ren Bing. ”Genome-wide mapping and analysis of chromosome architecture.” Nature reviews Molecular cell biology 17, no. 12 (2016): 743. [DOI] [PMC free article] [PubMed] [Google Scholar]
- [8].Gan Kok A., Pro Sebastian Carrasco, Sewell Jared A., and Bass Juan I. Fuxman. ”Identification of Single Nucleotide Non-coding Driver Mutations in Cancer.” Frontiers in Genetics 9 (2018): 16. [DOI] [PMC free article] [PubMed] [Google Scholar]
- [9].Gursoy Gamze, Xu Yun, Kenter Amy L., and Liang Jie. ”Computational construction of 3D chromatin ensembles and prediction of functional interactions of alpha-globin locus from 5C data.” Nucleic acids research 45, no. 20 (2017): 11547–11558. [DOI] [PMC free article] [PubMed] [Google Scholar]
- [10].Chakraborty Abhijit, and Ay Ferhat. ”The role of 3D genome organization in disease: From compartments to single nucleotides.” In Seminars in cell developmental biology. Academic Press, 2018. [DOI] [PMC free article] [PubMed] [Google Scholar]
- [11].Babu Deepak, and Fullwood Melissa J. ”3D genome organization in health and disease: emerging opportunities in cancer translational medicine.” Nucleus 6, no. 5 (2015): 382–393. [DOI] [PMC free article] [PubMed] [Google Scholar]
- [12].Taberlay Phillippa C., Achinger-Kawecka Joanna, Lun Aaron TL, Buske Fabian A., Sabir Kenneth, Gould Cathryn M., Zotenko Elena et al. ”Three-dimensional disorganisation of the cancer genome occurs coincident with long range genetic and epigenetic alterations.” Genome research (2016): gr-201517. [DOI] [PMC free article] [PubMed]
- [13].Norton Heidi K., and Phillips-Cremins Jennifer E. ”Crossed wires: 3D genome misfolding in human disease.” J Cell Biol 216, no. 11 (2017): 3441–3452. [DOI] [PMC free article] [PubMed] [Google Scholar]
- [14].Campbell Ian. ”Chisquared and FisherIrwin tests of twobytwo tables with small sample recommendations.” Statistics in medicine 26, no. 19 (2007): 3661–3675. [DOI] [PubMed] [Google Scholar]
- [15].Fortin Jean-Philippe, and Hansen Kasper D. ”Reconstructing A/B compartments as revealed by Hi-C using long-range correlations in epigenetic data.” Genome biology 16, no. 1 (2015): 180. [DOI] [PMC free article] [PubMed] [Google Scholar]
- [16].McCord Rachel Patton, Nazario-Toole Ashley, Zhang Haoyue, Chines Peter S., Zhan Ye, Erdos Michael R., Collins Francis S., Dekker Job, and Cao Kan. ”Correlated alterations in genome organization, histone methylation, and DNAlamin A/C interactions in Hutchinson-Gilford progeria syndrome.” Genome research 23, no. 2 (2013): 260–269. [DOI] [PMC free article] [PubMed] [Google Scholar]
- [17].Rao Suhas SP, Huntley Miriam H., Durand Neva C., Stamenova Elena K., Bochkov Ivan D., Robinson James T., Sanborn Adrian L. et al. ”A 3D map of the human genome at kilobase resolution reveals principles of chromatin looping.” Cell 159, no. 7 (2014): 1665–1680. [DOI] [PMC free article] [PubMed] [Google Scholar]
- [18].Sanborn Adrian L., Rao Suhas SP, Huang Su-Chen, Durand Neva C., Huntley Miriam H., Jewett Andrew I., Bochkov Ivan D. et al. ”Chromatin extrusion explains key features of loop and domain formation in wild-type and engineered genomes.” Proceedings of the National Academy of Sciences 112, no. 47 (2015): E6456–E6465. [DOI] [PMC free article] [PubMed] [Google Scholar]
- [19].Smetana K, Pilcova H, Pluskalova M, and Hrkal Z ”A karyometric study on ageing and butyrate or imatinib treated human leukemic myeloblasts represented by K562 cells originated from chronic myeloid leukaemia.” Neoplasma 54, no. 5 (2007): 359–364. [PubMed] [Google Scholar]
- [20].Durand Neva C., Shamim Muhammad S., Machol Ido, Rao Suhas S. P., Huntley Miriam H., Lander Eric S., and Aiden Erez Lieberman. ”Juicer provides a one-click system for analyzing loop-resolution Hi-C experiments.” Cell Systems 3(1), 2016. [DOI] [PMC free article] [PubMed] [Google Scholar]
- [21].Ricci Maria Aurelia, et al. ”Chromatin fibers are formed by heterogeneous groups of nucleosomes in vivo.” Cell 160.6 (2018): 1145–1158 [DOI] [PubMed] [Google Scholar]
- [22].Giorgetti Luca, Galupa Rafael, Nora Elphge P., Piolot Tristan, Lam France, Dekker Job, Tiana Guido, and Heard Edith. ”Predictive polymer modeling reveals coupled fluctuations in chromosome conformation and transcription.” Cell 157, no. 4 (2014): 950–963. [DOI] [PMC free article] [PubMed] [Google Scholar]
- [23].Kleiner Ariel, Talwalkar Ameet, Sarkar Purnamrita, and Jordan Michael I. ”A scalable bootstrap for massive data.” Journal of the Royal Statistical Society: Series B (Statistical Methodology) 76, no. 4 (2014): 795–816. [Google Scholar]
- [24].Benjamini Yoav, and Hochberg Yosef. ”Controlling the false discovery rate: a practical and powerful approach to multiple testing.” Journal of the royal statistical society. Series B (Methodological) (1995): 289–300. [Google Scholar]
- [25].Benjamini Yoav, and Yekutieli Daniel. ”The control of the false discovery rate in multiple testing under dependency.” Annals of statistics (2001): 1165–1188.
- [26].Tate John G., Bamford Sally, Jubb Harry C., Sondka Zbyslaw, Beare David M., Bindal Nidhi, Boutselakis Harry et al. ”COSMIC: the catalogue of somatic mutations in cancer.” Nucleic acids research 47, no. D1 (2018): D941–D947. [DOI] [PMC free article] [PubMed] [Google Scholar]
- [27].Bailey Matthew H., Tokheim Collin, Porta-Pardo Eduard, Sengupta Sohini, Bertrand Denis, Weerasinghe Amila, Colaprico Antonio et al. ”Comprehensive characterization of cancer driver genes and mutations.” Cell 173, no. 2 (2018): 371–385. [DOI] [PMC free article] [PubMed] [Google Scholar]