

Abstract
Chemical modifications of the nucleosides that comprise tRNAs are diverse. However, the structure, location, and extent of modifications have been systematically charted in very few organisms. Here, we describe an approach in which rapid prediction of modified sites through reverse transcription-derived signatures in high-throughput tRNA-sequencing (tRNA-seq) data is coupled with identification of tRNA modifications through RNA mass spectrometry. Comparative tRNA-seq enabled prediction of several V. cholerae modifications that are absent from E. coli and also revealed the effects of various environmental conditions on V. cholerae tRNA modification. Through RNA mass spectrometric analyses, we showed that two of the V. cholerae-specific reverse transcription signatures reflected the presence of a new modification (acetylated acp3U (acacp3U)), while the other results from C-to-Ψ RNA editing, a process not described before. These findings demonstrate the utility of this approach for rapid surveillance of tRNA modification profiles and environmental control of tRNA modification.
Introduction
tRNAs are essential adapter molecules for deciphering the genetic information in mRNAs, enabling synthesis of the proteins they encode. Modulation of the function and metabolism of tRNA molecules is critical for optimizing translation in changing cellular conditions1–3. Post-transcriptional chemical modifications of tRNA (tRNA modification) are diverse, and include methylation, pseudouridylation, and conjugation of amino acids4–6. tRNA modifications also include RNA editing -post-transcriptional base conversion processes- where inosine is formed from adenosine (A-to-I editing) and cytidine is converted to uridine (C-to-U editing)7.
tRNA modifications are synthesized by dedicated tRNA modifying enzymes that alter specific tRNA species in a site-specific fashion. Some modifications are found in multiple tRNA species, whereas others are observed in single tRNA species. tRNA modifications tune tRNA structure, stability, and mRNA decoding5,8 for optimized translation. Modifications located close to anticodons, which discriminate mRNA codons, are critical for modulating tRNA decoding ability8,9, whereas modifications in the main tRNA body generally stabilize tRNA tertiary structure, thereby modulating tRNA stability and homeostasis10–12. Most modifications are thought to be static but the frequency of a few modifications is responsive to environmental cues, thereby linking tRNA modification to environmental control of translation9,13–16.
tRNA modifications are present in all kingdoms of life6. Some modifications are found across all domains of life, while others are domain specific. However, the structure, location, and extent of modifications have been systematically catalogued in very few organisms, partly because mapping modifications is technically challenging. RNA mass spectrometric analysis is a powerful approach to determine the sites and the chemical identities of RNA modifications17. With this approach, analyses of purified individual tRNA species is required to obtain high-resolution maps of modifications18,19. However, most organisms contain more than 40 tRNA species, making it arduous to study every tRNA individually using mass spectrometry.
An alternative method for mapping the sites of tRNA modification is based on high-throughput sequencing of tRNA molecules (tRNA-seq)15,20–24. In this approach, tRNA sequences are first converted to DNA sequences by reverse transcription. Some modifications inhibit the reverse transcription process and result in the incorporation of mismatched bases or the premature termination of reverse transcription. These reverse transcription derived signatures (‘RT-signatures’) enable the prediction of sites of modifications. Although some ex-vivo enzymatic or chemical treatments facilitate the prediction of the chemical identity of modifications21,25,26, systematic identification of tRNA chemical modifications based strictly on RT-signatures has precluded the discovery of novel modifications with this technique alone.
Here, we describe a pipeline that is comprised of comparative tRNA-seq and RNA mass spectrometry. We use this approach to profile tRNA modifications in Vibrio cholerae, an organism where tRNA modifications have not been charted. The comparison of RT-signatures detected in V. cholerae tRNA-seq data with those found in Escherichia coli, an organism whose tRNA modifications have been comprehensibly catalogued, yielded knowledge of common modification sites, as well as of presumptive sites of V. cholerae specific modification. In-depth RNA mass spectrometric analyses of purified tRNAs that contain V. cholerae specific signals enabled the chemical identification of a new modification, acacp3U, and a new RNA editing process, C-to-Ψ conversion. In silico analyses, including comparative genomic analyses facilitated the identification of the genes required for the biogenesis of acacp3U and for C-to-Ψ conversion. Although E. coli and V. cholerae are closely related phylogenetically, comparisons of their tRNA-seq profiles led to MS-based discoveries of a new modified nucleoside and RNA editing process. Similar studies are likely to yield knowledge of many new tRNA modifications.
Results
Identification of V. cholerae specific RT signatures
Several methods have been developed to predict the presence of modified sites from deep sequencing data of tRNAs20,21. To verify that deep sequencing of tRNAs (tRNA-seq) can predict the presence of tRNA modifications through detection of misincorporated nucleosides or premature termination of reverse transcription, we conducted deep-sequencing of purified total tRNA from E. coli, where the sites and chemical nature of tRNA modifications have been elucidated27 (Supplementary Data 1). The sequencing library was constructed using a modified version of a published protocol21 (Supplementary Figure 1). Reads were mapped to reference E. coli tRNA genes and pile up files for each locus were generated (e.g., Extended Data Fig. 1a). As expected, we observed a drop in mapped read depth and/or incorporation of mismatched bases at known modified residues (e.g., s4U at position 8, D at 16 and 17, mnm5s2U at 34 and acp3U at 47; Extended Data Fig. 1a). Heatmaps depicting the frequency of misincorporation and ratio of termination throughout all tRNAs were generated (Extended Data Fig. 1b). In total, more than half of known modifications were detected in the sequencing of E. coli tRNA (16 out of 28) (Extended Data Fig. 1b, Supplementary Table 1, Supplementary Data 1, and see Methods). Thus, RT-derived signatures can be used to profile many tRNA modifications.
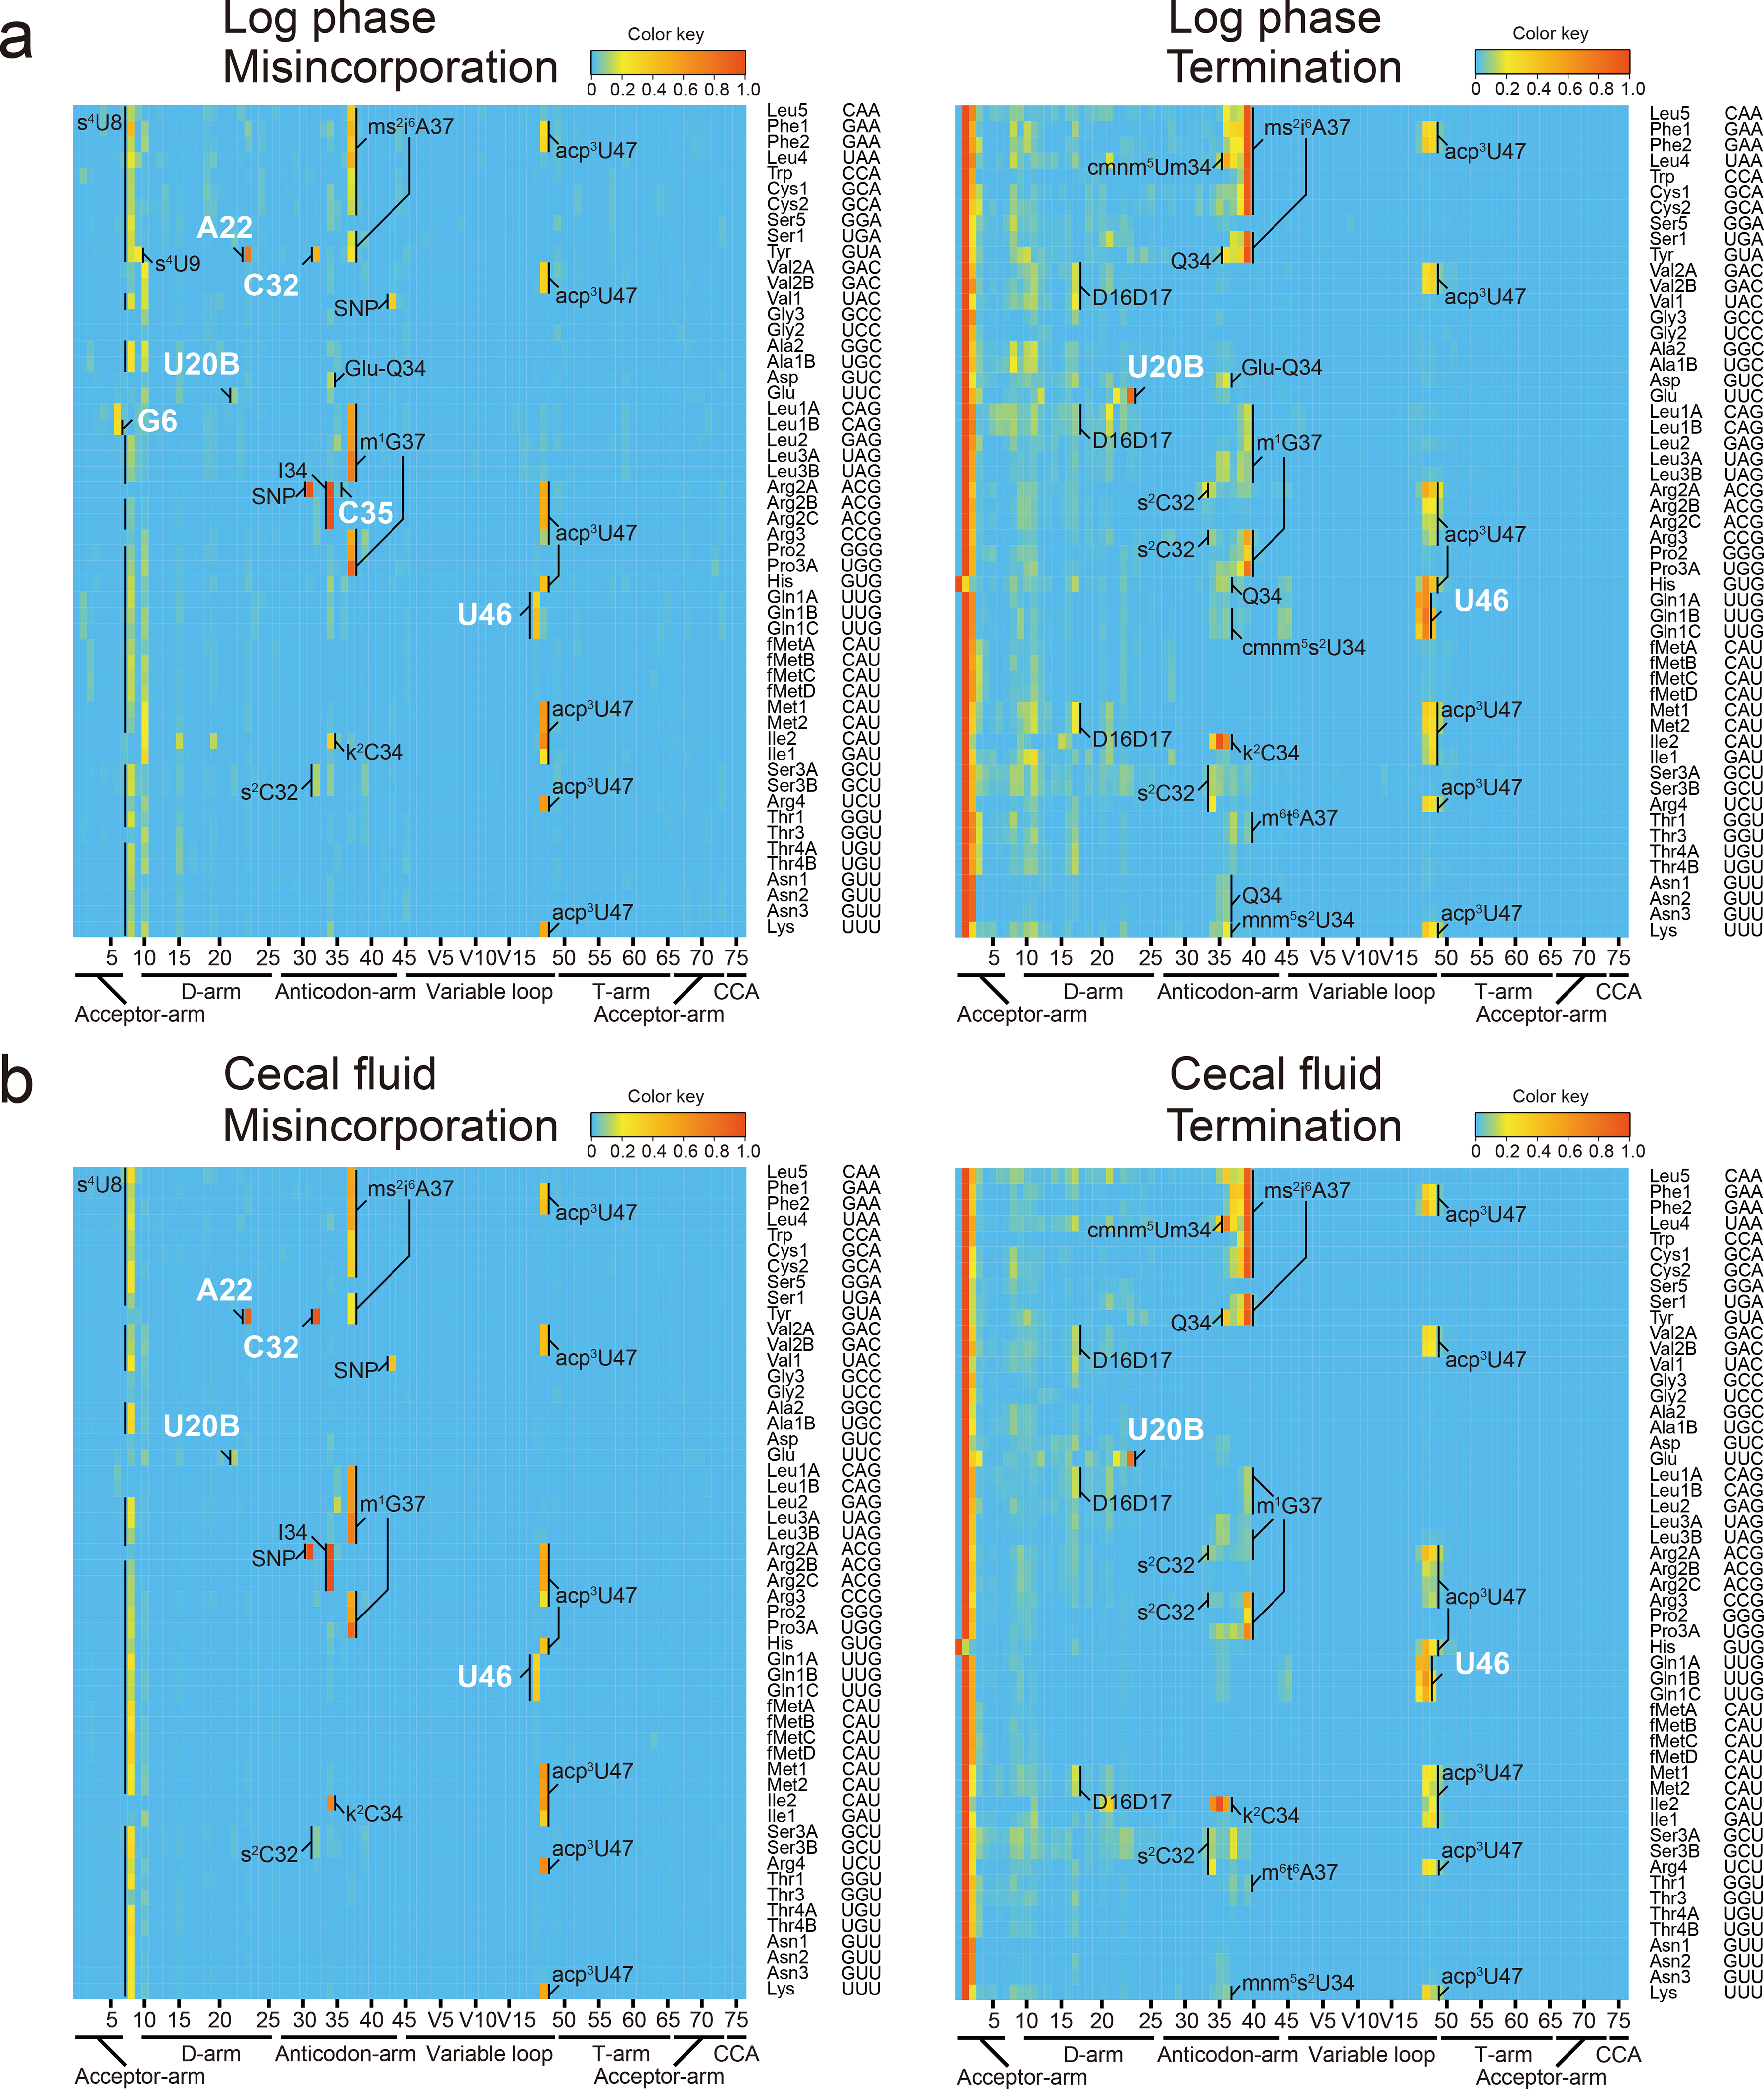
Next, we applied tRNA-seq to survey tRNA modification profiles in an organism where tRNA modifications have not been characterized: Vibrio cholerae, the cholera pathogen. Analysis of tRNA-seq data from stationary phase V. cholerae samples yielded heatmaps of misincorporation and termination similar to those of E. coli (Fig. 1a). This observation is consistent with the conservation of most E. coli tRNA modification enzymes in V. cholerae (Supplementary Data 2). The chemical identity of modifications present at some of the predicted sites of conserved modifications was confirmed by RNA mass spectrometric analysis of purified tRNAs (Extended Data Fig. 2 and Supplementary Data 3). Additionally, the identity of modifications introduced by ThiI, TtcA, MiaA (s4U, s2C, and ms2io6A, respectively) was confirmed by analyzing tRNA from strains lacking these enzymes (Extended Data Fig. 3a–c).
Fig. 1. Profiling tRNA modifications in V. cholerae through tRNA-seq.
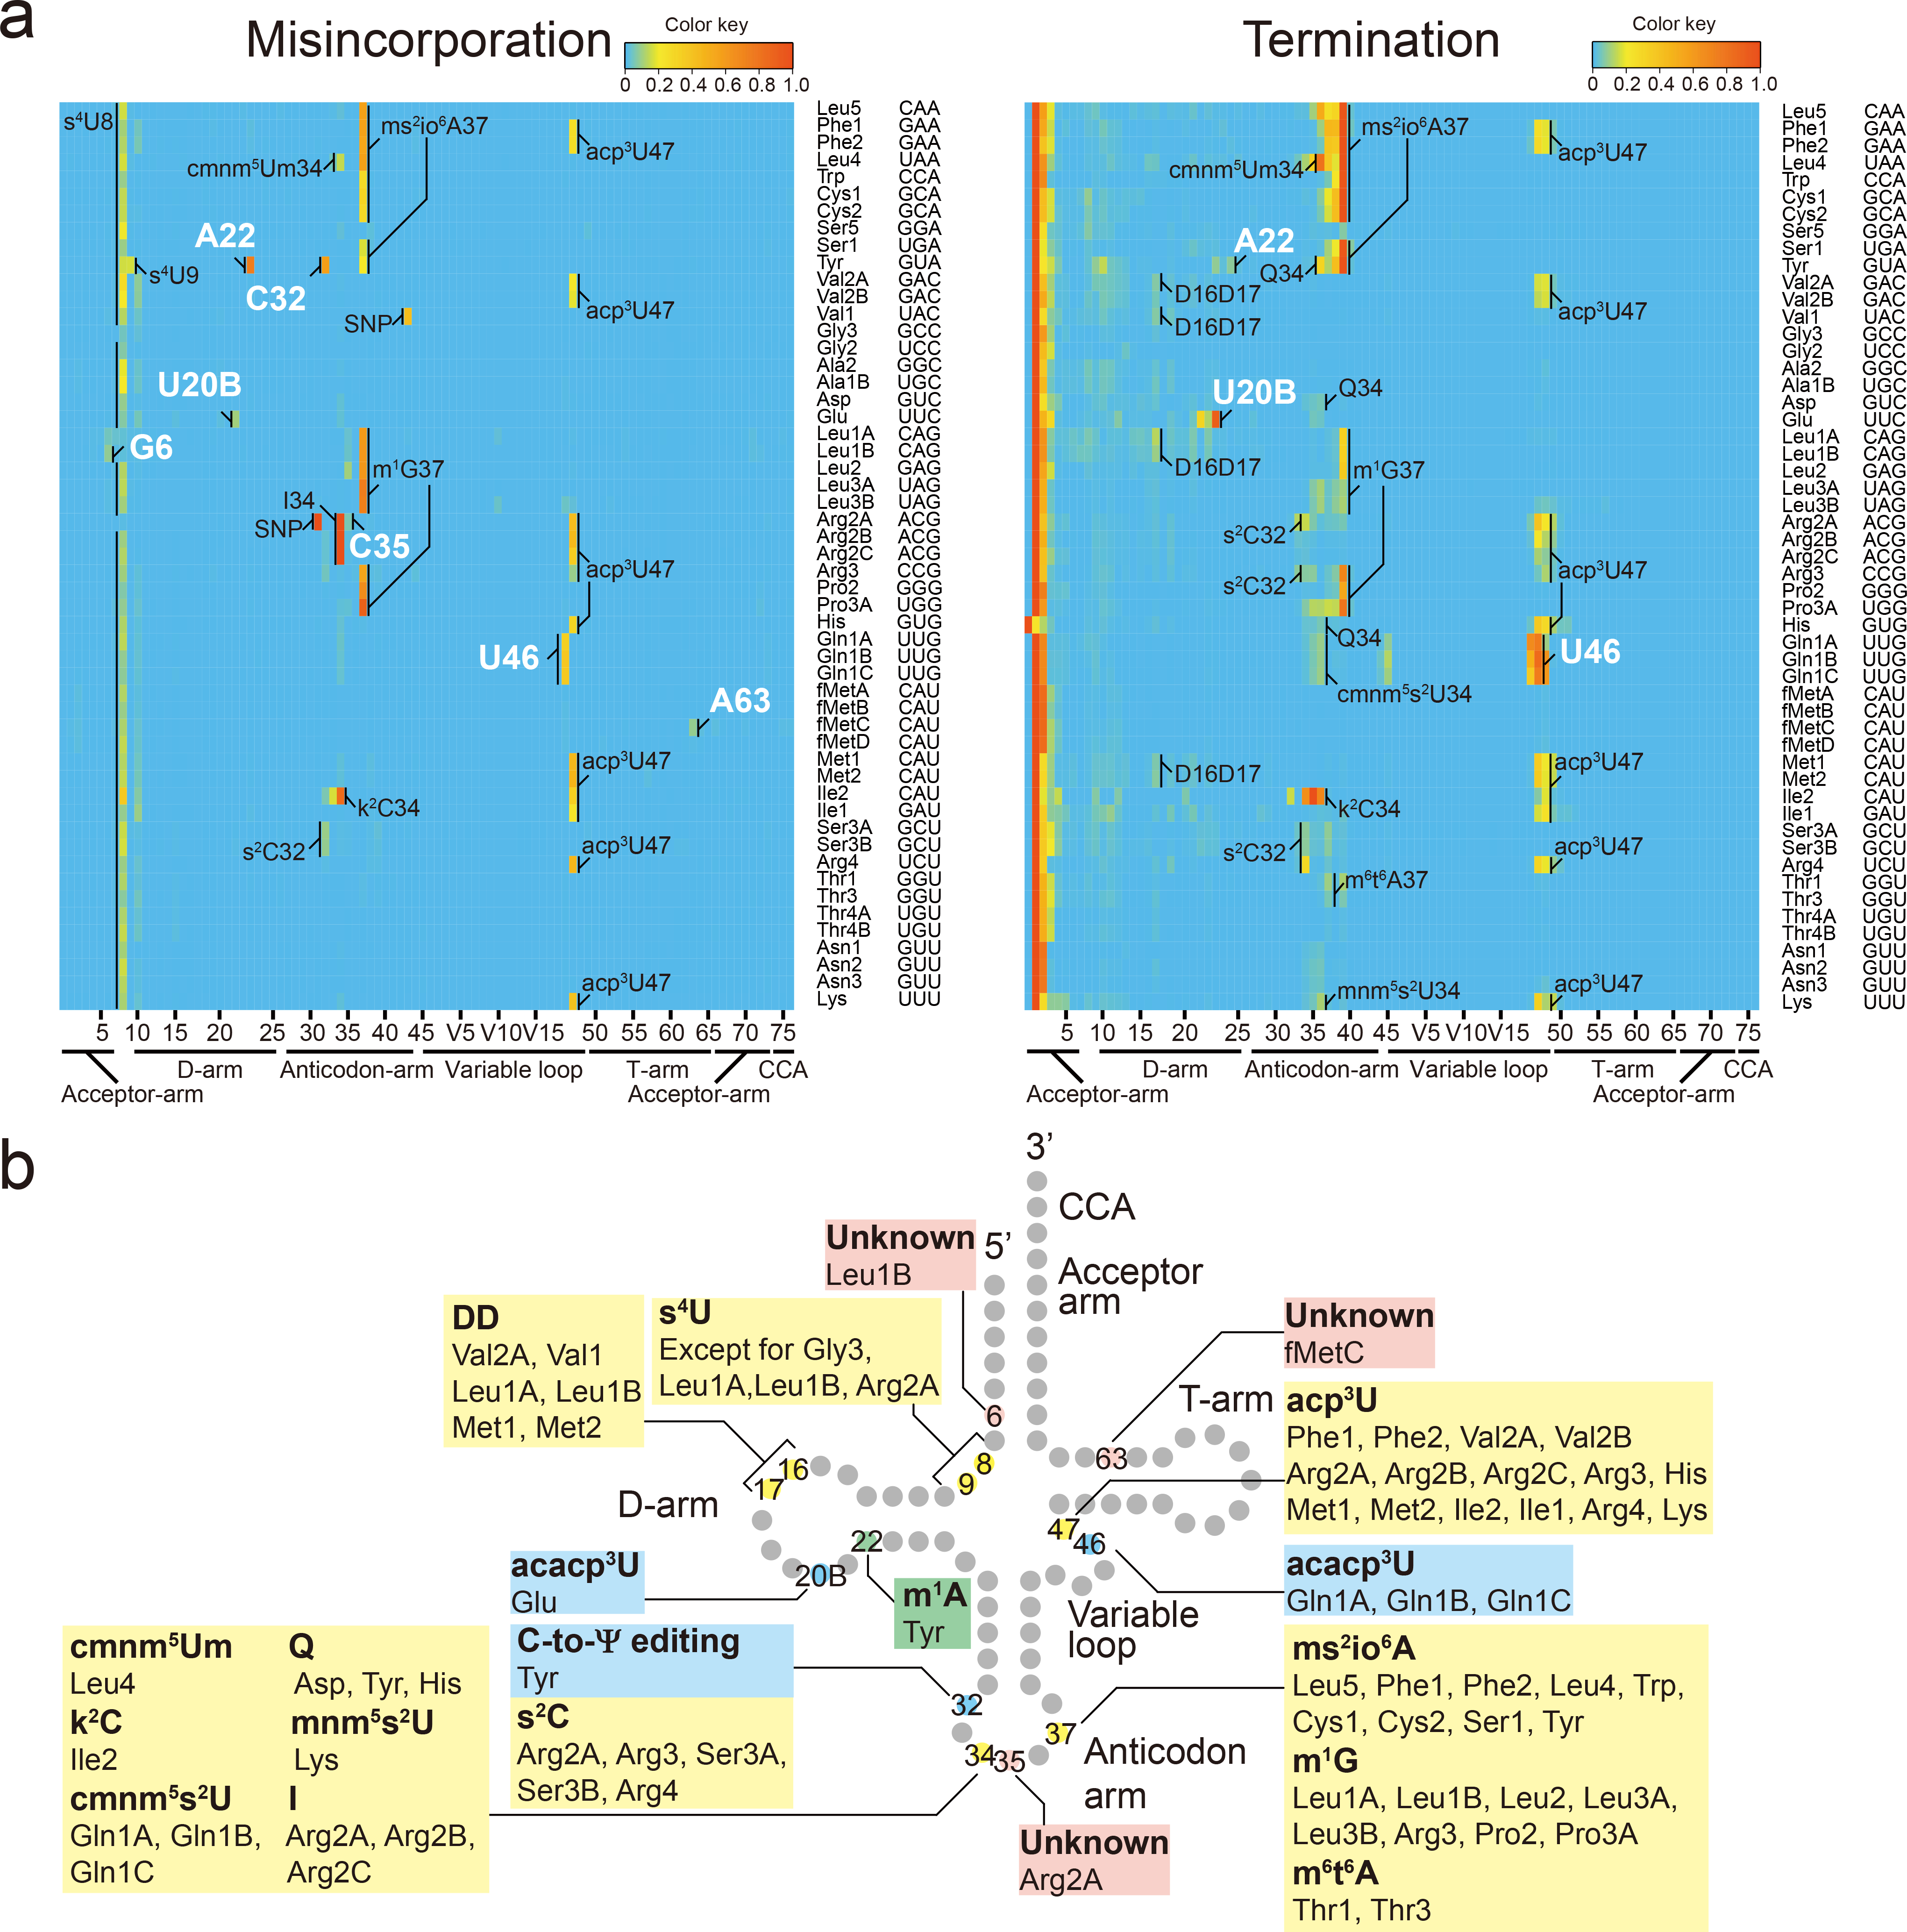
a, Heatmaps of frequency of misincorporation (Left) and termination of reverse transcription (Right) in a representative tRNA sample isolated from stationary phase V. cholerae (total of three independent samples). Positions of modifications bearing greater than 5 % of misincorporation or termination frequency are shown; the identity of presumably shared modifications with E. coli are indicated in black and the V. cholerae-specific signals are in white. Single nucleotide polymorphisms (SNPs) shown are based on whole genome sequence of C670610 (Supplementary Figure 6) are also indicated in black. The color keys are shown above the upper right corners of the heatmaps.
b, Schematic secondary structure of V. cholerae tRNAs showing sites of predicted tRNA modifications deciphered from tRNA-seq data in (a). The positions and tRNA species in which the RT-derived signatures are commonly observed in E. coli are shown in yellow. The positions and tRNA species that have V. cholerae specific signals are colored coded as green (found in other organisms but not E. coli), light blue (novel modifications/or editing) or pink (unknown).
We observed several misincorporation signals in V. cholerae that were not present in E. coli, including at A22 and C32 in tRNA-Tyr, U20B in tRNA-Glu, U46 in tRNA-Gln1A, Gln1B and Gln1C, G6 in tRNA-Leu1B, C35 in tRNA-Arg2A and A63 in tRNA-fMetC (Fig. 1a and b). U20B in tRNA-Glu and U46 in tRNA-Gln1ABC were also associated with increased termination of reverse transcription (Fig. 1a and b). In other bacteria, e.g., B. subtilis, A22 is methylated to m1A by TrmK in a subset of tRNAs27,28; consequently, we explored the effect of V. cholerae’s TrmK homolog on misincorporation at A22 in tRNA-Tyr. A V. cholerae trmK deletion mutant lacked the misincorporation signal at A22 in tRNA-Tyr, suggesting that V. cholerae contains m1A in tRNA-Tyr (Extended Data Fig. 3d).
Tracking of tRNA modification frequencies with tRNA-seq
The variation of modification profiles of individual tRNAs in log and stationary phase bacteria have not been systematically characterized. Comparisons of tRNA-seq patterns of samples derived from log and stationary phase V. cholerae cultures (Fig. 1a and Extended Data Fig. 4a) revealed a significantly higher misincorporation frequency at position 47 in a subset of log phase tRNAs (e.g., tRNA-Met), which presumably contain acp3U (Fig. 2a). Mass spectrometric analysis of purified tRNA-Met fragments confirmed that this modification is present at this site and is more prevalent in the log phase sample (Fig. 2b, c and Extended Data Fig. 2, and Supplementary Figure 2). Interestingly, in E. coli, misincorporation frequency at position 47 was higher in stationary phase (Fig. 2d), suggesting that there are species-specific mechanisms for control of modification frequency. We also determined the tRNA-seq profiles of V. cholerae tRNA samples derived from the cecal fluid of infant rabbits infected with the pathogen29. The resulting misincorporation and termination signatures were similar to those of log phase samples (Extended Data Fig. 4b vs. 4a), including modification at position 47 (Fig. 2a). Thus, tRNA-seq enables assessment of tRNA modification profiles under a variety of conditions.
Fig. 2. Frequency of acp3U is dependent upon growth phase.
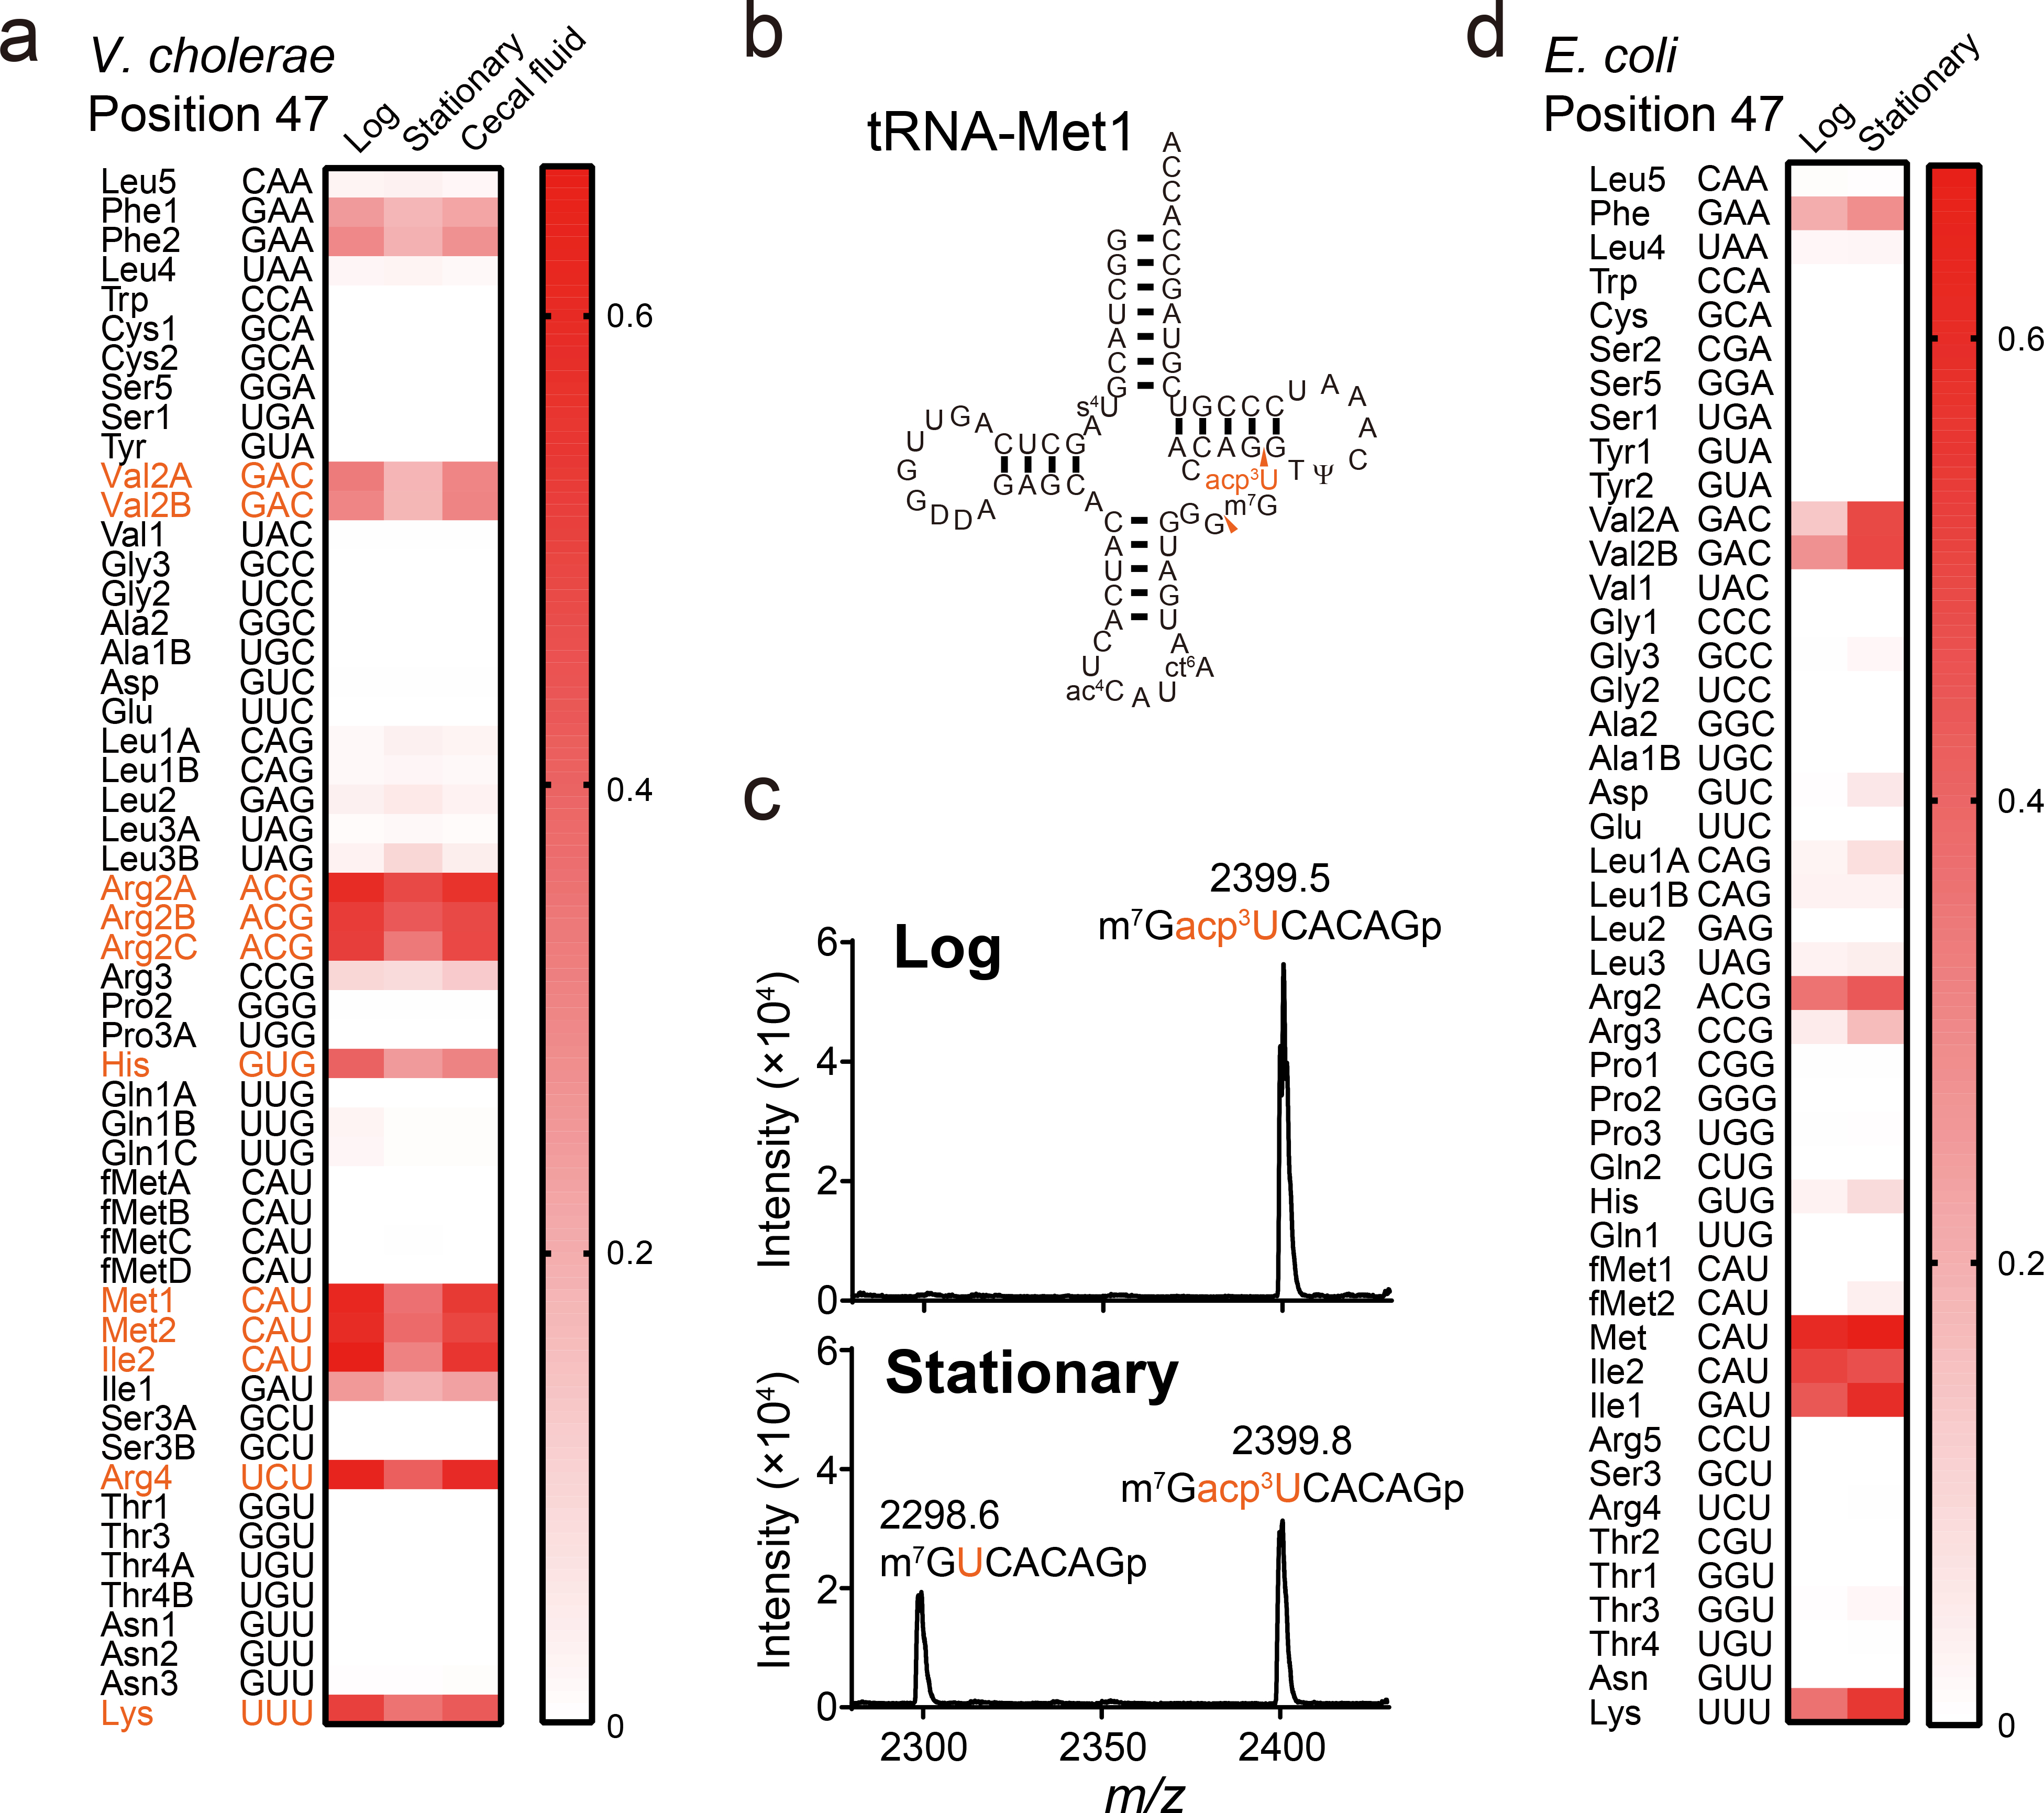
a, Heatmap of misincorporation frequency at position 47 in V. cholerae tRNAs isolated from indicated growth condition. Signal intensities in each condition are the average values of three independent tRNA-seq datasets. tRNA species that showed significant differences between signals from log and stationary phase cells are colored in red (multiple two-sided t-test, FDR < 10 %).
b, Secondary structure of tRNA-Met1 with modifications. RNase T1 cleavage sites that form the fragment containing position 47 are indicated by red arrowheads.
c, MALDI analysis (positive polarity mode measurements) of RNase A digests of tRNA-Met1 isolated from log and stationary phase samples. Nucleosides at position 47 are colored in red. Representative data from two independent experiments with similar results is shown.
d, Heatmap of misincorporation frequency at position 47 in E. coli tRNAs isolated from indicated. growth condition. Signal intensities in each condition represent the values of one tRNA-seq dataset.
Identification of acetylated acp3U (acacp3U)
We hypothesized that RT signatures found in V. cholerae but not E. coli (Fig. 1a and b) could reflect V. cholerae-specific modifications, and used RNA mass spectrometric analysis to identify the chemical moieties at some of these positions, focusing initially on U20B in tRNA-Glu and U46 in tRNA-Gln1B. Nucleoside analyses, which reveal the composition of modified ribonucleosides in each tRNA, were carried out on purified tRNA-Glu and tRNA-Gln1B, and revealed that tRNA-Glu contains Ψ, mnm5s2U, T and Gm, while tRNA-Gln1B contains D, Ψ, cmnm5s2U, T, s4U and m2A (Fig. 3a, Extended Data Fig. 2, and Supplementary Data 4). In addition, these analyses showed that tRNA-Glu and tRNA-Gln1B both also possesses a ribonucleoside whose molecular weight is 387 (Fig. 3a and Extended Data Fig. 2). Since no known modified ribonucleoside has a mass of 3874, we postulated that this nucleoside (designated N387) is a novel modification that may be incorporated at various sites (e.g., U20B or U46) within tRNAs. To confirm the positions of N387, we performed fragment analyses. N387-containing fragments were detected using MALDI-TOF mass spectrometry of tRNAs digested with RNase A, which cleaves at the 3’ end of C and U, or RNase T1, which cleaves at the 3’ end of G (Fig. 3b, Supplementary Figure 3, and Supplementary Data 3). RNase A digests revealed fragments of m/z 2121.7 in tRNA-Glu and 1431.1 in tRNA-Gln1B, consistent with the location of N387 at U20B and U46 in these tRNAs, respectively (Fig. 3b and c). These results suggest that the V. cholerae-specific misincorporation signals in tRNA-Glu and tRNA-Gln1B result from N387.
Fig. 3. Structure of acacp3U.
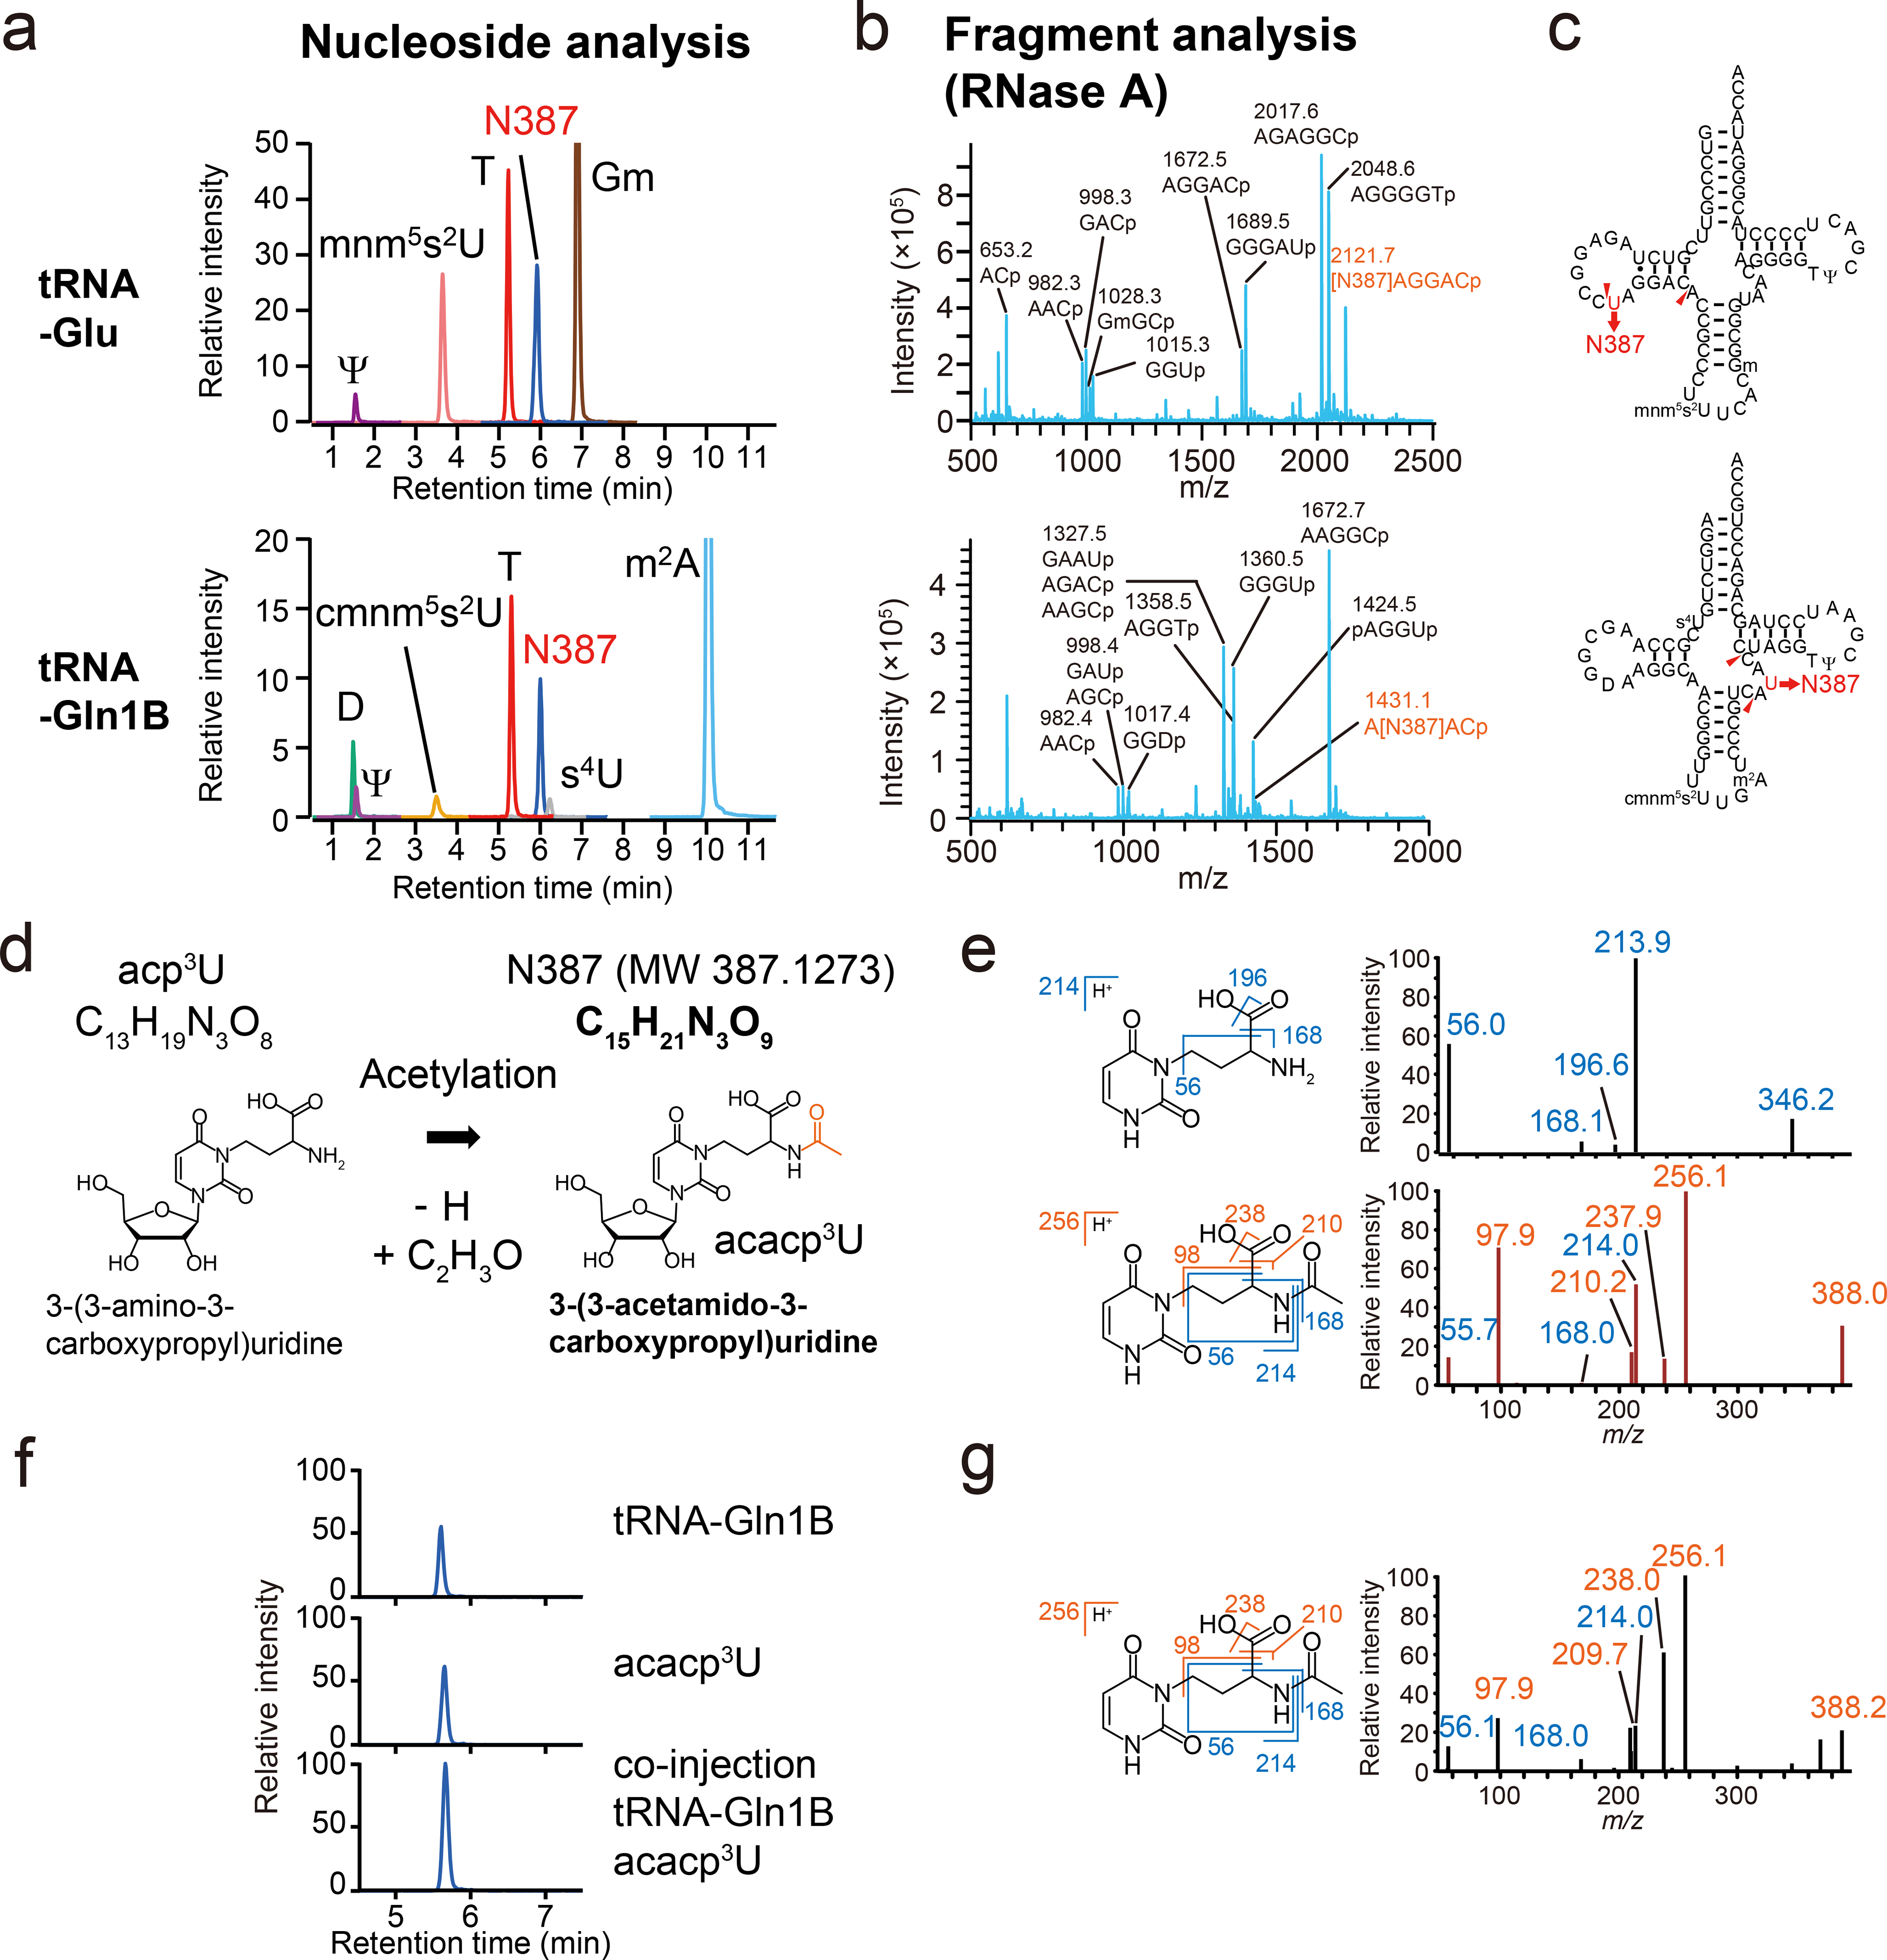
a, b, RNA mass spectrometric analyses of V. cholerae tRNA-Glu (Upper) and tRNA-Gln1B (Lower). Representative data from two independent experiments with similar results is shown.
a, nucleoside analyses by multiple reaction monitoring (MRM), showing the presence of a nucleoside whose mass is 387 (N387), found in neutral loss scans, along with known modifications (denoted in black). The peak heights between different nucleosides are not comparable.
b, Fragment analyses of RNase A digests. The fragments containing N387 are colored in red.
c, The secondary structures of tRNA-Glu (Top) and tRNA-Gln1B (Bottom) containing modifications based on nucleoside and fragment analyses.
d, Schematic of potential derivation of acacp3U (N387) from acp3U.
e, MS/MS analyses of acp3U (upper panels) and N387 (lower panels). Left panels show the structures and fragmentation patterns of the acp3U and acacp3U base components. Right panels show the product ion spectra of acp3U in tRNA-Met1 (precursor ion; m/z 346) and N387 in tRNA-Glu (precursor ion; m/z 388). Fragment ions observed in acp3U are colored in blue and N387 specific fragment ions are colored in red. Representative spectra from at least two independent MS/MS scans with similar results are shown.
f, LC/MS analysis of nucleosides of tRNA-Gln1B and chemically synthesized acacp3U. The panels show N387 derived from 20 ng tRNA-Gln1B (Top), 1.2 pmol chemical synthesized acacp3U (Middle), and a co-injected sample (Bottom). Representative data of two independent experiments with similar results in tRNA-Gln1B and acacp3U and one experiment in co-injection is shown.
g, MS/MS analysis of chemically synthesized acacp3U (precursor ion; m/z 388). Fragment ions observed in acp3U are colored in blue and acacp3U specific fragment ions are colored in red. Representative data from at least three independent MS/MS scans with similar results are shown.
High-resolution mass spectrometric analysis of N387 from tRNA-Glu yielded a mass value of 387.1273; the best matched chemical formula30 corresponding to this mass value is C15H21N3O9 (Fig. 3d). This formula is close to that of acp3U (C13H19N3O8), with the difference in chemical composition between these compounds corresponding to acetylation (C2H2O). Since acp3U contains a primary amine, a plausible target of acetylation, we predicted that N387 is acetylated acp3U, i.e., 3-(3-acetamide-3-carboxypropyl)-uridine (acacp3U). MS/MS analysis with acp3U and N387 was used to test this hypothesis. The product ions of acp3U, e.g., m/z 56, 168 and 214, were also observed in the spectrum of N387, consistent with the presence of acp3U in the structure of N387 (Fig. 3e). Several additional fragment ions (e.g., m/z 238 and 210) further corroborate the proposed structure of N387 as acacp3U. MS/MS spectra of N387 were nearly identical in tRNA-Gln1A and tRNA-Gln1B (Supplementary Figure 4), suggesting that these tRNAs also contain acacp3U.
To verify the structure of N387, we compared the LC retention times and MS/MS spectra of N387 derived from tRNA-Gln1B with chemically synthesized acacp3U. Both molecules had identical retention times when injected singly and were detected as a single peak when they were co-injected (Fig. 3f). Additionally, the MS/MS spectra of acacp3U and N387 were indistinguishable (Fig. 3g). Together these data provide strong evidence that N387 corresponds to acacp3U, i.e., acetylated acp3U.
AcpA (VC0317) acetylates acp3U to form acacp3U
We next applied a comparative genomics approach to identify an acetyltransferase that mediates acacp3U formation. We analyzed total tRNA from bacterial species that are phylogenetically close to V. cholerae (Vibrio parahaemolyticus, Aeromonas hydrophila, and Shewanella oneidenis), and found that V. parahaemolyticus contains acacp3U but the other bacteria do not (Supplementary Figure 5). Based on these results and our E. coli data, we identified candidate acetyltransferases in V. cholerae (Supplementary Data 5). Of the 47 genes annotated as acetyltransferases in the COG database31, only 5 are present in V. cholerae and V. parahaemolyticus but absent in A. hydrophila, S. oneidenis and E. coli (Supplementary Data 5). Nucleoside analysis of total tRNA from transposon insertion mutants corresponding to each of these 5 loci32 detected a decreased acacp3U signal and an increased acp3U signal in tRNA from vc0317::Tn (Extended Data Fig. 5). Furthermore, analysis of tRNA from an in-frame vc0317 deletion mutant revealed that disruption of vc0317 abolished the acacp3U signal and increased the acp3U signal (Fig. 4a). Collectively, these results strongly suggest that VC0317 mediates acetylation during acacp3U synthesis and we renamed vc0317 as acpA (for acp3U acetylation). Notably in PFAM33, AcpA is predicted to encode an N-acetyltransferase, providing further support for the idea that N387 includes acetylation of a primary amine group.
Fig. 4. Biogenesis and function of acacp3U.
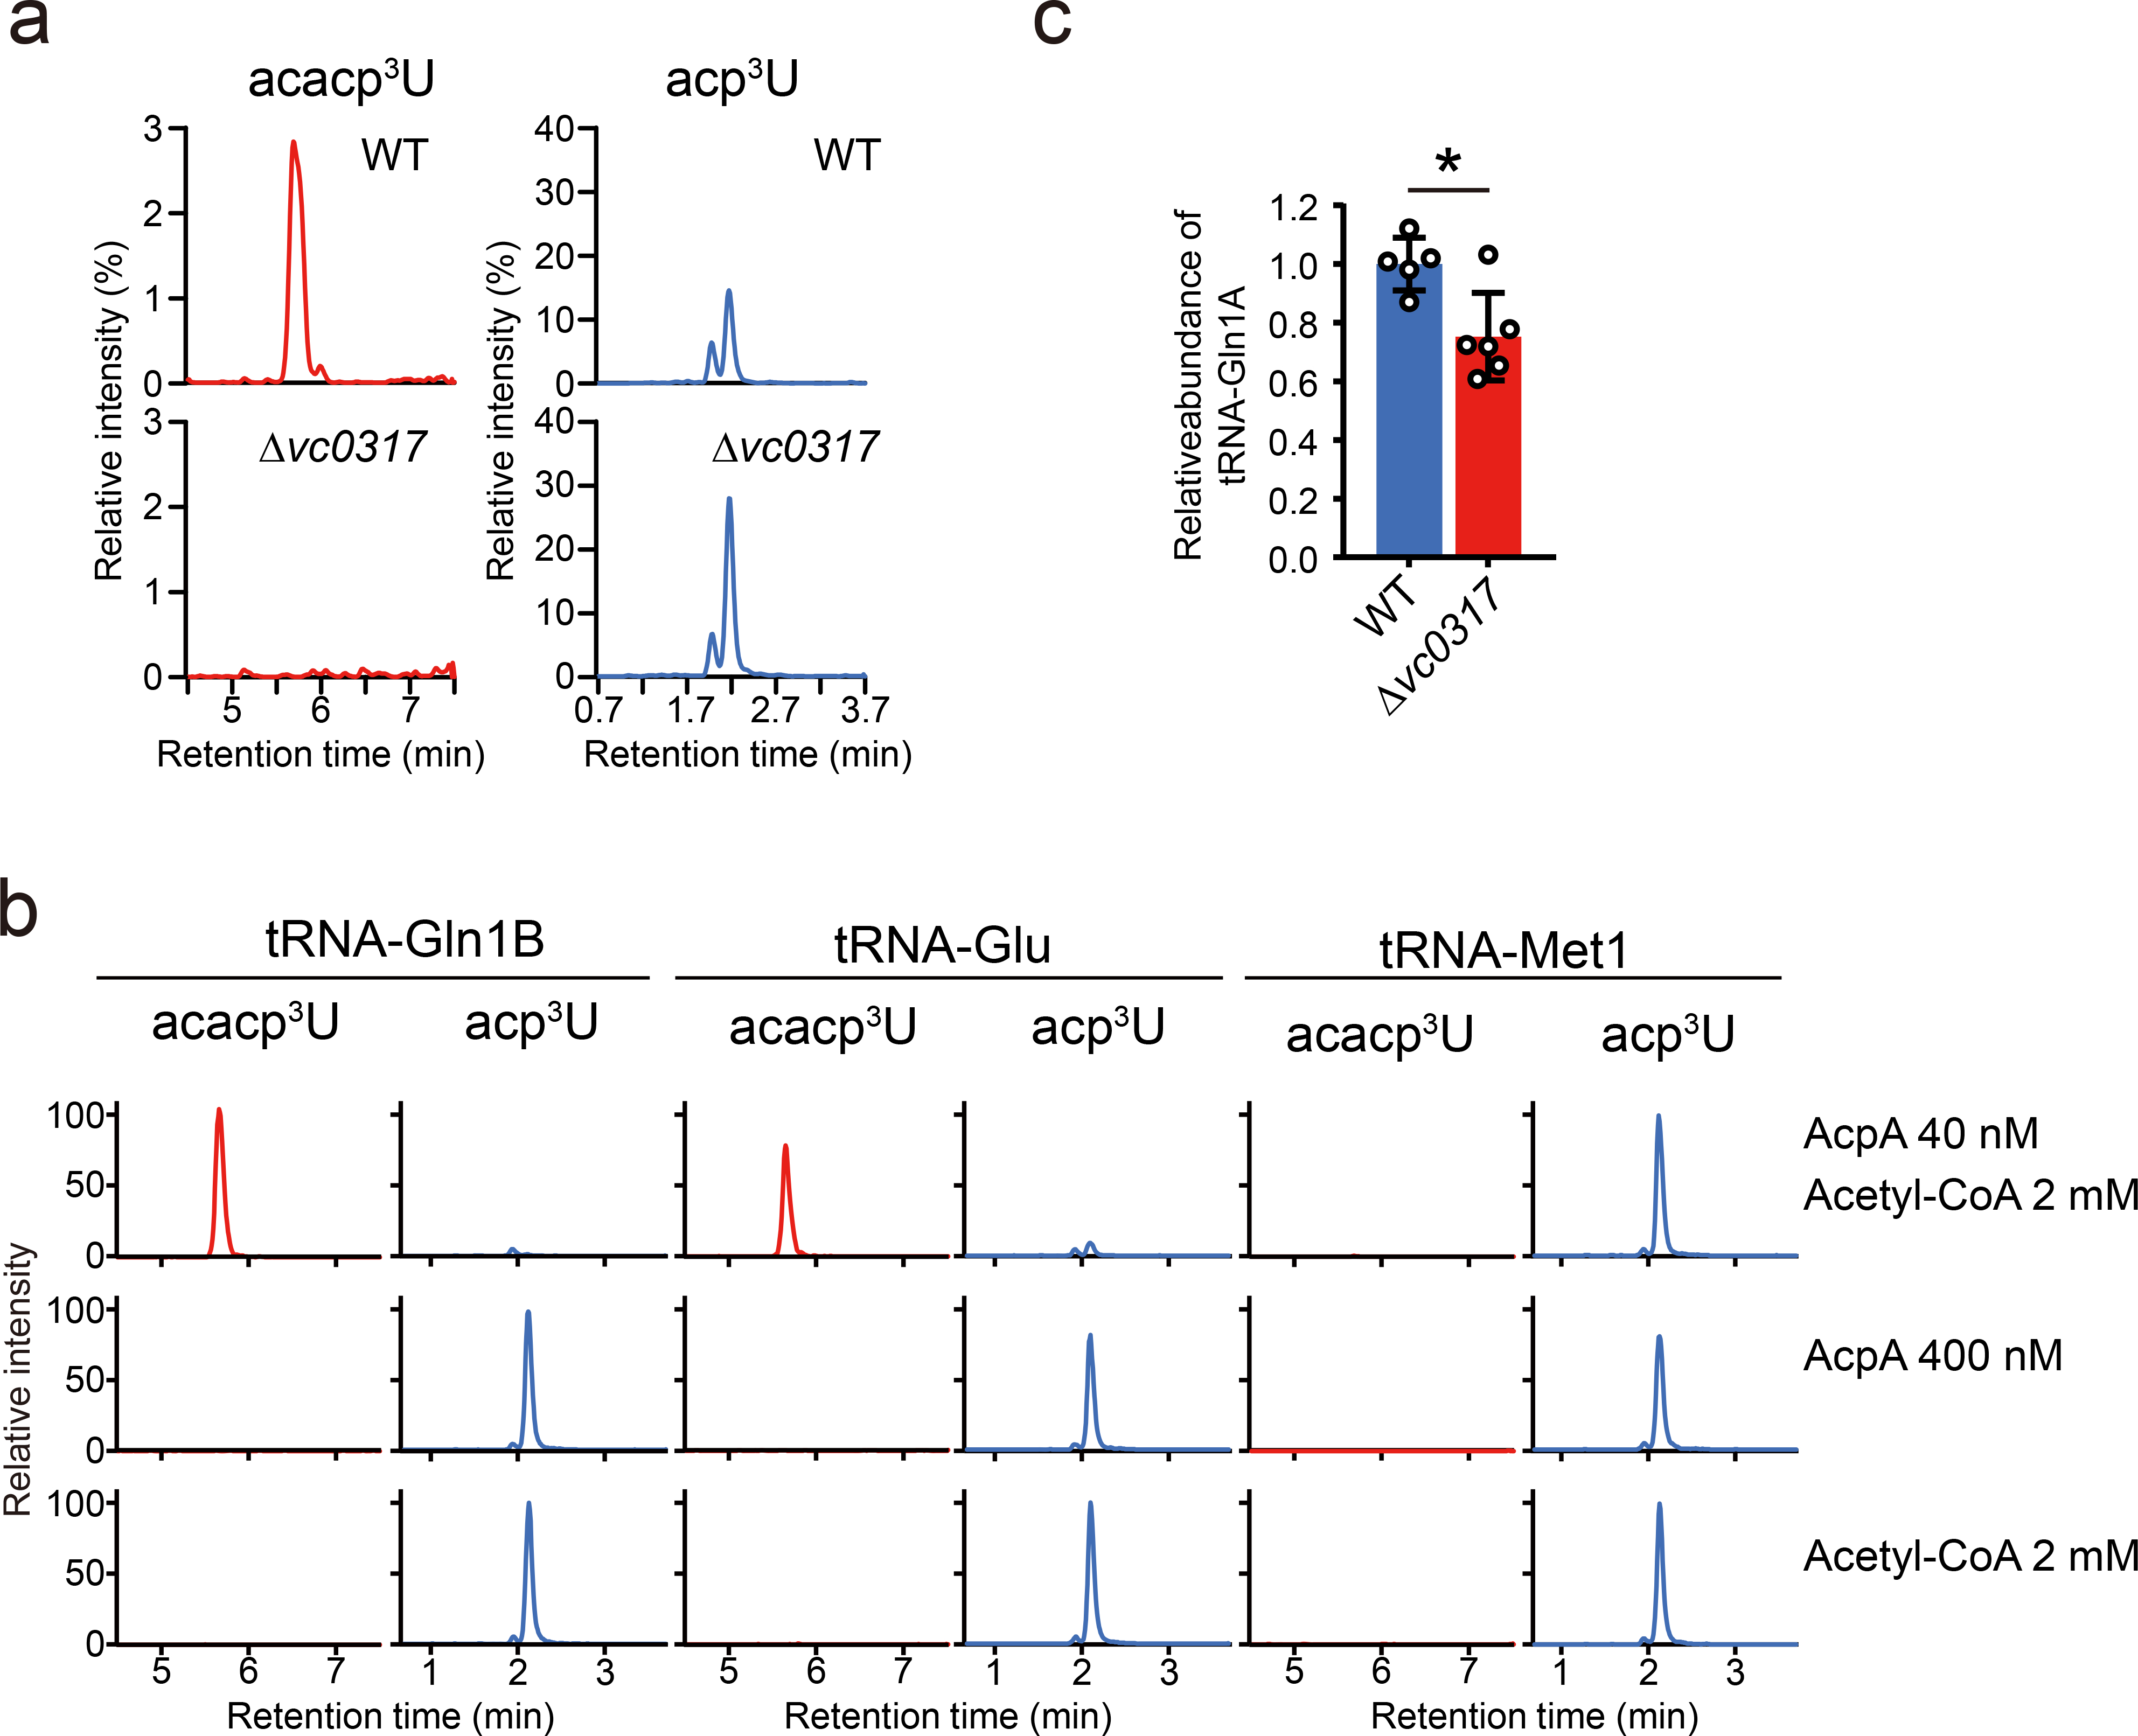
a, vc0317 is required for the acetylation of acacp3U. Nucleoside analyses detecting acacp3U (left) and acp3U (right) in WT (upper) and Δvc0317 (lower) strains. Representative data from two independent experiments with similar results is shown.
b, In vitro acetylation of acp3U modified tRNAs to acacp3U. The indicated tRNAs were isolated from Δvc0317 and incubated with the AcpA protein and/or acetyl-CoA and then nucleoside analysis was carried out. The left panels show the detected acp3U and the right panels show the detected acacp3U in the indicated tRNA species. Representative data from two independent experiments with similar results for tRNA-Gln1B and tRNA-Glu and one experiment for tRNA-Met1 is shown.
c, Abundance of tRNA-Gln1A in WT and Δvc0317 strains. tRNAs were quantified through northern blotting and normalized with the abundance of 5S rRNA; and average values, SD, and individual biological replicates (WT; n = 5 and Δvc0317; n = 6) are shown as bars, error bars and circles, respectively (*p = 0.01, two-sided t-test).
We carried out in vitro reconstitution of acacp3U synthesis to gain further insight into the mechanism of acp3U acetylation. Unmodified tRNAs, including tRNA-Gln1B, tRNA-Glu, and tRNA-Met1 (a tRNA species that contains acp3U but not acacp3U in the cell) were purified from the ΔacpA strain and incubated with recombinant AcpA protein and acetyl-CoA, a potential acetyl group donor. In the presence of both factors, we observed the formation of acacp3U in tRNA-Gln1B and tRNA-Glu, but not in tRNA-Met1; omitting either factor eliminated the formation of acacp3U (Fig. 4b). These data establish that AcpA is an acetyltransferase that is sufficient to catalyze acetylation of acp3U in specific tRNA substrates. Interestingly, AcpA targets two different positions in different tRNA species (i.e., U20B in tRNA-Glu and U46 in tRNA-Gln1B) and does not acetylate all tRNAs that contain acp3U, suggesting that structural features of tRNA molecules besides the presence of acp3U dictate AcpA’s substrate specificity. Modestly reduced tRNA-Gln1A levels were observed in log phase cultures of the ΔacpA compared to the wild type strain, suggesting that acetylation of acp3U enhances the stability of this tRNA (Fig. 4c).
C-to-Ψ RNA editing at position 32 in tRNA-Tyr
V. cholerae tRNA-seq analysis also revealed a high misincorporation frequency at C32 in tRNA-Tyr (Fig. 1a). Most sequencing reads contained U rather than C at position 32, even though C is present in all 5 copies of this tRNA gene34 (Supplementary Figure 6). RT-PCR coupled with direct Sanger sequencing confirmed the presence of U at position 32 (Fig. 5a and b), suggesting that cytidine at position 32 in tRNA-Tyr is converted to uridine. To establish that this apparent conversion of C-to-U occurs post-transcriptionally, we conducted metabolic labeling experiments, where V. cholerae was grown in the presence of stable isotope labeled cytidine (15N3-cytidine). Incorporation of labeled CTP into RNA molecules enables monitoring of their fate in tRNAs (Fig. 5c and d). To block the conversion of free cytidine to uridine in the cell, these experiments were carried out in a strain where the gene encoding V. cholerae cytidine deaminase (vc1231) was deleted. In this condition, only cytidine is labeled (Fig 5c and Extended Data Fig. 6), ensuring that any detected labeled nucleosides in tRNA are generated post-transcriptionally from cytidine. The deletion of vc1231 did not affect the apparent C-to-U conversion in tRNA-Tyr (Supplementary Figure 7). Unexpectedly however, nucleoside analysis of isolated tRNA-Tyr revealed labeling of pseudouridine (Ψ) rather uridine (Fig. 5d). The labeled pseudouridine was 2 dalton heavier than natural pseudouridine, consistent with the idea that the apparent C-to-Ψ base conversion eliminates cytidine’s amino group (Fig. 5c). This observation does not contradict the sequencing results because pseudouridine is detected as uridine in sequencing. Fragment analysis of tRNA-Tyr was carried out to further corroborate the hypothesis that C32 undergoes post-transcriptional conversion to pseudouridine. We detected the Ψ32-containing fragment (AGAΨp, m/z 1326.0) and the stable isotope labeled fragment (AGAΨ*p, m/z 1328.0) in the labeled tRNA (Fig. 5e). These fragments were modifiable by cyanoethylation, which specifically attaches a 53 Da cyanoethyl group to pseudouridine (Fig. 5e). A Ψ32-containing fragment was also observed in WT tRNA-Tyr (Supplementary Figure 8). Together these findings reveal that C32 in tRNA-Tyr undergoes post-transcriptional conversion to Ψ, an editing process that has not been previously described in any organism.
Fig. 5. Cytidine at position 32 in tRNA-Tyr undergoes C-to-Ψ RNA editing.
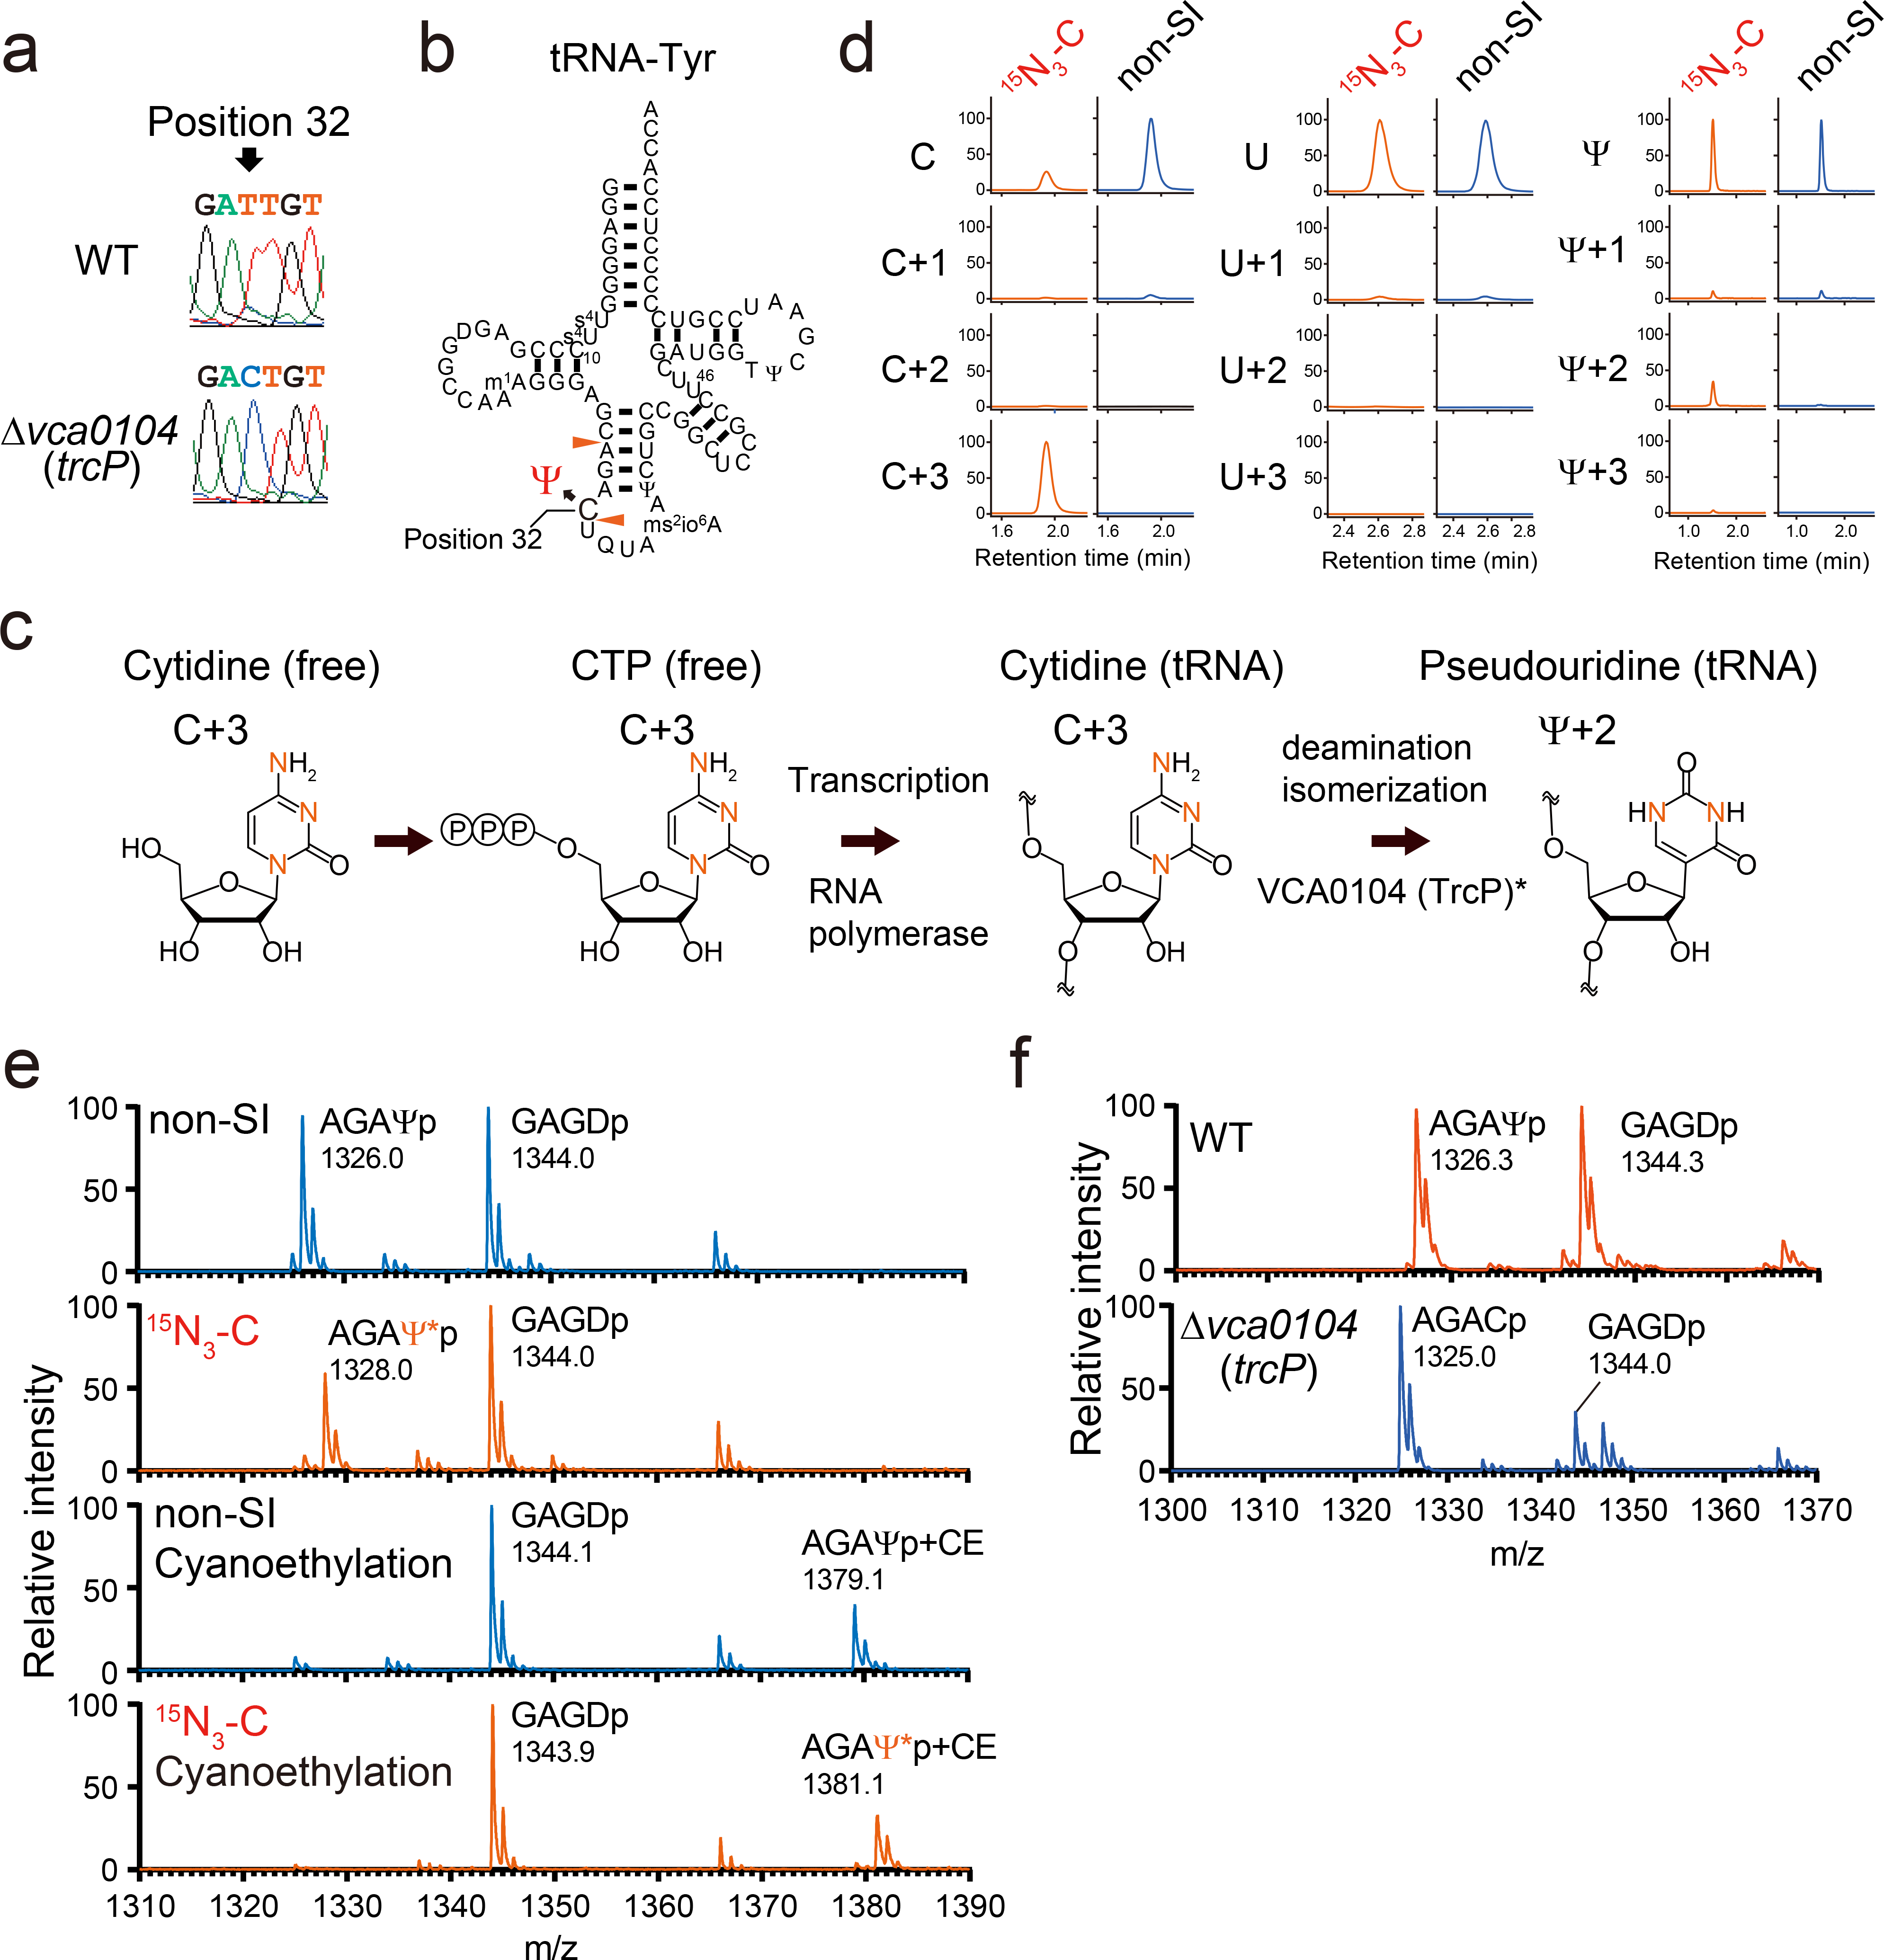
a, Sanger sequencing of cDNA of tRNA-Tyr from WT (top) and Δvca0104 (bottom) strains. Position 32 is indicated by the arrow.
b, Secondary structure of tRNA-Tyr with modifications based on fragment analyses (Extended Data Fig. 2 and Extended Data Fig. 7 and Supplementary Data 3). RNase A cleavage sites that form the fragment containing position 32 are indicated by red arrowheads.
c, Proposed scheme for the conversion of the isotope labeled cytidine to pseudouridine. Red letters represent 15N. *VCA0104 (TrcP) is required for the C-to-Ψ conversion, but its sufficiency for the process has not been established.
d, Nucleoside analysis of purified tRNA-Tyr isolated from Δvc1231, a strain deficient in the conversion of cytidine to uridine and cultured with 15N3-cytidine (15N3-C) or cytidine (non-SI). The detected nucleosides are indicated on the left. Representative data from two independent experiments with similar results is shown.
e, Fragment analyses of an oligo protected portion (position 10 to 46) of tRNA-Tyr isolated from the Δvc1231 strain grown with either cytidine (non-SI) or stable isotope labeled cytidine (15N3-C). In the lower two panels, oligo protected portions were incubated with acrylonitrile, which specifically cyanoethylates (CE) pseudouridine, increasing its mass by 53 Da. m/z values of detected peaks with assigned fragment sequences are shown. Ψ* indicates stable isotope labeled Ψ, which is 2Da heavier. The MALDI analyses were conducted in negative polarity mode. Representative data from two independent experiments with similar results is shown.
f, Fragment analysis of an oligo protected portion (position 10 to 46) of tRNA-Tyr from WT and Δvca0104 (trcP) strains. m/z values of detected peaks with assigned fragment sequences are shown. The MALDI analyses were conducted in negative polarity mode. Representative data from two independent experiments with similar results is shown.
C-to-Ψ conversion requires vca0104 (trcP)
In E. coli, a subset of tRNAs contain uridine at position 32 some of which are converted to pseudouridine by RluA35. Blast searches revealed that V. cholerae has two homologs of E. coli RluA, VC2505 (e-value 1.26E-79) and VCA0104 (e-value 1.28E-57). We tested if these genes were required for the C-to-Ψ conversion in tRNA-Tyr. Nucleoside analysis of isolated tRNA-Tyr from WT, Δvc2505, and Δvca0104 strains revealed that the abundance of pseudouridine was decreased in the Δvca0104 but not in the Δvc2505 mutant (Supplementary Figure 9), suggesting that VCA0104 targets tRNA-Tyr. Fragment analysis demonstrated that the Δvca0104 strain contained the C32-containing fragment (AGACp, m/z 1325.0), instead of the U32- or Ψ32-containing fragment (Fig. 5f and Supplementary Figure 8). Moreover, direct Sanger sequencing confirmed the presence cytidine at position 32 in tRNA-Tyr in the Δvca0104 mutant strain (Fig. 5a). Collectively, these findings reveal that vca0104 is required for the C-to-Ψ conversion, and we renamed this gene trcP (tRNA C-to-Psi conversion).
Discussion
Our findings demonstrate that comparative tRNA-seq provides a high-throughput method for cataloging sites of likely tRNA modification and identifying tRNA species or conditions warranting more in-depth analyses. By combining comparative tRNA-seq and RNA mass spectrometry to characterize V. cholerae’s tRNA, we uncovered a species-specific modification (m1A) and discovered a new tRNA modification (acacp3U) and evidence for C-to-Ψ RNA editing, a process not previously observed. By coupling in silico comparative genomics analyses with genetic and biochemical approaches, we identified genes required for the synthesis of these modification and editing processes. Identification of these biosynthesis pathways open avenues for future investigations of the physiological and molecular functions of these modifications.
Our approach led to the identification of modifications that resulted in strong RT-signatures in tRNA-seq. However, an important limitation of our pipeline is the presence of ‘silent’ modifications that do not result in RT-derived signatures. The variation in the frequency of misincorporation and termination may be accounted for by variation in the mechanisms of inhibition of reverse transcription. For example, modifications present in the interface of Watson-Crick base pairing tend to have stronger RT-derived signatures, e.g., acp3U and m1G, whereas modifications that do not affect base pairing tend to be silent, e.g., 2’-O-methylation, and T. Multiple groups have developed RNA sequencing methods to detect specific silent modifications using ex-vivo chemical treatments that convert silent modifications into predictable ones25. The integration of such techniques will expand the repertoire of the modifications that are predicted in tRNA-seq.
We found that V. cholerae has acp3U and its acetylated derivative, acacp3U, at three positions of tRNAs, 20B, 46, and 47. Recent studies identified the enzyme TapT/TuaA that synthesizes acp3U in E. coli and eukaryotes36,37. As noted by another group, Vibrio cholerae encodes three paralogs of TapT36. We propose that these three TapT paralogs mediate acp3U formation at the three different tRNA sites.
RNA editing processes are widely observed. In particular, A-to-I editing has been found in all three domains of life where it modifies a broad range of biological processes, including sub-stoichiometric expression of SNP variants, inhibiting RNA stimulation of innate immune signaling, and modulation of tRNA codon recognition7,38,39. C-to-U editing has been reported in eukaryotes40,41 and archaea42, but not in bacteria. The functions of C-to-U editing in tRNAs have not been extensively characterized, but editing has been shown to modulate tRNA codon recognition and stability39,42. There are several examples of RNA editing coupled with other modification processes such as methylation. In Trypanosoma, C32 is methylated to m3C and then C-to-U editing yields m3U; these reactions are carried out by an enzyme complex composed of a methyltransferase (Trm140) and an RNA deaminase (ADAT2/ADAT3)43. Like the C-to-m3U conversion, it is possible that the C-to-Ψ conversion also occurs in a step wise fashion, where C-to-U editing is followed by pseudouridylation. We discovered that trcP, a gene annotated as a pseudouridylase, is required for the C-to-Ψ conversion. The TrcP protein is predicted to contain two domains: a C-terminal pseudouridylase domain and an N-terminal domain of unknown function. It is tempting to speculate that these two domains might cooperatively or sequentially promote C-to-Ψ conversion. Future elucidation of the molecular mechanisms that underlie C-to-Ψ conversion and its physiological significance are required.
Finally, our data revealed substantial diversity in tRNA modifications among phylogenetically closely related organisms, V. cholerae and E. coli. Since the full complement of tRNA modifications have been well characterized in only a few model organisms, e.g., E. coli and Saccharomyces cerevisiae, it is likely that there is a plethora of as yet undescribed modifications. Our approach should be useful to probe the diversity of tRNA modifications throughout all three kingdoms of life.
Online Methods
Strains and culture conditions
The strains used in this study are listed in Supplementary Table 2. V. cholerae C6706, a clinical isolate44, and E. coli MG1655 were used in this study as wild-type strains. All V. cholerae, E. coli, and V. parahaemolyticus strains were grown in LB containing 1 % NaCl at 37 °C. E. coli SM10 (lambda pir) harboring derivatives of pCVD44245 was cultured in LB plus carbenicillin (Cb). Antibiotics were used at the following concentrations: 200 μg/mL streptomycin, 50 μg/mL Cb. Aeromonas hydrophila and Shewanella oneidensis were cultured at 30°C in nutrient broth (BD) and Tryptic Soy Broth (BD), respectively.
Strain construction
All mutations in C6706 were created using homologous recombination and a derivative of the suicide vector pCVD44245. Targeting vectors for gene deletions contained ~1000 bp of DNA flanking each side of the target gene cloned into pCVD442’s SmaI site using isothermal assembly.
RNA extraction
Total RNA was extracted with TRIzol (Life Technologies) according to the manufacturer’s instructions. The tRNA fraction was cut out from 10 % TBE-Urea gels and recovered by isopropanol precipitation.
Isolation of individual tRNA species
One liter cultures of log-phase (OD600 = 0.3) and stationary phase (24h) V. cholerae cells were harvested, and total RNA was extracted10. Briefly, cells were resuspended in 5 mL buffer [50 mM NaOAc, pH 5.2, 10 mM Mg(OAc)2], mixed with 5 mL water saturated phenol, and agitated vigorously for 1 h. The aqueous phase was separated by centrifugation, washed with chloroform, and recovered by isopropanol precipitation. RNA was run through a manually packed DEAE column (GE healthcare) to remove contaminants. Typically for 1 L culture, total RNA resolved in 10 ml of the equilibration buffer (100 mM Hepes-KOH pH 7.4) is loaded on 2 ml of DEAE beads equilibrated with 20 ml of the equilibration buffer. Beads are sequentially washed with 10 ml of the equilibration buffer and 10 ml of wash buffer (100 mM Hepes-KOH pH 7.4 and 300 mM NaCl). RNA fraction is eluted with 10 ml of the elution buffer (100 mM Hepes-KOH pH 7.4 and 1 M NaCl) and recovered by isopropanol precipitation. Individual tRNA species were purified using biotinylated DNA probes anchored to high-capacity streptavidin agarose resin (GE Healthcare). Typically for 2 mg of the RNA fraction treated with DEAE beads is mixed with 200 to 400 μl of beads which are bound to 4 nmol of probes in 30 mM Hepes-KOH, pH 7.0, 1.2 M NaCl, 15 mM EDTA, and 1 mM DTT at 68 °C for 30 min with shaking. Beads were washed three times with 15 mM Hepes-KOH, pH 7.0, 0.6 M NaCl, 7.5 mM EDTA, and 1 mM DTT and seven times with 0.5 mM Hepes-KOH, pH 7.0, 20 mM NaCl, 0.25 mM EDTA, and 1 mM DTT. Purified tRNAs were extracted from beads with TRIzol. After Turbo DNase (Thermo Fisher Scientific) treatment to remove residual DNA probes, purified tRNAs were purified on 10 % TBE-Urea gels. The probes used in this study are listed in Supplementary Data 6.
tRNA sequencing
Total tRNA fraction (250 ng) was deacylated in 500 μl of 100 mM Tris-HCl pH 9.0 at 37 °C for 1 hr and recovered by isopropanol precipitation. After dephosphorylation with alkaline phosphatase from calf intestine (New England Biolabs), tRNAs were ligated to 100 pmol of 5’ adenylated and 3’ end-blocked DNA oligo (3’ linker, Supplementary Data 5) using truncated T4 RNA ligase at 25 °C for 2.5 hr in 25 % PEG 8000. The ligated product was purified on a 10 % TBE-Urea polyacrylamide gel (Thermo Fisher Scientific) as above. Half of the recovered ligated tRNAs were reverse transcribed with 5 pmol TGIRT-III (InGex) in 100 mM Tris-HCl pH 7.5, 0.5 mM EDTA, 450 mM NaCl, 5 mM MgCl2, 5 mM DTT, 1 mM dNTPs, and 1.25 pmol primer (ocj485, Supplementary Data 5) at 60 °C for 1 hr. After the elimination of template RNAs by alkali treatment, cDNA was purified on a 10 % TBE-Urea polyacrylamide gel. The single stranded cDNA was then circularized using 50 U of CircLigase II(Epicenter) at 60 °C for 1 hr, followed by addition of another 50 U of CircLigase II for an additional 1 hr at 60 °C. cDNA was amplified using Phusion DNA polymerase (New England Biolabs) with o231 primer and index primers (Supplementary Data 6). After 12–18 rounds of PCR amplification, the product was gel purified from an 8 % TBE-Urea polyacrylamide gel (Thermo Fisher Scientific). Sequencing was performed using an Illumina miSeq. 3’ linker sequences and one nucleotide at the 5’ end was trimmed. Bowtie46 v. 1.2.2 with default settings was used for mapping reads to reference tRNA sequences (Supplementary Data 6) retrieved from tRNAdb27. Two sequences in V. cholerae (tdbD00003706, tdbD00008082) and three sequences in E. coli (tdbD00007320, tdbD00010329, and tdbD00011810) were eliminated from the reference sequences due to extremely low coverage. Mpileup files were made using the samtools mpileup command without any filtration (option, -A –ff 4 -x -B -q 0 -d 10000000 -f). The frequency of misincorporation was calculated in each mpileup file. 5’ end termini of the mapped reads were piled up using the bedtools genomecov command (option, -d -5 -ibam). To calculate the termination frequency, the number of 5’ termini at any given position was divided by the total number of mapped termini at the given position along with all upstream positions (5’ side). Frequencies of misincorporation and termination of one replicate were visualized with R (3.4.3) or Graphpad Prism.
Reference sequences of E. coli tRNAs along with the catalogue of modifications in the tRNA database and the literature27,47–54 (Supplementary Data 1 and Supplementary Table 1) were used to assign modifications to the E. coli tRNA-seq data in Extended Data Fig. 1b. Misincorporation frequencies of > 5% at sites of modification in the reference database were used as a threshold for assignment of predicted modifications. Termination frequencies of >5% were also used as a threshold for assignments of modified sites; however, since termination signals were usually detected two nucleotides downstream from known modified sites, assignments were adjusted accordingly (except for DD, acp3U, k2C, and m6t6A (see Supplementary Table 1)). E. coli modifications were considered to be predictable when signals (either of misincorporation or termination) were present in ≥ 50% of known modified sites.
V. cholerae modifications were also assigned with >5% thresholds for misincorporation or termination. Although G at position 10 (G10) in several tRNAs and G at position 35 (G35) in tRNA-Leu2 have misincorporation signals greater than 5%, they were excluded from further analysis because these signals were also observed in the E. coli data, where G10 and G35 modifications have not been reported. These elevated misincorporation signals may arise from other factors including residual secondary or tertiary structures or specific sequence contexts influencing reverse transcription.
Northern blotting
In total, 0.3 μg RNA was electrophoresed on 10 % Novex TBE-Urea gels (Thermofisher) and stained with SYBR Gold (Life Technologies). RNA was transferred to nitrocellulose membranes by semidry blotting and cross-linked twice to membranes with 1200 μJ UV light. Membranes were incubated in ULTRAhyb-oligo (Life Technologies) at 42 °C for 30 min followed by hybridization overnight at 42 °C with 4 pmol DNA probes radiolabeled with [γ−32P]ATP (PerkinElmer) and T4 Polynucleotide kinase (New England Biolabs). Membranes were washed twice with 2 × SSC/0.5 % SDS, and then bound probe was detected using an FLA-5000 phosphoimager (Fuji). The signal intensity of tRNA was normalized to that of 5S rRNA. All DNA oligos were synthesized by Integrated DNA Technology. Probe sequences are listed in Supplementary Data 6.
Nucleoside analysis
100 ng of total RNAs or isolated tRNAs were digested with 0.5 unit Nuclease P1 and 0.1 unit of phosphodiesterase I in 22 μl reactions containing 50 mM Tris-HCl pH 5.3, 10 mM ZnCl2 at 37 °C for 1 h. Reaction mixtures were then mixed with 2 μl 1M Tris-HCl pH 8.3 and 1 μl of 1 unit/μl Calf Intestine phosphatase and incubated at 37 °C for 30 min. Enzymes were removed by filtration using 10 K ultrafiltration columns (VWR). 18 μl aliquots were mixed with 2 μl of 50 μM 15N-dA and 2.5–10 μl of digests were injected into a Agilent 1290 uHPLC system bearing a Synergi Fusion-RP column (100 × 2 mm, 2.5 μm, Phenomenex) at 35 °C with a flow rate 0.35 ml/min with a solvent system consisting of 5 mM NH4OAc (Buffer A) and 100 % Acetonitrile (Buffer B). The gradient of acetonitrile was as follows: 0 %; 0–1 min, 0–10 %; 1–10 min, 10–40 %; 10–14 min, 40–80 %; 14–15 min, 80–100 %; 15–15.1 min, 100 %; 15.1–18 min, 100–0 %; 18–20 min, 0 %; 20–26 min. The eluent was ionized by an ESI source and directly injected into a Agilent 6460 QQQ. The voltages and source gas parameters were as follows: gas temperature; 250 °C, gas flow; 11 L/min, nebulizer; 20 psi, sheath gas temperature; 300 °C, sheath gas flow; 12 L/min, capillary voltage; 1800 V, and nozzle voltage; 2000 V.
Dynamic multiple reaction monitoring (MRM) was carried out to survey known modifications. The retention time windows and m/z values of precursor and product ions for dynamic MRM analyses are listed in Supplementary Data 4.
The neutral loss scan (NLS) method was used to search for unknown modifications. For one run, we used ~50 mass values of precursor ions with 1 Da intervals. Then, a mass of the product ion was set 132 Da lighter than that of the precursor ion, a value corresponding to the loss of a ribose moiety. We performed five runs to cover precursor ions whose m/z values ranged from 244 to 445. The presence of N387 was then confirmed by MRM analysis.
For MS/MS analysis, hydrolyzed 1 μg of isolated tRNAs or 5 ng of acacp3U chemical standard were analyzed. In this analysis, we selected singly-protonated ions with m/z 388 for N387 and 346 for acp3U as precursor ions in the first quadrupole, respectively; after CID in the second quadrupole, an m/z scan from 10 to 1000 was carried out in the third quadrupole, yielding the mass spectra of the fragments.
To measure the mass of N387 accurately, 2.5 μg of tRNA-Glu was digested as described above and 500 ng of the digest was subjected to the HPLC system described above coupled with an Agilent 6520 quadrupole time-of-flight (QTOF) mass spectrometer. An offset value that is an average error ppm value of 5.9 ppm in known nucleosides (including A, G, Gm, mnm5s2U, and m2A), was added to the measured mass value (387.1251) to obtain the calibrated mass value of N387 (387.1274). The chemical formula was explored in ChemCalc Molecular Formula Finder30 with the following constraints: C,9–100, H,0–100, N,2–10, O,5–10, S,0–3, unsaturation,3–8, with restriction to integral unsaturation values.
Chemically synthesized acacp3U was purchased from Carbosynth LLC.
Fragment analysis
400–1000 ng isolated tRNAs were digested in 3 μl aliquot with 20 ng RNase A (QIAGEN) in 10 mM NH4OAc pH 7, or 20 unit RNase T1 in 10 mM NH4OAc pH 5.3 at 37 °C for 1 hr. On a MALDI steel plate, 0.5 μl of matrix (0.7 M 3-hydroxypicolinic acid (HPA) and 70 mM ammonium citrate in 50 % milliQ water and 50 % acetonitrile) was mounted and dried, followed by mounting of 0.5 μl RNase digests and drying. The samples were analyzed with Bruker Ultraflex Xtreme MALDI-TOF mass spectrometer.
Oligo protection
2.8 and 3.8 μg of tRNA-Tyr from WT and ΔmiaA were mixed with 500 pmol of DNA oligos (Supplementary Data 6) in 50 μl aliquots containing 50 mM Hepes KOH pH 7.6, 150 mM KCl and heated to 90 °C for 1 min and gradually cooled down to room temperature at 1 °C/min for annealing, followed by RNase digestion with 50 ng RNase A and 50 unit RNase T1 on ice for 15 min. Protected DNA/RNA duplexes were purified on 10 % TBE-Urea gels and recovered by isopropanol precipitation and dissolved in 5 μl milliQ water. A 2 μl aliquot was subjected to fragment analysis with RNase A using a MALDI-TOF spectrometer as described above.
Metabolic labeling
Three hundred μl of overnight culture of the V. cholerae Δvc1231 strain grown in LB medium was inoculated into 300 ml M9 medium supplemented with 0.2% glucose, 0.2% Casamino acid, 100 μM adenosine, guanosine, uridine, and 15N3-cytidine (Cambridge Isotope) or non-labeled cytidine and cultured for 4.5 h with shaking. Purification of tRNA-Tyr and mass spectrometric analyses were performed as described above.
Cyanoethylation
Cyanoethylation was done as described with slight modifications19. 4 μl of RNA (1–2 μg) was mixed with 30 μl CE solution (50% ethanol, 1.1 M triethylamine pH 8.6) and 4 μl of 15.2 M Acrylonitrile, followed by incubation at 70 °C for 1 h. The reaction was stopped by addition of 162 μl milliQ water and by placing the reaction tube on ice. RNA was recovered by ethanol precipitation.
Purification of recombinant AcpA protein
The BL21(DE3) strain transformed with pET28b-AcpA was grown in 10 ml LB medium (Km50) overnight and inoculated into 1 L LB medium (Km50) and grown at 37°C with shaking. When optical density (OD600) reached at 0.3, the flask was moved to 18 °C an incubator and shaken for 30 min. AcpA expression was induced by the addition of 1 mM Isopropyl β-D-1-thiogalactopyranoside (IPTG) and the flask was incubated with shaking at 18 °C for 21 hr. Harvested cells were resuspended in 40 ml lysis buffer (50 mM Tris-HCl pH 8.0, 10 mM MgCl2, 10% glycerol, 300 mM NaCl, 0.2 U/mL DNase I, 1 mM PMSF, complete proteinase inhibitor mixture; Roche) and homogenized with an EmulsiFlex for 20 min. Cleared lysate (35 ml) supplemented with 700 μl of 2 M Imidazole (final concentration 40 mM) was mixed with 1.5 ml Ni-NTA beads equilibrated with 10 ml lysis buffer and incubated at 4 °C for 2.5 h with gentle rotation. AcpA bound beads were loaded on an open column (Biorad) and washed twice with 10 ml wash buffer (50 mM Tris-HCl pH 8.0, 10 mM MgCl2, 10% glycerol, 300 mM NaCl, 40 mM Imidazole). AcpA was eluted with Elution buffer 1 (50 mM Tris-HCl pH 8.0, 10 mM MgCl2, 10% glycerol, 300 mM NaCl, 250 mM Imidazole) and Elution buffer 2 (50 mM Tris-HCl pH 8.0, 10 mM MgCl2, 10% glycerol, 300 mM NaCl, 400 mM Imidazole). The two elution fractions were mixed and dialyzed overnight in Dialysis buffer 1 (20 mM Tris-HCl pH 8.0, 300 mM NaCl, 10% Glycerol, 1 mM DTT) and 8 h in Dialysis buffer 2 (20 mM Tris-HCl pH 8.0, 150 mM NaCl, 10% Glycerol, 1 mM DTT). Protein concentration was measured by Qubit (Invitrogen).
In vitro acetylation assay
tRNA-Glu, -Gln1B, and -Met1 were purified from stationary phase ΔacpA cells as described above. Fifty μl of reaction mixture consisting of 20 mM Tris-HCl pH 7.6, 5 mM MgCl2, 50 mM NaCl, 20 unit SuperaseIn (Invitrogen), 20 pmol RNA (400 nM), 2 mM Acetyl-CoA, and 2 or 20 pmol AcpA (40 nM or 400 nM) was incubated at 37 °C for 30 min. RNAs extracted with Trizol reagent were digested into nucleosides and analyzed by RNA mass spectrometry as described above.
Direct sequencing
cDNAs were synthesized from 10 ng purified tRNA-Tyr using Super Script III (Invitrogen) using the Tyr_RT primer. cDNA was amplified by PCR using primers; Tyr_5end_f and Tyr_3end_r. PCR products were sequenced using the Tyr_seq primer. The sequences of the primers are listed in Supplementary Data 6.
Comparative genomics
Protein sequences were retrieved from NCBI (V. cholerae; GCF_000006745.1. V. parahaemolyticus; GCF_000196095, E. coli; GCF_000005845.2, S. oneidenis; GCF_000146165.2, and A. hydrophila; GCF_000014805.1). The V. cholerae protein sequences were queried with the other species’ protein sequences with local BLAST and an E-value threshold of 1E-10 to identify similar sequences. Forty seven V. cholerae proteins that include “acetyltransferase” in their COG names were retrieved from COG 2003–2014 update using R31. Five of these putative acetyltransferases were found to be present in V. cholerae and V. parahaemolyticus, but not in A. hydrophila, S. oneidenis and E. coli when 1E-10 was used as a threshold.
Infant rabbit infection
Mixed-gender litters of 2 day old New Zealand white infant rabbits, cohoused with a lactating mother (Charles River) were inoculated with wild-type V. cholerae as described29. Approximately 20hr post-inoculation, the rabbits were sacrificed and V. cholerae in the cecal fluid was collected by centrifugation. Total RNA was then extracted using TRIzol.
Animal use statement
Infant rabbit studies were conducted according to protocols approved by the Brigham and Women’s Hospital Committee on Animals (Institutional Animal Care and Use Committee protocol number 2016N000334 and Animal Welfare Assurance of Compliance number A4752–01) and in accordance with the recommendations in the Guide for the Care and Use of Laboratory Animals of the National Institutes of Health and the Animal Welfare Act of the U.S. Department of Agriculture.
Data availability Statement
All data is available from the corresponding authors upon request. The data reported in this paper have been deposited in the NCBI Gene expression omnibus https://www.ncbi.nlm.nih.gov/geo/ (accession code; GSE147614).
Code availability
All codes are available from the corresponding authors upon request.
Extended Data
Extended Data Fig. 1. tRNA-seq profiling of tRNA modifications in E. coli.
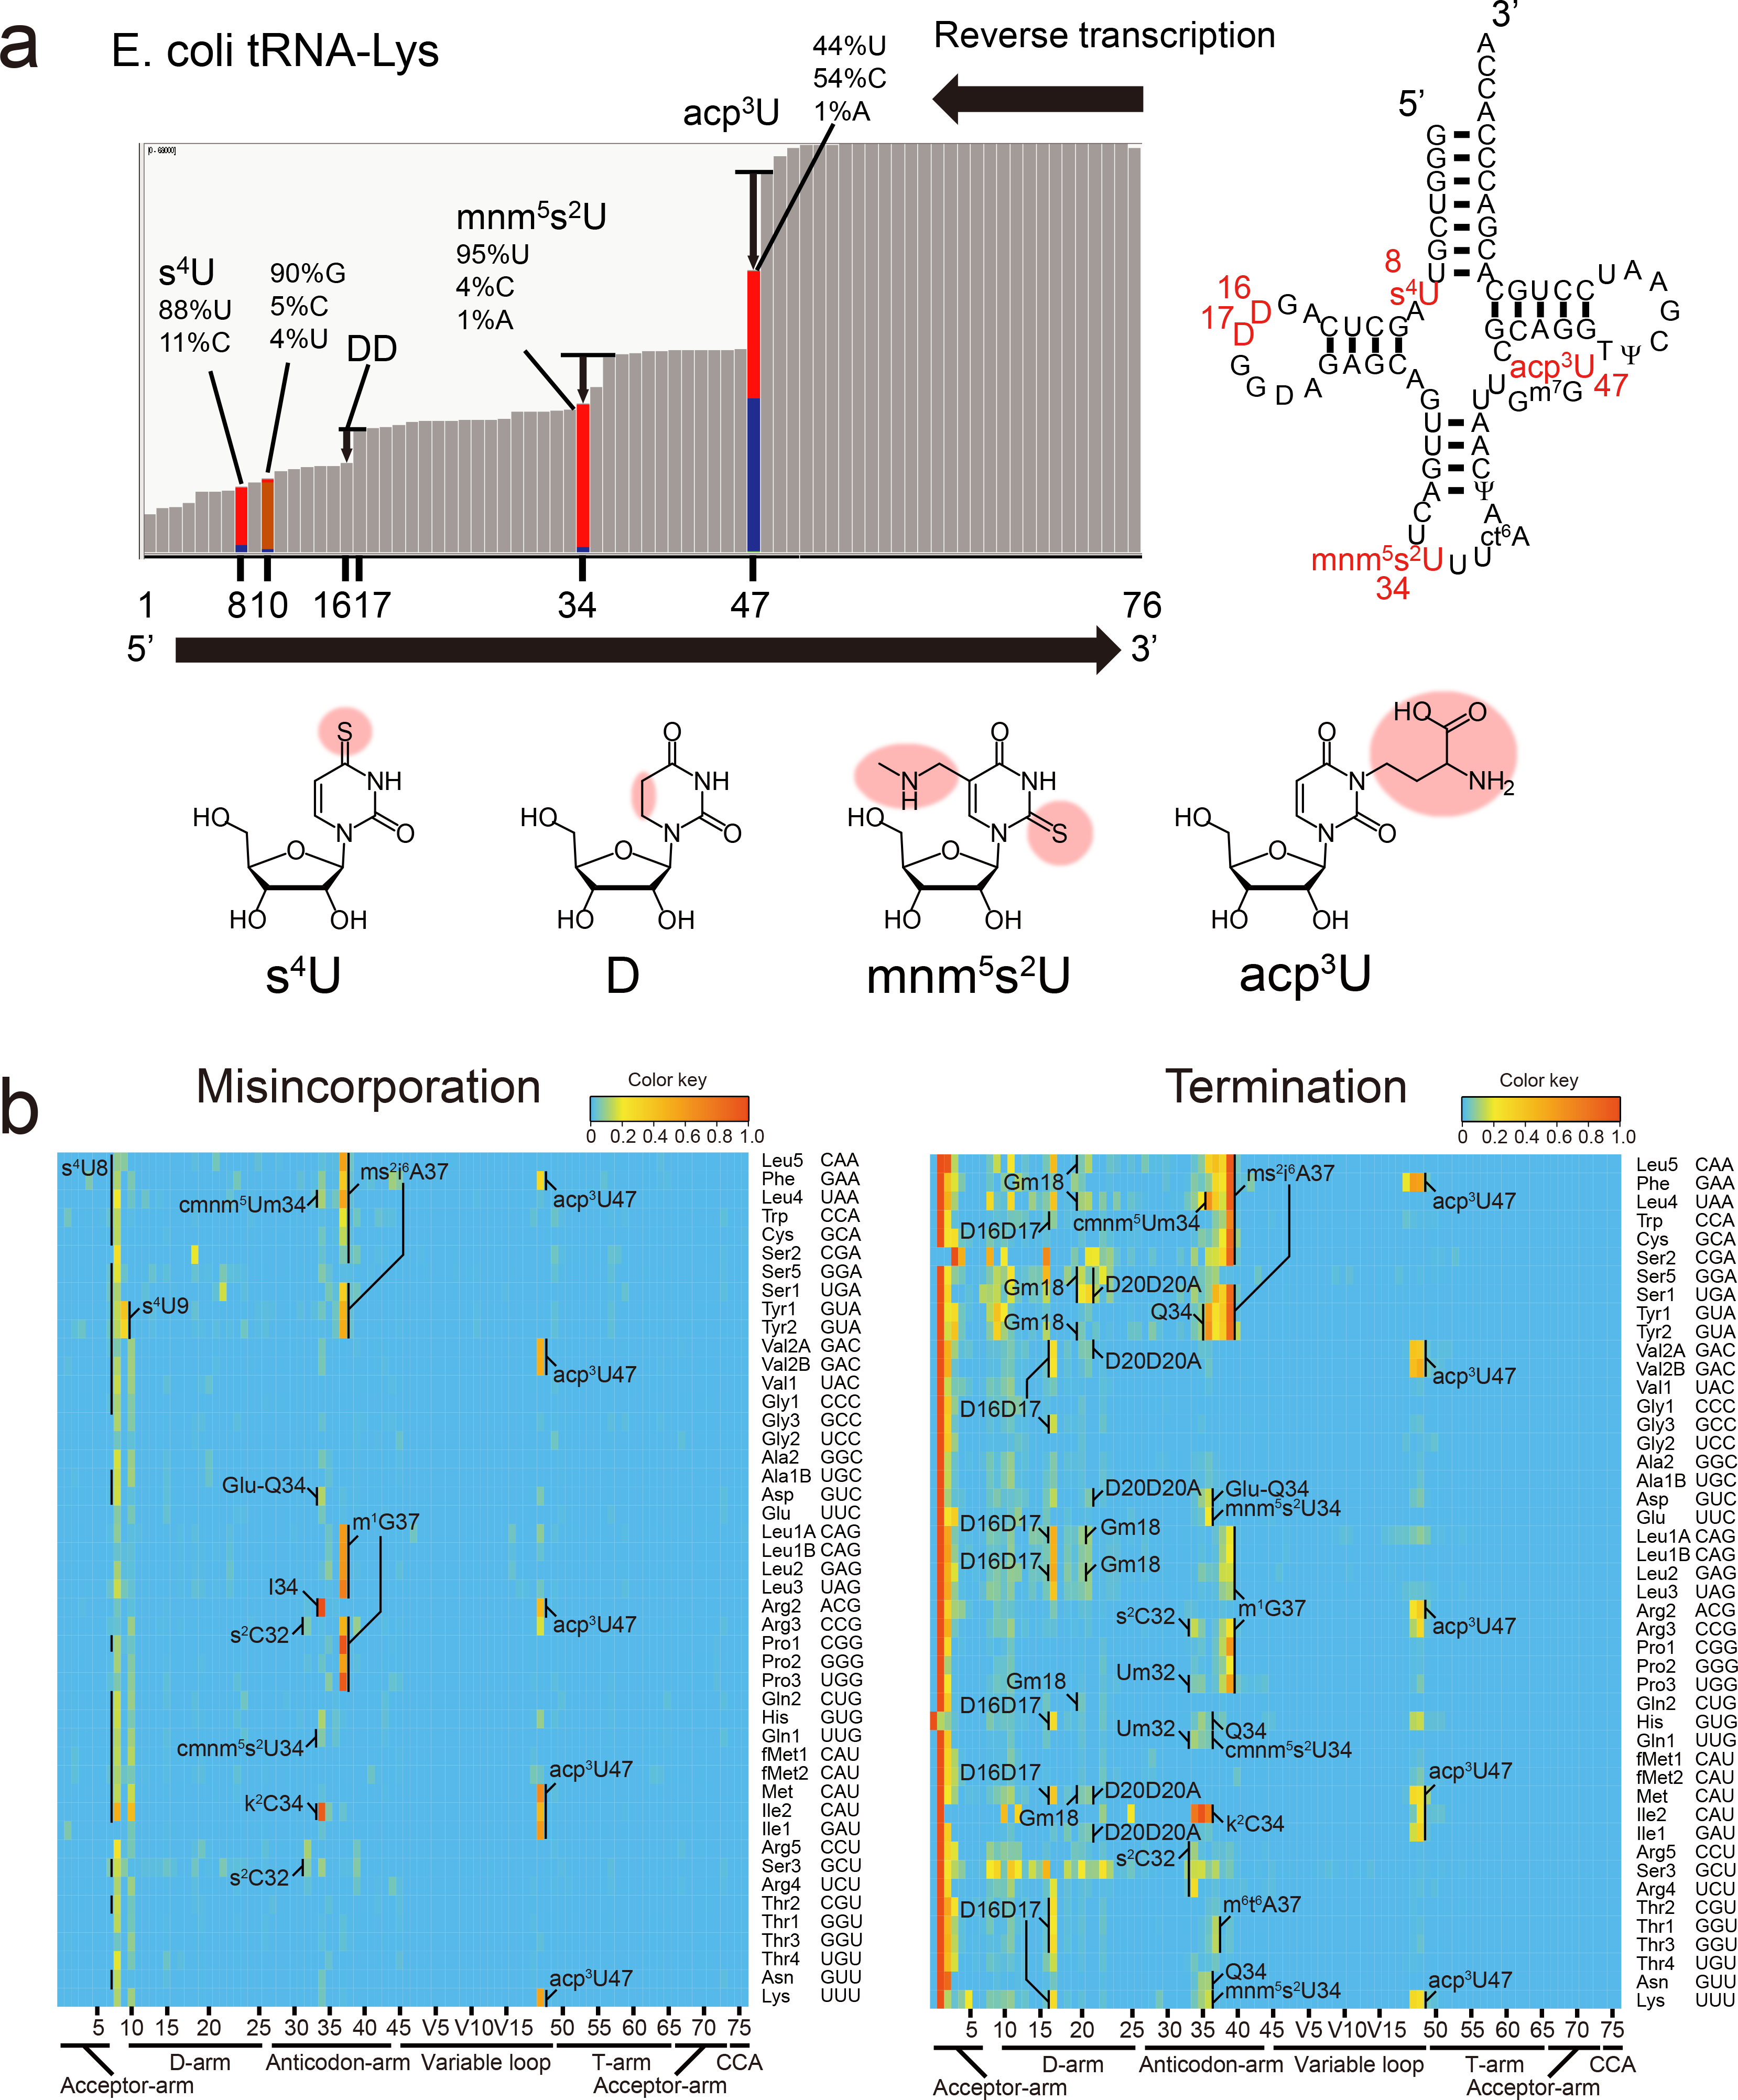
a, Example of the analysis of reverse transcription derived signatures in tRNA-seq data. The bars in the left panel represent mapped read depth with the left side and right side corresponding to the 5’ and 3’ end of tRNAs, respectively. Bars in which the misincorporation frequency is less than 1% are colored in grey; additional colors are shown at sites where there are higher levels of misincorporation (red corresponds to U, blue, C, orange, G and yellow, A). The significance of the misincorporation signal at position 10 is not known. Several drops in depth around sites of known modifications are also apparent (e.g. DD at positions 16, 17); however, the correspondence between the decrease in read depth and sites of modification is less precise than with nucleotide misincorporation. The right panel shows the secondary structure of tRNA-Lys. The structures of some of the modifications that lead to reverse transcription derived signatures are shown in lower panels.
b, Heatmaps of the frequency of misincorporation (left) and stop (termination) of reverse transcription (right) signals in tRNA from stationary phase E. coli. Each row represents an individual tRNA and each column represents a position within tRNAs. The modifications are assigned based on the reference tRNA sequences (Supplementary Data 1 and Supplementary Table 1). The color keys are indicated upper right of the heatmaps. Representative data from one replicate is shown.
Extended Data Fig. 2. Validation of modifications inferred from RT-derived signals by nucleoside analysis.
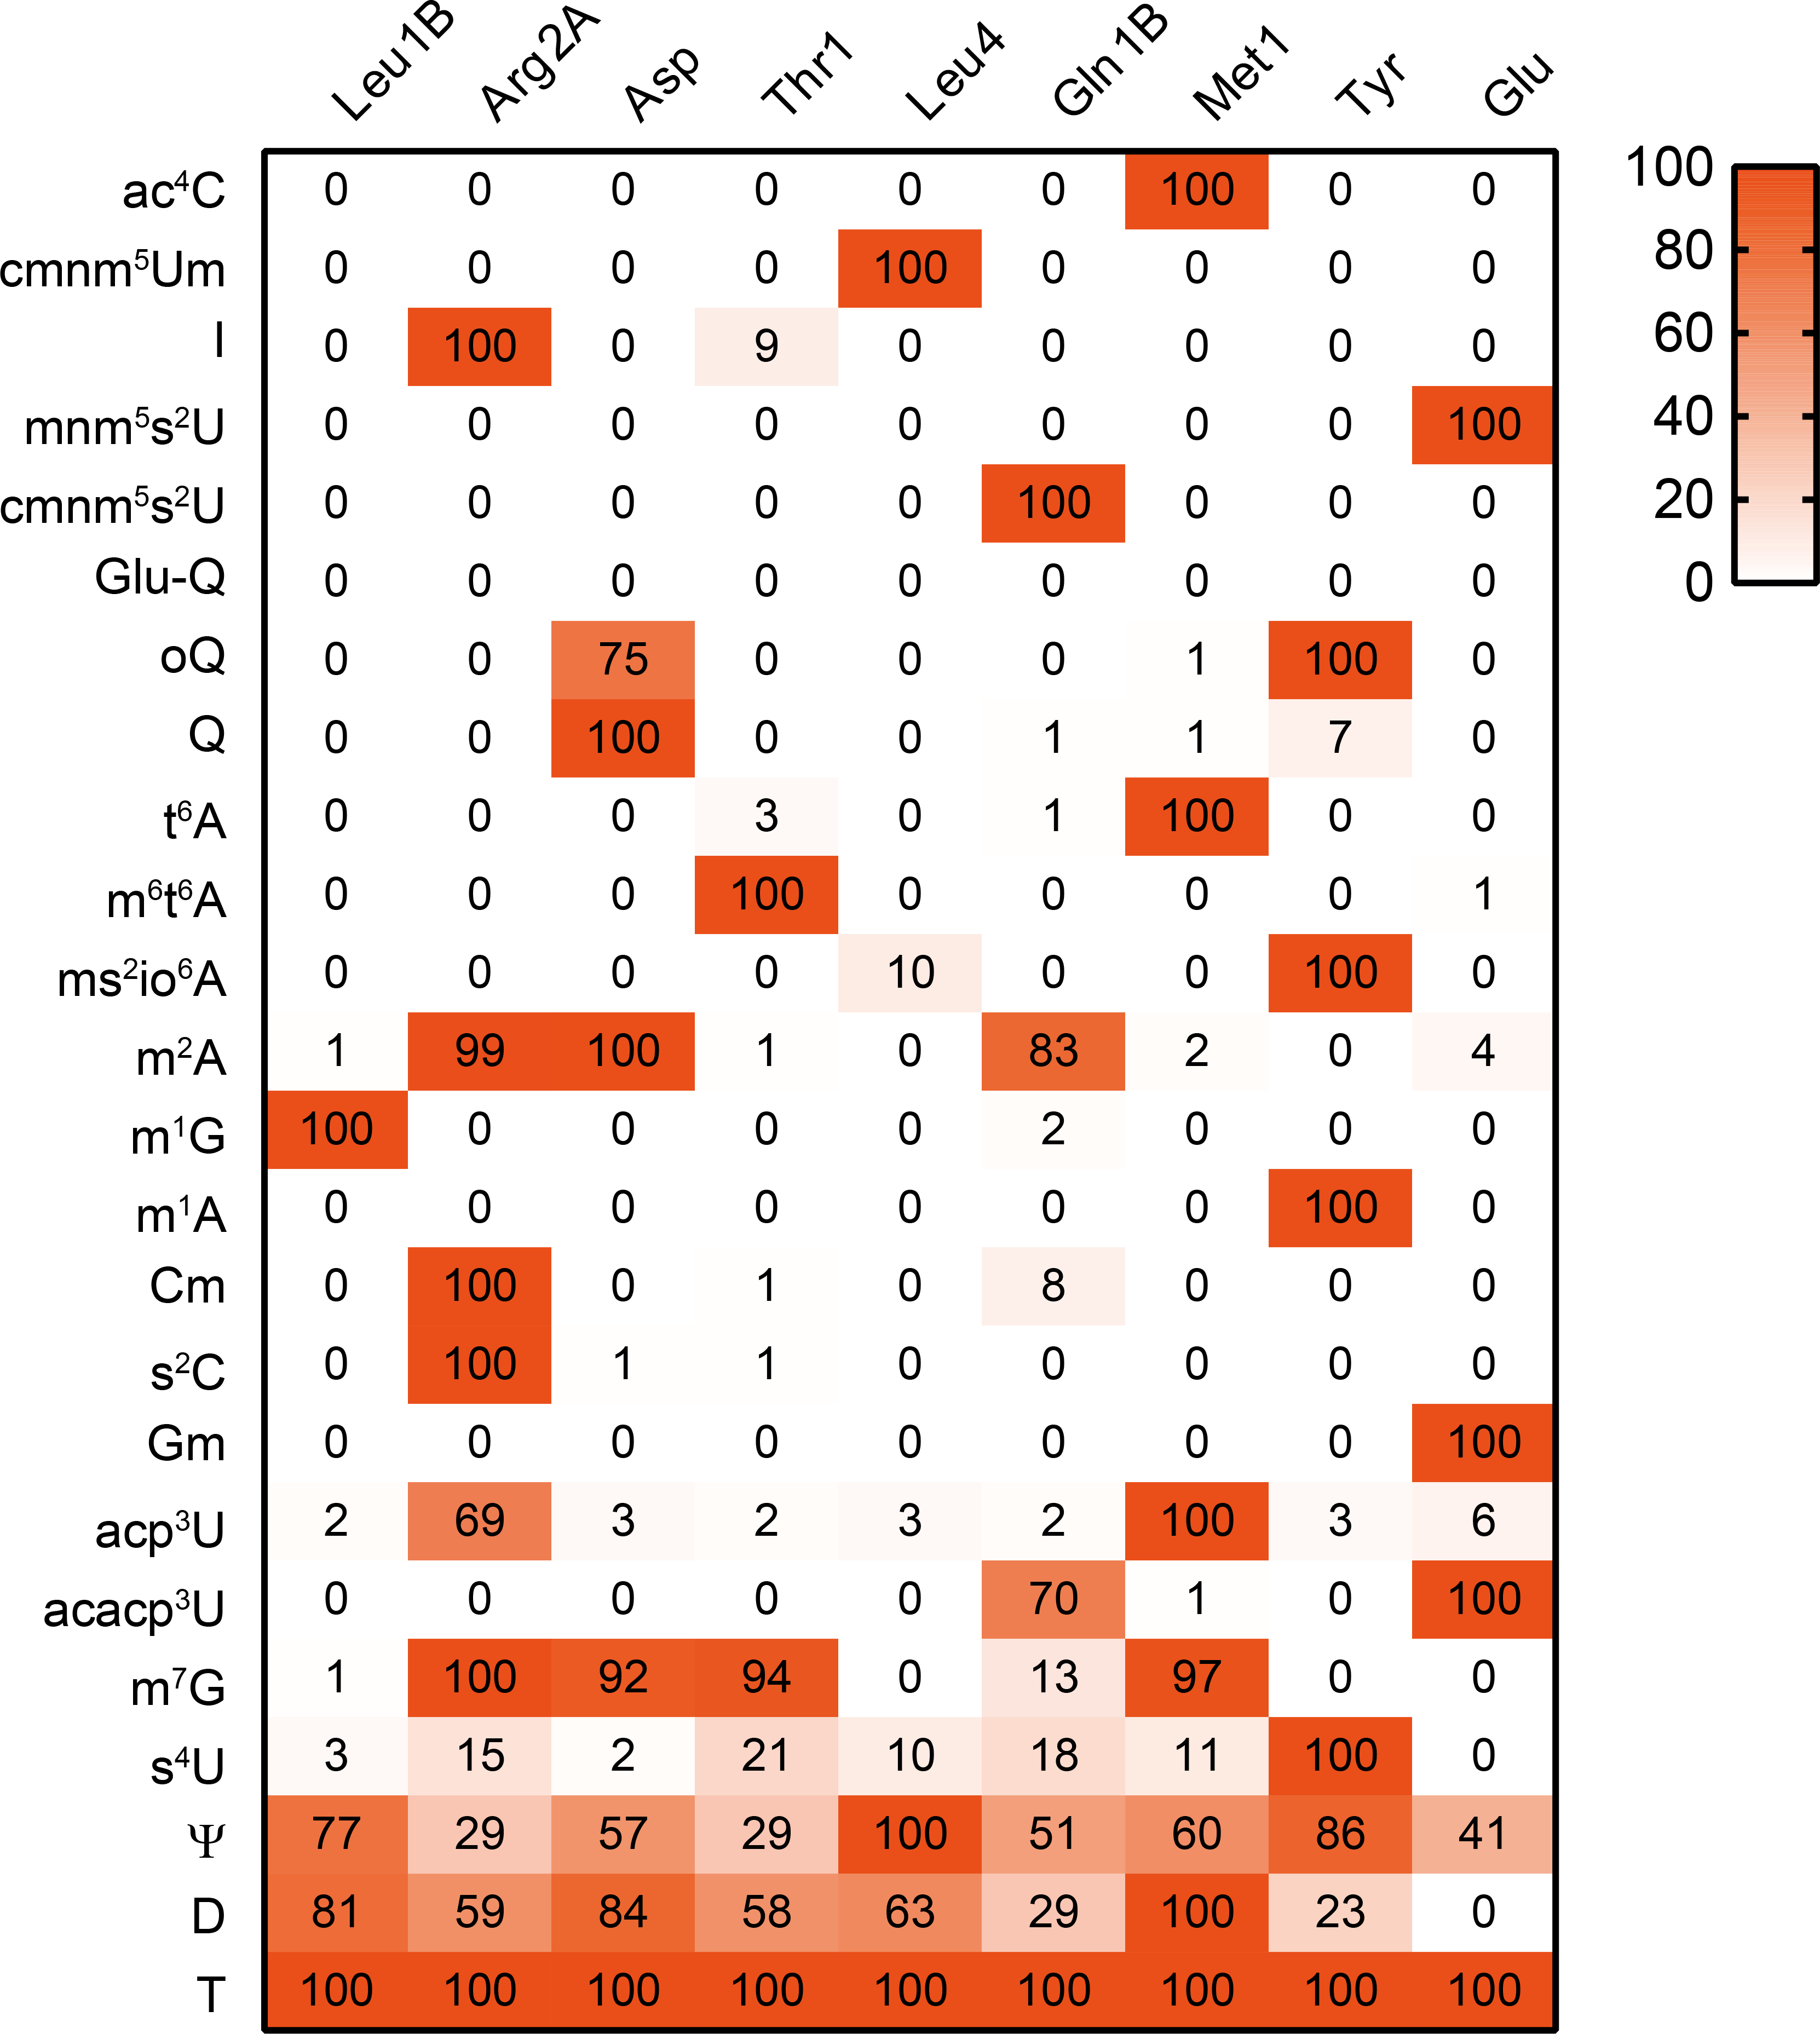
Nucleosides from purified tRNAs were analyzed by mass spectrometry. The area values of a nucleoside was normalized using the signal of T, which is present in all tRNA species as an internal control. The values relative to the maximum number across the nine tRNA species are shown in the heatmap. Glu-Q was not observed in any tRNAs. The presence of most of the modifications were also confirmed in the fragment analyses except for Q in tRNA-Tyr, s2C and I in tRNA-Arg2A, and Ψ. This experiment was performed once.
Extended Data Fig. 3. Validation of modifications inferred from RT-derived signals using mutant V. cholerae strains.
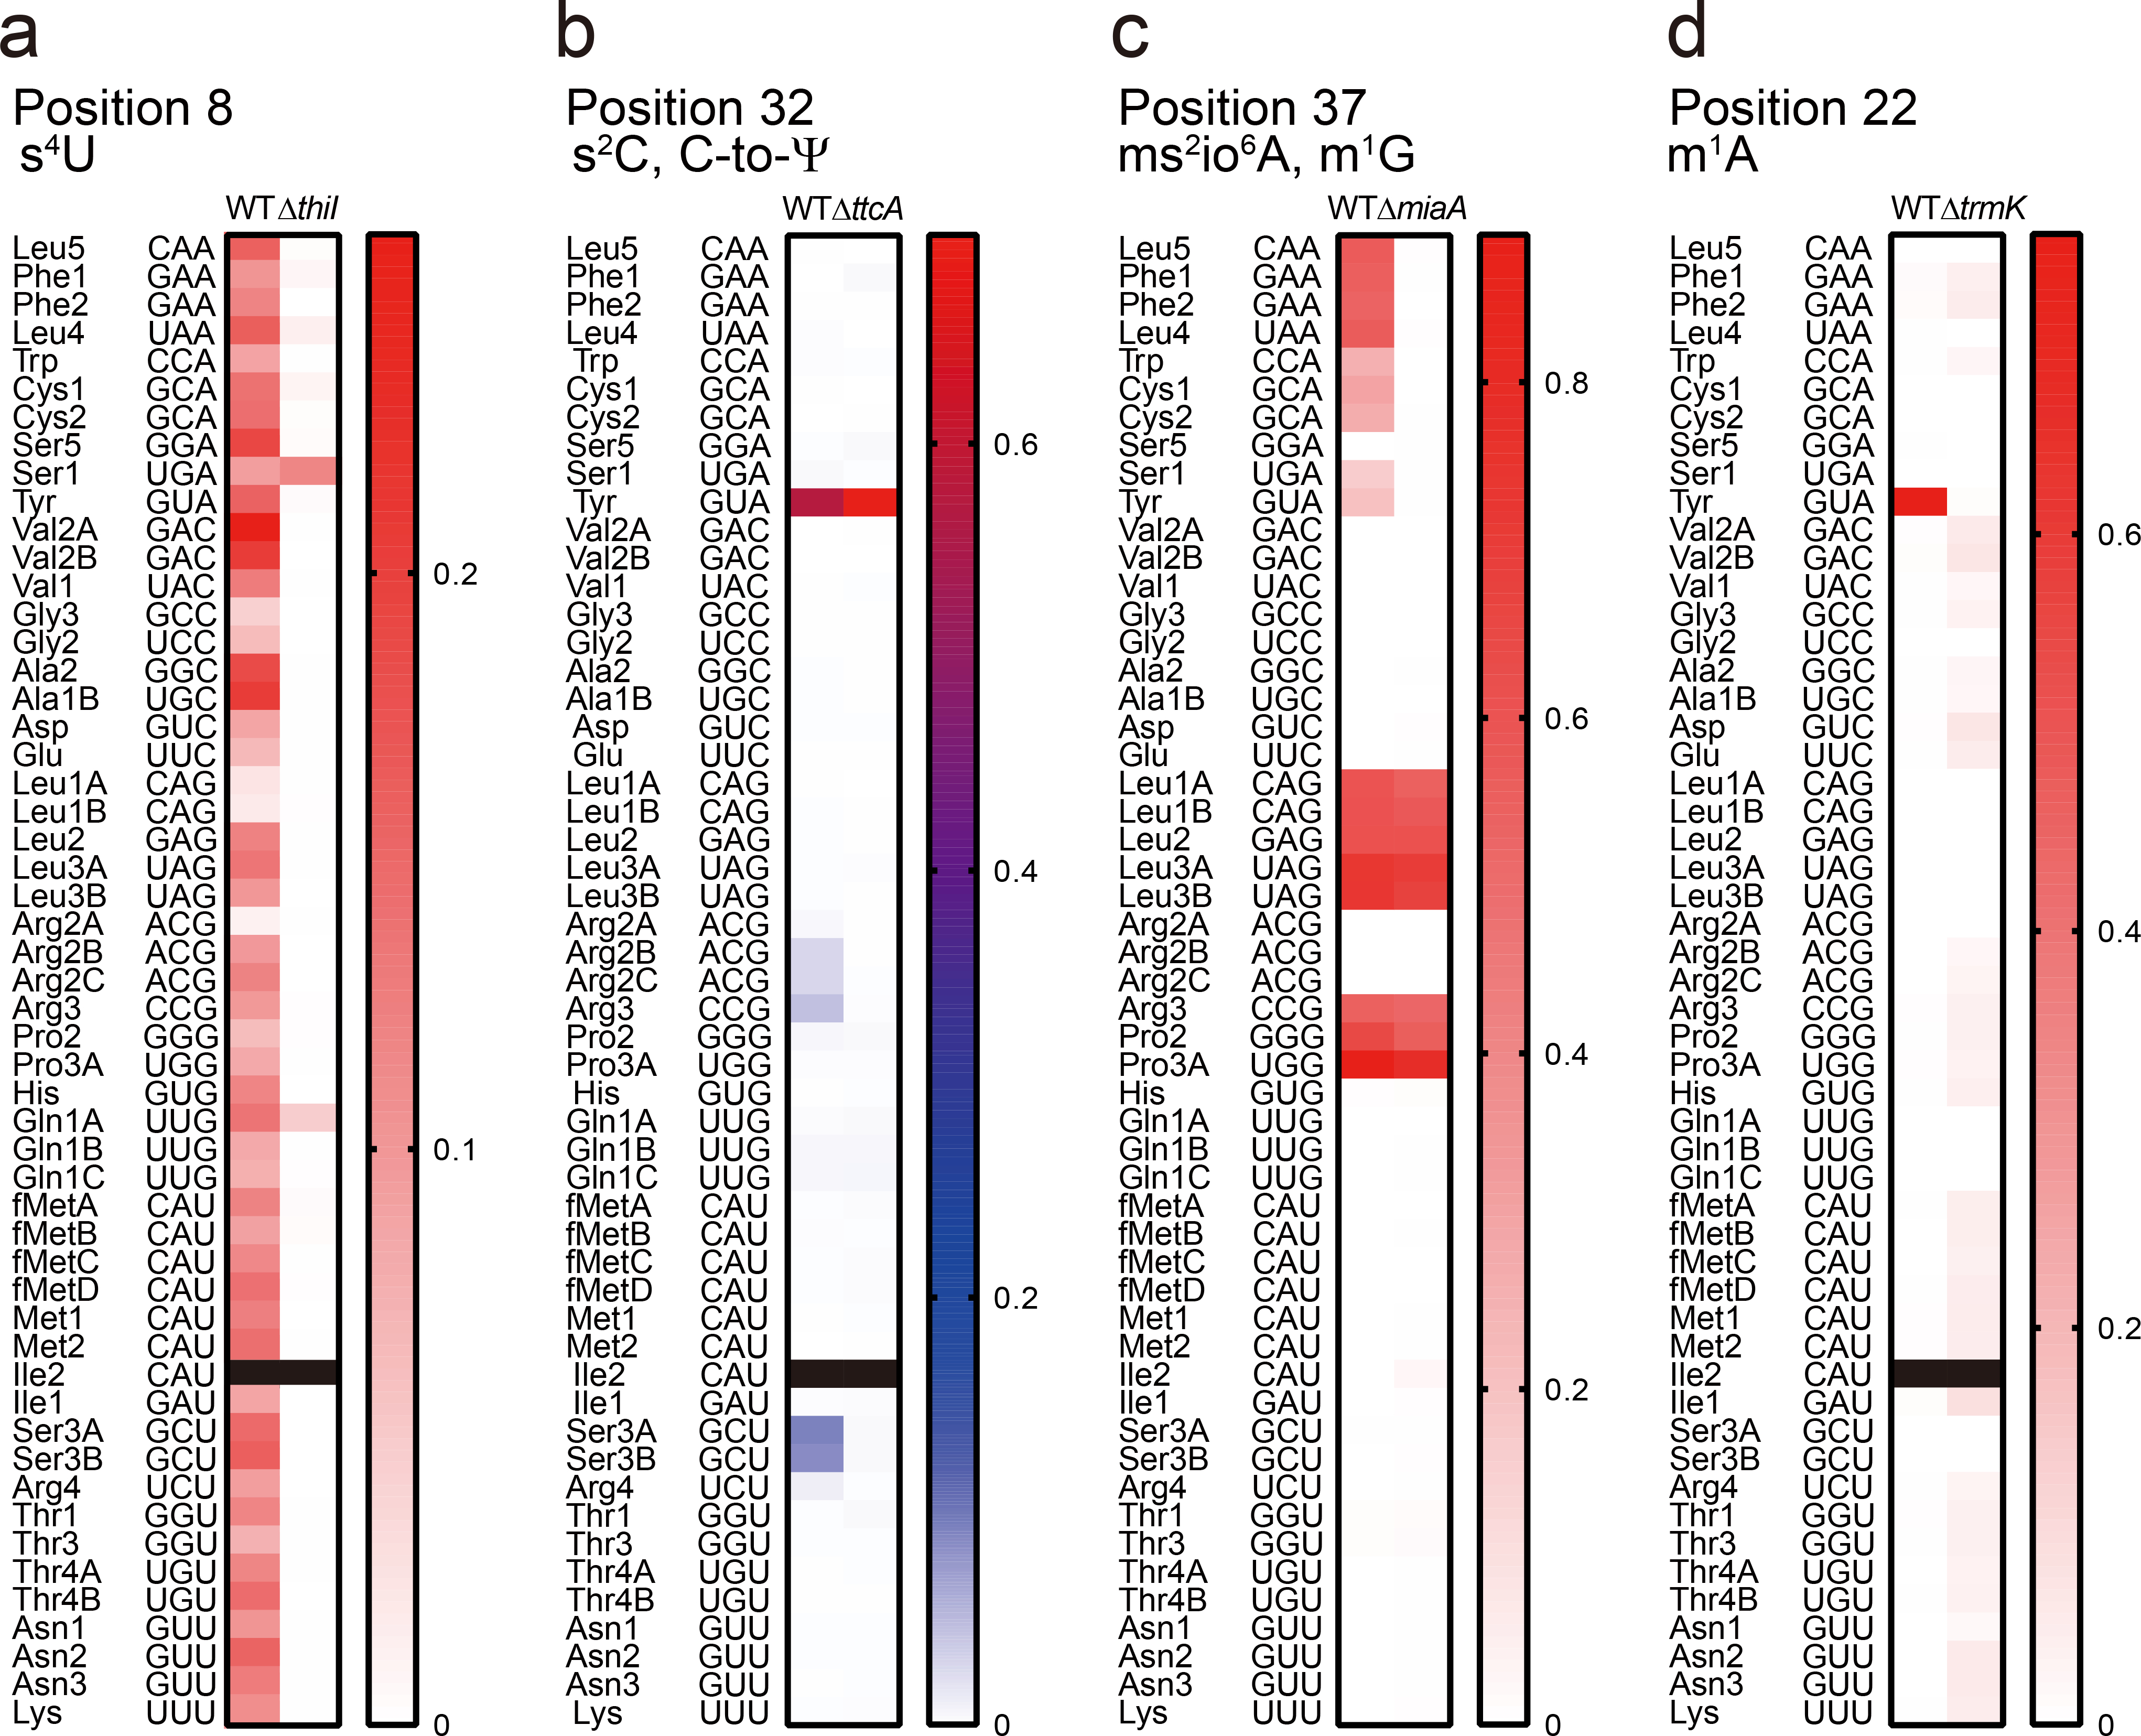
a, Heatmap of misincorporation frequency at position 8 in V. cholerae tRNAs. Most of the misincorporation signals, except for tRNA-Ser1 and tRNA-Gln1A, are eliminated in the ΔthiI strain, consistent with the idea that misincorporation results from the associated modification, s4U. The data for tRNA-Ile2 is not shown (black) because of insufficient read depth (<100 reads).
b, Heatmap of misincorporation frequency at position 32 in V. cholerae tRNAs. The signals in tRNAs that are expected to have s2C (tRNA-Arg2A, tRNA-Arg2C, tRNA-Arg3, tRNA-Ser3A, tRNA-Ser3B, and tRNA-Arg4) are eliminated in the ΔttcA strain, whereas the signal in tRNA-Tyr remains due to C to Ψ RNA editing (see Fig 5). The data for tRNA-Ile2 is not shown (black) because of insufficient read depth.
c, Heatmap of misincorporation frequency at position 37 in V. cholerae tRNAs. The signals in tRNAs that are expected to have ms2io6A (tRNA-Leu5, tRNA-Phe1, tRNA-Phe2, tRNA-Leu4, tRNA-Trp, tRNA-Cys1, tRNA-Cys2, tRNA-Ser1, and tRNA-Tyr) are eliminated in the ΔmiaA strain, whereas the signals in tRNA species that are predicted to have m1G at position 37 remain.
d, Heatmap of misincorporation frequency at position 22 in V. cholerae tRNAs. The signal in tRNA-Tyr was absent in the ΔtrmK strain, suggesting that this signal is derived from m1A. The data for tRNA-Ile2 is not shown (black) because of insufficient read depth. In all panels, representative data from three replicates with similar results for WT and one replicate for knockout strains is shown.
Extended Data Fig. 4. tRNA-seq profiles of log phase (a) and cecal fluid-derived (b) V. cholerae.
Heatmaps of frequency of misincorporation (left) and termination of reverse transcription (right) signals in indicated samples. Types and positions of modifications that are presumed shared with E. coli are shown in black. Positions of V. cholerae-specific signals are indicated in white letters. Representative data from three replicates with similar results is shown.
Extended Data Fig. 5. VC0317 is a candidate acetyltransferase required for acacp3U synthesis.
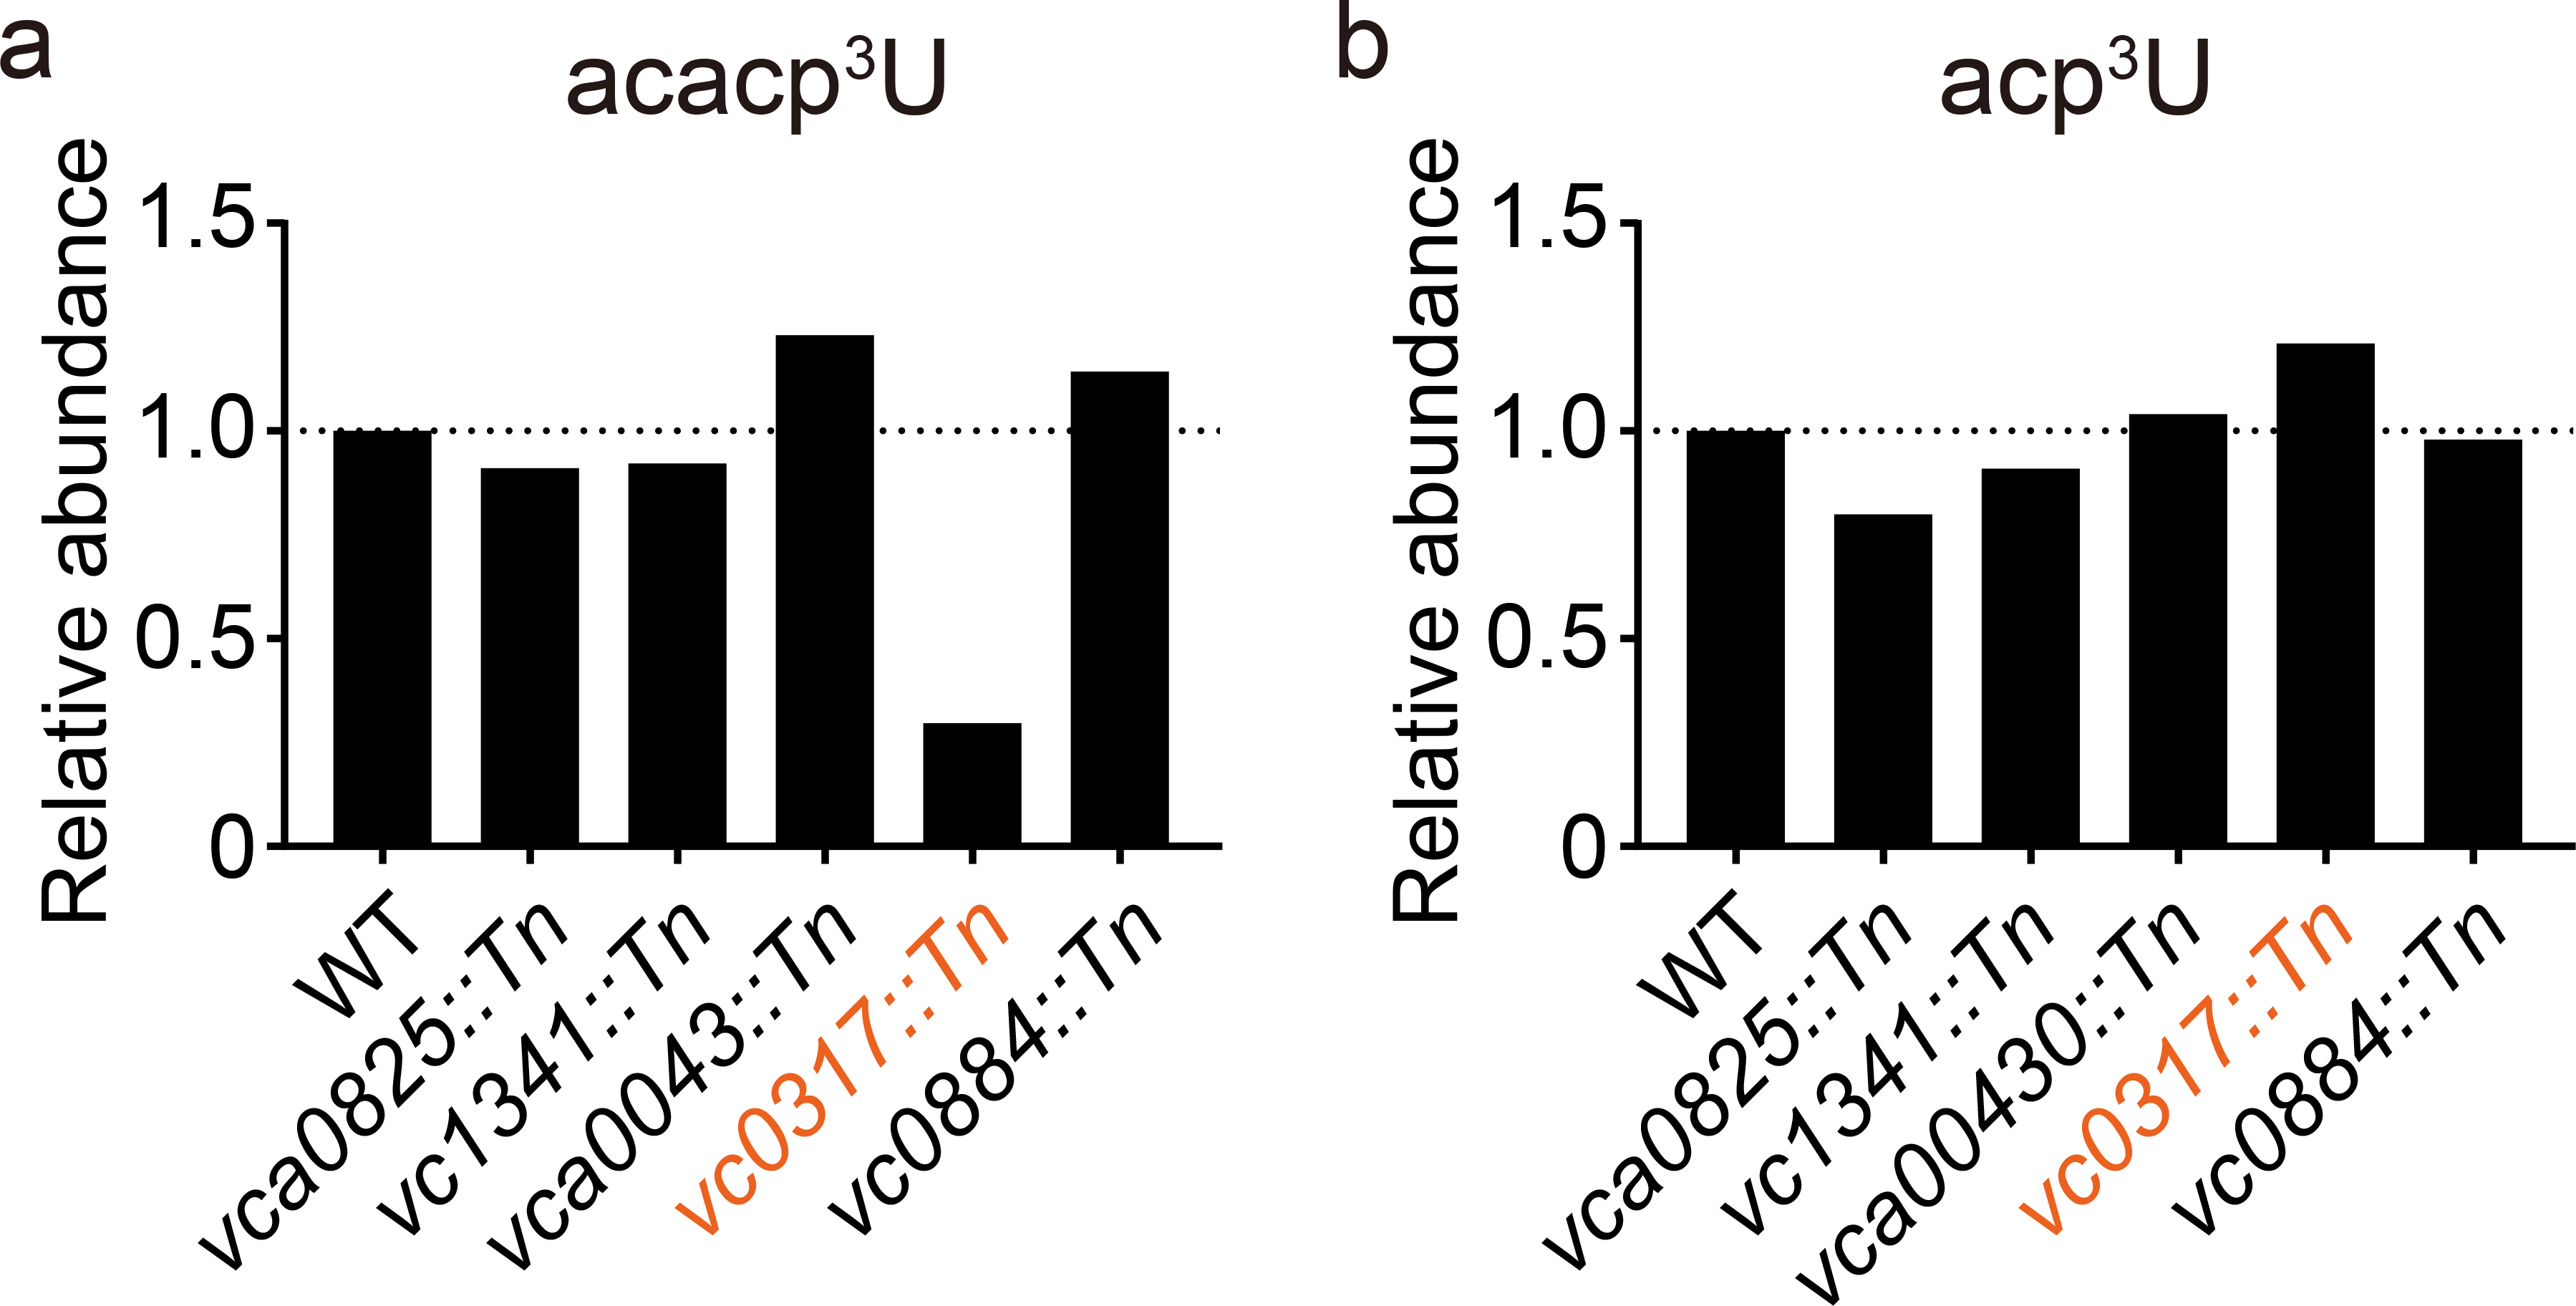
Nucleoside analysis of total tRNAs derived from strains containing transposon insertions in putative acetyltransferases. Relative abundances of acacp3U (A) and acp3U (B), normalized to that of T, are shown. This experiment was performed once.
Extended Data Fig. 6. Nucleoside analysis of tRNA-Tyr from the Δvc1231 strain RNA cultured with stable isotope labeled cytidine (15N3-C) or unlabeled cytidine (non-SI).
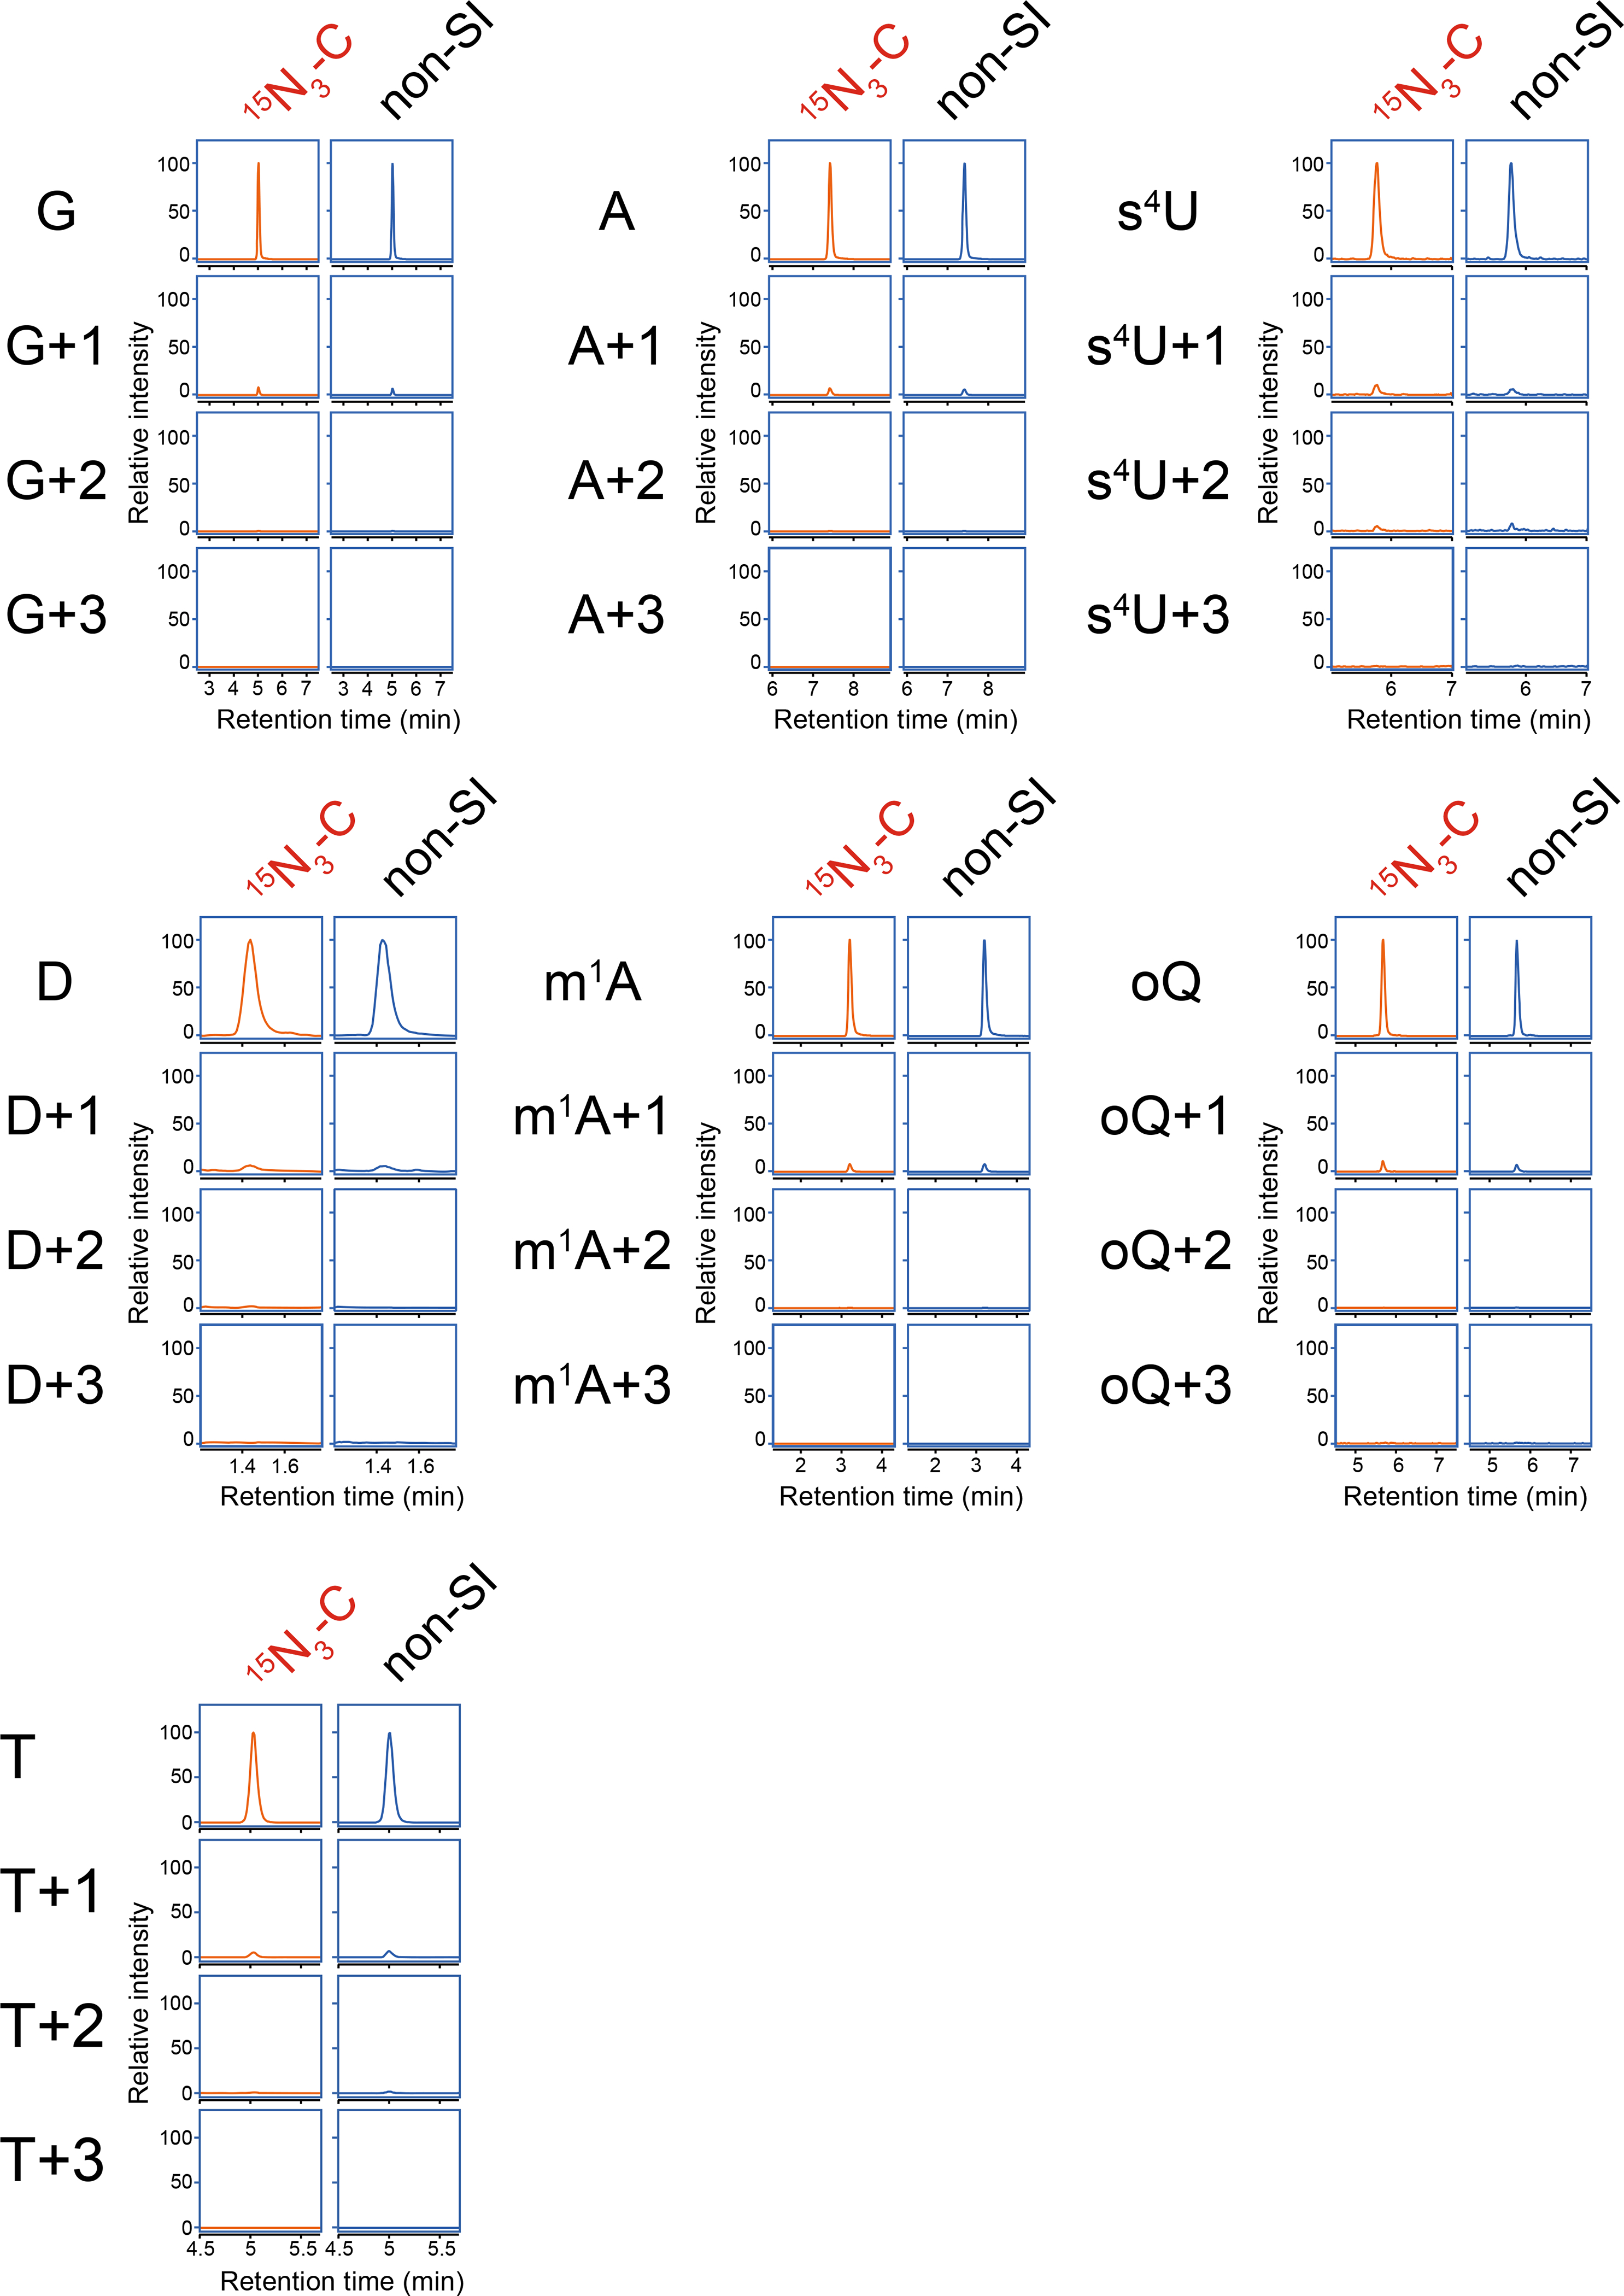
The detecting bases are shown on the left of panels. Representative data from two independent experiments with similar results for G, A, and T is shown. Experiments for other nucleosides were performed once.
Extended Data Fig. 7. RNA mass spectrometric analyses of tRNA-Tyr.
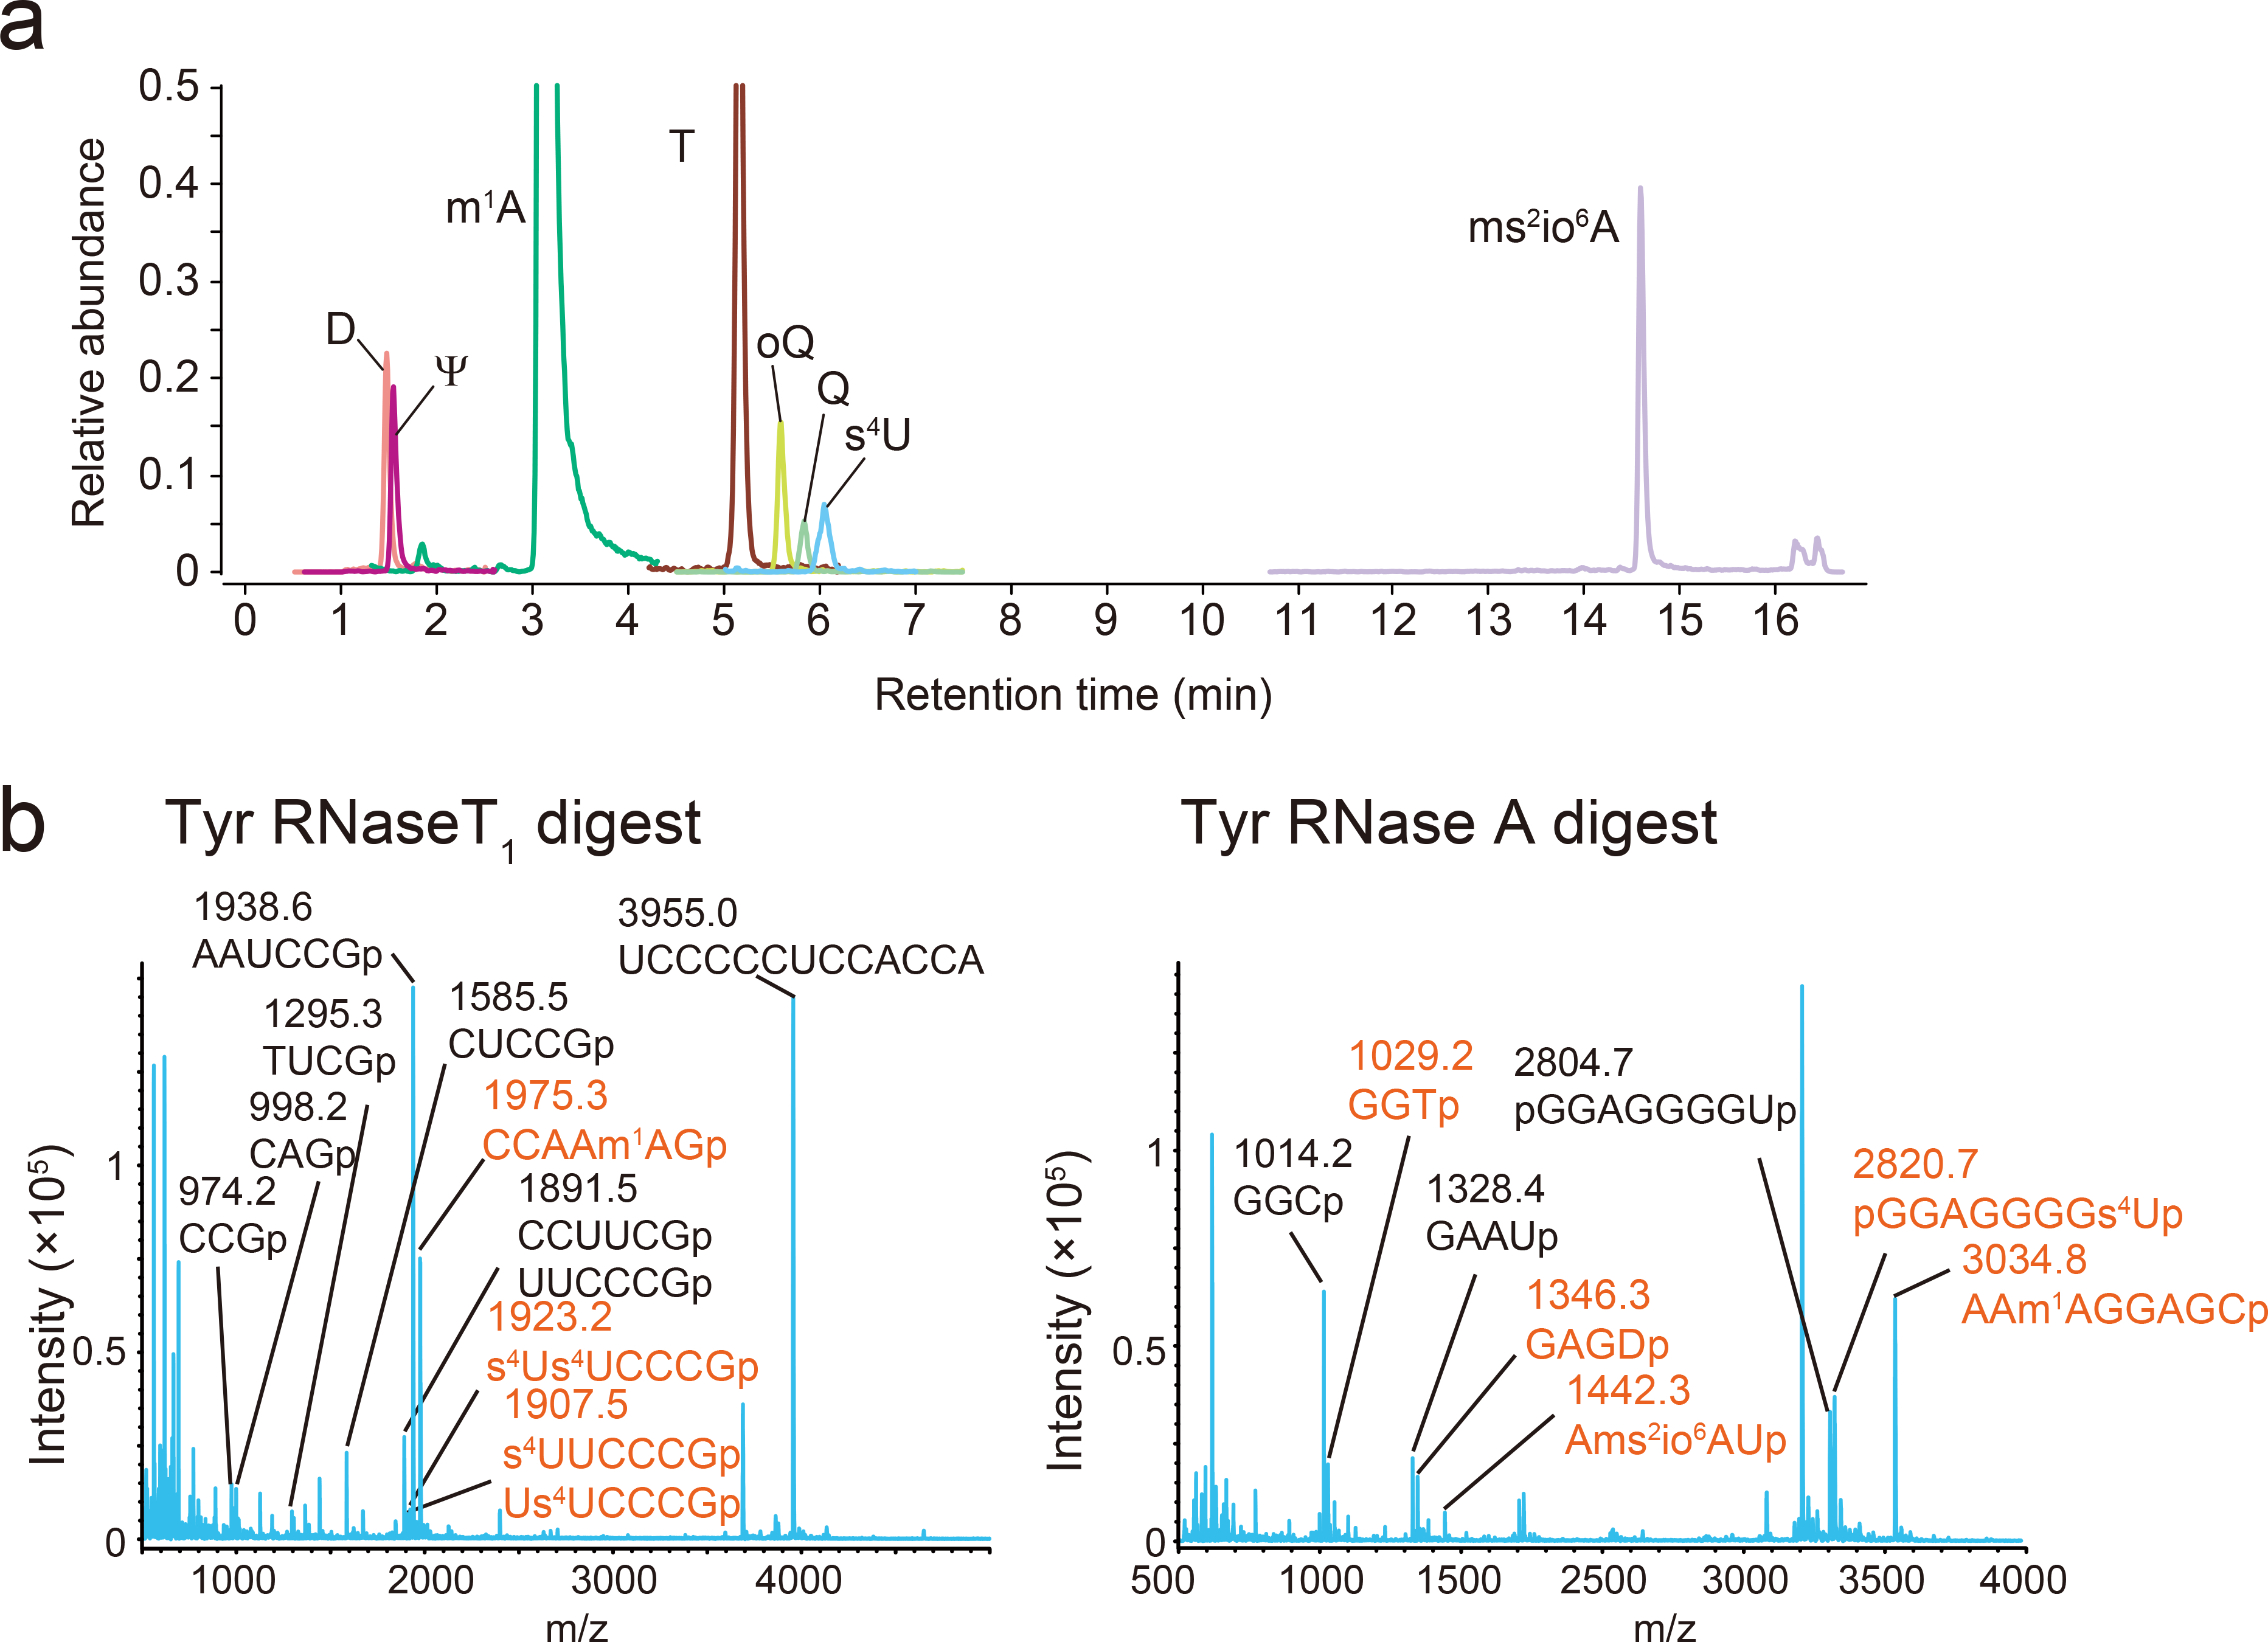
a, Nucleoside analysis detecting D, Ψ, m1A, T, oQ, Q, s4U, ms2io6A. The peak heights between different nucleosides are not comparable. Representative data from two independent experiments with similar results is shown.
b, Fragment analyses of RNase T1 (left) and RNase A (right) digests. The fragments with or without modifications are shown in red and black, respectively. Measurement was conducted in positive polarity mode. Representative data from two independent experiments with similar results is shown.
Supplementary Material
Acknowledgments
We thank V. Srisuknimit, B. Davis, T. Hubbard and Waldor lab members for helpful comments on the project, the manuscript, the Harvard Medical School East Quad NMR Facility for assistance with NMR, the Harvard Medical School Analytical Chemistry Core for use of the QTOF Mass spectrometer, and the Harvard FAS Science Core Facility for use of the MALDI equipment. This work was supported by NIH R01-AI-042347(MKW), HHMI (MKW), NIH R01-ES026856 (PCD), R01-ES024615(PCD) and National Research Foundation of Singapore through the Singapore-MI Alliance for Research and Technology Antimicrobial Resistance Interdisciplinary Research Group (PCD).
Footnotes
Competing Financial Interests Statement
The authors declare no competing interests.
References
- 1.Gingold H et al. A dual program for translation regulation in cellular proliferation and differentiation. Cell 158, 1281–1292, doi: 10.1016/j.cell.2014.08.011 (2014). [DOI] [PubMed] [Google Scholar]
- 2.Goodarzi H et al. Modulated Expression of Specific tRNAs Drives Gene Expression and Cancer Progression. Cell 165, 1416–1427, doi: 10.1016/j.cell.2016.05.046 (2016). [DOI] [PMC free article] [PubMed] [Google Scholar]
- 3.Hanada T et al. CLP1 links tRNA metabolism to progressive motor-neuron loss. Nature 495, 474–480, doi: 10.1038/nature11923 (2013). [DOI] [PMC free article] [PubMed] [Google Scholar]
- 4.Machnicka MA et al. MODOMICS: a database of RNA modification pathways--2013 update. Nucleic Acids Res 41, D262–267, doi: 10.1093/nar/gks1007 (2013). [DOI] [PMC free article] [PubMed] [Google Scholar]
- 5.Ontiveros RJ, Stoute J & Liu KF The chemical diversity of RNA modifications. Biochem J 476, 1227–1245, doi: 10.1042/BCJ20180445 (2019). [DOI] [PMC free article] [PubMed] [Google Scholar]
- 6.Cantara WA et al. The RNA Modification Database, RNAMDB: 2011 update. Nucleic Acids Res 39, D195–201, doi: 10.1093/nar/gkq1028 (2011). [DOI] [PMC free article] [PubMed] [Google Scholar]
- 7.Eisenberg E & Levanon EY A-to-I RNA editing - immune protector and transcriptome diversifier. Nat Rev Genet 19, 473–490, doi: 10.1038/s41576-018-0006-1 (2018). [DOI] [PubMed] [Google Scholar]
- 8.Bjork GR & Hagervall TG Transfer RNA Modification: Presence, Synthesis, and Function. EcoSal Plus 6, doi: 10.1128/ecosalplus.ESP-0007-2013 (2014). [DOI] [PubMed] [Google Scholar]
- 9.Duechler M, Leszczynska G, Sochacka E & Nawrot B Nucleoside modifications in the regulation of gene expression: focus on tRNA. Cell Mol Life Sci 73, 3075–3095, doi: 10.1007/s00018-016-2217-y (2016). [DOI] [PMC free article] [PubMed] [Google Scholar]
- 10.Kimura S & Waldor MK The RNA degradosome promotes tRNA quality control through clearance of hypomodified tRNA. Proc Natl Acad Sci U S A 116, 1394–1403, doi: 10.1073/pnas.1814130116 (2019). [DOI] [PMC free article] [PubMed] [Google Scholar]
- 11.Lorenz C, Lunse CE & Morl M tRNA Modifications: Impact on Structure and Thermal Adaptation. Biomolecules 7, doi: 10.3390/biom7020035 (2017). [DOI] [PMC free article] [PubMed] [Google Scholar]
- 12.Alexandrov A et al. Rapid tRNA decay can result from lack of nonessential modifications. Mol Cell 21, 87–96, doi: 10.1016/j.molcel.2005.10.036 (2006). [DOI] [PubMed] [Google Scholar]
- 13.Vecerek B, Moll I & Blasi U Control of Fur synthesis by the non-coding RNA RyhB and iron-responsive decoding. EMBO J 26, 965–975, doi: 10.1038/sj.emboj.7601553 (2007). [DOI] [PMC free article] [PubMed] [Google Scholar]
- 14.Chionh YH et al. tRNA-mediated codon-biased translation in mycobacterial hypoxic persistence. Nat Commun 7, 13302, doi: 10.1038/ncomms13302 (2016). [DOI] [PMC free article] [PubMed] [Google Scholar]
- 15.Schwartz MH et al. Microbiome characterization by high-throughput transfer RNA sequencing and modification analysis. Nat Commun 9, 5353, doi: 10.1038/s41467-018-07675-z (2018). [DOI] [PMC free article] [PubMed] [Google Scholar]
- 16.Laxman S et al. Sulfur amino acids regulate translational capacity and metabolic homeostasis through modulation of tRNA thiolation. Cell 154, 416–429, doi: 10.1016/j.cell.2013.06.043 (2013). [DOI] [PMC free article] [PubMed] [Google Scholar]
- 17.Wetzel C & Limbach PA Mass spectrometry of modified RNAs: recent developments. Analyst 141, 16–23, doi: 10.1039/c5an01797a (2016). [DOI] [PMC free article] [PubMed] [Google Scholar]
- 18.Antoine L, Wolff P, Westhof E, Romby P & Marzi S Mapping post-transcriptional modifications in Staphylococcus aureus tRNAs by nanoLC/MSMS. Biochimie 164, 60–69, doi: 10.1016/j.biochi.2019.07.003 (2019). [DOI] [PubMed] [Google Scholar]
- 19.Suzuki T & Suzuki T A complete landscape of post-transcriptional modifications in mammalian mitochondrial tRNAs. Nucleic Acids Res 42, 7346–7357, doi: 10.1093/nar/gku390 (2014). [DOI] [PMC free article] [PubMed] [Google Scholar]
- 20.Cozen AE et al. ARM-seq: AlkB-facilitated RNA methylation sequencing reveals a complex landscape of modified tRNA fragments. Nat Methods 12, 879–884, doi: 10.1038/nmeth.3508 (2015). [DOI] [PMC free article] [PubMed] [Google Scholar]
- 21.Zheng G et al. Efficient and quantitative high-throughput tRNA sequencing. Nat Methods 12, 835–837, doi: 10.1038/nmeth.3478 (2015). [DOI] [PMC free article] [PubMed] [Google Scholar]
- 22.Richter U et al. RNA modification landscape of the human mitochondrial tRNA(Lys) regulates protein synthesis. Nat Commun 9, 3966, doi: 10.1038/s41467-018-06471-z (2018). [DOI] [PMC free article] [PubMed] [Google Scholar]
- 23.Ryvkin P et al. HAMR: high-throughput annotation of modified ribonucleotides. RNA 19, 1684–1692, doi: 10.1261/rna.036806.112 (2013). [DOI] [PMC free article] [PubMed] [Google Scholar]
- 24.Clark WC, Evans ME, Dominissini D, Zheng G & Pan T tRNA base methylation identification and quantification via high-throughput sequencing. RNA 22, 1771–1784, doi: 10.1261/rna.056531.116 (2016). [DOI] [PMC free article] [PubMed] [Google Scholar]
- 25.Helm M & Motorin Y Detecting RNA modifications in the epitranscriptome: predict and validate. Nat Rev Genet 18, 275–291, doi: 10.1038/nrg.2016.169 (2017). [DOI] [PubMed] [Google Scholar]
- 26.Marchand V et al. AlkAniline-Seq: Profiling of m(7) G and m(3) C RNA Modifications at Single Nucleotide Resolution. Angew Chem Int Ed Engl 57, 16785–16790, doi: 10.1002/anie.201810946 (2018). [DOI] [PubMed] [Google Scholar]
- 27.Juhling F et al. tRNAdb 2009: compilation of tRNA sequences and tRNA genes. Nucleic Acids Res 37, D159–162, doi: 10.1093/nar/gkn772 (2009). [DOI] [PMC free article] [PubMed] [Google Scholar]
- 28.Roovers M et al. The YqfN protein of Bacillus subtilis is the tRNA: m1A22 methyltransferase (TrmK). Nucleic Acids Res 36, 3252–3262, doi: 10.1093/nar/gkn169 (2008). [DOI] [PMC free article] [PubMed] [Google Scholar]
- 29.Ritchie JM, Rui H, Bronson RT & Waldor MK Back to the future: studying cholera pathogenesis using infant rabbits. MBio 1, doi: 10.1128/mBio.00047-10 (2010). [DOI] [PMC free article] [PubMed] [Google Scholar]
- 30.Patiny L & Borel A ChemCalc: a building block for tomorrow’s chemical infrastructure. J Chem Inf Model 53, 1223–1228, doi: 10.1021/ci300563h (2013). [DOI] [PubMed] [Google Scholar]
- 31.Galperin MY, Makarova KS, Wolf YI & Koonin EV Expanded microbial genome coverage and improved protein family annotation in the COG database. Nucleic Acids Res 43, D261–269, doi: 10.1093/nar/gku1223 (2015). [DOI] [PMC free article] [PubMed] [Google Scholar]
- 32.Cameron DE, Urbach JM & Mekalanos JJ A defined transposon mutant library and its use in identifying motility genes in Vibrio cholerae. Proc Natl Acad Sci U S A 105, 8736–8741, doi: 10.1073/pnas.0803281105 (2008). [DOI] [PMC free article] [PubMed] [Google Scholar]
- 33.Finn RD et al. The Pfam protein families database: towards a more sustainable future. Nucleic Acids Res 44, D279–285, doi: 10.1093/nar/gkv1344 (2016). [DOI] [PMC free article] [PubMed] [Google Scholar]
- 34.Chan PP & Lowe TM GtRNAdb 2.0: an expanded database of transfer RNA genes identified in complete and draft genomes. Nucleic Acids Res 44, D184–189, doi: 10.1093/nar/gkv1309 (2016). [DOI] [PMC free article] [PubMed] [Google Scholar]
- 35.Wrzesinski J, Nurse K, Bakin A, Lane BG & Ofengand J A dual-specificity pseudouridine synthase: an Escherichia coli synthase purified and cloned on the basis of its specificity for psi 746 in 23S RNA is also specific for psi 32 in tRNA(phe). RNA 1, 437–448 (1995). [PMC free article] [PubMed] [Google Scholar]
- 36.Takakura M, Ishiguro K, Akichika S, Miyauchi K & Suzuki T Biogenesis and functions of aminocarboxypropyluridine in tRNA. Nat Commun 10, 5542, doi: 10.1038/s41467-019-13525-3 (2019). [DOI] [PMC free article] [PubMed] [Google Scholar]
- 37.Meyer B et al. Identification of the 3-amino-3-carboxypropyl (acp) transferase enzyme responsible for acp3U formation at position 47 in Escherichia coli tRNAs. Nucleic Acids Res, doi: 10.1093/nar/gkz1191 (2019). [DOI] [PMC free article] [PubMed] [Google Scholar]
- 38.Nakahama T & Kawahara Y Adenosine-to-inosine RNA editing in the immune system: friend or foe? Cell Mol Life Sci, doi: 10.1007/s00018-020-03466-2 (2020). [DOI] [PMC free article] [PubMed] [Google Scholar]
- 39.Dixit S, Henderson JC & Alfonzo JD Multi-Substrate Specificity and the Evolutionary Basis for Interdependence in tRNA Editing and Methylation Enzymes. Front Genet 10, 104, doi: 10.3389/fgene.2019.00104 (2019). [DOI] [PMC free article] [PubMed] [Google Scholar]
- 40.Lerner T, Papavasiliou FN & Pecori R RNA Editors, Cofactors, and mRNA Targets: An Overview of the C-to-U RNA Editing Machinery and Its Implication in Human Disease. Genes (Basel) 10, doi: 10.3390/genes10010013 (2018). [DOI] [PMC free article] [PubMed] [Google Scholar]
- 41.Small ID, Schallenberg-Rudinger M, Takenaka M, Mireau H & Ostersetzer-Biran O Plant organellar RNA editing: what 30 years of research has revealed. Plant J, doi: 10.1111/tpj.14578 (2019). [DOI] [PubMed] [Google Scholar]
- 42.Randau L et al. A cytidine deaminase edits C to U in transfer RNAs in Archaea. Science 324, 657–659, doi: 10.1126/science.1170123 (2009). [DOI] [PMC free article] [PubMed] [Google Scholar]
- 43.Rubio MA et al. Editing and methylation at a single site by functionally interdependent activities. Nature 542, 494–497, doi: 10.1038/nature21396 (2017). [DOI] [PMC free article] [PubMed] [Google Scholar]
Methods-only references
- 44.Millet YA et al. Insights into Vibrio cholerae intestinal colonization from monitoring fluorescently labeled bacteria. PLoS Pathog 10, e1004405, doi: 10.1371/journal.ppat.1004405 (2014). [DOI] [PMC free article] [PubMed] [Google Scholar]
- 45.Donnenberg MS & Kaper JB Construction of an eae deletion mutant of enteropathogenic Escherichia coli by using a positive-selection suicide vector. Infect Immun 59, 4310–4317 (1991). [DOI] [PMC free article] [PubMed] [Google Scholar]
- 46.Langmead B, Trapnell C, Pop M & Salzberg SL Ultrafast and memory-efficient alignment of short DNA sequences to the human genome. Genome Biol 10, R25, doi: 10.1186/gb-2009-10-3-r25 (2009). [DOI] [PMC free article] [PubMed] [Google Scholar]
- 47.Griffey RH et al. 15N-labeled tRNA. Identification of 4-thiouridine in Escherichia coli tRNASer1 and tRNATyr2 by 1H-15N two-dimensional NMR spectroscopy. J Biol Chem 261, 12074–12078 (1986). [PubMed] [Google Scholar]
- 48.Horie N et al. Modified nucleosides in the first positions of the anticodons of tRNA(Leu)4 and tRNA(Leu)5 from Escherichia coli. Biochemistry 38, 207–217, doi: 10.1021/bi981865g (1999). [DOI] [PubMed] [Google Scholar]
- 49.Salazar JC, Ambrogelly A, Crain PF, McCloskey JA & Soll D A truncated aminoacyl-tRNA synthetase modifies RNA. Proc Natl Acad Sci U S A 101, 7536–7541, doi: 10.1073/pnas.0401982101 (2004). [DOI] [PMC free article] [PubMed] [Google Scholar]
- 50.Bjork GR & Hagervall TG Transfer RNA Modification. EcoSal Plus 1, doi: 10.1128/ecosalplus.4.6.2 (2005). [DOI] [PubMed] [Google Scholar]
- 51.Miyauchi K, Kimura S & Suzuki T A cyclic form of N6-threonylcarbamoyladenosine as a widely distributed tRNA hypermodification. Nat Chem Biol 9, 105–111, doi: 10.1038/nchembio.1137 (2013). [DOI] [PubMed] [Google Scholar]
- 52.Rodriguez-Hernandez A et al. Structural and mechanistic basis for enhanced translational efficiency by 2-thiouridine at the tRNA anticodon wobble position. J Mol Biol 425, 3888–3906, doi: 10.1016/j.jmb.2013.05.018 (2013). [DOI] [PMC free article] [PubMed] [Google Scholar]
- 53.Sakai Y, Miyauchi K, Kimura S & Suzuki T Biogenesis and growth phase-dependent alteration of 5-methoxycarbonylmethoxyuridine in tRNA anticodons. Nucleic Acids Res 44, 509–523, doi: 10.1093/nar/gkv1470 (2016). [DOI] [PMC free article] [PubMed] [Google Scholar]
- 54.Sakai Y, Kimura S & Suzuki T Dual pathways of tRNA hydroxylation ensure efficient translation by expanding decoding capability. Nat Commun 10, 2858, doi: 10.1038/s41467-019-10750-8 (2019). [DOI] [PMC free article] [PubMed] [Google Scholar]
Associated Data
This section collects any data citations, data availability statements, or supplementary materials included in this article.
Supplementary Materials
Data Availability Statement
All data is available from the corresponding authors upon request. The data reported in this paper have been deposited in the NCBI Gene expression omnibus https://www.ncbi.nlm.nih.gov/geo/ (accession code; GSE147614).