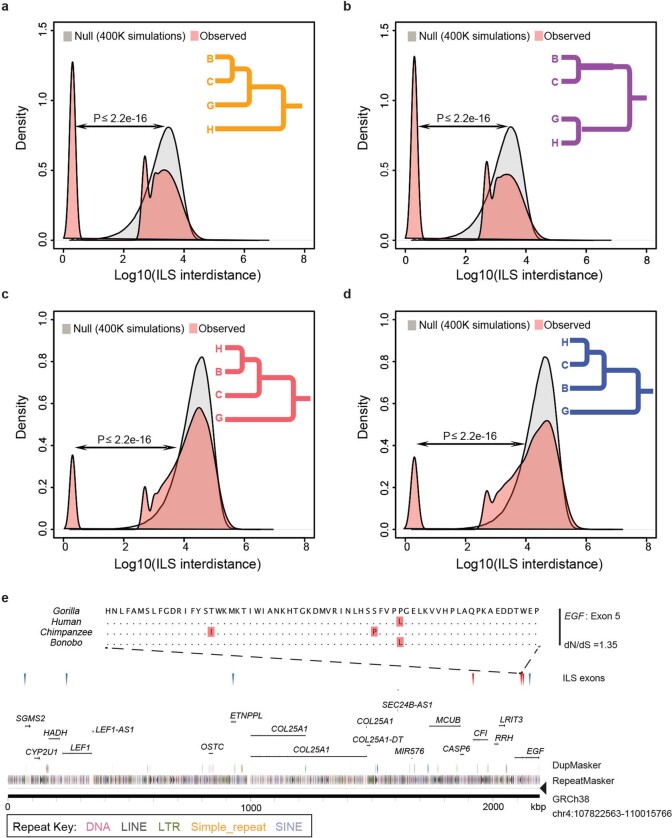
Extended Data Fig. 7. Hominid ILS.
The distance between adjacent ILS segments (inter-ILS) (500-bp resolution) was calculated and the distribution was compared to a simulated expectation based on a random distribution. The analysis reveals a bimodal (and possibly an emerging trimodal) pattern in which a distinct subset of ILS segments are clustered (that is, clustered ILS sites). Four different topologies were considered. a, A (orangutan, (((bonobo, chimpanzee), gorilla), human)) ILS topology in which 31.58% of inter-ILS is clustered is shown. b, A (orangutan, ((bonobo, chimpanzee), (gorilla, human))) ILS topology in which 33.5% is clustered is shown. c, A (orangutan, (((bonobo, human), chimpanzee), gorilla)) ILS topology in which 8.14% is clustered is shown. d, A (orangutan, ((bonobo, (chimpanzee, human)), gorilla)) ILS topology in which 9.89% of sites is clustered is shown. e, An example of a cluster of human–bonobo (red triangles) and human–chimpanzee (blue triangles) ILS corresponding to a group of genes. A four-species alignment of one exon from EGF (exon 5) is shown with a nominal signal of positive selection.

