

SUMMARY
Forward genetic screens across hundreds of cancer cell lines have started to define the genetic dependencies of proliferating human cells and how these vary by genotype and lineage. Most screens, however, have been carried out in culture media that poorly reflect metabolite availability in human blood. Here, we performed CRISPR-based screens in traditional versus human plasma-like medium (HPLM). Sets of conditionally essential genes in human cancer cell lines span several cellular processes and vary with both natural cell-intrinsic diversity and the combination of basal and serum components that comprise typical media. Notably, we traced the causes for each of three conditional CRISPR phenotypes to the availability of metabolites uniquely defined in HPLM versus conventional media. Our findings reveal the profound impact of medium composition on gene essentiality in human cells, and also suggest general strategies for using genetic screens in HPLM to uncover new cancer vulnerabilities and gene-nutrient interactions.
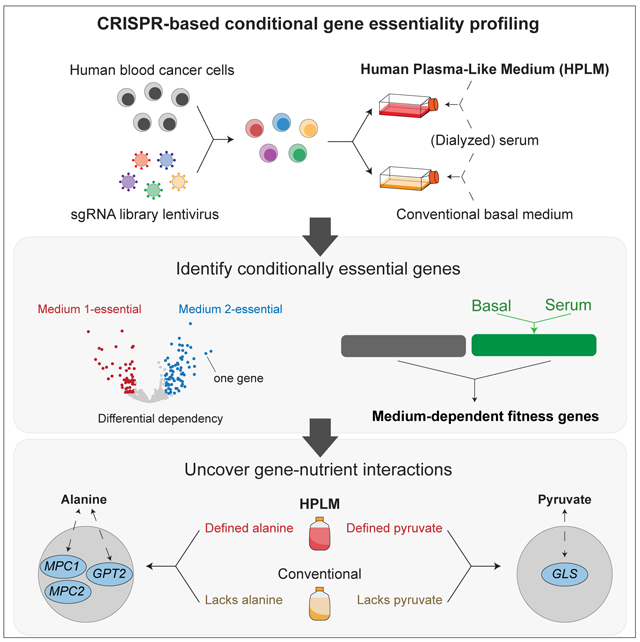
Graphical Abstract
eTOC Blurb
Most forward genetic screens in human cells are performed in vitro using media with little relevance to human physiology. Rossiter et al. reveal the profound impact of medium composition on gene essentiality by performing CRISPR screens of human cancer cells in conventional versus human plasma-like medium (HPLM).
INTRODUCTION
Loss-of-function forward genetic screens have been used to characterize protein function, map gene interaction networks, and define regulators of either drug or toxin resistance (Birsoy et al., 2015; Gilbert et al., 2014; Han et al., 2017; Kanarek et al., 2018; Kory et al., 2018; Shalem et al., 2014; Wang et al., 2014, 2017). There is also interest in leveraging such screens to identify genes required for cell proliferation, as these may suggest targetable liabilities in human cancers (Tsherniak et al., 2017). Nonetheless, it is also appreciated that fitness genes can be context-dependent and that gene essentiality is a quantitative property (Rancati et al., 2018). Pooled loss-of-function screens based on either RNAi or CRISPR have been used in human cancer cell lines not only to define a set of core essential genes, but also to identify cell-essential genes that depend on either genotype or lineage (Behan et al., 2019; Cheung et al., 2011; Hart et al., 2015, 2017; McDonald et al., 2017; Meyers et al., 2017; Tzelepis et al., 2016; Wang et al., 2015).
Environmental factors contribute to cell physiology and can affect drug efficacy (Faubert et al., 2020; Kaymak et al., 2020; Lyssiotis and Kimmelman, 2017; Muir and Vander Heiden, 2018). Further, recent in vitro studies have shown that cell-essential genes can vary with either oxygen tension or culture in 3D spheroids versus 2D monolayers (Han et al., 2020; Jain et al., 2020). However, there has been little investigation into how the composition of cell culture media influences gene essentiality. Moreover, in vitro screens of human cells have been performed in traditional media that poorly reflect metabolite availability in human blood. (Ackermann and Tardito, 2019; Cantor, 2019). Progress has been made in using direct in vivo CRISPR screens to identify genetic drivers in animals, but such approaches have limitations as well. Mouse models recapitulate aspects of tumorigenesis and provide certain environmental factors that are typically more difficult to mimic in vitro, but in vivo screens are by limited by throughput, control, cost, and time (Chow and Chen, 2018; Winters et al., 2018). Notably, there are also a number of differences in the metabolic composition of mouse versus human blood that may influence the physiology of human cells growing in mice (Cantor et al., 2017).
Previously, we developed a new culture medium (human plasma-like medium; HPLM) that contains over 60 polar metabolites and salt ions at concentrations that represent average values in adult human plasma (Cantor et al., 2017). Studies in human cancer cell lines and normal human T cells demonstrated that culture in HPLM versus standard media has widespread effects on cell metabolism and could be used to reveal new insights into metabolic regulation and drug sensitivity (Cantor et al., 2017; Leney-Greene et al., 2020). By performing CRISPR screens in HPLM versus conventional media, it should be possible to identify genes differentially required for cells growing in metabolic conditions with greater relevance to human physiology. This conditional essentiality paradigm has been illustrated in various microorganisms, such that certain genes become critical for growth only in media that represent specific laboratory or natural environments (Hillenmeyer et al., 2008; Nichols et al., 2010; Qian et al., 2012; Sassetti et al., 2001).
Here, we perform CRISPR/Cas9 genetic screens to investigate how medium composition affects gene essentiality in human blood cancer cell lines. Analysis of these data reveals that sets of conditionally essential genes span several biological processes, and further, can vary both with cell-intrinsic factors and the combination of synthetic and serum components that comprise typical culture media. Follow-up work traces conditional loss-of-function phenotypes for glutamic-pyruvic transaminase 2 (GPT2), the mitochondrial pyruvate carrier (MPC), and glutaminase (GLS) to metabolites uniquely defined in HPLM versus conventional media. By applying strategies that we describe, it should be possible to identify new targetable liabilities, gene-nutrient interactions, and genetic drivers in human cells.
RESULTS AND DISCUSSION
Genome-wide CRISPR screens reveal conditionally essential genes
Forward genetic screens in human cancer cell lines have been used to define a set of core essential genes (CEGs) and to identify genetic dependencies that vary with cell-intrinsic diversity (Figure 1A) (Hart et al., 2015, 2017; Tsherniak et al., 2017; Wang et al., 2015, 2017). However, in vitro genetic screens have been performed in complete media that consist of a basal medium with little relevance to the biochemical conditions in human blood, and a fetal bovine serum (FBS) supplement that further provides an undefined cocktail of additional components (Cantor, 2019). This point is well-illustrated by cataloging the growth conditions used across more than 800 CRISPR screens from the DepMap project, of which 76% were carried out using one of two basal media (RPMI 1640, DMEM), and 82% in media that contained 10% FBS (Figure 1B) (Dempster et al., 2019; Meyers et al., 2017).
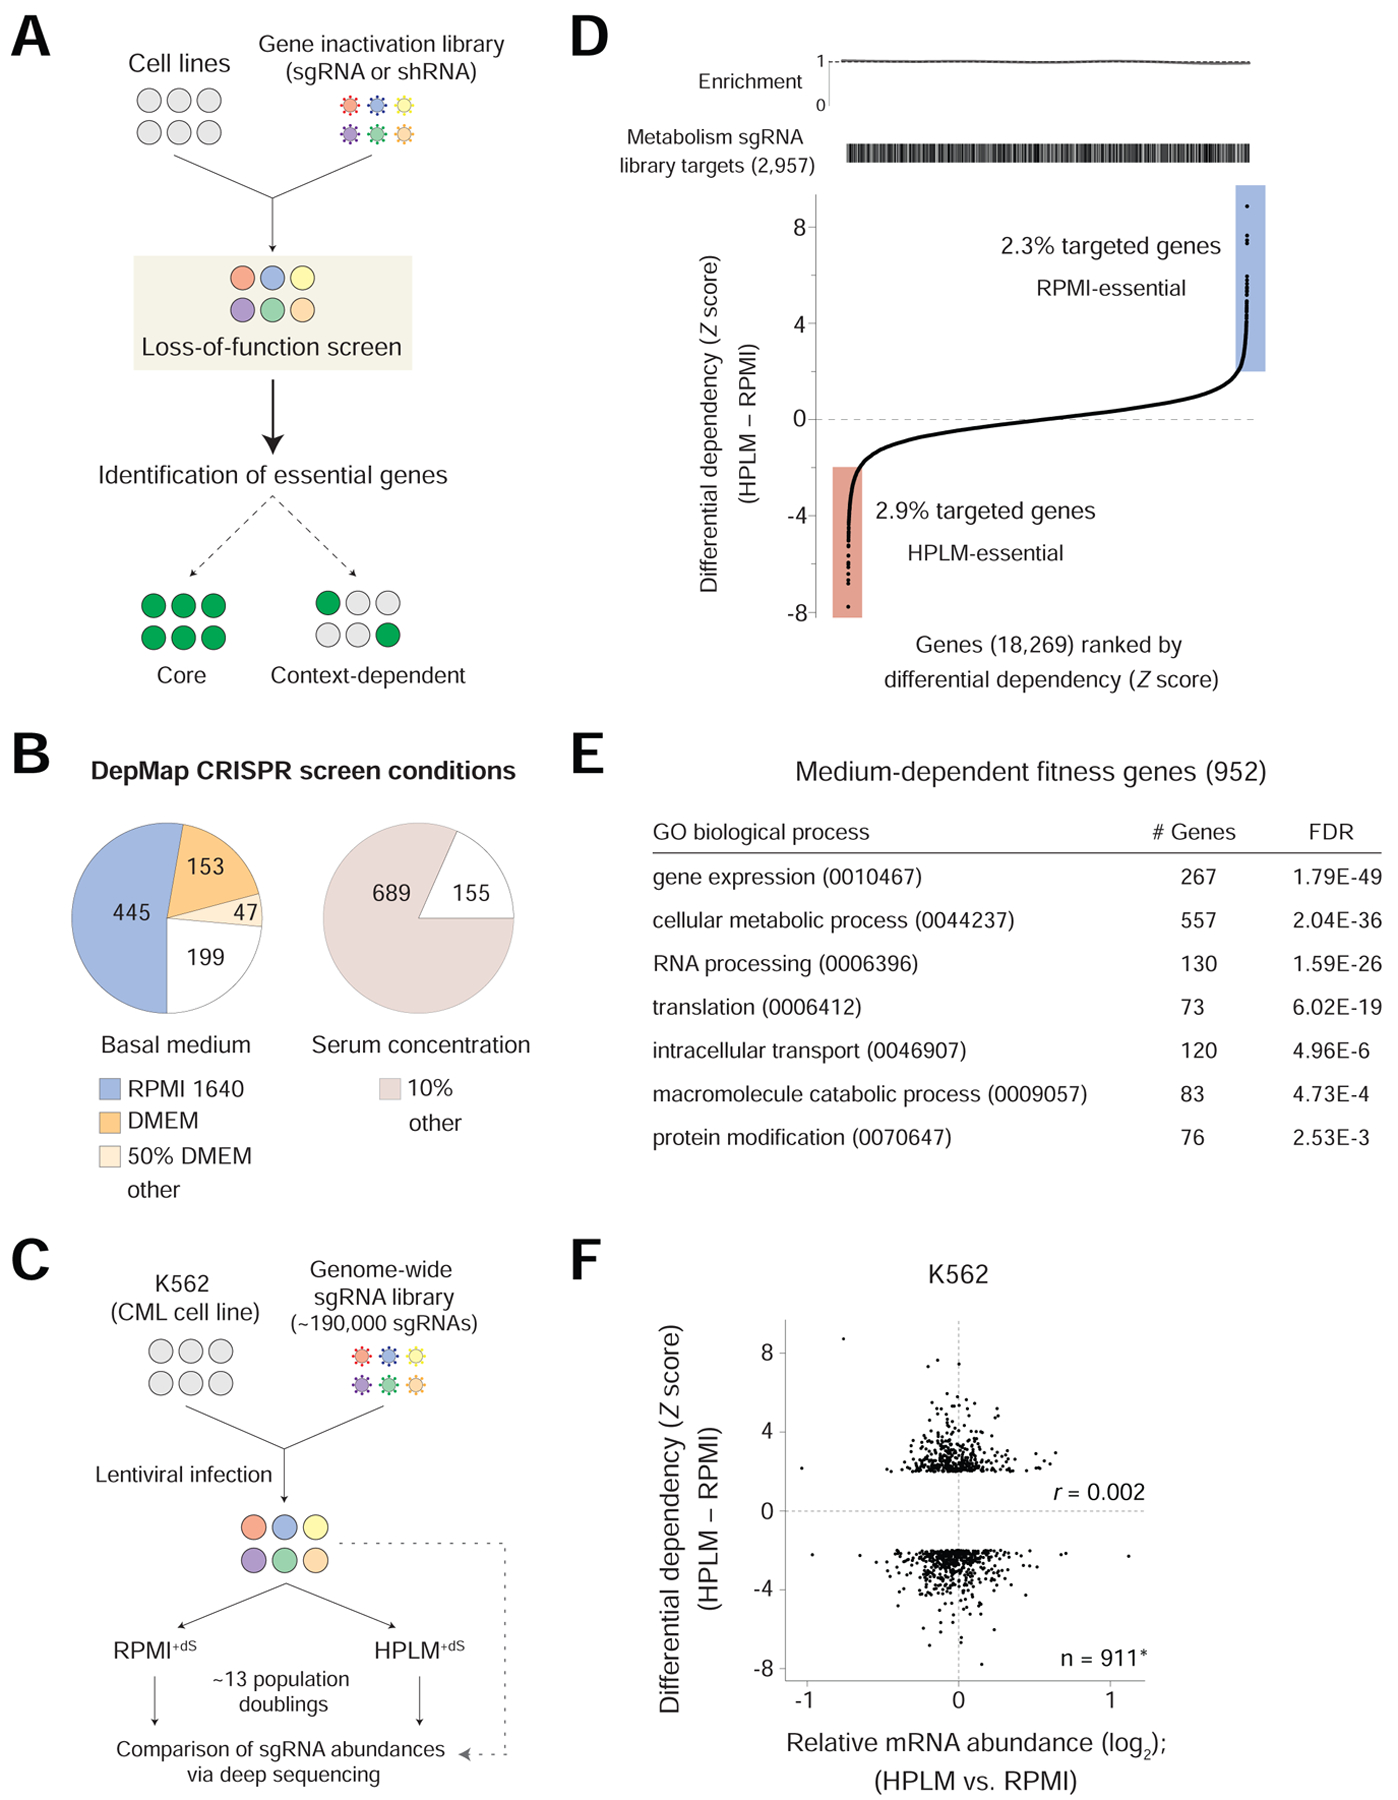
Figure 1. Genome-wide CRISPR screens for conditionally essential genes.
See also Figure S1; Tables S1 and S2.
(A) Schematic for forward genetic screen methods based on either RNAi or CRISPR. sgRNA, single guide RNA. shRNA, short hairpin RNA.
(B) Growth conditions across 844 CRISPR screens from DepMap. 50% DMEM, contained DMEM and another basal medium in a 1:1 mixture.
(C) Schematic for genome-wide CRISPR screens in K562 cells.
(D) Genes ranked by differential dependency (See STAR Methods). Barcode and enrichment plots depict the distribution of genes targeted by a metabolism-focused sgRNA library reported elsewhere (top).
(E) Subset of enriched GO biological processes represented by the 952 medium-essential hits analyzed using a PANTHER overrepresentation test (See STAR Methods and Table S2).
(F) Relative mRNA levels versus differential dependency for medium-essential hits. *41 of the 952 genes had no reads in the RNA-seq datasets. r, Pearson’s correlation coefficient.
We previously developed HPLM, a physiologic medium designed to more closely reflect the metabolic composition of human plasma (Cantor et al., 2017). To establish a complete HPLM-based medium, we add a 10% dialyzed FBS supplement (HPLM+dS) that provides various growth factors, hormones, and trace elements required to support cell proliferation, but minimizes the contribution of undefined polar metabolites. Since RPMI 1640 (herein RPMI) has historically been the medium of choice for culturing human blood cells, we also created two RPMI-based reference media that each contain physiologic glucose (5 mM) but are supplemented with 10% FBS that is either untreated (RPMI+S) or dialyzed (RPMI+dS).
To test the hypothesis that proliferating human cells harbor medium-essential genes, we used a genome-wide single guide (sg)RNA library (Wang et al., 2015, 2017) to perform CRISPR-based screens in the K562 chronic myeloid leukemia (CML) cell line. Following lentiviral infection and antibiotic selection in RPMI+S, cells were split and passaged in either RPMI+dS or HPLM+dS –thus ensuring that causes of conditional phenotypes be restricted to defined medium components (Figure 1C). Screens were passaged at the same frequency and cells doubled at near indistinguishable rates between the two conditions (Table S1). For each gene, we calculated a gene score as the average log2-fold change in the abundance of all sgRNAs targeting the gene after 13 population doublings. By defining the medians for sets of nontargeting sgRNAs and CEGs as 0 and -1, respectively, we then scaled all gene scores (Figure S1A) (Hart et al., 2017). Of note, both screen datasets could discriminate CEGs from a distinct reference set of nonessential genes (Figure S1B) (Hart et al., 2014), and also contained a comparable number of essential genes (defined as probability of dependency > 0.5), which were enriched for roles in fundamental cellular processes as expected (Figure S1C) (Dempster et al., 1977, 2019).
We then standardized differential gene scores between the two screens. By setting a Z-score cutoff of 2, we identified 525 HPLM-essential (negative) and 427 RPMI-essential (positive) and genes, which collectively, were not enriched for the targets of a metabolism-focused sgRNA library reported elsewhere (Figure 1D) (Birsoy et al., 2015). Pathway-enrichment analysis revealed that medium-essential hit genes were instead enriched for many Gene Ontology (GO) biological processes (Figure 1E and Table S2).
Next, to ask if differences in gene expression induced by HPLM+dS versus RPMI+dS might explain our identification of medium-essential hits, we performed RNA-seq in K562 cells following culture in each condition. However, we found that relative expression showed no correlation with differential dependency among the hit genes, indicating that a proxy used to differentiate CEGs could not similarly discriminate for conditional essentiality (Figure 1F and Table S2) (Wang et al., 2015).
Medium-essential genes are involved in diverse biological processes
We then designed a focused sgRNA library targeting 394 medium-essential candidate hits (212 negative; 182 positive) and 257 hit-related genes (e.g., shared pathway or family), and used it to profile 4 human blood cancer lines (K562, NOMO1, MOLM13, and SUDHL4) in HPLM+dS and RPMI+dS (Figures 2A and S2A; Tables S3 and S4). Passaging frequencies were identical to those in our genome-wide screens, and population doubling rates between conditions were again comparable (Table S3). Since our focused library contained a subset of nontargeting sgRNAs and others that targeted a fraction of CEGs, we could analogously scale all gene scores (Table S3). Importantly, we also observed a minimal effect on our genome-wide screen datasets if gene scores were instead scaled by using these smaller sgRNA subsets. (Figure S2B and Table S1). Replicate secondary screens in K562 cells were well-correlated, and among the screens in our cell line panel, showed the highest correlation with our genome-wide screen datasets (Figure S2C and S2D). Therefore, we combined data from the two replicates to establish pooled datasets and differential dependencies, which were highly correlated with those from our genome-wide screens – indicating that conditional phenotypes could be largely recapitulated by using our focused library (Figures 2B and S2E).
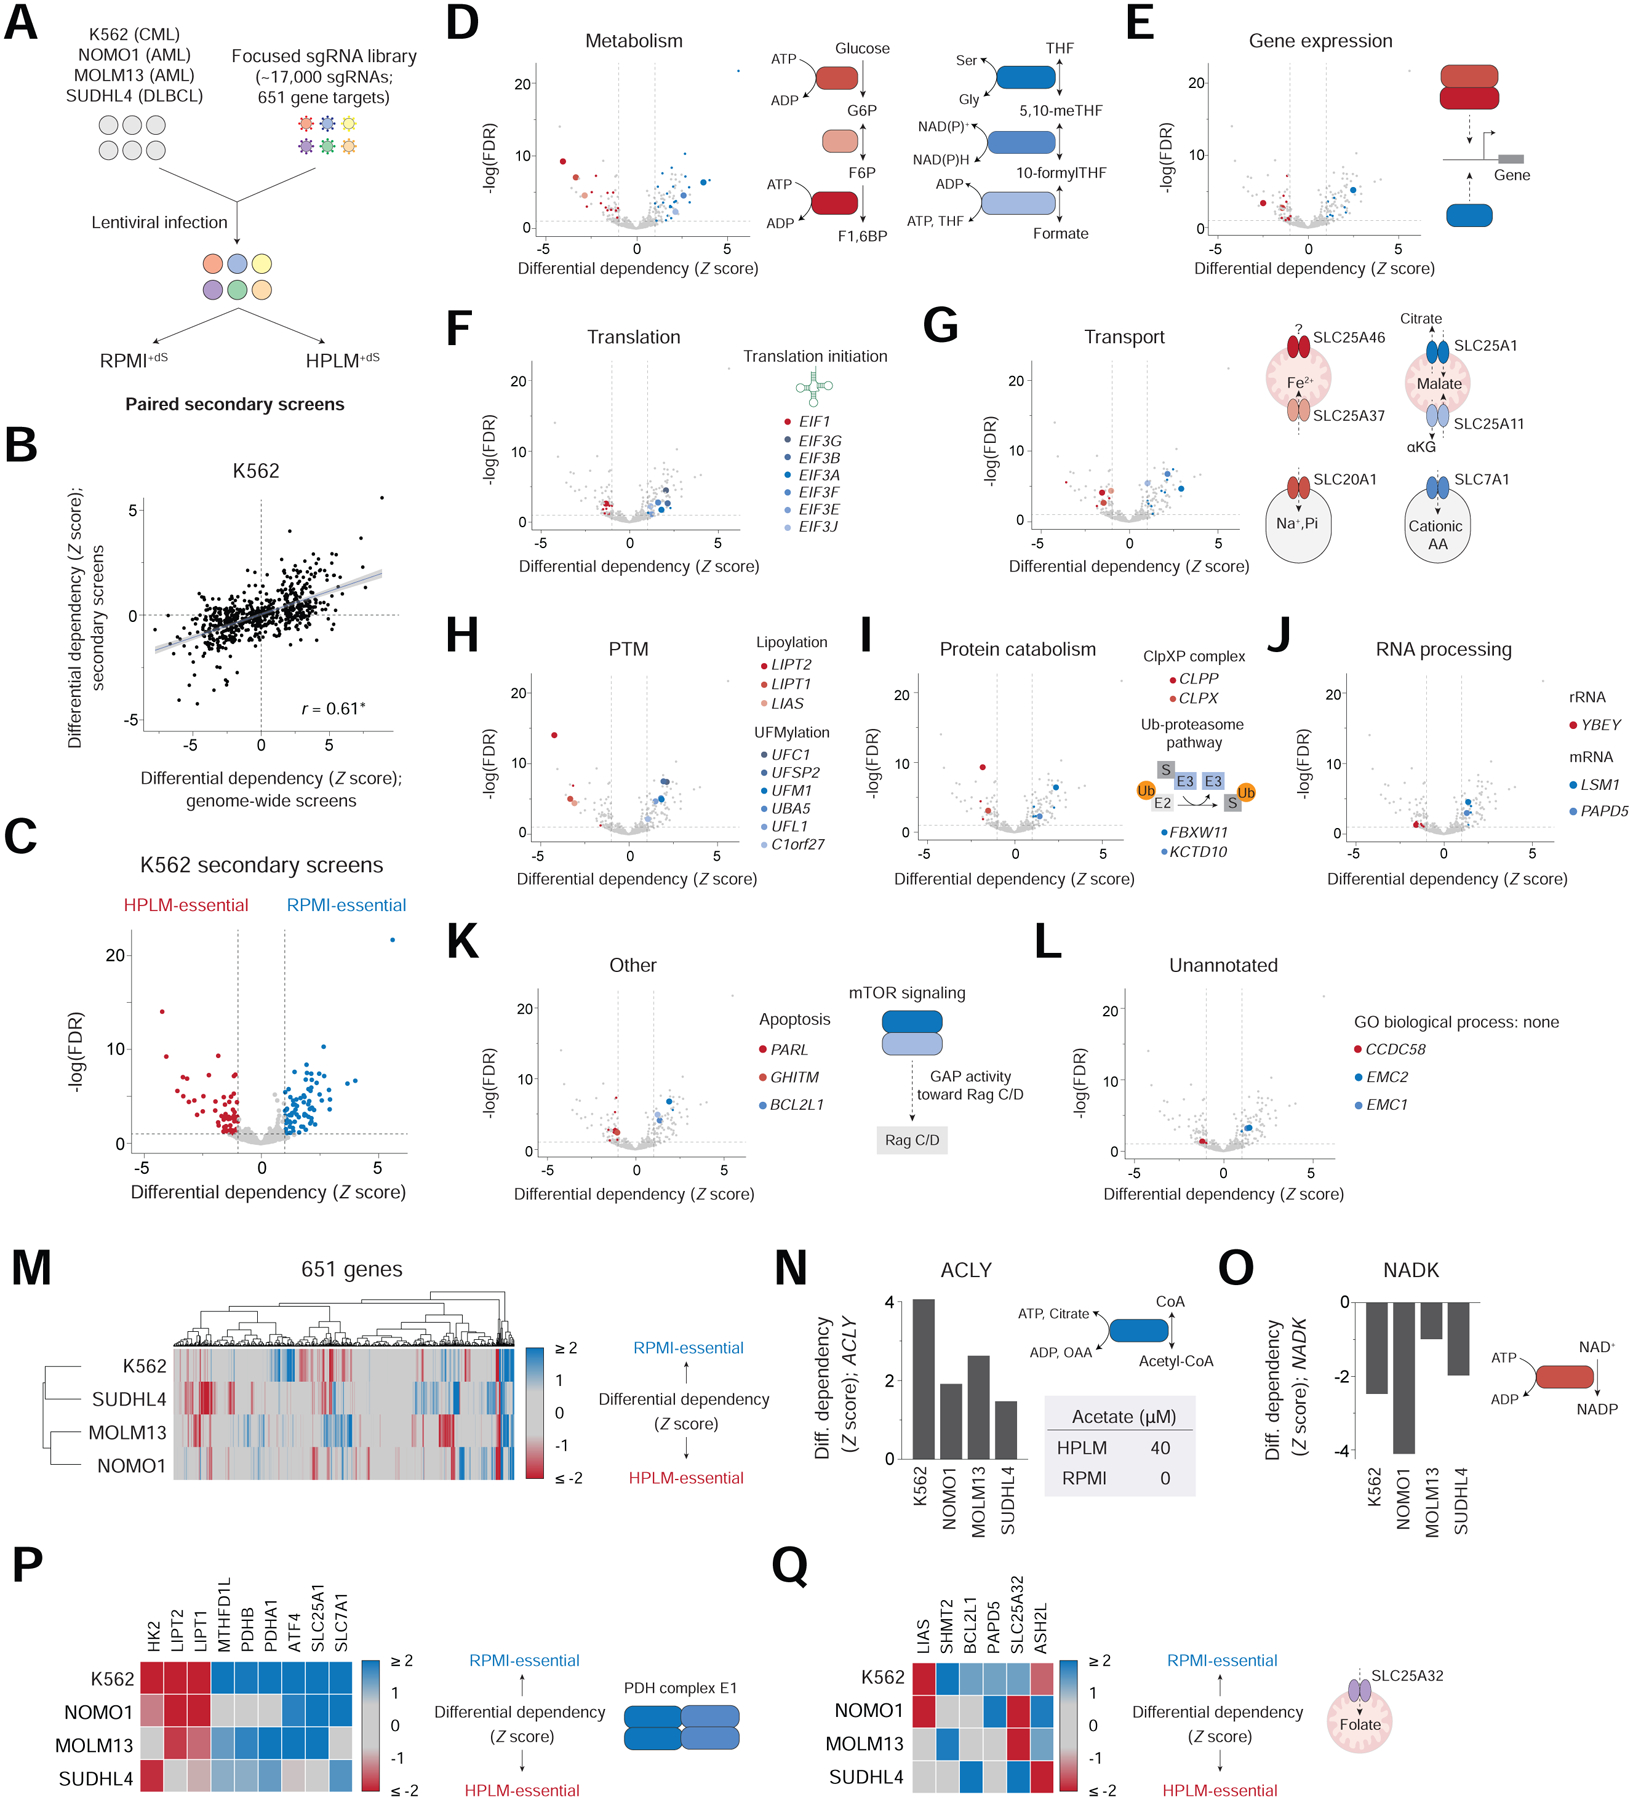
Figure 2. Conditionally essential genes span several cellular processes and can vary with cell-intrinsic diversity.
See also Figure S2 and Table S3
(A) Schematic for focused library CRISPR screens. AML, acute myeloid leukemia; DLBCL, diffuse large B-cell lymphoma.
(B) Comparison between phenotypes from genome-wide and secondary K562 screens. Data are fit by linear regression (blue line); shaded bands indicate 95% confidence intervals. r, Pearson’s correlation coefficient. *P = 2.2 × 10⁻¹⁶. Data for secondary K562 screens are from pooled replicates in panels B-Q.
(C) Conditional phenotypes in the secondary K562 screens. Dotted lines mark ± 1 (x-axis) and a false discovery rate (FDR) = 0.1 (y-axis).
(D-L) Medium-essential hits encode proteins that have roles in: (D) metabolism, (E) gene expression, (F) translation, (G) transport, (H) post-translational modification (PTM), (I) protein catabolism, (J) RNA processing, and (K) other processes, including apoptosis and mTOR signaling. Other hits lack a GO process annotation (L). Shaded points indicate hits manually curated for association with process highlighted in the panel (See STAR Methods).
(M) Cluster map showing conditional phenotypes in four cell lines.
(N-O) Conditional phenotypes for ACLY (N) and NADK (O).
(P-Q) Heatmap of conditional phenotypes for indicated genes (left). PDHA1 and PDHB are components of PDH complex E1 subunit (P, right). SLC25A32 is a mitochondrial folate transporter (Q, right). Remaining genes are highlighted elsewhere in the Figure.
Next, to identify the medium-essential hits in K562 cells likely to be most robust, we tested the significance of each differential dependency from our pooled datasets. By setting a standard score cutoff of 1, we identified 149 medium-essential hits (71 negative; 78 positive) at a 0.1 false discovery rate (FDR) (Figure 2C). Given the targeting bias of our focused library, we chose this cutoff to maintain selection for differential gene scores that met the medium-essential threshold set for our genome-wide screens. Consistent with the pathway enrichment analysis above, these hits have roles in several cellular processes.
Despite the normalized glucose availability between conditions, genes encoding enzymes that catalyze initial steps in glycolysis (HK2, GPI, and PFKP) were HPLM-essential, while others that catalyze successive reactions in one-carbon metabolism (SHMT2, MTHFD2, and MTHFD1L) were RPMI-essential – perhaps given the HPLM-specific availability of formate (Figure 2D). We also uncovered hits that have roles in gene expression, including a heterodimer with histone methyltransferase activity (ASH2L and RBBP5) and a transcription factor involved in the response to nutrient restriction (ATF4) (Figure 2E) (Cao et al., 2010; Wortel et al., 2017). Interestingly, while translation initiation factor 1 (EIF1) scored as HPLM-essential, we found that several members of the translation initiation factor 3 complex were instead RPMI-essential (Figure 2F).
Our analysis also revealed hit genes that encode transporters of metabolites (SLC25A1, SLC25A11, and SLC7A1), small ions (SLC25A37 and SLC20A1), and unidentified substrates (SLC25A46) (Figure 2G). We could also uncover hits involved in post-translational modifications, including lipoylation, the covalent attachment of lipoamide to proteins; and UFMylation, a system that attaches UFM1 to proteins (Figure 2H) (Komatsu et al., 2004; Solmonson and DeBerardinis, 2018; Wang et al., 2017). Other medium-essential genes have roles in protein catabolism, including components of the ClpXP complex (CLPX and CLPP) and of E3 ubiquitin-protein ligase complexes (KCTD10 and FBXW11); as well as in RNA processing (YBEY, LSM1, and PAPD5), apoptosis (BCL2L1, PARL, and GHITM), and mTOR signaling (FLCN and FNIP1). (Figures 2I, 2J, and 2K).
Lastly, we also identified hit genes that lack a GO process annotation, such as CCDC58 and members of the ER membrane protein complex (EMC1 and EMC2) (Figure 2L). While the causes for most conditional phenotypes uncovered by our analysis are not immediately apparent, these results reveal that basal medium composition has a strong impact on gene essentiality.
Conditional gene essentiality can be influenced by natural cell-intrinsic diversity
Next, we sought to ask how conditional gene essentiality might differ between cell lines. Overall, the sets of hit genes in the four cell lines showed variable degrees of overlap (Figure 2M). For example, ATP-citrate lyase (ACLY) was a positive hit in each cell line – since ACLY generates acetyl-CoA from citrate, we reason that this could be linked to the HPLM-specific availability of acetate, an alternative substrate for cellular acetyl-CoA synthesis (Figure 2N) (Zhao et al., 2016). By contrast, the cytosolic NAD kinase (NADK) was a negative hit in all four cell lines, though the underlying gene-nutrient interaction is unknown (Figure 2O).
Other hits were shared among only three cell lines, including components of the pyruvate dehydrogenase complex E1 subunit (PDHA and PDHB) (Figure 2P). Additionally, four of the six genes that encode enzymes in the de novo purine biosynthesis pathway were RPMI-essential – perhaps given that only HPLM provides hypoxanthine, a salvage substrate for purine biosynthesis (Figure S2F). Differences in hypoxanthine uptake might perhaps explain why these hits were not shared by the K562 line. Interestingly, we also identified genes involved in cobalamin/methionine metabolism (MTR, MTRR, and MMACHC) that scored as RPMI-essential in K562 cells, but as HPLM-essential in the remaining cell lines, thus demonstrating that the specific condition in which a gene is medium-essential can also depend on cell-intrinsic factors (Figure S2G). This analysis also revealed conditional hits shared between only two cell lines, including the mitochondrial folate transporter (SLC25A32) (Figure 2Q), and several others specific to a single cell line (Figure S2H).
Together, these results support the notion that gene essentiality is dictated by an interplay of cell-intrinsic and environmental factors (Rancati et al., 2018), suggesting that CRISPR screens performed in HPLM across broader cancer cell line panels could reveal new context-dependent genetic liabilities.
Identification of a gene-nutrient interaction between GPT2 and alanine
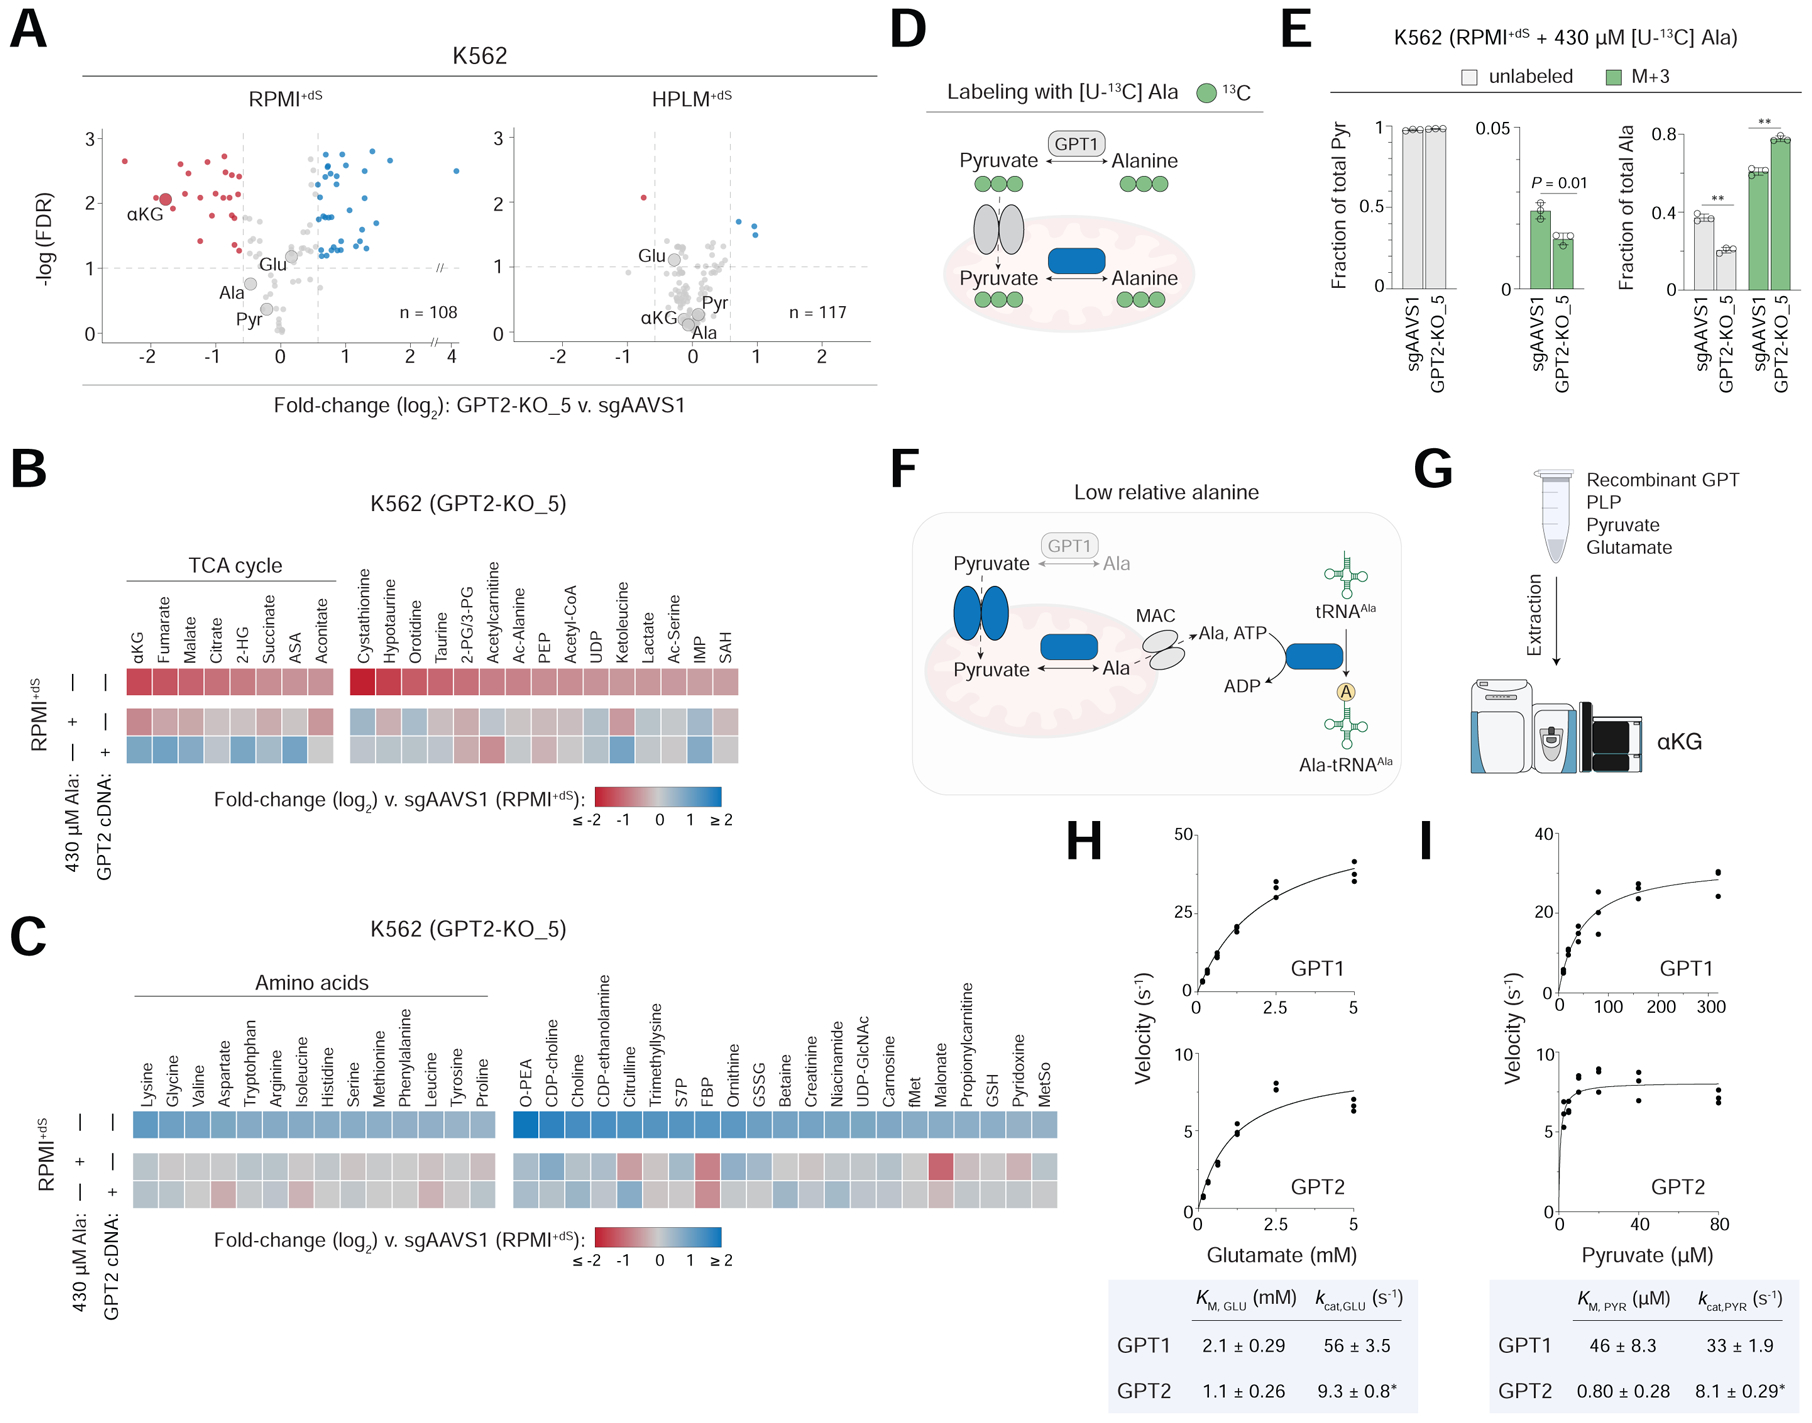
Despite the variability between conditional gene essentiality profiles above, GPT2 was the top scoring RPMI-essential hit in all four cell lines (Figure 3A). Interestingly, GPT2 is annotated as essential in < 1% of the over 700 cancer cell lines screened in DepMap (Figure S3A). GPT2 encodes one of two human enzymes that catalyze the reversible conversion of pyruvate and glutamate to alanine and α-ketoglutarate (αKG), but that differ in their subcellular localization (GPT1, cytosolic; GPT2, mitochondrial) (Figure 3B). GPT2 deletion strongly impaired cell growth only in RPMI+dS, whereas GPT1 deletion had little effect on growth in either medium (Figures S3B and S3C). Consistent with this, GPT1 is annotated as essential in a similarly negligible fraction of cell lines from DepMap (Figure S3D). Notably, RNA-seq data of nearly 1,300 human cancer lines indicates a near absolute selection for the expression of GPT2 versus GPT1 (Figure S3E) (Ghandi et al., 2019). We confirmed this phenotype at the protein level in our cell line panel, and also found that GPT2 expression in K562 cells was unaffected by culture in HPLM+dS relative to either RPMI-based medium (Figures 3C and 3D).
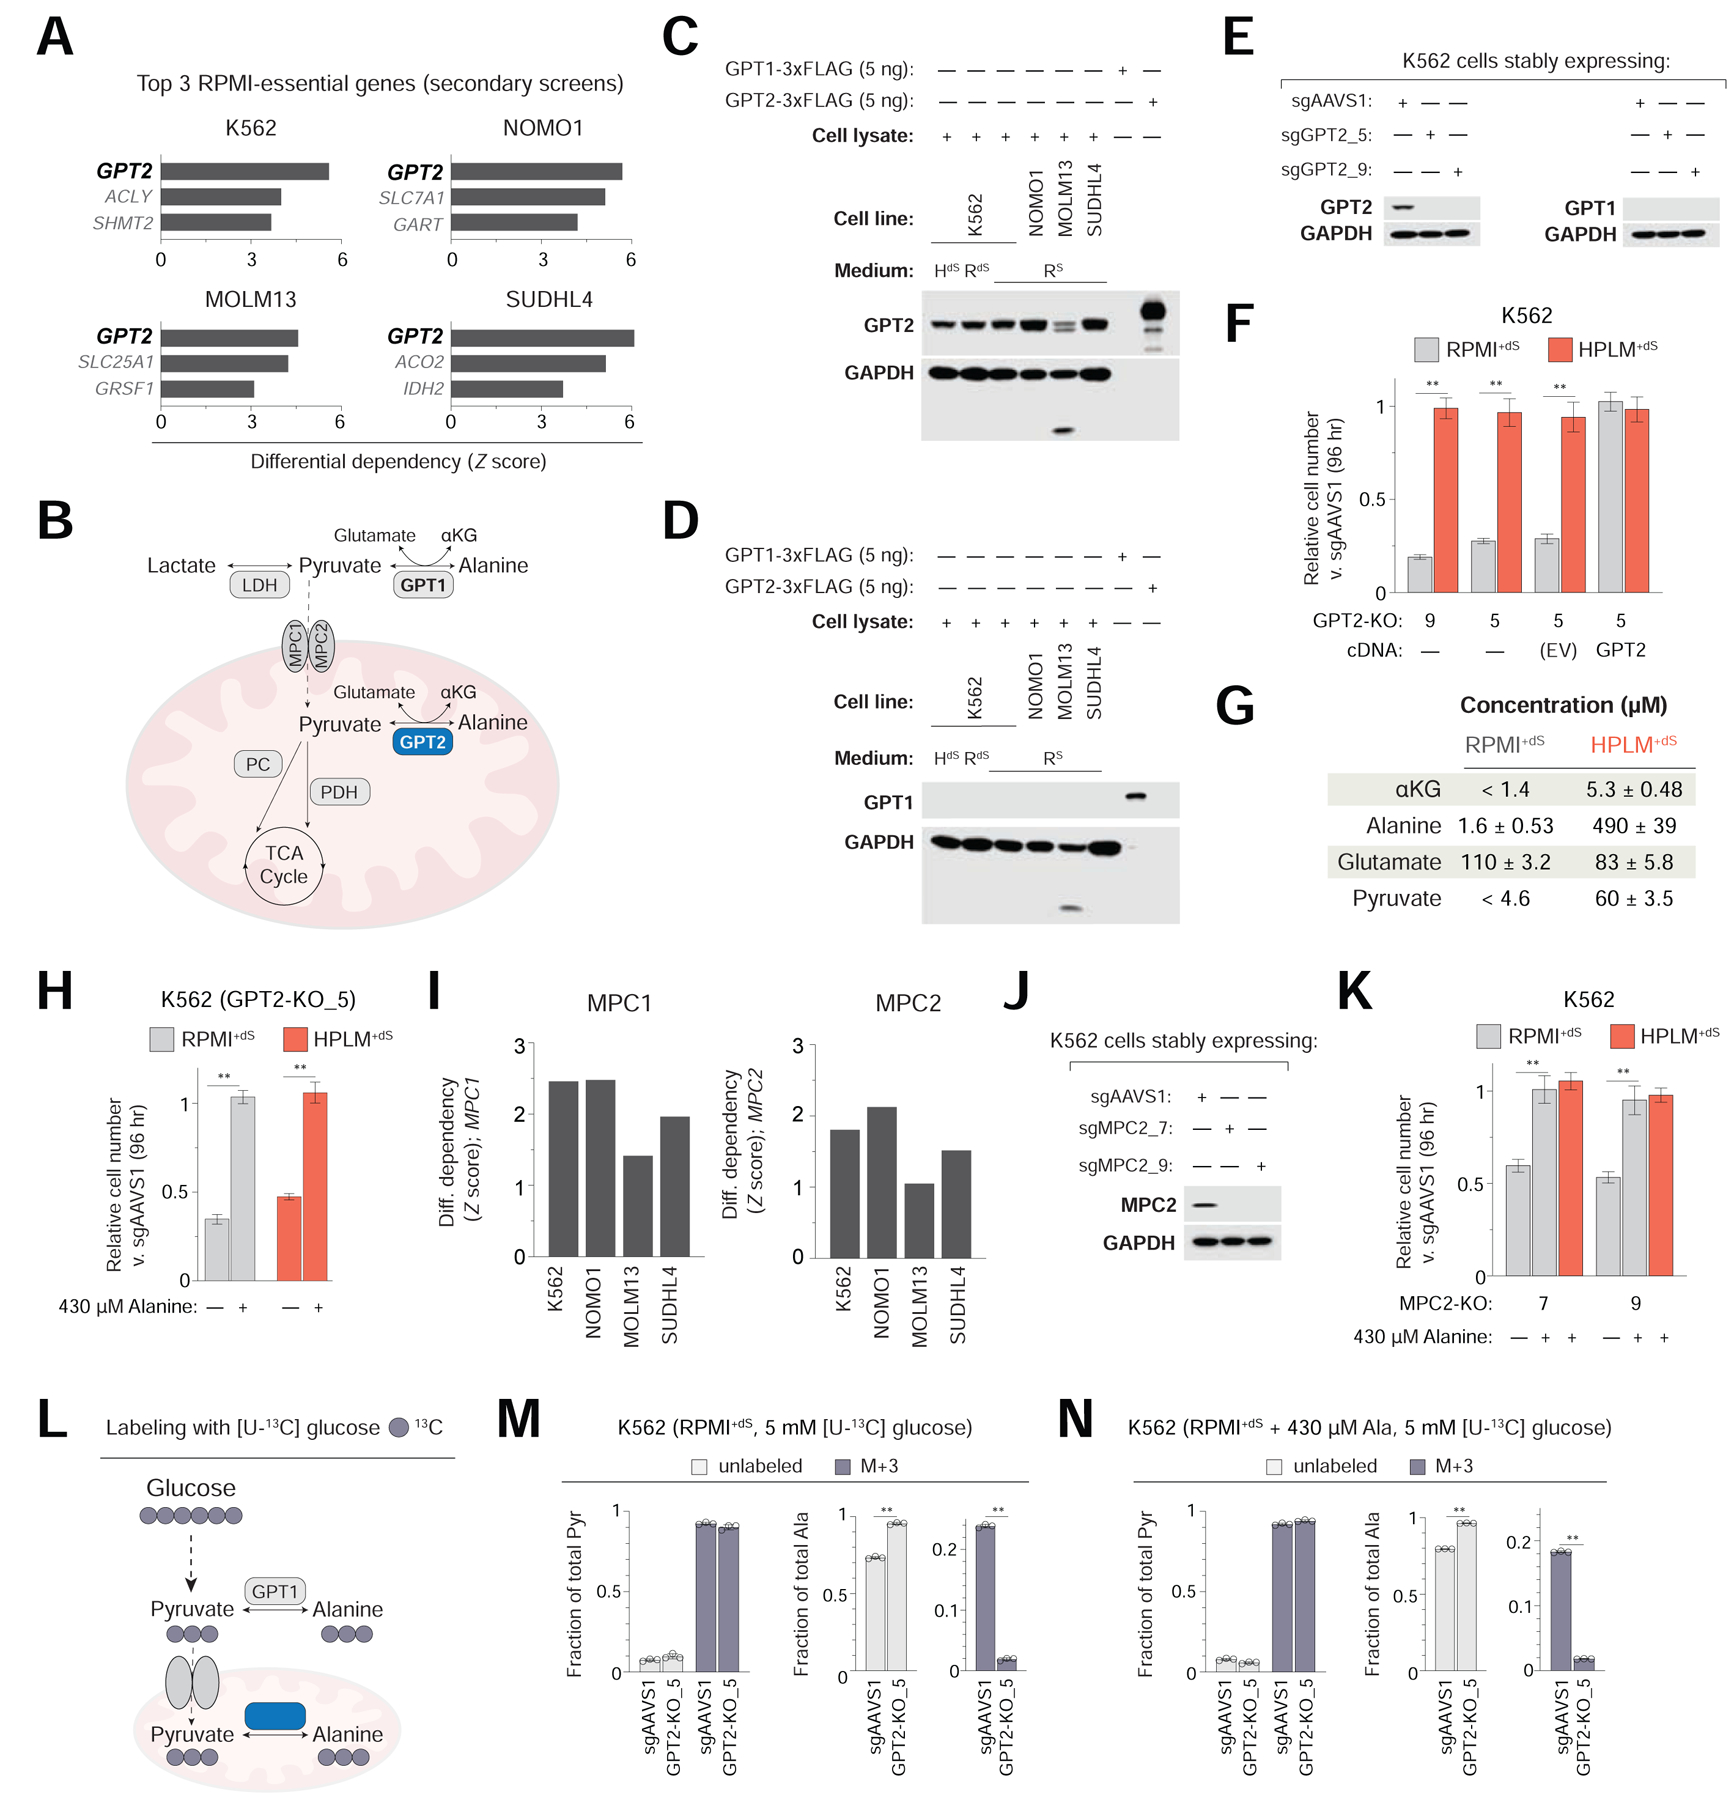
Figure 3. Identification of a gene-nutrient interaction between GPT2 and alanine.
See also Figure S3
(A) Top three scoring RPMI-essential hits in four cell lines. Data for secondary K562 screens are from pooled replicates in panels A, I.
(B) Cellular fates of pyruvate and the reversible reaction catalyzed by GPT1/2. LDH, lactate dehydrogenase; PDH, pyruvate dehydrogenase; PC, pyruvate carboxylase.
(C-D) Immunoblots for expression of GPT2 (C) and GPT1 (D). Purified proteins confirm antibody specificity. High intrinsic protease activity in the MOLM13 line might cause the observed banding.
(E) Immunoblots for expression of either GPT2 (left) or GPT1 (right) in GPT2-knockout and control (sgAAVS1) K562 cells.
(F) Relative growth of GPT2-knockout versus control cells (mean ± SD, n = 3, **P < 0.005). EV, empty vector.
(G) Measured concentrations of GPT reaction components in RPMI+dS and HPLM+dS (mean ± SD, n = 3). Neither αKG nor pyruvate could be detected in RPMI+dS by the metabolite profiling method; thresholds correspond to levels in RPMI+S.
(H) Relative growth of GPT2-knockout versus control cells (mean ± SD, n = 3, **P < 0.005).
(I) Conditional phenotypes for MPC1 (left) and MPC2 (right).
(J) Immunoblot for expression of MPC2 in MPC2-knockout and control K562 cells.
(K) Relative growth of MPC2-knockout versus control cells (mean ± SD, n = 3, **P < 0.005).
(L) Schematic for the incorporation of 13C from glucose into alanine via pyruvate.
(M-N) Fractional labeling of pyruvate (left) and alanine (right) following culture of cells in RPMI+dS containing [U-13C]-glucose (M) and further supplemented with 430 μM alanine (N) (mean ± SD, n = 3, **P < 0.005). M+3, incorporation of three 13C.
To investigate the conditional phenotype for loss of GPT2, we engineered GPT2-knockout K562 clonal cells, which showed the same lack of detectable GPT1 as control cells transduced with an AAVS1-targeting sgRNA (Figure 3E) (Wang et al., 2015). By using short-term growth assays, we then confirmed that GPT2 deletion caused a marked growth defect specific to culture in RPMI+dS (Figure 3F). Importantly, the expression of a sgRNA-resistant GPT2 cDNA rescued this defect, while transducing cells with the same construct lacking a cDNA did not.
To determine why GPT2 deletion impaired cell growth in RPMI+dS, we first considered the relative availability of each GPT reaction component, reasoning that the de novo synthesis of one or more may become cell-essential under a limiting condition. While glutamate levels between the two media are comparable, HPLM contains the three remaining components at concentrations at least 5- (αKG), 15- (pyruvate), and 200-fold (alanine) greater than those measured in RPMI+dS (Figure 3G). Recent studies in human cancer cells have highlighted a role for GPT2 in facilitating glutamine anaplerosis via the production of αKG (Hao et al., 2016; Kim et al., 2019; Smith et al., 2016; Weinberg et al., 2010); and further, others have reported that GPTs can serve to fuel the TCA cycle in certain cancers by catabolizing alanine to pyruvate (Parker et al., 2020; Sousa et al., 2016). Therefore, we considered whether the differential availability of either αKG or pyruvate could explain the RPMI-essential phenotype of GPT2. Among the stocks of HPLM components that we create is one containing αKG, pyruvate, and eight additional water-soluble acids (WSAs) (Figure S3F and Table S5). Interestingly, addition of this WSAs stock to RPMI+dS could not boost the growth of GPT2-knockout cells, and neither could that of cell-permeable dimethyl αKG (DM-αKG) at concentrations up to 40-fold greater than that of HPLM-defined αKG (Figure S3G). We then considered the relative availability of alanine which, despite being the second most abundant amino acid in human blood, is not a component of either RPMI or DMEM. When we supplemented RPMI+dS with physiologic alanine (430 μM), we observed a full rescue of the growth defect and, in addition, found that removing alanine from HPLM+dS could impair the relative growth of GPT2-knockout cells (Figure 3H).
We then reasoned that GPT2-catalyzed alanine production would require GPT2 having access to the necessary substrates. The mitochondrial pyruvate carrier (MPC) is an obligate heterodimer (MPC1 and MPC2) that transports pyruvate into the mitochondrial matrix (Bricker et al., 2012; Herzig et al., 2012). Consistent with our rationale, both MPC1 and MPC2 were RPMI-essential hits in all four cell lines (Figure 3I). To confirm this, we engineered MPC2-knockout K562 clonal cells which, as anticipated, showed a growth defect specific to culture in RPMI+dS that could be similarly rescued by the addition of physiologic alanine (Figures 3J and 3K).
Next, to determine the fraction of cellular alanine contributed by GPT2-mediated de novo synthesis, we compared 13C-labeling patterns of pyruvate and alanine following 24 hr culture of GPT2-knockout and control K562 cells in RPMI+dS containing [U-13C]-glucose (Figure 3L). We found that GPT2 deletion had almost no impact on the fraction of pyruvate labeled with three 13C (M+3) but decreased that of M+3-alanine to a near negligible level (Figure 3M). These results are consistent with prior work that reported reductions in fractional labeling of alanine downstream of glucose/pyruvate in either Gpt2-null mouse embryonic fibroblasts or in human cells treated with an MPC inhibitor (Ouyang et al., 2016; Vacanti et al., 2014; Yang et al., 2014). When we analogously performed glucose tracing in RPMI+dS containing 430 μM alanine, we observed only minor effects on the labeling patterns above, indicating that GPT2-catalyzed formation of alanine (and αKG) is not necessarily dictated by alanine availability alone (Figure 3N).
Together, these results reveal that conditional CRISPR phenotypes for GPT2 and MPC1/2 can be traced to alanine, one of three GPT reaction components uniquely defined in HPLM versus RPMI. By comparing gene essentiality profiles in HPLM+dS versus RPMI+dS, we found that GPT2 and the MPC each serve roles in an alanine-dependent cell-essential process under conditions of relative alanine limitation.
GPT2 supports protein synthesis under conditions of relative alanine restriction
To determine the cell-essential demand supported by alanine for cells in RPMI+dS, we first performed unbiased metabolite profiling of GPT2-knockout and control K562 cells following 24 hr culture in either HPLM+dS or RPMI+dS (Table S6). Of note, among the GPT reaction components specific to HPLM versus RPMI, only alanine showed conditional abundances in control cells that reflected the differential availability between media (Figure S4A). Interestingly, GPT2 deletion had widespread effects on cellular metabolite levels following culture in RPMI+dS but not in HPLM+dS (Figure 4A).
Figure 4. Protein synthesis underlies the GPT2-alanine interaction and human GPTs show markedly different KM values for pyruvate.
See also Figures S4 and Table S6
(A) Unbiased metabolite profiling of GPT2-knockout versus control K562 cells (n = 3). Dotted lines mark a fold-change of ± 1.5 (x-axis). GPT reaction components are labeled.
(B-C) Heatmap of relative abundances for metabolites highlighted in either red (B) or blue (C) in panel A, RPMI+dS. GPT2-knockout cells following culture in the indicated conditions (three rows) versus control cells in RPMI+dS. Metabolite clusters are sorted by log2-transformed fold change of the top row. Argininosuccinic acid (ASA) can be a precursor to fumarate. Remaining metabolite abbreviations in Table S6.
(D) Schematic for the incorporation of 13C from alanine into pyruvate.
(E) Fractional labeling of pyruvate (left) and alanine (right) following culture of cells in RPMI+dS containing [U-13C]-alanine (mean ± SD, n = 3, **P < 0.005). M+3, incorporation of three 13C.
(F) Proposed model for the cell-essential role of GPT2 in conditions of relative alanine limitation. Proteins encoded by RPMI-essential hits (blue). A canonical mitochondrial alanine carrier (MAC) has not yet been identified.
(G) Schematic of an assay for the forward GPT reaction using LC-MS-based detection of αKG.
(H-I) Plots of reaction velocity as a function of either glutamate (H) or pyruvate (I) concentration for human GPT1 (top) and GPT2 (bottom) (n = 3). Data are fit by Michaelis-Menten curves. *kcat values displayed by GPT2 may be underestimated (See Main Text).
By setting a fold-change cutoff of −1.5, we found that GPT2-knockout reduced the levels of 23 metabolites at 0.1 FDR, including αKG and several others involved in the TCA cycle; but not alanine, whose abundance was reduced by an extent half that of αKG. However, whereas the expression of our GPT2 cDNA reversed most changes among the TCA cycle-related metabolites, culture in RPMI+dS containing 430 μM alanine did not (Figure 4B). GPT2 deletion also increased the levels of 35 metabolites by at least 1.5-fold at the same FDR – among which nearly half were proteinogenic amino acids. However, these changes were largely reversed by either GPT2 cDNA expression or physiologic alanine, suggesting that they might be more relevant to the GPT2-alanine interaction (Figures 4C and S4B). Given that increased cellular amino acid pools (and reduced translation) are a primary consequence of amino acid restriction (Bröer and Bröer, 2017), these results suggest that GPT2-knockout cells growing in RPMI+dS exhibit a metabolic phenotype consistent with nutrient restriction.
Next, to ask if GPT2 might support a cell-essential catabolic demand in conditions of relative alanine restriction, we compared the 13C-labeling of alanine and pyruvate following 24 hr culture of GPT2-knockout and control K562 cells in RPMI+dS containing [U-13C]-alanine (Figure 4D). Differences in fractional M+3-alanine labeling were complementary to those from our glucose tracing data as expected, but GPT2 deletion had little effect on the otherwise minimal fraction of M+3-pyruvate in control cells (Figure 4E). The fractional labeling of downstream metabolites in pyruvate metabolism was negligible as well (Table S6). Of note, physiologic alanine could also rescue the growth defect of GPT2-knockout cells in RPMI+dS following 24 hr culture, importantly suggesting that metabolite profiling and tracing data at this timepoint were biologically relevant to the GPT2-alanine interaction (Figure S4C).
Together, our results suggest a model in which alanine supports the non-catabolic cell-essential process of protein synthesis – a role similarly reported in the context of T-cell activation (Figure 4F) (Ron-Harel et al., 2019). Consistent with this model, GPT2 and the cytosolic alanyl-tRNA synthetase (AARS) were the top and third strongest RPMI-essential hits, respectively, from our genome-wide K562 screens (Figure S4D). This conditional phenotype for AARS deletion was recapitulated in secondary K562 screens and further identified in two other cell lines (Figure S4E). Notably, AARS is among the reference CEGs and its loss indeed caused a strong growth defect in each condition (Figure S4F). To reconcile these data, we speculate that from the point of Cas9-mediated AARS cleavage, cellular alanine levels above a critical threshold can maintain tRNAAla charging until the turnover of residual AARS at rates that likely vary between cell lines.
Human GPTs display markedly different KM values for pyruvate
Next, given the RNA-seq data for GPT1/2 across more than 1,200 human cancer cell lines, we considered whether enforced expression of GPT1 could complement the loss of GPT2. When we transduced GPT1 cDNA into GPT2-knockout cells, we saw a complete rescue of the growth defect in RPMI+dS, indicating that mitochondrial localization of GPT activity was not necessary to meet the cell-essential demand for de novo alanine synthesis (Figure S4G).
The reverse GPT reaction that instead generates pyruvate and glutamate has long been recognized for a key role in hepatic gluconeogenesis (Felig, 1973). RNA-seq data across more than 50 human tissues from the GTEx project indicate that GPT1 is indeed most abundant in liver and has a restricted distribution profile otherwise, but that GPT2 levels are comparable between the liver and several other tissues (Lonsdale et al., 2013) (Figure S4H). Therefore, to ask if cellular GPT1 is instead poised toward pyruvate production in alanine-replete conditions, we performed [U-13C]-alanine tracing in GPT2-knockout cells transduced with our GPT1 cDNA. Relative to the labeling patterns that we observed in our control cells, the fraction of M+3-pyruvate was increased by just over 1%, whereas that of M+3-alanine was dramatically reduced by nearly 40% – indicating that a larger fraction of the alanine pool was generated de novo, as catalyzed by supraphysiologic GPT1 (Figures S4I and S4J). Interestingly, these results suggest that independent of alanine availability, both GPTs were poised toward alanine (and αKG) formation in this context.
Since the two human GPTs share just 67% sequence homology, we then considered that they might exhibit different kinetic parameters for the forward GPT reaction. However, there was little reported biochemical characterization for these enzymes, and standard GPT assays rely on indirect readouts based on coupled activities (Glinghammar et al., 2009; Gubern et al., 1990; McAllister et al., 2013; Ouyang et al., 2016). To address this, we developed a new GPT activity assay, whereby reactions containing recombinant GPT can be evaluated using liquid chromatography-mass spectrometry (LC-MS)-based detection of αKG (Figures 4G and S4K).
By leveraging this new assay, we found that KM values for glutamate were similar between the two GPTs and equivalent to a few-fold less than glutamate levels (~6 mM) in our K562 control cells (Figure 4H and Table S6). However, the estimated KM for pyruvate displayed by GPT1 was more than 40-fold greater relative to that by GPT2 and comparable to pyruvate concentrations (~50 μM) in the same control cells (Figure 4I and Table S6). These results suggest that if cytosolic versus mitochondrial pyruvate levels are not substantially higher, only cellular GPT2 but not GPT1 would be saturated with the substrate. Interestingly, recent work in mouse astrocytes reported that such differences in compartmentalized pyruvate were relatively minor (Arce-Molina et al., 2020). Of note, given the protein banding patterns that we observed for our recombinant GPTs, the kcat values displayed by GPT2 versus GPT1 may be underestimated, though with no effect otherwise on the estimated KM values (Figure S4L). Lastly, we expect that GPT1/2 can be poised for the reverse GPT reaction in the liver or other contexts that require cells to accordingly meet distinct metabolic demands.
Identification of a gene-nutrient interaction between GLS and pyruvate
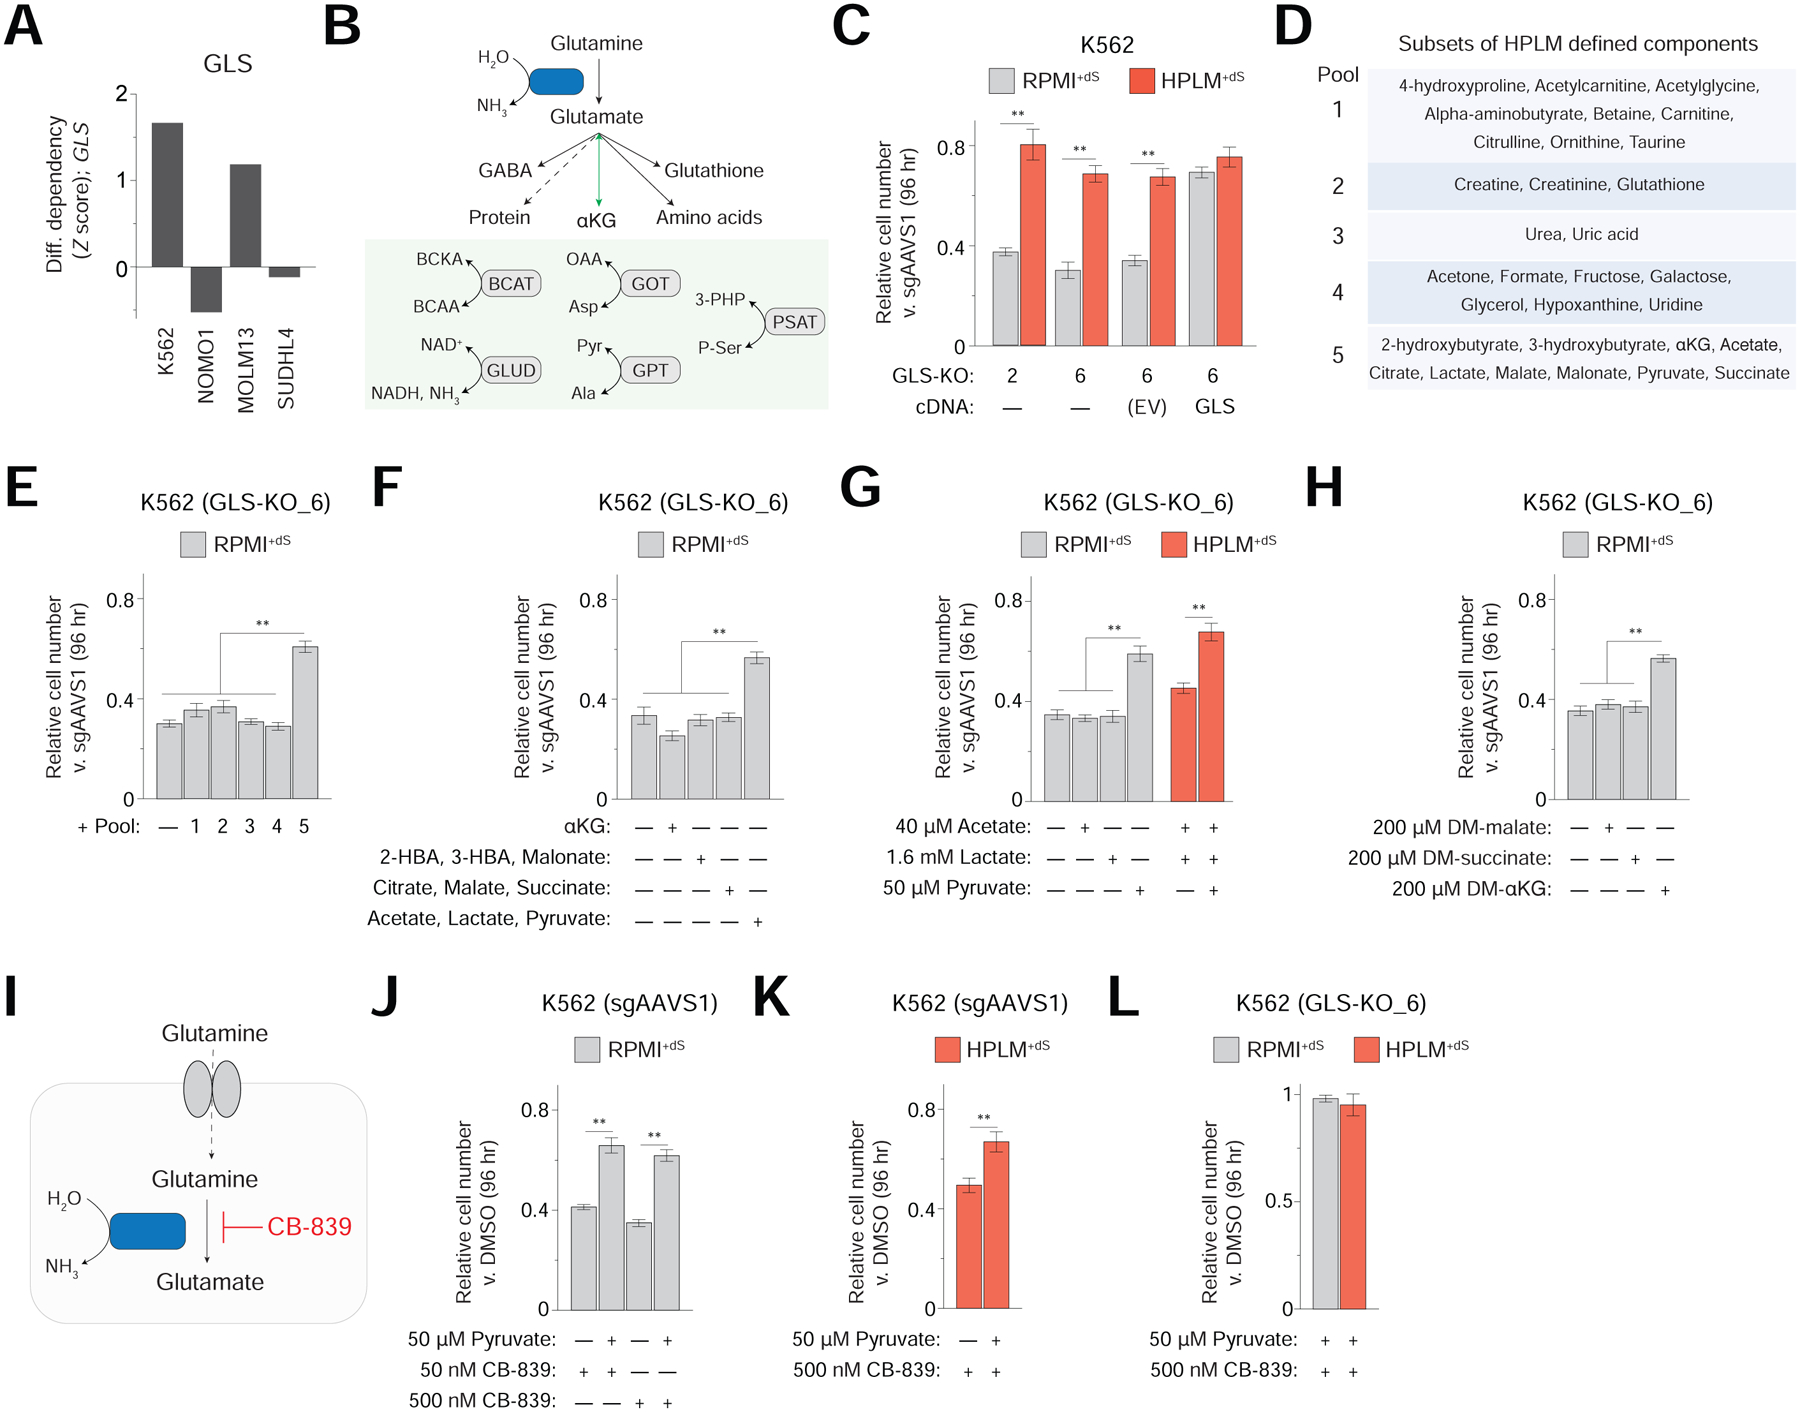
We could also use our data to identify medium-essential genes that encode current targets of interest for cancer therapy. For example, GLS was among the top 20 scoring RPMI-essential hits in our genome-wide K562 screens (Table S1). This hit was recapitulated in secondary K562 screens but shared in only one other cell line, indicating that cell-intrinsic heterogeneity can also contribute to GLS essentiality (Figures 5A and S5A). GLS catalyzes the hydrolysis of glutamine to glutamate, which is involved in several pathways – including as a co-substrate in reactions that mediate its reversible conversion to αKG (Figure 5B) (Altman et al., 2016).
Figure 5. Identification of a gene-nutrient interaction between GLS and pyruvate.
See also Figure S5
(A) Conditional phenotypes for GLS. Data for secondary K562 screens are from pooled replicates.
(B) Reaction catalyzed by GLS and cellular fates of glutamate, including its reversible conversion to αKG (top) as coupled to various reactions (bottom). BCKA, branched-chain keto acid. BCAA, branched-chain amino acid.
(C) Relative growth of GLS-knockout versus control cells (mean ± SD, n = 3, **P < 0.005).
(D) Pools of defined HPLM components.
(E-H) Relative growth of GLS-knockout versus control cells (mean ± SD, n = 3, **P < 0.005). Pool designations correspond to panel D (E). Metabolites added at HPLM-defined concentrations (F-G).
(I) Schematic for competitive inhibition of GLS by the small-molecule CB-839.
(J-L) Relative growth of either control (J, K) or GLS-knockout K562 cells (L) treated with CB-839 versus DMSO (mean ± SD, n = 3, **P < 0.005).
Interestingly, recent work indicates that environmental factors can influence cell sensitivity to GLS inhibition (Davidson et al., 2016; Le et al., 2012; Muir et al., 2017). Of note, one such link was traced to cystine availability (Muir et al., 2017); however, since cystine levels in HPLM+dS and RPMI+dS differ by less than 2-fold, we reasoned that an alternative gene-nutrient interaction might explain the conditional phenotype for loss of GLS suggested by our data (Figure S5B). To pursue this, we created GLS-knockout K562 clonal cells which, as anticipated, showed a greater growth defect in RPMI+dS than in HPLM+dS (Figure 5C). Importantly, the expression of a sgRNA-resistant cDNA largely normalized this relative defect across conditions, though did not fully restore growth versus the control cells – likely owing to clonal characteristics unrelated to GLS (Figure S5C).
Next, because glutamate concentrations in HPLM and RPMI are comparable as well, we systematically tested the growth of GLS-knockout cells in RPMI+dS derivatives containing pools of HPLM-specific components, finding that only the addition of WSAs had a strong positive impact (Figures 5D and 5E). Through additional rounds of subdivision, we ultimately pinpointed this effect to pyruvate, and further, also found that removing pyruvate from HPLM+dS caused a comparable growth defect in these cells (Figures 5F and 5G). Given that pyruvate is an upstream substrate in metabolic pathways that can generate αKG, we considered whether the GLS-pyruvate interaction could be linked to αKG production. Interestingly, supraphysiologic DM-αKG rescued the growth defect of GLS-knockout cells in RPMI+dS by the same extent as physiologic pyruvate, but other cell-permeable products of glutamine catabolism (DM-malate or DM-succinate) did not (Figure 5H). Together, these results suggest a model in which αKG synthesis underlies a gene-nutrient interaction between GLS and pyruvate, whose uptake in certain breast cancer cells could induce αKG production as well (Elia et al., 2019).
Consistent with our model, GLS deletion reduced αKG levels by more than 2-fold versus control cells following 24 hr culture in RPMI+dS; and further, the addition of physiologic pyruvate moderately increased (~35%) these levels in GLS-knockout cells – though with little concomitant effect on relative growth at that timepoint (Figures S5D and S5E). Of note, since transducing GLS cDNA into our GLS-knockout cells had a slightly stronger positive effect on cell growth than adding either pyruvate or DM-αKG to RPMI+dS, we speculate that other aspects of glutamate metabolism could also perhaps contribute to the conditional phenotype for GLS deletion. Additionally, given that αKG plays a role in several cellular processes, the question of how pyruvate-induced αKG synthesis might specifically improve the growth of GLS-knockout cells remains.
Next, we asked if GLS inhibition could recapitulate the conditional CRISPR phenotype for GLS. When we treated our control K562 cells with CB-839 – a small-molecule GLS inhibitor being tested in human cancer patients (Gross et al., 2014; Luengo et al., 2017) – we observed growth defects comparable to those caused by GLS-knockout in RPMI+dS and HPLM+dS, which could also be similarly influenced by physiologic pyruvate availability and only marginally exacerbated by a 10-fold boost in dosage (Figures 5I, 5J, and 5K). Moreover, CB-839 had little impact on the growth of GLS-knockout cells in either HPLM+dS or pyruvate-supplemented RPMI+dS, offering further evidence of both its on-target activity and specificity (Figure 5L). Collectively, these results demonstrate that gene-nutrient interactions identified by analysis of conditional gene essentiality profiles can potentially be phenocopied as drug-nutrient interactions.
Basal and serum components of culture media influence gene essentiality
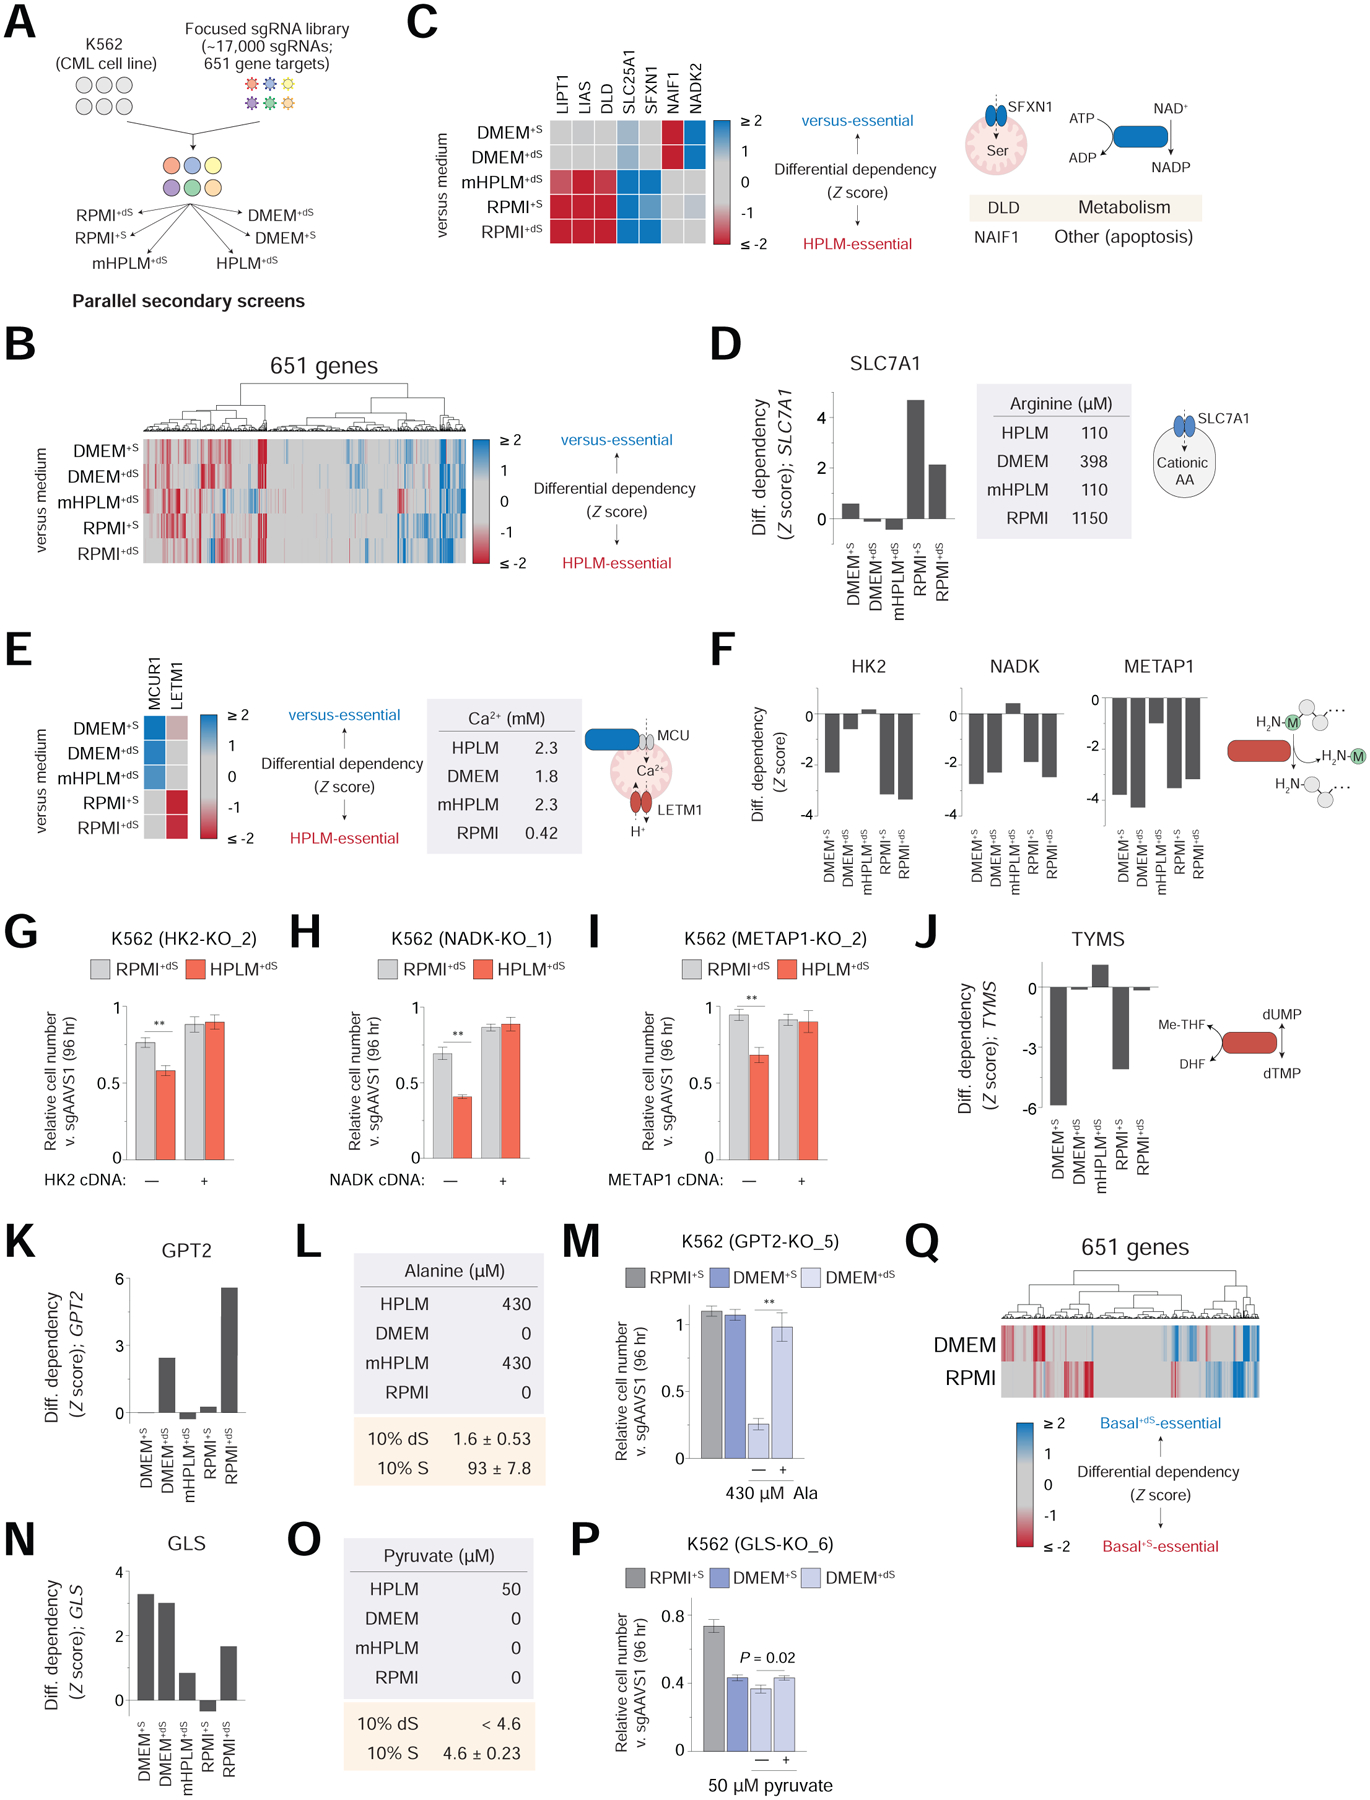
To extend our investigation into how culture medium composition affects gene essentiality, we considered the frequency of specific basal and serum components used across most CRISPR screens from DepMap, and then used our focused library to screen the K562 line in 6 conditions: (1) RPMI+dS; (2) RPMI+S; (3) DMEM+dS, 5 mM glucose; (4) DMEM+S, 5 mM glucose; (5) HPLM+dS; and (6) mHPLM+dS, a minimal HPLM-based medium with only the following components defined: salts, glucose, vitamins, and amino acids (Figure 6A, Tables S3 and S5). Interestingly, screens within this set were most highly correlated with those in conditions containing the same basal medium (Figure S6A). Of note, screens in RPMI+dS and HPLM+dS served as the replicates to establish our pooled secondary K562 screen datasets.
Figure 6. Basal and serum components of complete culture media affect gene essentiality.
See also Figures S6 and Table S3
(A) Schematic for focused library K562 screens in six different conditions.
(B) Cluster map showing conditional phenotypes versus HPLM+dS. Data for screens in RPMI+dS and HPLM+dS are from pooled replicates in panels B-F; J-K; N; and Q. Differential dependencies were determined as HPLM+dS – “versus medium”.
(C) Heatmap of HPLM-relative phenotypes for the indicated genes (left). SFXN1 is a mitochondrial serine transporter; reaction catalyzed by NADK2; manually curated processes for DLD and NAIF1 (right). Remaining genes highlighted in Figure 2.
(D) HPLM-relative phenotypes for SLC7A1.
(E) Heatmap of HPLM-relative phenotypes for MCUR1 and LETM1 (left). LETM1 is a mitochondrial H+/Ca2+ antiporter and MCUR1 is a regulator of the MCU, mitochondrial Ca2+ uniporter (right).
(F) HPLM-relative phenotypes for HK2 (left), NADK (middle), and METAP1 (right).
(G-I) Relative growth of HK2-knockout (G), NADK-knockout (H), and METAP1-knockout versus control K562 cells (mean ± SD, n = 3, **P < 0.005).
(J-K) HPLM-relative phenotypes for TYMS (J) and GPT2 (K).
(L) Defined alanine levels in each basal medium (top). Concentrations of alanine in 10% FBS (dS, dialyzed; S, untreated) as determined by metabolite profiling of RPMI+dS and RPMI+S (mean ± SD, n = 3).
(M) Relative growth of GPT2-knockout versus control cells (mean ± SD, n = 3, **P < 0.005).
(N) HPLM-relative phenotypes for GLS.
(O) Defined pyruvate levels in each basal medium (top). Concentrations of pyruvate in 10% FBS (dS, dialyzed; S, untreated) as determined by metabolite profiling of RPMI+dS and RPMI+S (mean ± SD, n = 3). Pyruvate could not be detected in RPMI+dS by the metabolite profiling method.
(P) Relative growth of GLS-knockout versus control cells (mean ± SD, n = 3).
(Q) Cluster map showing differential dependencies calculated as DMEM+S – DMEM+dS (top row) and RPMI+S – RPMI+dS (bottom row).
Next, we standardized differential gene scores between HPLM+dS and each of the other five conditions. Overall, the sets of HPLM-essential (negative) and “versus”-essential (positive) genes in the five comparisons showed variable degrees of overlap (Figure 6B). For example, ACLY was a positive hit in each case, again likely given that only HPLM contains defined acetate (Figure S6B). By contrast, the nucleoside diphosphate kinase NME6 was a negative hit in all five cases, though the underlying cause for this is not immediately apparent (Figure S6C).
Other hit genes were specific to either non-DMEM (DLD and SFXN1) or DMEM-based conditions (NADK2 and NAIF1) (Figure 6C). Additionally, SLC7A1 was a positive hit only versus the two RPMI-based media – perhaps suggestive of an increased dependence on arginine uptake in highly supraphysiologic arginine conditions specific to RPMI (Figure 6D). Similarly, conditional CRISPR phenotypes for genes involved in Ca2+ transport (LETM1 and MCUR1) might be linked to the sub-physiologic Ca2+ unique to RPMI versus HPLM and DMEM (Figure 6E).
Our analysis also revealed hits shared among all conditions except mHPLM+dS, suggesting causes for conditional essentiality that may be traced to differences among the amino acids and salt ions in HPLM versus DMEM and RPMI (Figure S6D). Among these hits were HK2, NADK, and an isoform of methionine aminopeptidase (METAP1) (Figure 6F). After generating knockout cells and sgRNA-resistant cDNAs for these three genes, we validated their HPLM-essential phenotypes by comparing short-term growth assays in HPLM+dS and RPMI+dS – though the gene-nutrient interactions that explain these hits remain unknown (Figures 6G, 6H, 6I, S6E, S6F, and S6G). Additionally, we identified TBC1D31 – a gene of unknown function – as a negative hit only versus mHPLM+dS, suggesting that its conditional essentiality further depends on the physiologic availability of certain amino acids and/or salt ions (Figure S6H).
Interestingly, thymidylate synthase (TYMS) was HPLM-essential versus only RPMI+S and DMEM+S, suggesting that untreated FBS might provide an otherwise undefined component that supports pyrimidine synthesis (Figure 6J). Further, although genes involved in UFMylation were HPLM-relative hits versus RPMI+dS (positive) and DMEM+dS (negative), these effects were largely diminished in comparison to counterpart media with untreated FBS, again demonstrating that the typically unaccounted contents in serum can affect CRISPR phenotypes (Figure S6I).
We then asked if conditional essentiality patterns for GPT2 and GLS were consistent with the gene-nutrient interactions elucidated above. GPT2 was a strongly positive hit relative only to RPMI+dS and DMEM+dS (Figures 6K and S6J). Although alanine is not defined in either RPMI or DMEM, 10% untreated versus dialyzed FBS provides over 50-fold more alanine – equivalent to just less than 4-fold that defined in HPLM (Figure 6L). Consistent with these data, GPT2-knockout cells did not exhibit a growth impairment in either RPMI+S or DMEM+S, indicating that the sub-physiologic alanine in these media was sufficient to complement GPT2 deletion; and as expected, these cells did show a growth defect in DMEM+dS that could be rescued by physiologic alanine (Figure 6M). Conditional essentiality patterns for MPC1, MPC2, and AARS were largely reflective of that for GPT2 as well (Figures S6K, S6L, and S6M). Next, we found that GLS was a positive hit relative to RPMI+dS, mHPLM+dS, and each DMEM-based condition (Figures 6N and S6N). Surprisingly, however, GLS was not a hit versus RPMI+S which, like DMEM+S, contains pyruvate from 10% untreated FBS at a concentration 10-fold less than that in HPLM (Figure 6O). Consistent with these results, GLS-knockout cells exhibited growth defects that were comparable between either: (1) RPMI+S and HPLM+dS; or (2) the two DMEM-based media and RPMI+dS; and in addition, 50 μM pyruvate had only a slightly positive effect (~6%) on their growth in DMEM+dS (Figure 6P). Remarkably, these results indicate that the GLS-pyruvate interaction in K562 cells is itself context-dependent, as physiologic pyruvate was neither necessary nor sufficient to complement GLS deletion across all conditions. Of note, cystine levels in DMEM+dS and RPMI+dS were equivalent (Figure S6O).
We could also use our data to identify other genes with HPLM-relative phenotypes unique to a particular RPMI- or DMEM-based medium, including hits shared versus all conditions except DMEM+S (MTHFD1L, MTHFD2) or RPMI+S (KEAP1); and another only relative to RPMI+S (TAF10) (Figure S6P). Indeed, the overall sets of differential dependencies measured between either the two RPMI-based or two DMEM-based media showed little overlap (Figure 6Q), illustrating that FBS can have strikingly disparate effects on gene essentiality depending on the basal medium supplemented. This suggests that essentiality profiles across hundreds of human cancer cell lines have in part been influenced by the conventional media used to screen specific cells.
CONCLUSIONS
By performing CRISPR screens in HPLM versus traditional media, we demonstrate the profound impact of medium composition on gene essentiality in human cells. Sets of conditionally essential genes are involved in several cellular processes and can vary with natural cell-intrinsic heterogeneity, suggesting that forward genetic screens in HPLM should make it possible to define new targetable liabilities in diverse human cancers.
Here, we identify strong conditional CRISPR phenotypes for GPT2 and genes that encode the MPC. We traced these effects to alanine, one of the three GPT reaction components uniquely defined in HPLM versus both RPMI and DMEM. By mediating de novo production of alanine from mitochondrial pyruvate imported via the MPC, we find that GPT2 supports protein synthesis in conditions of relative alanine restriction. Further, basal media are often supplemented with 10% untreated FBS, which we find can provide alanine at sub-physiologic levels that are nonetheless sufficient to complement loss of GPT2, thus clarifying why most CRISPR screens in conventional media have masked the identification of GPT2 as a cell-essential gene.
We also identify GLS as a cell-specific medium-essential gene. By using an unbiased approach, we systematically traced this effect to pyruvate – another HPLM component otherwise undefined in RPMI and DMEM. Our results suggest that the GLS-pyruvate interaction is linked to αKG synthesis, one of the many potential fates for (GLS-mediated) glutamate. Notably, however, we find that conditional CRISPR phenotypes for GLS in K562 cells cannot be solely explained by pyruvate availability, highlighting the complexity of context-dependent GLS essentiality in human cancers. Efforts to uncover the causes for most conditional CRISPR phenotypes in our screens, including those of three HPLM-essential hits that we validated (HK2, NADK, and METAP1), may require similar unbiased strategies. Of note, these three genes are co-expressed with functional homologs in many human cancer cell lines, and NADK has not been annotated as cell-essential in any of the CRISPR screens from DepMap.
Medium composition is a relatively flexible and accessible environmental factor among those that can influence gene essentiality. These attributes should make it possible to examine how the genetic drivers of various phenotypes (e.g., growth, cell state, drug response) might differ with nutrient availability, such as by using HPLM derivatives or media designed to more closely reflect other biofluids (Cantor, 2019). We also provide evidence that gene-nutrient interactions can be phenocopied as drug-nutrient interactions. This raises the interesting possibility that conditional essentiality profiles can be leveraged to develop new cancer treatment strategies that combine targeted therapies with either dietary or enzyme-mediated manipulation of circulating metabolites. Notably, several clinical and preclinical enzymes can mediate the systemic depletion of certain metabolites (Cantor and Sabatini, 2012; Cantor et al., 2012; Cramer et al., 2017; Lu et al., 2020; Patgiri et al., 2020), and dietary interventions designed to alter the availability of specific nutrients can affect cancer growth and drug efficacy (Kanarek et al., 2020).
Limitations of Study
First, while several vitamins are among the Eagle-defined nutrients required for the growth of mammalian cells in culture (Eagle, 1955), most have sub-micromolar concentrations in human blood and thus failed to meet certain inclusion criteria set in our initial design of HPLM (Cantor et al., 2017; Wishart et al., 2017). Nonetheless, rather than omit these essential nutrients, we have used a commercial mixture to incorporate vitamins into HPLM at RPMI-defined concentrations (See STAR Methods). Thus, we would expect that vitamin availability could not explain any screen hits in HPLM- versus RPMI-based media. However, when we measure metabolites in HPLM+dS and RPMI+dS, we typically observe a few discrepancies among the vitamins that, in turn, might have contributed to our identification of certain screen hits (Cantor et al., 2017; Table S6). Since a number of culture-essential vitamins are also unstable (Sigma-Aldrich Media Expert; Online Resource), methods that permit the small-scale preparation and feasible incorporation of physiologic vitamins into basal media should be a key future objective.
KEY RESOURCES TABLE
| REAGENT or RESOURCE | SOURCE | IDENTIFIER |
|---|---|---|
| Antibodies | ||
| Mouse monoclonal anti-GAPDH (0411) | Santa Cruz Biotechnology | Cat #: sc-47724; RRID: AB_627678 |
| Rabbit polyclonal anti-RAPTOR | EMD Millipore | Cat #: 09-217; RRID: AB_612103 |
| Rabbit monoclonal anti-GLS (6H5L15) | Thermo Fisher | Cat #: 701965; RRID: AB_2633041 |
| Mouse monoclonal anti-GPT (E-3) | Santa Cruz Biotechnology | Cat #: sc-374501; RRID: AB_10987666 |
| Mouse monoclonal anti-GPT2 (G-7) | Santa Cruz Biotechnology | Cat #: sc-398383; RRID: N/A |
| Rabbit monoclonal anti-MPC2 (D417G) | Cell Signaling Technology | Cat #: 46141; RRID: AB_2799295 |
| Rabbit monoclonal anti-HK2 (C64G5) | Cell Signaling Technology | Cat #: 2867; RRID: AB_2232946 |
| Rabbit polyclonal anti-NADK (55948) | Cell Signaling Technology | Cat #: 55948; RRID: AB_2799500 |
| Mouse monoclonal anti-METAP1 (A-2) | Santa Cruz Biotechnology | Cat #: sc-514653; RRID: N/A |
| Horse anti-Mouse IgG HRP | Cell Signaling Technology | Cat #: 7076; RRID: AB_330924 |
| Goat anti-Rabbit IgG HRP | Cell Signaling Technology | Cat #: 7074 RRID: AB_2099233 |
| Bacterial and Virus Strains | ||
| Endura ElectroCompetent Cells | Lucigen | Cat #: 60242 |
| XL10-Gold Ultracompetent Cells | Agilent | Cat #: 200315 |
| Biological Samples | ||
| Chemicals, Peptides, and Recombinant Proteins | ||
| 3X FLAG Peptide | Sigma-Aldrich | Cat #: F4799 |
| Anti-FLAG M2 Affinity Gel | Sigma-Aldrich | Cat #: A2220 |
| Mixture of amino acid standards for metabolomics | Cambridge Isotope Laboratories | Cat #: MSK-A2-1.2 |
| Defined metabolite components of HPLM | Multiple | See Table S5 |
| Sodium Pyruvate | Sigma-Aldrich | Cat #: P2256 |
| l-Glutamic acid | Sigma-Aldrich | Cat #: G1251 |
| α-Ketoglutaric acid disodium salt dihydrate | Sigma-Aldrich | Cat #: 75892 |
| Pyridoxal 5’-phosphate hydrate | Sigma-Aldrich | Cat #: P9255 |
| d-glucose (U-13C6, 99%) | Cambridge Isotope Laboratories | Cat #: CLM-1396 |
| l-Alanine (13C3, 99%) | Cambridge Isotope Laboratories | Cat #: CLM-2184 |
| RPMI 1640 100X Vitamins | Sigma-Aldrich | Cat #: R7256 |
| l-Alanine | Sigma-Aldrich | Cat #: A7627 |
| Dimethyl a-ketoglutarate | Sigma-Aldrich | Cat #: 349631 |
| Dimethyl malate | Sigma-Aldrich | Cat #: 374318 |
| Dimethyl succinate | Sigma-Aldrich | Cat #: W239607 |
| CB-839 | Sigma-Aldrich | Cat #: 5337170001 |
| RPMI 1640, no glucose | Thermo Fisher | Cat #: 11879020 |
| RPMI 1640 | Thermo Fisher | Cat #: 11875093 |
| DMEM, no glucose | Thermo Fisher | Cat #: 11966025 |
| DMEM, high glucose, GlutaMAX | Thermo Fisher | Cat #: 10566024 |
| Glucose | Thermo Fisher | Cat #: 15023021 |
| Penicillin-Streptomycin | Thermo Fisher | Cat #: 15140122 |
| Fetal Bovine Serum (FBS), Heat Inactivated | Thermo Fisher | Cat #: 16140071 |
| X-tremeGENE 9 DNA Transfection Reagent | Sigma-Aldrich | Cat #: 6365779001 |
| TaKaRa Ex Taq DNA Polymerase | TaKaRa | Cat #: RR001A |
| Puromycin dihydrochloride | Sigma-Aldrich | Cat #: P7255 |
| Blasticidin (solution) | Invivogen | Cat #: ant-bl-1 |
| Critical Commercial Assays | ||
| QIAamp DNA Blood Maxi Kit | QIAGEN | Cat #: 51194 |
| QIAamp DNA Blood Midi Kit | QIAGEN | Cat #: 51183 |
| EndoFree Plasmid Maxi Kit | QIAGEN | Cat #: 12362 |
| miRNeasy Mini Kit | QIAGEN | Cat #: 217004 |
| Deposited Data | ||
| DepMap CRISPR screens; Culture conditions (sample info) | (Dempster et al., 2019; Meyers et al., 2017) DepMap, Broad 2020: DepMap 20Q1 Public |
https://depmap.org/portal/download/ |
| DepMap CRISPR screens; Probability of dependency (Achilles_gene_dependency) | (Dempster et al., 2019; Meyers et al., 2017) DepMap, Broad 2020: DepMap 20Q1 Public |
https://depmap.org/portal/download/ |
| GPT1 expression data (cancer cell lines) | (Ghandi et al., 2019) DepMap, Broad 2020: DepMap 20Q1 Public |
https://depmap.org/portal/gene/GPT?tab=characterization |
| GPT2 expression data (cancer cell lines) | (Ghandi et al., 2019) DepMap, Broad 2020: DepMap 20Q1 Public |
https://depmap.org/portal/gene/GPT2?tab=characterization |
| GPT1 and GPT2 expression data (normal human tissues) | GTEx Project | https://www.gtexportal.org/home/datasets |
| RNA-Sequencing | This paper | Table S2; GEO: GSE164693 |
| Experimental Models: Cell Lines | ||
| K562 | J.D. Griffin | ACC-10; RRID_CVCL_0004 |
| NOMO1 | J.D. Griffin | ACC-542; RRID_CVCL_1609 |
| MOLM13 | CCLE | ACC-554; RRID_CVCL_2119 |
| SUDHL4 | M.A. Shipp | ACC-495; RRID_CVCL_0539 |
| Experimental Models: Organisms/Strains | ||
| Oligonucleotides | ||
| Primers for Illumina sequencing | (Wang et al., 2017) | Table S4 |
| Primers for sgRNA quantification | This paper | Table S4 |
| Primers for Focused sgRNA Library amplification | This paper | Table S4 |
| Primers for construction of expression plasmids | This paper | Table S4 |
| Individual sgRNA target sequences | This paper | Table S4 |
| Focused sgRNA library | This paper | Table S4 |
| GPT1 gBlock | This paper | Table S4 |
| GLS gBlock | This paper | Table S4 |
| NADK gBlock | This paper | Table S4 |
| Recombinant DNA | ||
| pLJC2-Rap2A-3xFLAG | (Cantor et al., 2017) | Addgene 87974 |
| pLJC5-Rap2A-3xFLAG | This paper | Addgene 163444 |
| pLJC6-Rap2A-3xFLAG | This paper | Addgene 163445 |
| pLJC2-GPT 1-3xFLAG | This paper | Addgene 163446 |
| pLJC2-GPT2-3xFLAG | This paper | Addgene 163447 |
| pLJC6-GPT1-3xFLAG | This paper | Addgene 163448 |
| pLJC6-GPT2-3xFLAG | This paper | Addgene 163449 |
| pLJC6-GLS-3xFLAG | This paper | Addgene 163450 |
| pLJC6-HK2-3xFLAG | This paper | Addgene 163451 |
| pLJC6-NADK-3xFLAG | This paper | Addgene 163452 |
| pLJC6-METAP1-3xFLAG | This paper | Addgene 163453 |
| pLJC6-EV | This paper | Addgene 163454 |
| pLentiCRISPR-v1 | Addgene | Addgene 49535 |
| Genome-wide human sgRNA library | (Wang et al., 2017) | N/A |
| Focused sgRNA library | This paper | N/A |
| pLentiCRISPR-v1-sgAAVS1 | (Wang et al., 2015) | Addgene 70661 |
| pLentiCRISPR-v1-sgGPT2_5 | This paper | Addgene 163455 |
| pLentiCRISPR-v1-sgGPT2_9 | This paper | Addgene 163456 |
| pLentiCRISPR-v1-sgMPC2_7 | This paper | Addgene 163457 |
| pLentiCRISPR-v1-sgMPC2_9 | This paper | Addgene 163458 |
| pLentiCRISPR-v1-sgGLS_2 | This paper | Addgene 163459 |
| pLentiCRISPR-v1-sgGLS_6 | This paper | Addgene 163460 |
| pLentiCRISPR-v1-sgHK2_2 | This paper | Addgene 163461 |
| pLentiCRISPR-v1-sgNADK_1 | This paper | Addgene 163462 |
| pLentiCRISPR-v1-sgMETAP1_2 | This paper | Addgene 163463 |
| Software and Algorithms | ||
| XCalibur version 4.1 | Thermo Fisher | https://www.thermofisher.com/us/en/home.html |
| R version 3.6.2 | The R Project | https://www.r-project.org/ |
| Prism version 8 | GraphPad | https://www.graphpad.com/ |
| PANTHER | (Mi et al., 2019) | http://www.pantherdb.org/ |
| DESeq2 | (Love et al., 2014) | https://bioconductor.org/packages/release/bioc/html/DESeq2.html |
| TopHat version 2.1.1 | (Kim et al., 2013) | http://ccb.jhu.edu/software/tophat/index.shtml |
| Other | ||
| SnakeSkin dialysis tubing, 3.5K MWCO, 35 mm | Thermo Fisher | Cat #: PI88244 |
| Z2 Coulter Counter | Beckman | Cat #: 6605700 |
Second, since we chose to normalize the glucose availability (5 mM) across each of our screening conditions, we note that if we had used RPMI- and DMEM-based media containing the supraphysiologic glucose defined otherwise in conventional recipes of both RPMI (11.1 mM) and DMEM (25 mM), we might have uncovered medium-essential genes linked to glucose as well.
Finally, while we provide evidence that cell-intrinsic factors can influence conditional gene essentiality, we only used a focused library to screen three cell lines in our panel. This limitation could be addressed by future efforts to more broadly define genome-wide genetic dependencies in HPLM versus traditional media.
RESOURCE AVAILABILITY
Lead Contact
Further information and requests for resources and reagents should be directed to and will be fulfilled by the Lead Contact, Jason R. Cantor (jcantor@morgridge.org)
Materials Availability
The individual gene knockout and expression plasmids generated in this study are deposited in Addgene (identifiers annotated in the Key Resources Table).
Data and Code Availability
Datasets can be found in Tables S1, S2, S3, and S6. RNA-Seq data generated in this study is available in the Gene Expression Omnibus (GEO: GSE164693).
EXPERIMENTAL MODEL AND SUBJECT DETAILS
Cell lines
The following human cell lines were kindly provided by: K562 and NOMO1, Dr. James Griffin (Dana Farber Cancer Institute); MOLM13, the Cancer Cell Line Encyclopedia (Broad Institute); and SUDHL4, Dr. Margaret Shipp (Dana Farber Cancer Institute). Cell lines were verified to be free of mycoplasma contamination (Freshney, 2010) and their identities were authenticated by STR profiling.
Cell culture conditions
The following culture media were used in this study (all contained 0.5% penicillin-streptomycin):
(1) RPMI+S: RPMI 1640, no glucose (Thermo Fisher) with 5 mM glucose and 10% FBS.
(2) RPMI+dS: RPMI 1640, no glucose (Thermo Fisher) with 5 mM glucose and 10% dialyzed FBS.
(3) RPMI11+S: RPMI 1640 (Thermo Fisher) with 10% FBS.
(4) RPMI11+2S: RPMI 1640 (Thermo Fisher) with 20% FBS.
(5) DMEM+S: DMEM, no glucose (Thermo Fisher) with 5 mM glucose and 10% FBS.
(6) DMEM+dS: DMEM, no glucose (Thermo Fisher) with 5 mM glucose and 10% dialyzed FBS.
(7) DMEM25+S: DMEM, high glucose, GlutaMAX (Thermo Fisher) with 10% FBS.
(8) DMEM25+2S: DMEM, high glucose, GlutaMAX (Thermo Fisher) with 20% FBS.
(9) HPLM+dS: HPLM (See Table S5) with 10% dialyzed FBS and using RPMI 1640 100X Vitamins (Sigma-Aldrich R7256). Relative to the initially reported formulation (Cantor et al., 2017), HPLM was prepared with four additional components: α-KG, O-Acetylcarnitine, Malate, and Uridine.
(10) mHPLM+dS: minimal HPLM (See Table S5) with 10% dialyzed FBS and using RPMI 1640 100X Vitamins (Sigma-Aldrich R7256).
By using SnakeSkin tubing (Thermo Fisher PI88244), FBS was dialyzed as previously described (Cantor et al., 2017). Prior to use, all media were sterile filtered using bottle-top vacuum filters with cellulose acetate membrane, pore size 0.22 μm (Corning 430626). All cells were maintained at 37°C, atmospheric oxygen, and 5% CO2.
METHOD DETAILS
Genome-wide CRISPR screens
For genome-wide screens in K562 cells, the human sgRNA library described in (Wang et al., 2015, 2017) was used. To achieve at least 1000-fold coverage of the library following antibiotic selection, 350 million K562 cells were seeded at a density of 2.5 × 10⁶ cells/mL in 6-well plates containing 2 mL of RPMI+S, 8 μg/mL polybrene, and the pLentiCRISPR-v1 library virus. Spin infection was carried out by centrifugation at 2,200 RPM for 45 min at 37°C. After 18 hr incubation, the cells were pelleted to remove virus and then re-seeded into fresh RPMI+S for 24 hr. Cells were then pelleted and re-seeded to a density of 150,000 cells/mL in RPMI+S containing 2 μg/mL puromycin (Sigma-Aldrich) for 72 hr. Following selection, an initial pool of 100 million cells was pelleted and frozen, and pools of 216 million cells were used to collectively seed each of twelve total 225 cm2 rectangular canted neck cell culture flasks (Corning 431082) to a density of 150,000 cells/mL in 120 mL of either HPLM+dS or RPMI+dS, respectively. Cells were passaged every 48 hr and population doublings were tracked by cell density measurements using a Coulter Counter (Beckman Z2) with a diameter setting of 8–30 μm. After 13 population doublings, a pool of 100 million cells from each screen was harvested for genomic DNA (gDNA) extraction using the QIAamp DNA Blood Maxi Kit (QIAGEN).
Using Ex Taq DNA Polymerase (Takara), sgRNA inserts from each initial and final pool were PCR-amplified from 290 μg of gDNA to achieve ~400-fold coverage of the library. The resulting PCR products were purified and sequenced on a HiSeq 2500 (Illumina) (Primer sequences are annotated in Table S4) to quantify sgRNA abundances in each sample.
RNA sequencing
Following at least two passages in the medium of interest, K562 cells were pelleted and then seeded at a density of 200,000 cells/mL in 6 cm culture dishes containing 6 mL fresh medium. After 24 hr incubation, RNA was harvested using the miRNeasy Mini Kit (QIAGEN) according to manufacturer instructions. 700 ng total RNA was used to generate mRNA libraries using the TruSeq Stranded mRNA Library Preparation Kit (Illumina 20020594). Libraries prepared from each sample were quantified using the KAPA Library Quantification Kit (Roche KK4824) and then pooled at equimolar ratios. Following denaturation, 40 bp single-end reads were generated on a HiSeq 2500 (Illumina). Base calls were performed by the instrument control software and further processed using the Offline Base Caller version 1.9.4 (Illumina), and quality control analysis was performed using the FastQC program (Babraham Bioinformatics).
Reads were aligned to the human genome (GRCh37) with Ensembl annotation v. 75 using Tophat version 2.1.1 (parameters ‘--no-novel-juncs’ and ‘--segment-length’ of 20) (Kim et al., 2013). Across all samples, the overall mapping rate was 91.6% (average) and 79.1% (average) of the reads aligned uniquely. Based on two biological replicates for each condition, read counts were quantified at the gene level and normalized using the geometric means method implemented in the DESeq2 v1.10 package (Love et al., 2014).
Focused sgRNA library construction
To design the focused sgRNA library, each of 212 HPLM- and 182 RPMI-essential hit genes that collectively span a number of manually curated biological processes were first selected from the genome-wide screen results. An additional 257 genes related to these hits through either a shared pathway, gene family, or encoded protein complex were then further selected for inclusion (Table S3). The focused sgRNA library contained 16,585 constructs targeting 651 total protein-coding genes (up to 25 sgRNAs per gene) and 325 non-targeting sgRNAs. An oligonucleotide pool for the library was synthesized (Agilent), PCR-amplified according to manufacturer instructions using the primers JC842/JC843 to incorporate overhangs compatible for Gibson Assembly (New England Biolabs), and cloned into BsmBI-digested pLentiCRISPR-v1. Reaction products were transformed into E. coli Endura electrocompetent cells (Lucigen), plated onto prewarmed LB medium/agar containing 100 μg/mL ampicillin in a 245 mm square bioassay dish (Corning 431111), and incubated for 18 hr at 30°C, yielding ~107 individual transformants – equivalent to ~500-fold coverage of the theoretical library diversity. Colonies were scraped and pooled in LB medium, and plasmid DNA was then extracted using an EndoFree Maxi Kit (QIAGEN).
Secondary CRISPR screens
The focused library screening procedure was similar to that used for the genome-wide screens with minor modifications.
To achieve at least 1000-fold coverage of the library following antibiotic selection in each cell line, 60 million cells were transduced with virus.
For selection of the remaining transduced cell lines, puromycin was used at the following concentrations: NOMO1 (0.5 μg/mL), MOLM13 (1 μg/mL), and SUDHL4 (0.5 μg/mL).
To initiate and maintain each screen, 18 million cells were seeded in single flasks to the same density (150,000 cells/mL) and in the same volume (120 mL) of culture medium.
To harvest gDNA from each pool, 10 million cells were extracted using the QIAamp DNA Blood Midi Kit (QIAGEN).
For each extraction, sgRNA inserts were PCR-amplified from 24 μg of gDNA
Plasmid construction
All oligonucleotides and gBlock Gene Fragments used in this study are described in Table S4.
Construction of lentiviral plasmids pLJC5-Rap2A-3xFLAG and pLJC6-Rap2A-3xFLAG
The human ubiquitin C (UbC) promoter was amplified from the pLenti6/UbC/V5-DEST Gateway vector (Thermo Fisher V49910) using the primers JC419/JC420, digested with ClaI-AgeI, and then cloned into pLJC2-Rap2A-3xFLAG to generate pLJC5-Rap2A-3xFLAG. The blasticidin resistance cassette was amplified from the pMXs-IRES-blasticidin retroviral vector (Cell Biolabs RTV-016) using the primers JC606/JC607, digested with BamHI-KpnI, and cloned into pLJC5-Rap2A-3xFLAG to generate pLJC6-Rap2A-3xFLAG.
Construction of gene knockout plasmids
For each of the following genes, sense and antisense oligonucleotides were annealed and then cloned into BsmBI-digested pLentiCRISPR-v1: GPT2, MPC2, GLS, HK2, NADK, and METAP1.
Construction of expression plasmids
The GPT2 gene was amplified using the primers GPT2-F/GPT2-R, digested with PacI-NotI, and cloned into pLJC2-Rap2A-3xFLAG to generate pLJC2-GPT2-3xFLAG. GPT2-F was designed to remove a GPT2-internal NotI site and to reduce the GC content at the 5’ terminus of the gene. Plasmid pLJC6-GPT2-3xFLAG contains a sgGPT2_5-resistant GPT2 cDNA and was generated using a 2-step protocol based on overlap extension PCR methodology. In the first step, two fragments were amplified from pLJC2-GPT2-3xFLAG by using the following primer pairs: LJCF/GPT2_5-R and GPT2_5-F/LJC-R. In the second step, the two fragments were pooled in a second PCR containing the primers LJC-F/LJC-R, then digested with PacI-NotI, and cloned into pLJC6-Rap2A-3xFLAG. The same 2-step protocol was used to generate plasmids pLJC6-HK2-3xFLAG and pLJC6-METAP1-3xFLAG, which contain a sgHK2_2-resistant-HK2 cDNA and a sgMETAP1_2 METAP cDNA, respectively. For pLJC6-HK2-3xFLAG, the following internal primers were used: HK2_2-F and HK2_2-R. For pLJC6-METAP1-3xFLAG, the following internal primers were used: METAP1_2-F and METAP1_2-R.
The GPT1 gene was amplified from a codon-optimized gBlock Gene Fragment (IDT) using the primers GPT1-F/GPT1-R, digested with PacI-NotI, cloned into pLJC2-Rap2A-3xFLAG to generate pLJC2-GPT1-3xFLAG, and then subcloned into pLJC6-Rap2A-3xFLAG to generate pLJC6-GPT1-3xFLAG as well. The GLS gene was amplified from a codon-optimized gBlock Gene Fragment (IDT) using the primers GLS-F/GLS-R, digested with PacI-NotI, and cloned into pLJC6-Rap2A-3xFLAG to generate pLJC6-GLS-3xFLAG, which contains a sgGLS_6-resistant GLS cDNA. The NADK gene was amplified from a codon-optimized gBlock Gene Fragment (IDT) using the primers NADK-F/NADK-R, digested with PacI-NotI, and cloned into pLJC6-Rap2A-3xFLAG to generate pLJC6-NADK-3xFLAG, which contains a sgNADK_1-resistant NADK cDNA.
To create an empty vector (EV) derivative of pLJC6, oligonucleotides JC1145 and JC1146 were annealed and cloned into pLJC6-Rap2A-3xFLAG at PacI-NotI to generate pLJC6-EV.
Lentivirus production
To produce lentivirus, HEK293T cells in DMEM25+S were co-transfected with the VSV-G envelope plasmid, the Delta-VPR packaging plasmid, and the appropriate transfer plasmid (either a pLJC6 or pLentiCRISPR-v1 backbone) using X-tremeGENE 9 Transfection Reagent (Sigma-Aldrich). Culture medium was exchanged with fresh DMEM25+2S 16 hr after transfection, and the virus-containing supernatant was collected at 48 hr post-transfection, passed through a 0.45 μm filter to eliminate cells, and then stored at −80°C.
Cell line construction
Knockout cell lines
To establish knockout clonal cell lines, K562 cells were seeded at a density of 500,000 cells/mL in 6-well plates containing 2 mL RPMI11+S, 8 μg/mL polybrene, and the pLentiCRISPR-v1 lentivirus of interest. Spin infection was carried out by centrifugation at 2,200 RPM for 45 min at 37°C. After 16–18 hr incubation, the cells were pelleted to remove virus and then re-seeded into fresh RPMI11+S for 24 hr. Cells were then pelleted and re-seeded into fresh RPMI11+S containing puromycin (Sigma-Aldrich) for 72 hr and, following selection, were single-cell FACS-sorted into 96-well plates containing RPMI11+2S. After 1.5–2 weeks, cell clones with the desired knockouts were identified by immunoblotting. To control for infection with pLentiCRISPR-v1 virus, a control population of K562 cells was similarly selected following transduction with sgAAVS1-containing virus (Wang et al., 2015).
cDNA expression cell lines
To establish stable expression cell lines, K562 clonal cells were seeded at a density of 175,000 cells/mL in 6-well plates containing 2 mL of RPMI11+S, 8 μg/mL polybrene, and the pLJC6 lentivirus of interest. Spin infection and initial medium exchange were each performed identically as described above for knockout cell lines. Cells were then pelleted and re-seeded into fresh RPMI11+S containing blasticidin (Invivogen) for 72 hr. Stable cDNA expression of cDNA was confirmed by immunoblotting.
Cell lysis for immunoblotting
Cells were centrifuged at 250 g for 5 min, resuspended in 1 mL ice-cold PBS, and then centrifuged again at 250 g for 5 min at 4°C. Cells were then immediately lysed with ice-cold lysis buffer (40 mM Tris-HCl pH 7.4, 1% Triton X-100, 100 mM NaCl, 5 mM MgCl2, 1 tablet of EDTA-free protease inhibitor (Roche 11580800; per 25 mL buffer), 1 tablet of PhosStop phosphatase inhibitor (Roche 04906845001; per 10 mL buffer). The cell lysates were cleared by centrifugation at 21130 g for 10 min at 4°C and then quantified for protein concentration using an albumin standard (Thermo Fisher 23209) and Bradford reagent (Bio-Rad 5000006). Cell lysate samples were normalized for protein content, denatured upon the addition of 5X sample buffer (Thermo Fisher 39000), resolved by 12% SDS-PAGE, and transferred to a polyvinyl difluoride membrane (Millipore IPVH07850). Membranes were blocked with 5% nonfat dry milk in TBST for 1 hr at room temperature, and then incubated with primary antibodies in 5% nonfat dry milk in TBST overnight at 4°C. Primary antibodies to the following proteins were used at the indicated dilutions: GAPDH (1:1000); RAPTOR (1:1000); GPT1 (1:100); GPT2 (1:100); MPC2 (1:100); GLS (1:100); HK2 (1:1000); NADK (1:300); and METAP1 (1:200). Membranes were washed with TBST three times for 5 min each, and then incubated with species-specific HRP-conjugated secondary antibody (1:3000) in 5% nonfat dry milk for 1 hr at room temperature. Membranes were washed again with TBST three times for 5 min each, and then visualized with chemiluminescent substrate (Thermo Fisher) on a LICOR Odyssey FC.
Short-term growth assays
Following at least two passages in RPMI+S, cells were pelleted and resuspended to a density of 1 million cells/mL in RPMI+S. From each resuspension, 80,000 total cells were seeded in each of three replicate wells containing 4 mL of the appropriate culture medium in 6-well plates. Following 96 hr incubation, cell density measurements were recorded using a Coulter Counter (Beckman Z2) with a diameter setting of 8–30 μm. Stock solutions of the following components were prepared relative to working concentrations in HPLM: L-Alanine (500X), αKG (1000X), 2-hydroxybutyrate, 3-hydroxybutyrate, malonate (250X), citrate (250X), malate (1000X), succinate (1000X), acetate (500X), lactate (100X), and pyruvate (250X). In addition, stock solutions of dimethyl αKG, dimethyl malate, and dimethyl succinate were each prepared at 100 mM in water.
Drug treatments
The short-term growth assay procedure was identical to that above with minor modifications.
Following 1 hr incubation of seeded 6-well plates, cells were treated with CB-839 (Sigma-Aldrich 5337170001) (50 nM or 500 nM) and all plates were gently shaken for 2 min.
All wells, including untreated controls, contained 0.25% DMSO.
The stock solution of CB-839 was prepared at 20 mM in DMSO.
Metabolite Profiling and Quantification of Metabolite Abundance
LC-MS analyses were performed on a QExactive HF benchtop orbitrap mass spectrometer equipped with an Ion Max API source and HESI II probe, which was coupled to a Vanquish Horizon UPLC system (Thermo Fisher). External mass calibration was performed using positive and negative polarity standard calibration mixtures every 7 days. Acetonitrile was hypergrade for LC-MS (Millipore Sigma) and all other solvents were Optima LC-MS grade (Thermo Fisher).
Cells
Following at least two passages in RPMI+S, cells were pelleted, resuspended in fresh medium of interest, and then seeded in a volume of 4 mL per well at a density of 125,000 cells/mL in 6-well plates. For labeling experiments, the procedure was identical except that RPMI+dS containing either 5 mM [U-13C]-glucose or 430 μM 13C3-alanine was used. After 24 hr incubation, a 500 μL aliquot was used to measure cell number and volume via Coulter Counter (Beckman Z2) with a diameter setting of 8–30 μm, and the remaining cells were then centrifuged at 250 g for 5 min, resuspended in 1 mL ice-cold 0.9% sterile NaCl (Growcells MSDW1000), and again centrifuged at 250 g for 5 min at 4°C. Metabolites were extracted in 1 mL ice-cold 80% methanol containing 500 nM internal amino acid standards (Cambridge Isotope Laboratories). Following a 10 min vortex and centrifugation for 3 min at 21130 g for 10 min at 4°C, samples were dried under nitrogen gas. Dried samples were stored at −80°C and then resuspended in 100 μL water. Following a 10 min vortex and centrifugation at 21130 g for 10 min at 4°C, 2.5 μL from each cell sample was injected onto a ZIC-pHILIC 2.1 × 150 mm analytical column equipped with a 2.1 × 20 mm guard column (both 5 μm particle size, Millipore Sigma). Buffer A was 20 mM ammonium carbonate, 40 mM ammonium hydroxide; buffer B was acetonitrile. The chromatographic gradient was run at a flow rate of 0.15 mL/min as follows: 0–20 min: linear gradient from 80% to 20% B; 20–20.5 min: linear gradient from 20% to 80% B; 20.5–28 min: hold at 80% B.
The mass spectrometer was operated in full scan, polarity-switching mode with the spray voltage set to 3.0 kV, the heated capillary held at 275°C, and the HESI probe held at 350°C. The sheath gas flow rate was set to 40 units, the auxiliary gas flow was set to 15 units, and the sweep gas flow was set to 1 unit. The MS data acquisition in positive mode was performed in a range of 50–750 m/z, with the resolution set to 120,000, the AGC target at 106, and the maximum integration time at 20 msec. The settings in negative mode were the same except that the range was instead 70–1000 m/z.
Media
To extract metabolites from cell culture media, samples were diluted 1:40 in a solution of 50:30:20 methanol:acetonitrile:water containing 500 nM internal amino acid standards (Cambridge Isotope Laboratories). Following a 10 min vortex and centrifugation at 21130 g for 5 min at 4°C, 2.5 μL of each sample was injected for LC-MS analysis as described above for profiling cell samples.
GPT activity assay
For detection of αKG generated in GPT activity assays, reaction mixtures were extracted (See GPT Activity Assay) and 5 μL was injected onto a ZIC-pHILIC 2.1 × 150 mm analytical column equipped with a 2.1 × 20 mm guard column (both 5 μm particle size, Millipore Sigma). Buffer A was 20 mM ammonium carbonate, 40 mM ammonium hydroxide; buffer B was acetonitrile. The chromatographic gradient was run at a flow rate of 0.15 mL/min as follows: 0–10 min: linear gradient from 80% to 20% B; 10–10.5 min: linear gradient from 20% to 80% B; 10.5–16.5 min: hold at 80% B. The mass spectrometer was operated in full scan, polarity-switching mode with the spray voltage set to 3.5 kV (positive mode) and 2.5 kV (negative mode), the heated capillary held at 275°C, and the HESI probe held at 350°C. The sheath gas flow rate was set to 40 units, the auxiliary gas flow was set to 10 units, and the sweep gas flow was set to 1 unit. The MS data acquisition in negative mode was performed in a range of 70–1050 m/z, with the resolution set to 120,000, the AGC target at 106, and the maximum integration time at 200 msec.
Highly Targeted Metabolomics
For the highly targeted analysis of pyruvate in whole-cell samples without nutrient labeling, the instrument was run as described (See Cells), but with additional tSIM (targeted selected ion monitoring) scans in negative ionization mode. The tSIM settings were as follows: resolution set to 120,000, an AGC target of 105, and a maximum integration time of 200 msec. The target mass was 87.0088 (corresponding to pyruvate) and the isolation window was set to 1.0 m/z.
For αKG and pyruvate in culture media samples, all settings as described for the tSIM scan used for cell samples were identical, except that the target mass 145.0142 (corresponding to αKG) was added. For pyruvate and M+3-pyruvate in cell samples with nutrient labeling, all settings were again identical, except that the target mass 90.01887 (corresponding to M+3-pyruvate) was added.
For αKG in GPT activity assay samples, all settings as described for the tSIM scan used for αKG in media were identical except that the maximum integration time was 400 msec. For pyruvate in the same samples, all settings as described for the tSIM scan used for pyruvate were identical. Finally, for L-Phenylalanine (13C9, 99%; 15N, 99%) in the same samples, all settings as described for the tSIM scan used for whole-cell metabolites were identical except that the scan was run in positive ionization mode, and the target mass 176.1135 was added.
Identification and Quantification
Metabolite identification and quantification were performed with XCalibur version 4.1 (Thermo Fisher) using a 10-ppm mass accuracy window and 0.5 min retention time window. To confirm metabolite identities and to enable quantification when desired, a manually constructed library of chemical standards was used. Standards were validated by LC-MS to confirm that they generated robust peaks at the expected m/z ratio, and stock solutions were stored in pooled format at −80°C at the following concentrations: 1 mM, 100 μM, 10 μM, and 0.1 μM. On the day of a given queue, each stock was diluted 1:10 in water containing 500 nM internal amino acid standards (Cambridge Isotope Laboratories), and then vortexed and centrifuged as described for biological samples (See Cells and Media). For those metabolites lacking a chemical standard, peak identification was restricted to high confidence peak assignments (Smith et al., 2005). See Table S6.
Because metabolite extraction protocols differed by sample type, the internal standard concentrations in processed samples varied: chemical standards (450 nM), media samples (487.5 nM), and cell samples (5 μM). Therefore, the raw peak areas of internal standards within each sample of a given batch were first normalized to account for these differences. Metabolite quantification was then performed as described elsewhere (Cantor et al., 2017).
Expression and immunoprecipitation of recombinant proteins
For isolation of recombinant GPT proteins, 4 million HEK293T cells were plated in 15 cm culture dishes containing DMEM25+S. After 24 hr incubation, cells were transfected with 15 μg of pLJC2-GPT1-3xFLAG or pLJC2-GPT2-3xFLAG as described elsewhere (Cantor et al., 2017). After an additional 48 hr incubation, cells were rinsed once with ice-cold PBS and then immediately lysed in ice-cold lysis buffer (See Cell lysis for immunoblotting). The cell lysates were cleared by centrifugation at 21130 g for 10 min at 4°C. For anti-FLAG immunoprecipitation, the FLAG-M2 affinity gel (Sigma-Aldrich) was washed three times in lysis buffer, and then 400 μL of a 50:50 affinity gel slurry was added to a pool of clarified lysates collected from five individual 15 cm culture dishes, and incubated with rotation for 3 hr at 4°C. Following immunoprecipitation, the beads were washed twice in lysis buffer and then four times with lysis buffer containing 500 mM NaCl. Recombinant protein was then eluted in lysis buffer containing 500 μg/mL 3x-FLAG peptide (Sigma-Aldrich) for 1 hr with rotation at 4°C. The eluent was isolated by centrifugation at 100 g for 4 min at 4°C (Bio-Rad 732–6204), buffer exchanged (Amicon Ultra 30 kDa MWCO UFC503024) against 20 volumes of storage buffer (40 mM Tris-HCl pH 7.5, 100 mM NaCl, 2 mM dTT, 100 μM pyridoxal 5’-phosphate (PLP)), mixed with glycerol (final concentration 15% v/v), snap-frozen with liquid nitrogen, and stored at −80°C.
Protein samples were quantified using an albumin standard (Thermo Fisher 23209) and Bradford reagent (Bio-Rad 5000006). Purified proteins were normalized for protein content, denatured upon the addition of 5X sample buffer (Thermo Fisher 39000), and resolved by 12% SDS-PAGE. Apparent molecular weights via immunoblotting were comparable to those expected, but upon loading 600-fold more purified protein, those via Coomassie staining were lower than expected, likely reflective of differences in buffer conditions in the samples.
GPT Activity Assay
To determine kinetic constants for the conversion of pyruvate and l-Glutamate (l-Glu) to l-Alanine and αKG catalyzed by each GPT, we developed an in vitro GPT activity assay. To estimate kinetic parameters for pyruvate, reactions of purified GPT (2–4 nM enzyme) with fixed l-Glu (2.5 mM) and varying concentrations of pyruvate were carried out at 37°C in 40 mM Tris-HCl pH 7.5, 5 mM MgCl2, 5 mM Na2HPO4, 2 mM dTT, 500 μM NaCl, 150 μM PLP, and 100 μM EDTA in a total volume of 100 μL. After 30 sec incubation, a 35 μL aliquot of the reaction was removed and immediately added to 65 μL ice-cold 50:30:20 methanol:acetonitrile:water containing 500 nM internal amino acid standards (Cambridge Isotope Laboratories) for metabolite extraction. Samples were then vortexed for 10 min and centrifuged at 21130 g for 1 min at 4°C. To estimate kinetic parameters for l-Glu, the assay extraction procedure was similar with minor modifications. Reactions of purified GPT (20–40 nM) with fixed pyruvate (1 mM) and varying concentrations of l-Glu were carried out in the same conditions, except incubation times were either 1 min (GPT1) or 5 min (GPT2).
Concentrations of αKG generated in each reaction were evaluated by LC-MS analysis of extracted samples (See Metabolite Profiling and Quantification of Metabolite Abundance). Using peak areas of an αKG standard normalized by those of l-Phenylalanine (13C9, 99%; 15N, 99%) identically prepared in the same extraction solution, we constructed standard curves fit to linear equations to ensure that αKG concentrations in the reaction samples did not exceed ~10% of the initial substrate concentrations. For reactions with fixed l-Glu, standard curves consisted of points at the following concentrations: 167 nM, 500 nM, 1.5 μM, and 4.5 μM; and for those with fixed pyruvate, they were instead at: 4.5 μM, 13.5 μM, 40.5 μM, and 121.5 μM.
Of note, given both the 10% turnover threshold above and the αKG detection limit that could be achieved by the method used, we could not measure meaningful αKG concentrations from reactions containing pyruvate below the estimated KM, PYR of GPT2. Stock solutions of L-Glu (Sigma-Aldrich) and PLP (Sigma-Aldrich) were prepared at 100 mM in 10 mM HCl and 200 mM HCl, respectively, and upon appropriate dilutions, had little effect on reaction pH.
QUANTIFICATION AND STATISTICAL ANALYSIS
Genome-wide CRISPR screens
Sequencing reads were aligned to the sgRNA library and only exact matches were allowed. sgRNAs with less than 50 counts in the initial dataset were removed from downstream analysis. Genes targeted by less than seven distinct sgRNAs following this filtering were also removed from further analysis. Abundances of all remaining sgRNAs were determined by adding a pseudocount of one and then normalizing by the total number of read counts for a given sample. Depletion scores were calculated as the log2 fold-change in abundance of each sgRNA between the initial and final populations. Gene scores were defined as the average log2 fold-change in depletion scores of all sgRNAs targeting the gene.
Screens in different conditions may introduce discrepancies in aggregate gene selection that affect the dynamic range of gene scores (Wang et al., 2019). Therefore, to reduce potential bias in calculating differential scores based on assuming that such distributions are equivalent between screens, we scaled all gene scores instead based on the assumption that the sets of nontargeting (NT) sgRNAs and core essential genes (CEGs) would exhibit the same selection across different screens. In brief, gene scores were scaled such that the medians of post-filtering NT sgRNAs (989) and reference CEGs (680 genes) (Hart et al., 2017) included in the library were defined as 0 and −1, respectively, using the following equation where XS is the scaled gene score:
For each gene, a differential score between screens was calculated and then standardized relative to the entire set of targeted genes to assess differential dependency.
Probability of dependency in genome-wide screens
For each genome-wide screen, probabilities of dependency were calculated for all targeted genes (Dempster et al., 1977, 2019). In brief, the gene score dataset from each screen was treated as a mixture model comprised of two normal distributions. Densities were generated using a standard E-M optimization procedure initialized with the means and standard deviations from reference sets of 680 CEGs and 768 nonessential genes (Hart et al., 2014, 2017). The probability of dependency for a given gene was then calculated as the ratio of CEG density to the sum of the two densities at the gene score of interest. Given that standard deviations of the two distributions differ, their estimated densities converge to zero at different rates in extreme tail regions, which can cause erroneous inflation of estimated probabilities at large enough gene score values. Thus, genes with a score greater than or equal to zero were assigned a dependency probability equal to the minimum such value in the dataset.
Genes involved in fundamental processes
The following KEGG gene sets were obtained from the Gene Set Enrichment Analysis (GSEA) database: aminoacyl tRNA biosynthesis, DNA replication, nucleotide excision repair, proteasome, ribosome, RNA polymerase, and spliceosome.
Receiver-operator analysis
From each genome-wide screen dataset, receiver-operator characteristic (ROC) curves were generated from relatively balanced reference sets of 680 CEG and 768 nonessential genes (Hart et al., 2014, 2017). Area under the ROC curve was used as the performance metric to assess how well each dataset could discriminate for CEGs.
PANTHER pathway-enrichment analysis
To determine which biological processes were enriched among conditionally essential hits from genome-wide K562 screens, genes were queried using the PANTHER Overrepresentation Test with Gene Ontology Biological Processes as the annotation dataset (Mi et al., 2019). Significance was measured with Fisher’s Exact Test using a false discovery rate (FDR) cutoff of 0.05.
RNA sequencing
Differential expression was evaluated by FeatureCounts. Significance of differential expression between conditions was measured using negative binomial distribution as implemented in the DESeq2 v1.10 package, with P-values multiple-test corrected to estimate FDRs using the Benjamini-Hochberg procedure.
Secondary CRISPR screens
Gene scores were calculated using a procedure similar to that for the genome-wide screens with minor modifications. From each initial reference set, sgRNAs with less than 100 counts were removed from downstream analysis. sgRNA depletion scores were similarly scaled, but with the post-filtering NT sgRNAs in each initial dataset and CEGs (83) targeted by the focused library.
To combine data from replicate focused library screens in the K562 cell line in each of HPLM+dS and RPMI+dS, scaled sgRNA-level data from replicates were pooled and gene scores were then calculated as the average from all sgRNAs targeting the gene. For all genes, P-values to compare differential depletion distributions of respective targeting sgRNAs to those of NT sgRNAs were calculated using a two-tailed Welch’s t-test, and then multiple-test corrected to estimate FDRs using the Benjamini-Hochberg procedure. Significance of the r value that describes the relationship between conditional CRISPR phenotypes from genome-wide and pooled secondary screens was determined from a correlation test performed in R.
Quality control for linear transformations of gene score datasets
To assess the separation of control set distributions in each screen, strictly standardized mean difference (SSMD) statistics were calculated using the sgRNA depletion scores from NT and CEG-targeting sgRNAs (Zhang, 2007, 2008). For all CRISPR screens in this study, calculated SSMD values were < −2, indicating excellent separation (Tables S1 and S3).
Metabolite Profiling
To compare intracellular metabolite abundances, P-values were calculated using a two-tailed Welch’s t-test, and then multiple-test corrected to estimate FDRs using the Benjamini-Hochberg procedure. P-values to compare differences in fractional labeling were also calculated using a two-tailed Welch’s t-test.
Enzyme kinetics
To determine kinetic constants for pyruvate and l-Glu, plots of substrate concentration versus reaction velocity in GraphPad Prism were fit using the Michaelis-Menten equation.
P-values to compare relative growth were determined using a two-tailed Welch’s t-test. The exact value of n and the definition of center and precision measures are provided in associated figure legends. Bar graphs were prepared in GraphPad Prism 8; remaining plots and heatmaps were prepared in R. All instances of reported replicates refer to n biological replicates.
Supplementary Material
Table S1: Datasets related to genome-wide screens, Related to Figure 1
Table S2: Datasets related to RNA-Seq and PANTHER analysis, Related to Figure 1
Table S4: Oligonucleotides used in this study, Related to STAR Methods
Table S5: HPLM formulation, Related to STAR Methods
Table S6: Datasets related to metabolomics, Related to Figure 4 and Conclusions
Highlights.
CRISPR-based screens identify essential genes that vary with medium composition
Basal and serum components of culture media influence gene essentiality
Analysis of conditional gene essentiality reveals gene-nutrient interactions
CRISPR phenotypes for genes linked to metabolites uniquely defined in HPLM
ACKNOWLEDGEMENTS
We thank members of the Sabatini lab for discussions; members of the Cantor lab for upkeep of the LC-MS platform; S. Gupta and P. Thiru for assistance with RNA sequencing; and O. Wurtzel for the initial sequencing of the focused sgRNA library. This work was supported by grants from the NIH (R01CA103866 and R37AI047389 to D.M.S. and K22CA225864 to J.R.C.) and the Koch Institute (Frontier Research Grant) to D.M.S. N.J.R. and J.R.C. were also supported by startup funds from the Morgridge Institute for Research. Fellowship support was provided by the NIH (T32HG002760 to K.S.H., F31CA228241-01 to C.H.A., and T32GM008349 to R.W.S.). D.M.S. is an investigator of the Howard Hughes Medical Institute and an American Cancer Society Research Professor.
Footnotes
Publisher's Disclaimer: This is a PDF file of an unedited manuscript that has been accepted for publication. As a service to our customers we are providing this early version of the manuscript. The manuscript will undergo copyediting, typesetting, and review of the resulting proof before it is published in its final form. Please note that during the production process errors may be discovered which could affect the content, and all legal disclaimers that apply to the journal pertain.
SUPPLEMENTAL INFORMATION
Supplemental information can be found online.
DECLARATION OF INTERESTS
J.R.C. and D.M.S. are inventors on a patent application for HPLM (PCT/US2017/061377) assigned to Whitehead Institute. The remaining authors declare no competing interests.
REFERENCES
- Ackermann T, and Tardito S (2019). Cell Culture Medium Formulation and Its Implications in Cancer Metabolism. Trends Cancer 5, 329–332. [DOI] [PMC free article] [PubMed] [Google Scholar]
- Altman BJ, Stine ZE, and Dang CV (2016). From Krebs to clinic: glutamine metabolism to cancer therapy. Nat Rev Cancer 16, 619–634. [DOI] [PMC free article] [PubMed] [Google Scholar]
- Arce-Molina R, Cortés-Molina F, Sandoval PY, Galaz A, Alegría K, Schirmeier S, Barros LF, and Martín AS (2020). A highly responsive pyruvate sensor reveals pathway- regulatory role of the mitochondrial pyruvate carrier MPC. Elife 9, e53917. [DOI] [PMC free article] [PubMed] [Google Scholar]
- Behan FM, Iorio F, Picco G, Gonçalves E, Beaver CM, Migliardi G, Santos R, Rao Y, Sassi F, Pinnelli M, et al. (2019). Prioritization of cancer therapeutic targets using CRISPR–Cas9 screens. Nature 568, 511–516. [DOI] [PubMed] [Google Scholar]
- Birsoy K, Wang T, Chen WW, Freinkman E, Abu-Remaileh M, and Sabatini DM (2015). An Essential Role of the Mitochondrial Electron Transport Chain in Cell Proliferation Is to Enable Aspartate Synthesis. Cell 162, 540–551. [DOI] [PMC free article] [PubMed] [Google Scholar]
- Bricker DK, Taylor EB, Schell JC, Orsak T, Boutron A, Chen Y-C, Cox JE, Cardon CM, Vranken JGV, Dephoure N, et al. (2012). A Mitochondrial Pyruvate Carrier Required for Pyruvate Uptake in Yeast, Drosophila, and Humans. Science 337, 96–100. [DOI] [PMC free article] [PubMed] [Google Scholar]
- Bröer S, and Bröer A (2017). Amino acid homeostasis and signalling in mammalian cells and organisms. Biochem J 474, 1935–1963. [DOI] [PMC free article] [PubMed] [Google Scholar]
- Cantor JR (2019). The Rise of Physiologic Media. Trends Cell Biol 29, 854–861. [DOI] [PMC free article] [PubMed] [Google Scholar]
- Cantor JR, and Sabatini DM (2012). Cancer Cell Metabolism: One Hallmark, Many Faces. Cancer Discov 2, 881–898. [DOI] [PMC free article] [PubMed] [Google Scholar]
- Cantor JR, Panayiotou V, Agnello G, Georgiou G, and Stone EM (2012). Engineering Reduced-Immunogenicity Enzymes for Amino Acid Depletion Therapy in Cancer. Methods Enzymol 502, 291–319. [DOI] [PubMed] [Google Scholar]
- Cantor JR, Abu-Remaileh M, Kanarek N, Freinkman E, Gao X, Louissaint A, Lewis CA, and Sabatini DM (2017). Physiologic Medium Rewires Cellular Metabolism and Reveals Uric Acid as an Endogenous Inhibitor of UMP Synthase. Cell 169, 258–272.e17. [DOI] [PMC free article] [PubMed] [Google Scholar]
- Cao F, Chen Y, Cierpicki T, Liu Y, Basrur V, Lei M, and Dou Y (2010). An Ash2L/RbBP5 Heterodimer Stimulates the MLL1 Methyltransferase Activity through Coordinated Substrate Interactions with the MLL1 SET Domain. Plos One 5, e14102. [DOI] [PMC free article] [PubMed] [Google Scholar]
- Cheung HW, Cowley GS, Weir BA, Boehm JS, Rusin S, Scott JA, East A, Ali LD, Lizotte PH, Wong TC, et al. (2011). Systematic investigation of genetic vulnerabilities across cancer cell lines reveals lineage-specific dependencies in ovarian cancer. Proc National Acad Sci 108, 12372–12377. [DOI] [PMC free article] [PubMed] [Google Scholar]
- Chow RD, and Chen S (2018). Cancer CRISPR Screens In Vivo. Trends Cancer 4, 349–358. [DOI] [PMC free article] [PubMed] [Google Scholar]
- Cramer SL, Saha A, Liu J, Tadi S, Tiziani S, Yan W, Triplett K, Lamb C, Alters SE, Rowlinson S, et al. (2017). Systemic depletion of L-cyst(e)ine with cyst(e)inase increases reactive oxygen species and suppresses tumor growth. Nat Med 23, 120–127. [DOI] [PMC free article] [PubMed] [Google Scholar]
- Davidson SM, Papagiannakopoulos T, Olenchock BA, Heyman JE, Keibler MA, Luengo A, Bauer MR, Jha AK, O’Brien JP, Pierce KA, et al. (2016). Environment Impacts the Metabolic Dependencies of Ras-Driven Non-Small Cell Lung Cancer. Cell Metab 23, 517–528. [DOI] [PMC free article] [PubMed] [Google Scholar]
- Dempster AP, Laird NM, and Rubin DB (1977). Maximum Likelihood from Incomplete Data Via the EM Algorithm. J Royal Statistical Soc Ser B Methodol 39, 1–22. [Google Scholar]
- Dempster JM, Rossen J, Kazachkova M, Pan J, Kugener G, Root DE, and Tsherniak A (2019). Extracting Biological Insights from the Project Achilles Genome-Scale CRISPR Screens in Cancer Cell Lines. Biorxiv 720243. [Google Scholar]
- Eagle H (1955). Nutrition Needs of Mammalian Cells in Tissue Culture. Science 122, 501–504. [DOI] [PubMed] [Google Scholar]
- Elia I, Rossi M, Stegen S, Broekaert D, Doglioni G, van Gorsel M, Boon R, Escalona-Noguero C, Torrekens S, Verfaillie C, et al. (2019). Breast cancer cells rely on environmental pyruvate to shape the metastatic niche. Nature 568, 117–121. [DOI] [PMC free article] [PubMed] [Google Scholar]
- Faubert B, Solmonson A, and DeBerardinis RJ (2020). Metabolic reprogramming and cancer progression. Science 368, eaaw5473. [DOI] [PMC free article] [PubMed] [Google Scholar]
- Felig P (1973). The glucose-alanine cycle. Metabolism 22, 179–207. [DOI] [PubMed] [Google Scholar]
- Freshney RI (2010). Culture of Animal Cells. A Manual of Basic Technique and Specialized Applications, Sixth Edition (John Wiley & Sons, Inc.). [Google Scholar]
- Ghandi M, Huang FW, Jané-Valbuena J, Kryukov GV, Lo CC, McDonald ER, Barretina J, Gelfand ET, Bielski CM, Li H, et al. (2019). Next-generation characterization of the Cancer Cell Line Encyclopedia. Nature 569, 503–508. [DOI] [PMC free article] [PubMed] [Google Scholar]
- Gilbert LA, Horlbeck MA, Adamson B, Villalta JE, Chen Y, Whitehead EH, Guimaraes C, Panning B, Ploegh HL, Bassik MC, et al. (2014). Genome-Scale CRISPR-Mediated Control of Gene Repression and Activation. Cell 159, 647–661. [DOI] [PMC free article] [PubMed] [Google Scholar]
- Glinghammar B, Rafter I, Lindström A-K, Hedberg JJ, Andersson HB, Lindblom P, Berg A-L, and Cotgreave I (2009). Detection of the mitochondrial and catalytically active alanine aminotransferase in human tissues and plasma. Int J Mol Med 23, 621–631. [DOI] [PubMed] [Google Scholar]
- Gross MI, Demo SD, Dennison JB, Chen L, Chernov-Rogan T, Goyal B, Janes JR, Laidig GJ, Lewis ER, Li J, et al. (2014). Antitumor Activity of the Glutaminase Inhibitor CB-839 in Triple-Negative Breast Cancer. Mol Cancer Ther 13, 890–901. [DOI] [PubMed] [Google Scholar]
- Gubern G, Imperial S, Busquets M, and Cortes A (1990). Partial characterization of the alanine aminotransferase isoenzymes from human liver. Biochem Soc Trans 18, 1288–1289. [DOI] [PubMed] [Google Scholar]
- Han K, Jeng EE, Hess GT, Morgens DW, Li A, and Bassik MC (2017). Synergistic drug combinations for cancer identified in a CRISPR screen for pairwise genetic interactions. Nat Biotechnol 35, 463–474. [DOI] [PMC free article] [PubMed] [Google Scholar]
- Han K, Pierce SE, Li A, Spees K, Anderson GR, Seoane JA, Lo Y-H, Dubreuil M, Olivas M, Kamber RA, et al. (2020). CRISPR screens in cancer spheroids identify 3D growth-specific vulnerabilities. Nature 580, 136–141. [DOI] [PMC free article] [PubMed] [Google Scholar]
- Hao Y, Samuels Y, Li Q, Krokowski D, Guan B-J, Wang C, Jin Z, Dong B, Cao B, Feng X, et al. (2016). Oncogenic PIK3CA mutations reprogram glutamine metabolism in colorectal cancer. Nat Commun 7, 11971. [DOI] [PMC free article] [PubMed] [Google Scholar]
- Hart T, Brown KR, Sircoulomb F, Rottapel R, and Moffat J (2014). Measuring error rates in genomic perturbation screens: gold standards for human functional genomics. Mol Syst Biol 10, 733. [DOI] [PMC free article] [PubMed] [Google Scholar]
- Hart T, Chandrashekhar M, Aregger M, Steinhart Z, Brown KR, MacLeod G, Mis M, Zimmermann M, Fradet-Turcotte A, Sun S, et al. (2015). High-Resolution CRISPR Screens Reveal Fitness Genes and Genotype-Specific Cancer Liabilities. Cell 163, 1515–1526. [DOI] [PubMed] [Google Scholar]
- Hart T, Tong AHY, Chan K, Leeuwen JV, Seetharaman A, Aregger M, Chandrashekhar M, Hustedt N, Seth S, Noonan A, et al. (2017). Evaluation and Design of Genome-Wide CRISPR/SpCas9 Knockout Screens. G3 Genes Genomes Genetics 7, 2719–2727. [DOI] [PMC free article] [PubMed] [Google Scholar]
- Herzig S, Raemy E, Montessuit S, Veuthey J-L, Zamboni N, Westermann B, Kunji ERS, and Martinou J-C (2012). Identification and Functional Expression of the Mitochondrial Pyruvate Carrier. Science 337, 93–96. [DOI] [PubMed] [Google Scholar]
- Hillenmeyer ME, Fung E, Wildenhain J, Pierce SE, Hoon S, Lee W, Proctor M, St.Onge RP, Tyers M, Koller D, et al. (2008). The Chemical Genomic Portrait of Yeast: Uncovering a Phenotype for All Genes. Science 320, 362–365. [DOI] [PMC free article] [PubMed] [Google Scholar]
- Jain IH, Calvo SE, Markhard AL, Skinner OS, To T-L, Ast T, and Mootha VK (2020). Genetic Screen for Cell Fitness in High or Low Oxygen Highlights Mitochondrial and Lipid Metabolism. Cell 181, 716–727.e11. [DOI] [PMC free article] [PubMed] [Google Scholar]
- Kanarek N, Keys HR, Cantor JR, Lewis CA, Chan SH, Kunchok T, Abu-Remaileh M, Freinkman E, Schweitzer LD, and Sabatini DM (2018). Histidine catabolism is a major determinant of methotrexate sensitivity. Nature 559, 632–636. [DOI] [PMC free article] [PubMed] [Google Scholar]
- Kanarek N, Petrova B, and Sabatini DM (2020). Dietary modifications for enhanced cancer therapy. Nature 579, 507–517. [DOI] [PubMed] [Google Scholar]
- Kanehisa M, Furumichi M, Tanabe M, Sato Y, and Morishima K (2017). KEGG: new perspectives on genomes, pathways, diseases, and drugs. Nucleic Acids Res. 45, D353–D361. [DOI] [PMC free article] [PubMed] [Google Scholar]
- Kaymak I, Williams KS, Cantor JR, and Jones RG (2020). Immunometabolic Interplay in the Tumor Microenvironment. Cancer Cell 39, 28–37. [DOI] [PMC free article] [PubMed] [Google Scholar]
- Kim D, Pertea G, Trapnell C, Pimentel H, Kelley R, and Salzberg SL (2013). TopHat2: accurate alignment of transcriptomes in the presence of insertions, deletions and gene fusions. Genome Biol 14, R36. [DOI] [PMC free article] [PubMed] [Google Scholar]
- Kim M, Gwak J, Hwang S, Yang S, and Jeong SM (2019). Mitochondrial GPT2 plays a pivotal role in metabolic adaptation to the perturbation of mitochondrial glutamine metabolism. Oncogene 38, 4729–4738. [DOI] [PubMed] [Google Scholar]
- Komatsu M, Chiba T, Tatsumi K, Iemura S, Tanida I, Okazaki N, Ueno T, Kominami E, Natsume T, and Tanaka K (2004). A novel protein-conjugating system for Ufm1, a ubiquitin-fold modifier. Embo J 23, 1977–1986. [DOI] [PMC free article] [PubMed] [Google Scholar]
- Kory N, Wyant GA, Prakash G, uit de Bos J, Bottanelli F, Pacold ME, Chan SH, Lewis CA, Wang T, Keys HR, et al. (2018). SFXN1 is a mitochondrial serine transporter required for one-carbon metabolism. Science 362, eaat9528. [DOI] [PMC free article] [PubMed] [Google Scholar]
- Le A, Lane AN, Hamaker M, Bose S, Gouw A, Barbi J, Tsukamoto T, Rojas CJ, Slusher BS, Zhang H, et al. (2012). Glucose-Independent Glutamine Metabolism via TCA Cycling for Proliferation and Survival in B Cells. Cell Metab 15, 110–121. [DOI] [PMC free article] [PubMed] [Google Scholar]
- Leney-Greene MA, Boddapati AK, Su HC, Cantor JR, and Lenardo MJ (2020). Human Plasma-like Medium Improves T Lymphocyte Activation. Iscience 23, 100759. [DOI] [PMC free article] [PubMed] [Google Scholar]
- Lonsdale J, Thomas J, Salvatore M, Phillips R, Lo E, Shad S, Hasz R, Walters G, Garcia F, Young N, et al. (2013). The Genotype-Tissue Expression (GTEx) project. Nat Genet 45, 580–585. [DOI] [PMC free article] [PubMed] [Google Scholar]
- Love MI, Huber W, and Anders S (2014). Moderated estimation of fold change and dispersion for RNA-seq data with DESeq2. Genome Biol 15, 550. [DOI] [PMC free article] [PubMed] [Google Scholar]
- Lu W-C, Saha A, Yan W, Garrison K, Lamb C, Pandey R, Irani S, Lodi A, Lu X, Tiziani S, et al. (2020). Enzyme-mediated depletion of serum l-Met abrogates prostate cancer growth via multiple mechanisms without evidence of systemic toxicity. Proc National Acad Sci 117, 13000–13011. [DOI] [PMC free article] [PubMed] [Google Scholar]
- Luengo A, Gui DY, and Vander Heiden MG (2017). Targeting Metabolism for Cancer Therapy. Cell Chem Biol 24, 1161–1180. [DOI] [PMC free article] [PubMed] [Google Scholar]
- Lyssiotis CA, and Kimmelman AC (2017). Metabolic Interactions in the Tumor Microenvironment. Trends Cell Biol 27, 863–875. [DOI] [PMC free article] [PubMed] [Google Scholar]
- McAllister CH, Facette M, Holt A, and Good AG (2013). Analysis of the Enzymatic Properties of a Broad Family of Alanine Aminotransferases. Plos One 8, e55032. [DOI] [PMC free article] [PubMed] [Google Scholar]
- McDonald ER, Weck A. de, Schlabach MR, Billy E, Mavrakis KJ, Hoffman GR, Belur D, Castelletti D, Frias E, Gampa K, et al. (2017). Project DRIVE: A Compendium of Cancer Dependencies and Synthetic Lethal Relationships Uncovered by Large-Scale, Deep RNAi Screening. Cell 170, 577–592.e10. [DOI] [PubMed] [Google Scholar]
- Meyers RM, Bryan JG, McFarland JM, Weir BA, Sizemore AE, Xu H, Dharia NV, Montgomery PG, Cowley GS, Pantel S, et al. (2017). Computational correction of copy number effect improves specificity of CRISPR–Cas9 essentiality screens in cancer cells. Nat Genet 49, 1779–1784. [DOI] [PMC free article] [PubMed] [Google Scholar]
- Mi H, Muruganujan A, Huang X, Ebert D, Mills C, Guo X, and Thomas PD (2019). Protocol Update for large-scale genome and gene function analysis with the PANTHER classification system (v.14.0). Nat Protoc 14, 703–721. [DOI] [PMC free article] [PubMed] [Google Scholar]
- Muir A, and Vander Heiden MG (2018). The nutrient environment affects therapy. Science 360, 962–963. [DOI] [PMC free article] [PubMed] [Google Scholar]
- Muir A, Danai LV, Gui DY, Waingarten CY, Lewis CA, and Vander Heiden MG (2017). Environmental cystine drives glutamine anaplerosis and sensitizes cancer cells to glutaminase inhibition. Elife 6, e27713. [DOI] [PMC free article] [PubMed] [Google Scholar]
- Nichols RJ, Sen S, Choo YJ, Beltrao P, Zietek M, Chaba R, Lee S, Kazmierczak KM, Lee KJ, Wong A, et al. (2010). Phenotypic landscape of a bacterial cell. Cell 144, 143–156. [DOI] [PMC free article] [PubMed] [Google Scholar]
- Ouyang Q, Nakayama T, Baytas O, Davidson SM, Yang C, Schmidt M, Lizarraga SB, Mishra S, EI-Quessny M, Niaz S, et al. (2016). Mutations in mitochondrial enzyme GPT2 cause metabolic dysfunction and neurological disease with developmental and progressive features. Proc National Acad Sci 113, E5598–E5607. [DOI] [PMC free article] [PubMed] [Google Scholar]
- Parker SJ, Amendola CR, Hollinshead KER, Yu Q, Yamamoto K, Encarnación-Rosado J, Rose RE, LaRue MM, Sohn ASW, Biancur DE, et al. (2020). Selective Alanine Transporter Utilization Creates a Targetable Metabolic Niche in Pancreatic Cancer. Cancer Discov CD-19–0959. [DOI] [PMC free article] [PubMed] [Google Scholar]
- Patgiri A, Skinner OS, Miyazaki Y, Schleifer G, Marutani E, Shah H, Sharma R, Goodman RP, To T-L, Bao XR, et al. (2020). An engineered enzyme that targets circulating lactate to alleviate intracellular NADH:NAD+ imbalance. Nat Biotechnol 38, 309–313. [DOI] [PMC free article] [PubMed] [Google Scholar]
- Qian W, Ma D, Xiao C, Wang Z, and Zhang J (2012). The Genomic Landscape and Evolutionary Resolution of Antagonistic Pleiotropy in Yeast. Cell Reports 2, 1399–1410. [DOI] [PMC free article] [PubMed] [Google Scholar]
- Rancati G, Moffat J, Typas A, and Pavelka N (2017). Emerging and evolving concepts in gene essentiality. Nat Rev Genet 19, 34–49. [DOI] [PubMed] [Google Scholar]
- Ron-Harel N, Ghergurovich JM, Notarangelo G, LaFleur MW, Tsubosaka Y, Sharpe AH, Rabinowitz JD, and Haigis MC (2019). T Cell Activation Depends on Extracellular Alanine. Cell Reports 28, 3011–3021.e4. [DOI] [PMC free article] [PubMed] [Google Scholar]
- Sassetti CM, Boyd DH, and Rubin EJ (2001). Comprehensive identification of conditionally essential genes in mycobacteria. Proc National Acad Sci 98, 12712–12717. [DOI] [PMC free article] [PubMed] [Google Scholar]
- Shalem O, Sanjana NE, Hartenian E, Shi X, Scott DA, Mikkelsen TS, Heckl D, Ebert BL, Root DE, Doench JG, et al. (2014). Genome-Scale CRISPR-Cas9 Knockout Screening in Human Cells. Science 343, 84–87. [DOI] [PMC free article] [PubMed] [Google Scholar]
- Smith B, Schafer XL, Ambeskovic A, Spencer CM, Land H, and Munger J (2016). Addiction to Coupling of the Warburg Effect with Glutamine Catabolism in Cancer Cells. Cell Reports 17, 821–836. [DOI] [PMC free article] [PubMed] [Google Scholar]
- Smith CA, Maille GO, Want EJ, Qin C, Trauger SA, Brandon TR, Custodio DE, Abagyan R, and Siuzdak G (2005). METLIN. Ther Drug Monit 27, 747–751. [DOI] [PubMed] [Google Scholar]
- Solmonson A, and DeBerardinis RJ (2018). Lipoic acid metabolism and mitochondrial redox regulation. J Biol Chem 293, 7522–7530. [DOI] [PMC free article] [PubMed] [Google Scholar]
- Sousa CM, Biancur DE, Wang X, Halbrook CJ, Sherman MH, Zhang L, Kremer D, Hwang RF, Witkiewicz AK, Ying H, et al. (2016). Pancreatic stellate cells support tumour metabolism through autophagic alanine secretion. Nature 536, 479–483. [DOI] [PMC free article] [PubMed] [Google Scholar]
- Tsherniak A, Vazquez F, Montgomery PG, Weir BA, Kryukov G, Cowley GS, Gill S, Harrington WF, Pantel S, Krill-Burger JM, et al. (2017). Defining a Cancer Dependency Map. Cell 170, 564–576.e16. [DOI] [PMC free article] [PubMed] [Google Scholar]
- Tzelepis K, Koike-Yusa H, De Braekeleer E, Li Y, Metzakopian E, Dovey OM, Mupo A, Grinkevich V, Li M, Mazan M, et al. (2016). A CRISPR Dropout Screen Identifies Genetic Vulnerabilities and Therapeutic Targets in Acute Myeloid Leukemia. Cell Reports 17, 1193–1205. [DOI] [PMC free article] [PubMed] [Google Scholar]
- Vacanti NM, Divakaruni AS, Green CR, Parker SJ, Henry RR, Ciaraldi TP, Murphy AN, and Metallo CM (2014). Regulation of substrate utilization by the mitochondrial pyruvate carrier. Mol Cell 56, 425–435. [DOI] [PMC free article] [PubMed] [Google Scholar]
- Wang B, Wang M, Zhang W, Xiao T, Chen C-H, Wu A, Wu F, Traugh N, Wang X, Li Z, et al. (2019). Integrative analysis of pooled CRISPR genetic screens using MAGeCKFlute. Nat Protoc 14, 756–780. [DOI] [PMC free article] [PubMed] [Google Scholar]
- Wang T, Wei JJ, Sabatini DM, and Lander ES (2014). Genetic Screens in Human Cells Using the CRISPR-Cas9 System. Science 343, 80–84. [DOI] [PMC free article] [PubMed] [Google Scholar]
- Wang T, Birsoy K, Hughes NW, Krupczak KM, Post Y, Wei JJ, Lander ES, and Sabatini DM (2015). Identification and characterization of essential genes in the human genome. Science 350, 1096–1101. [DOI] [PMC free article] [PubMed] [Google Scholar]
- Wang T, Yu H, Hughes NW, Liu B, Kendirli A, Klein K, Chen WW, Lander ES, and Sabatini DM (2017). Gene Essentiality Profiling Reveals Gene Networks and Synthetic Lethal Interactions with Oncogenic Ras. Cell 168, 890–903.e15. [DOI] [PMC free article] [PubMed] [Google Scholar]
- Weinberg F, Hamanaka R, Wheaton WW, Weinberg S, Joseph J, Lopez M, Kalyanaraman B, Mutlu GM, Budinger GRS, and Chandel NS (2010). Mitochondrial metabolism and ROS generation are essential for Kras-mediated tumorigenicity. Proc National Acad Sci 107, 8788–8793. [DOI] [PMC free article] [PubMed] [Google Scholar]
- Winters IP, Murray CW, and Winslow MM (2018). Towards quantitative and multiplexed in vivo functional cancer genomics. Nat Rev Genet 19, 741–755. [DOI] [PubMed] [Google Scholar]
- Wishart DS, Feunang YD, Marcu A, Guo AC, Liang K, Vázquez-Fresno R, Sajed T, Johnson D, Li C, Karu N, et al. (2017). HMDB 4.0: the human metabolome database for 2018. Nucleic Acids Res 46, gkx1089-. [DOI] [PMC free article] [PubMed] [Google Scholar]
- Wortel IMN, van der Meer LT, Kilberg MS, and van Leeuwen FN (2017). Surviving Stress: Modulation of ATF4-Mediated Stress Responses in Normal and Malignant Cells. Trends Endocrinol Metabolism 28, 794–806. [DOI] [PMC free article] [PubMed] [Google Scholar]
- Yang C, Ko B, Hensley CT, Jiang L, Wasti AT, Kim J, Sudderth J, Calvaruso MA, Lumata L, Mitsche M, et al. (2014). Glutamine Oxidation Maintains the TCA Cycle and Cell Survival during Impaired Mitochondrial Pyruvate Transport. Mol Cell 56, 414–424. [DOI] [PMC free article] [PubMed] [Google Scholar]
- Zhang XD (2007). A pair of new statistical parameters for quality control in RNA interference high-throughput screening assays. Genomics 89, 552–561. [DOI] [PubMed] [Google Scholar]
- Zhang XD (2008). Novel Analytic Criteria and Effective Plate Designs for Quality Control in Genome-Scale RNAi Screens. J Biomol Screen 13, 363–377. [DOI] [PubMed] [Google Scholar]
- Zhao S, Torres A, Henry RA, Trefely S, Wallace M, Lee JV, Carrer A, Sengupta A, Campbell SL, Kuo Y-M, et al. (2016). ATP-Citrate Lyase Controls a Glucose-to-Acetate Metabolic Switch. Cell Reports 17, 1037–1052. [DOI] [PMC free article] [PubMed] [Google Scholar]
Associated Data
This section collects any data citations, data availability statements, or supplementary materials included in this article.
Supplementary Materials
Table S1: Datasets related to genome-wide screens, Related to Figure 1
Table S2: Datasets related to RNA-Seq and PANTHER analysis, Related to Figure 1
Table S4: Oligonucleotides used in this study, Related to STAR Methods
Table S5: HPLM formulation, Related to STAR Methods
Table S6: Datasets related to metabolomics, Related to Figure 4 and Conclusions
Data Availability Statement
Datasets can be found in Tables S1, S2, S3, and S6. RNA-Seq data generated in this study is available in the Gene Expression Omnibus (GEO: GSE164693).