

Abstract
Objective
The objective of the paper is to critically review the current state of the literature on the association between discrimination and allostatic load (AL) in adults and determine whether this association differs by sociodemographic characteristics.
Methods
An extensive literature search was conducted in PubMed, CINAHL, PsycINFO, and Embase to identify studies that investigated the association between discrimination and AL. The search was limited to the English language, articles that were peer-reviewed and articles that were published within the last 10 years.
Results
A total of 11 studies met the eligibility criteria for this review, 8 of which were cross-sectional and 3 of which were longitudinal. There was heterogeneity in the type of discrimination measured, the composition of AL summary score, and the analytic approach utilized to examine the relationship of interest. Nine studies found a significant, positive association between discrimination and AL. The types of discrimination found to be positively associated with AL included lifetime discrimination, childhood racial discrimination, everyday discrimination, and everyday weight discrimination. One study found that this association differed by educational attainment.
Conclusion
There is evidence that discrimination is associated with AL. Longitudinal studies with diverse samples are needed to further explore this association and how it differs based on sociodemographic characteristics.
Keywords: Adults, allostatic load, discrimination, racism
Introduction
Allostatic load (AL), defined as the body’s physiological dysregulation due to stress over the lifetime (McEwen & Stellar, 1993), is associated with increased mortality and several of the nation’s leading causes of death, disability, and healthcare spending, including cardiovascular disease, diabetes, obesity, and hypertension (Borrell, Dallo, & Nguyen, 2010; Castagne et al., 2018; Centers for Disease Control and Prevention, 2019a, 2019b; R. P. Juster, McEwen, & Lupien, 2010; Karlamangla, Singer, & Seeman, 2006; Mattei, Demissie, Falcon, Ordovas, & Tucker, 2010). It is also associated with poorer self-rated health, cognitive decline and impairments, depressive symptoms, frailty, and mobility limitations (Goldman, Turra, Glei, Lin, & Weinstein, 2006; Gruenewald, Seeman, Karlamangla, & Sarkisian, 2009; R.-P. Juster et al., 2011; T. E. Seeman, Singer, Rowe, Horwitz, & McEwen, 1997; Seplaki, Goldman, Weinstein, & Lin, 2004; Szanton, Allen, Seplaki, Bandeen-Roche, & Fried, 2009). AL is the result of over or underactive allostasis (McEwen & Stellar, 1993; T. E. Seeman et al., 1997), the body’s effort to maintain function and stability when a stressor is identified. (Sterling & Eyer, 1988). In acute periods of stress, allostasis is an adaptive mechanism. However, when the body undergoes chronic stress, whether it be environmental, psychosocial, or physical, repeated activation and deactivation of allostasis occurs and the body stops responding effectively. This results in AL, or the cumulative dysregulation of the body’s physiologic systems, including the cardiovascular, immunologic, neuroendocrine and metabolic systems (McEwen, 1998, 2004; McEwen & Stellar, 1993).
Previous research has identified disparities in level of AL by race/ethnicity, gender, and socioeconomic status (Beckie, 2012). Specifically, AL has been found to be higher in Black Americans, in individuals with lower education and income, and in women (Chyu & Upchurch, 2011; Geronimus, Hicken, Keene, & Bound, 2006; T. Seeman et al., 2008; Yang & Kozloski, 2011). Understanding determinants and contributors to AL and these disparities is critical to identifying and implementing interventions that can successfully mitigate phsysiological dysregulation and thus, chronic diseases and conditions. One stressor that has been identified to potentially play an important role in the dysregulation of the body’s systems is discrimination (Goosby, Cheadle, & Mitchell, 2018; Pascoe & Smart Richman, 2009).
Discrimination includes everyday experiences of unfair treatment based on characteristics such as race, ethnicity, sexual orientation, weight, language, gender, age, or socioeconomic status, referred to as everyday, interpersonal, individual or personally mediated discrimination (Jones, 2000). Discrimination also includes exposure to unfair systems, structures, and policies enacted by institutions and agencies, referred to as institutional discrimination, and across institutions and agencies, referred to as systemic, structural, or uber discrimination (Bailey et al., 2017). Some scholars also describe internalized discrimination, or the resulting change in a person’s perception of him or herself due to discriminatory experiences (Jones, 2000). Most literature examining discrimination as a predictor measures perceived or self-reported discrimination at the interpersonal level (Bailey et al., 2017).
A meta-analytic review on discrimination and health demonstrated evidence that perceptions of discrimination were related to heightened physiological stress responses, in addition to negative psychological stress responses (Pascoe & Smart Richman, 2009). The authors suggested that these stress responses may contribute to negative physical and mental health outcomes through allostatic load, however, they did not examine these relationships directly. Because discrimination is often a repeated stressor and can affect a person across the life course (Krieger, 2012; Suglia et al., 2018), it is important to understand the consequences of discrimination in the context of the body’s cumulative stress. This understanding could also help explain how discrimination may contribute to existing disparities observed in AL (Beckie, 2012).
Although there is existing literature describing the association between discrimination and AL, to our knowledge, there has not been a review summarizing the evidence to date. In order to understand the scope of the association and provide future direction to research, a critical summarization of evidence is needed. Therefore, the purpose of this integrative review is to 1.) Describe the association between discrimination and AL in adults and 2.) Identify if this association differs based on race/ethnicity, gender, or socioeconomic status.
Methods
Review eligibility and selection of studies
Four electronic databases, including PubMed, CINAHL, PsycINFO and Embase, were searched in November of 2019. The search was limited to the English language and to peer-reviewed articles. In addition, the search was limited to articles published in the past 10 years, as research surrounding biomarkers and health is a rapidly evolving field. Following, hand searching was completed by reviewing the references of included articles. Articles were included in this review if the study 1.) had a quantitative research design, 2.) included an adult population, 3.) included a measure of discrimination, 4.) identified AL as an outcome of interest, and 5.) examined the direct association between discrimination and AL. Articles were excluded if full texts were not available, such as conference abstracts, and if they did not examine the direct relationship between a measure of discrimination and AL. Search terms utilized included the following: “Discrimination” OR “Racism” AND “Allostatic load” OR “Allostasis”. A full search strategy can be found in Supplementary Table 1. No post-hoc changes were made to the search strategy after the review had commenced.
A total of 89 studies were identified via the electronic databases and imported into Covidence Software. Of the 89 studies retrieved, 37 duplicates were removed. Two authors, HM and SL, completed title and abstract screening on the remaining 52 articles for relevance. Following title and abstract screening, 37 studies were excluded for irrelevance. Both authors completed a full-text review on the 15 remaining articles to identify those that met the full eligibility criteria. Authors discussed any disagreements that arose during screening. Discrepancies that remained after discussion were resolved by a third author (LM). At this stage, 4 studies were excluded for the following reasons: 1.) The study did not include a measure of AL (n=1), 2.) The study did not include a measure of discrimination (n=1), 3.) The study did not examine the direct association between discrimination and AL (n=1) and 4.) The study’s main analyses were already reported in another article included in the literature review and the additional analyses in the second article did not meet our criteria (n=1) (Allen, Wang, et al., 2019). A summary of the search is displayed in Figure 1. A meta-analysis was not completed due to the heterogeneity in types of discrimination examined between studies.
Figure 1.
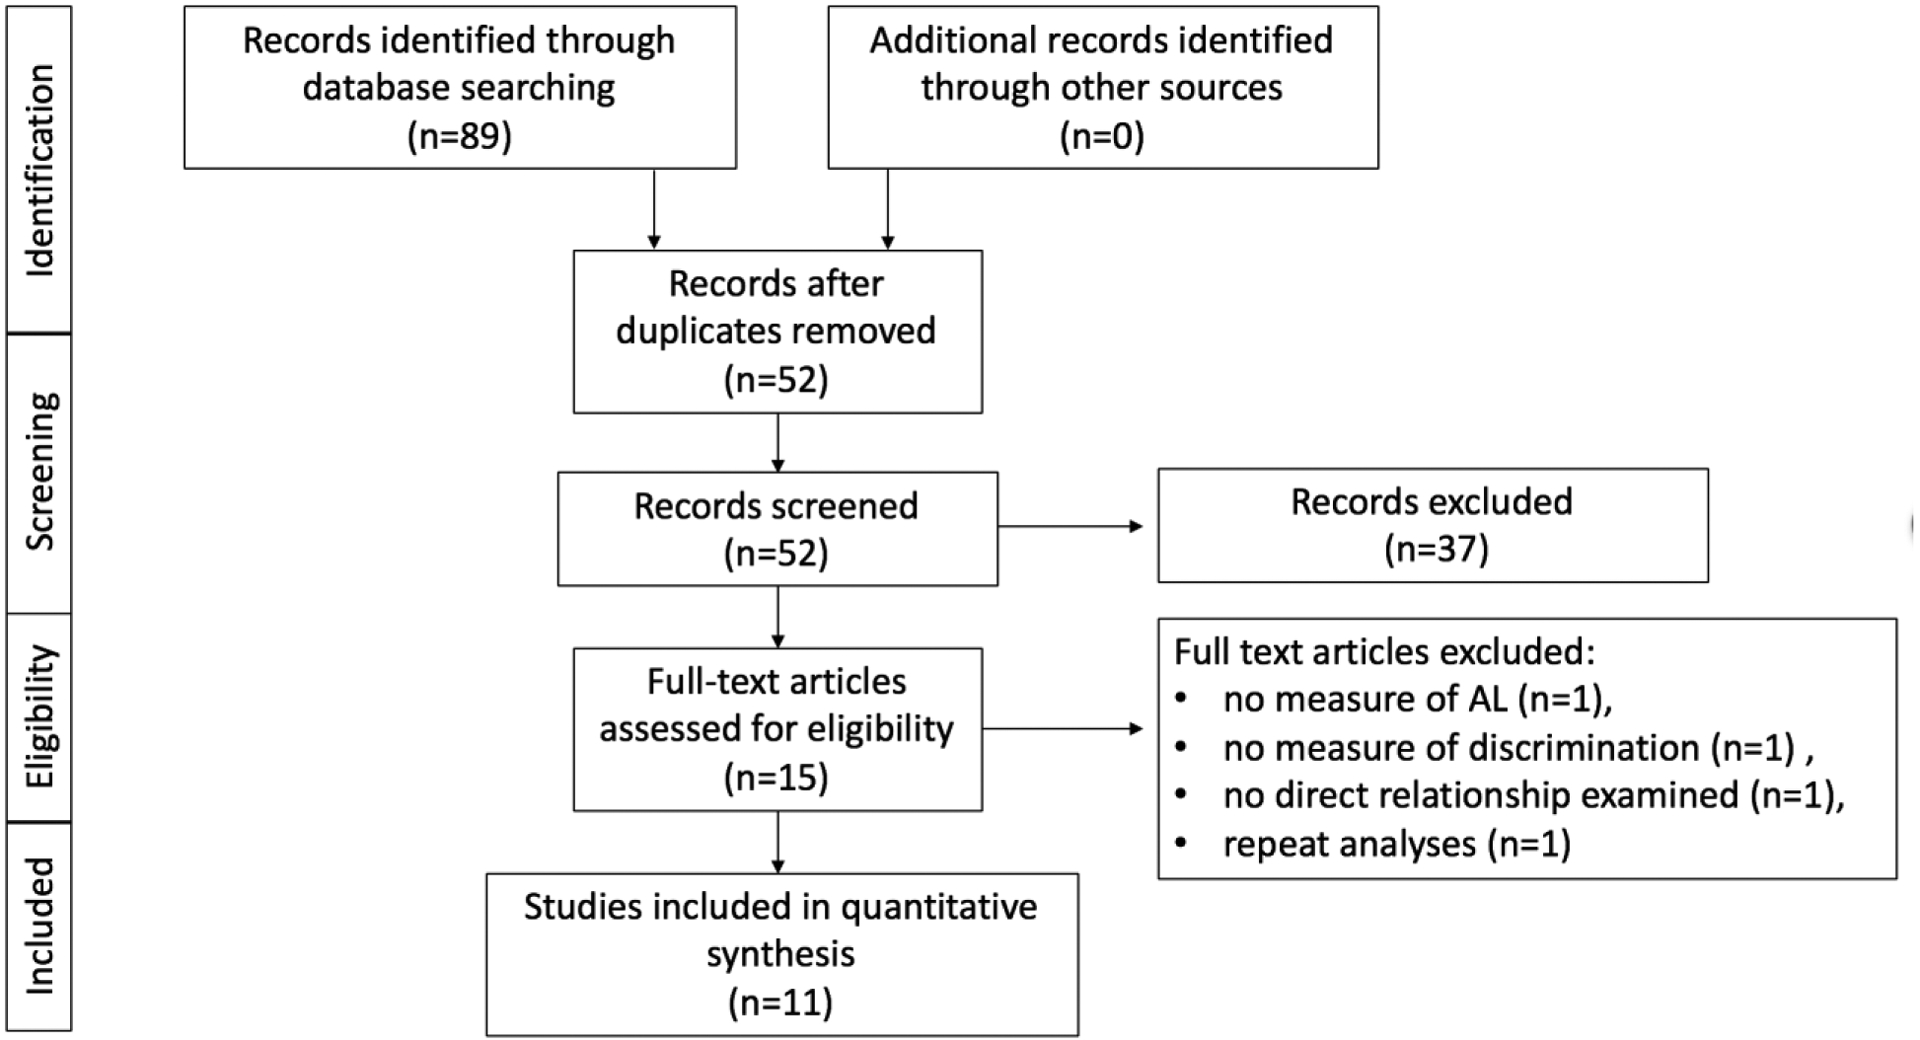
Study Selection Flow Diagram
Notes: Adapted From Moher, Liberati, Tetzlaff, & Altman, 2009. AL=Allostatic Load
Data extraction
Two of three authors, HM and either SL or LM, completed data extraction on each of the relevant articles. The following data were extracted from each article: first author, publication year, study design, study location, sample size and demographic characteristics, discrimination type and operationalization, AL measurement, analytic approach, confounders/covariates included in the analysis, main findings, and main strengths and limitations. Any discrepancies were resolved through discussion, in which a third author participated for adjudication (SL or LM).
Quality Appraisal
The included studies were assessed for quality by two authors, HM and SL. The Joanna Briggs Critical Appraisal Tools were utilized to identify methodological strengths and weaknesses and to identify possible bias in the studies presented in this review (Moola S, Munn Z, Tufanaru C, Aromataris E, Sears K, Sfetcu R, Currie M, Qureshi R, Mattis P, Lisy K, 2017). This method allows for better interpretation of results and assessment of study findings and conclusions. Cross-sectional studies were assessed with an 8-item tool and longitudinal or cohort studies were assessed using an 11-item tool. Studies were scored a 0 or a 1 for each item on the assessment tool. A score of 0 indicated that the article did not include or address an item on the assessment tool and a score of 1 indicated that it did. Total scores were summed for each study and divided by the total possible score for each tool (8 for cross sectional studies or 11 for longitudinal studies). Following, the studies were categorized as high (>66.6%), medium (33.4% to 66.6%) or low (<33.4%) quality, based upon on the percentage of items they addressed. The interrater agreement was 94%. Any discrepancies were resolved by a third author (LM).
Results
Quality Ratings
Tables 1 and 2 present the results of the quality rating assessment. Overall, 82% (n=9) of studies were of high quality. The remaining two studies were of medium quality (Upchurch et al., 2015; Vadiveloo & Mattei, 2017), both of which had inadequate reporting on participant follow up and strategies to address incomplete follow up. Other items that were unaddressed were if the groups were similar at baseline and if the groups or participants were free of the outcome at baseline (Vadiveloo & Mattei, 2017). Overall, studies examined in this review were of high quality and evidence should be reviewed and analyzed as such.
Table 1.
Quality Ratings for Cross Sectional Studies Examining the Association between Discrimination and Allostatic Load
| Item | First Author, Year | |||||||
|---|---|---|---|---|---|---|---|---|
| Allen, 2019 | Cuevas, 2019 | Currie, 2019a | Currie, 2019b | Ong, 2017 | Rosemberg, 2019 | Thomas, 2019 | Zilioli, 2017 | |
| Were the criteria for inclusion in the sample clearly defined? | 1 | 1 | 1 | 1 | 1 | 1 | 1 | 1 |
| Were the study subjects and the setting described in detail? | 1 | 1 | 1 | 1 | 1 | 1 | 1 | 1 |
| Was the exposure measured in a valid and reliable way? | 1 | 1 | 0 | 1 | 1 | 1 | 1 | 1 |
| Were objective, standard criteria used for measurement of the condition? | 0 | 0 | 0 | 0 | 0 | 0 | 0 | 0 |
| Were confounding factors identified? | 1 | 1 | 1 | 1 | 1 | 1 | 1 | 1 |
| Were strategies to deal with confounding factors stated? | 1 | 1 | 1 | 1 | 1 | 1 | 1 | 1 |
| Were the outcomes measured in a valid and reliable way? | 1 | 1 | 1 | 1 | 1 | 1 | 1 | 1 |
| Was appropriate statistical analysis used? | 1 | 1 | 1 | 1 | 1 | 1 | 1 | 1 |
Table 2.
Quality Ratings for Longitudinal or Cohort Studies Examining the Association between Discrimination and Allostatic Load
| Item | First Author, Year | ||
|---|---|---|---|
| Daly, 2019 | Upchurch, 2015 | Vadiveloo, 2017 | |
| Were the two groups similar and recruited from the same population? | 1 | 0 | 0 |
| Were the exposures measured similarly to assign people to both exposed and unexposed groups? | 1 | 0 | 1 |
| Was the exposure measured in a valid and reliable way? | 1 | 1 | 1 |
| Were confounding factors identified? | 1 | 1 | 0 |
| Were strategies to deal with confounding factors stated? | 1 | 1 | 1 |
| Were the groups/participants free of the outcome at the start of the study (or at the moment of exposure)? | 0 | 0 | 1 |
| Were the outcomes measured in a valid and reliable way? | 1 | 1 | 1 |
| Was the follow up time reported and sufficient to be long enough for outcomes to occur? | 1 | 1 | 1 |
| Was follow up complete, and if not, were the reasons to loss to follow up described and explored? | 1 | 0 | 0 |
| Were strategies to address incomplete follow up utilized? | 1 | 0 | 0 |
| Was appropriate statistical analysis used? | 1 | 1 | 1 |
Study Characteristics
There were 11 studies included in this review (Table 3). Among these, 8 had a cross-sectional design (Allen, Thomas, et al., 2019; Cuevas et al., 2019; Currie, Copeland, & Metz, 2019; Currie, Copeland, Metz, Moon-Riley, & Davies, 2019; Ong, Williams, Nwizu, & Gruenewald, 2017; Rosemberg, Li, McConnell, McCullagh, & Seng, 2019; Thomas et al., 2019; Zilioli, Imami, Ong, Lumley, & Gruenewald, 2017) and 3 had a longitudinal design (Daly, Sutin, & Robinson, 2019; Upchurch et al., 2015; Vadiveloo & Mattei, 2017). A majority of the studies (n=7) took place in the United States (Allen, Thomas, et al., 2019; Cuevas et al., 2019; Ong et al., 2017; Thomas et al., 2019; Upchurch et al., 2015; Vadiveloo & Mattei, 2017; Zilioli et al., 2017). Of these, three had multiple study locations (Upchurch et al., 2015; Vadiveloo & Mattei, 2017; Zilioli et al., 2017). The remaining four studies were in Canada (n=2) (Currie, Copeland, & Metz, 2019; Currie, Copeland, Metz, et al., 2019), England (n=1) (Daly et al., 2019), and an unspecified location (n=1) (Rosemberg et al., 2019). The average sample size was 850 participants, with 45% of the studies having a sample size over 500 participants (Cuevas et al., 2019; Daly et al., 2019; Upchurch et al., 2015; Vadiveloo & Mattei, 2017; Zilioli et al., 2017). Four of the studies included only female participants (Allen, Thomas, et al., 2019; Rosemberg et al., 2019; Thomas et al., 2019; Upchurch et al., 2015), and the other seven studies were majority female (Cuevas et al., 2019; Currie, Copeland, & Metz, 2019; Currie, Copeland, Metz, et al., 2019; Daly et al., 2019; Ong et al., 2017; Vadiveloo & Mattei, 2017; Zilioli et al., 2017). Racial and ethnic groups represented in these studies were: White, Puerto Rican, Indigenous, African American/Black American, Hispanic, Latino, Mexican American, Mexican, American Indian/Alaska Natives, Asian, Japanes. Three of the studies included more than one race or ethnicity in their study samples (Rosemberg et al., 2019; Upchurch et al., 2015; Vadiveloo & Mattei, 2017). Six of the eight remaining studies included participants from a single minority group (Allen, Thomas, et al., 2019; Cuevas et al., 2019; Currie, Copeland, & Metz, 2019; Currie, Copeland, Metz, et al., 2019; Ong et al., 2017; Thomas et al., 2019) and one study included only White participants (Zilioli et al., 2017). A final study included majority White participants (96.2%) and did not identify the race/ethnicity of the other 3.8% (Daly et al., 2019).
Table 3.
Study Characteristics
| First Author, Year | Study Design | Location | Sample | Type(s) of Discrimination | Main Strengths | Main Limitations |
|---|---|---|---|---|---|---|
| Allen, 2019 | Cross-sectional | California, US | N=208, 100% African American, 100% Female | Perceived experiences of racial discrimination |
|
|
| Cuevas, 2019 | Cross-sectional | Massachusetts, US | N=882; 100% Puerto Rican; 73% Female | Perceived lifetime and everyday discrimination |
|
|
| Currie, 2019a | Cross-sectional | Western Canada | N=105; 100% Indigenous; 73% Female | Perceived childhood racial discrimination |
|
|
| Currie 2019b | Cross-sectional | Western Canada | N=104; 100% Indigenous; 73% Female | Perceived experiences of (past year) racial discrimination |
|
|
| Daly, 2019 | Longitudinal | England | N=3609; 96.2% White; 52.7% female | Perceived everyday weight-based discrimination |
|
|
| Ong, 2017 | Cross-sectional | Wisconsin, United States | N=233; 100% African American; 67% Female | Perceived everyday and lifetime unfair treatment |
|
|
| Rosemberg, 2019 | Cross-sectional | Un-identified location | N=49; 29% Black; 56% Hispanic, Latino, Mexican American, Mexican; 4% American Indian/ Alaska Native/ Asian; 6% White; 100% female | Perceived everyday discrimination |
|
|
| Thomas, 2019 | Cross-sectional | California, US | N=208, 100% African American, 100% Female | Perceived everyday experiences of racial discrimination and institutional discrimination |
|
|
| Upchurch, 2015 | Longitudinal | Multiple sites, US | N=2063; 29% African American, 20% Japanese; >50% White; 100% Female | Perceived everyday discrimination |
|
|
| Vadiveloo, 2017 | Longitudinal | Multiple sites, US | N=986; 93% White; 57% female | Perceived everyday weight-based discrimination |
|
|
| Zilioli, 2017 | Cross-sectional | Multiple sites, US | N=909; 100% White; 54% Female | Perceived everyday discrimination |
|
|
Notes: US: United States; AL: Allostatic Load
AL Measurement
Each study calculated a composite score for AL, comprised of a set of biomarkers that assessed the functioning of several physiological body systems. As anticipated, due to the lack of a gold standard (Duong, Bingham, Aldana, Chung, & Sumner, 2017), there was variation in the biomarkers measured between studies and the categorization of physiological body systems (Table 4). The AL score was calculated using 9 different sets of biomarkers, ranging from the use of 7 biomarkers to 24 biomarkers. For the purposes of this review, we categorized these biomarkers into four systems: neuroendocrine (hypothalamic-pituitary-adrenal (HPA) axis and sympatho-adrenal-medullary (SAM) axis), immune/inflammation, metabolic, and cardiovascular. The most frequently used biomarkers were SBP and CRP, which were used in every study, and DBP, which was used in 10 of the studies (Allen, Thomas, et al., 2019; Cuevas et al., 2019; Currie, Copeland, & Metz, 2019; Currie, Copeland, Metz, et al., 2019; Daly et al., 2019; Ong et al., 2017; Rosemberg et al., 2019; Thomas et al., 2019; Upchurch et al., 2015; Zilioli et al., 2017). All studies included at least one biomarker for the cardiovascular, metabolic, and immune/inflammation systems. Biomarkers assessing neuroendocrine functioning were included in 10 of the 11 studies (Allen, Thomas, et al., 2019; Cuevas et al., 2019; Currie, Copeland, & Metz, 2019; Currie, Copeland, Metz, et al., 2019; Ong et al., 2017; Rosemberg et al., 2019; Thomas et al., 2019; Upchurch et al., 2015; Vadiveloo & Mattei, 2017; Zilioli et al., 2017).
Table 4.
Biomarkers Included in the Measurement of Allostatic Load
| Body System/Bio marker | First Author, Year | ||||||||||
|---|---|---|---|---|---|---|---|---|---|---|---|
| Allen 2019 | Cuevas, 2019 | Currie, 2019a | Currie, 2019b | Daly, 2019 | Ong, 2017 | Rosemberg, 2019 | Thomas, 2019 | Upchurch, 2015 | Vadiveloo, 2017 | Zilioli, 2017 | |
| Cardiovascular | |||||||||||
| Resting heart rate | X | X | X | X | X | ||||||
| Systolic BP | X | X | X | X | X | X | X | X | X | X | X |
| Diastolic BP | X | X | X | X | X | X | X | X | X | X | |
| Resting pulse pressure | X | ||||||||||
| Immune/Inflammation | |||||||||||
| CRP | X | X | X | X | X | X | X | X | X | X | X |
| Interleukin-6 | X | X | X | X | X | ||||||
| Fibrinogen | X | X | X | X | |||||||
| sE-selectin | X | X | X | ||||||||
| sICAM-1 | X | X | X | ||||||||
| WBC count | X | ||||||||||
| Metabolic | |||||||||||
| HbA1c | X | X | X | X | X | X | X | X | |||
| Glucose | X | X | X | X | X | X | X | ||||
| BMI | X | X | X | X | X | X | X | X | X | ||
| Waist circumference | X | X | X | X | X | ||||||
| Waist-to-hip ratio | X | X | X | X | X | ||||||
| Insulin resistance | X | X | X | ||||||||
| Triglycerides | X | X | X | X | X | X | X | ||||
| HDL cholesterol | X | X | X | X | X | X | X | X | |||
| LDL cholesterol | X | X | X | X | X | ||||||
| Total cholesterol | X | X | X | X | |||||||
| Ratio of total to HDL cholesterol | X | ||||||||||
| Neuroendocrine | |||||||||||
| Cortisol | X | X | X | X | X | X | |||||
| CAR | X | X | |||||||||
| DHEA-S | X | X | X | X | X | X | |||||
| Epinephrine | X | X | X | X | X | X | |||||
| Norepinephrine | X | X | X | X | X | X | |||||
| SDRR | X | X | X | ||||||||
| RMSSD | X | X | X | ||||||||
| High frequency spectral power | X | X | X | ||||||||
| Low frequency spectral power | X | X | X | ||||||||
Notes: BP: Blood Pressure, sE-selectin: soluble adhesion molecule E-selectin, sICAM: soluble intracellular adhesion molecule-1, WBC: white blood cell, HbA1c: glycated hemoglobin, BMI: body mass index, HDL: high-density lipoprotein, LDL: low-density lipoprotein, CAR: cortisol awakening response, DHEA-S: dehydroepiandrosterone sulfate, SDRR: standard deviation of R-R (heartbeat to heartbeat) intervals, RMSSD: root mean square of successive differences
AL composite scores were calculated differently across studies (Table 5). Most frequently, AL composite scores were calculated by summing biomarker scores. Biomarkers were scored by assigning 1 point to biomarkers that were categorized as high risk, based on clinical recommendations, population-based cutoffs, sample biomarker distributions or medication use, and 0 points to biomarkers that were not (Allen, Thomas, et al., 2019; Cuevas et al., 2019; Currie, Copeland, & Metz, 2019; Currie, Copeland, Metz, et al., 2019; Rosemberg et al., 2019; Thomas et al., 2019; Upchurch et al., 2015). Other studies created an AL composite score by summing system level scores. System level scores were calculated by identifying the percent of biomarkers in that system considered to be high risk (Ong et al., 2017; Vadiveloo & Mattei, 2017; Zilioli et al., 2017). Two studies used the z-score approach, where they either summed or averaged each biomarkers’ z-score to create a summary AL score, (Allen, Thomas, et al., 2019; Daly et al., 2019) and one study created a binary AL variable that indicated high versus low AL scores (Vadiveloo & Mattei, 2017).
Table 5.
Analytic Approach and Main Findings
| First Author, Year | Discrimination Operationalization | AL Summary Score | Summary Score Distributions, Mean(SD)/% | Analytic Approach | Confounders/ Covariates | Main Findings |
|---|---|---|---|---|---|---|
| Allen, 2019 | Modified Version of Experiences of Discrimination Scale. Items (n=8) were scored on a 5-point Likert scale and summed to compute a score that ranged from 8 to 40. Categorized into none (8), low (9–16), moderate (17–24), high (25–32) and very high (33–40) levels of discrimination for analyses, with moderate being the reference group. | 15 biomarkers. Four composite measures of AL were calculated. The first and second were a sum of biomarkers that were above a subclinical cut-point or above the 75th (AL75) or 90th percentile (AL90), respectively. The third was a sum score based on established cut-points for subclinical and clinical risk or the IQR (ALIQR). The fourth was a sum of z-scores for each biomarker (ALZ). |
Discrimination:
|
Multivariable regression. Ordinary least squares and ordered logistic models were used depending on the dependent variable. | Age, educational attainment, and medication use were included in models regardless of significance. Other variables, including health insurance, poverty status, adjusted household size, marital status and neuroticism were included in models if significance was reached at p<0.10. |
|
| Cuevas, 2019 | Modified versions of the Major Experiences of Discrimination Scale and Everyday Experiences of Discrimination Scale. Both were scales scored on a 4-point Likert scale. Items were averaged to compute score that rangd from 0 to 3. | 11 biomarkers. One point was assigned to biomarkers outside of normal values or to account for medication use. Points were summed to compute an AL summary score, resulting in a possible range of 0 to 11. |
Discrimination:
|
Multivariable linear regression | Age, sex, marital status, language acculturation, years living in mainland US, educational attainment, income-to-poverty ration, employment status, work history, current employment status, alcohol consumption, smoking status, physical activity, diet quality, sleep quality and depressive symptoms |
|
| Currie, 2019a | Adapted one question from the Experiences of Discrimination Scale. Response options: rare/never, some of the time and most of the time. Operationalized as an ordinal measure in analysis. Two additional questions from the scale were used for descriptive purposes. | 7 biomarkers. One point was assigned to each biomarker if the biomarker was in a high-risk quartile. Points were summed to compute an AL summary score, resulting in a possible range of 0 to 6. |
Discrimination:
|
Bootstrapped linear regression (k=5000) | Age, gender, indigenous group, current income group, marital status, number of children, being a single parent, attendance at a residential school and medication use were tested in individual models before entry into main model. Variables that were associated with AL at p<0.20 were retained. These including age and current income. |
|
| Currie 2019b | Experiences of Discrimination Scale. Score was derived by counting the number of situations (1 to 9) in which racial discrimination was experienced in the past 12 months. Participants were also asked two questions for descriptive purposes. | 7 biomarkers. One point was assigned to each biomarker if the biomarker was in a high-risk quartile. Points were summed to compute an AL summary score, resulting in a possible range of 0 to 6. |
Discrimination:
|
Bootstrapped linear regression (k=5000) | Age, sex and socioeconomic status |
|
| Daly, 2019 | Modified version of the Everyday Discrimination Scale. Defined weight-based discrimination as attributing any form of discrimination to weight. Operationalized as binary variable in analyses. | 9 biomarkers. AL summary score was calculated by avering the computed z-scores for each biomarker. Summary scores were standardized with a mean of 0 and a standard deviation of 1. |
Discrimination:
|
Latent-change-score (LCS) approach | Baseline physiological dysregulation, age, sex, ethnicity, degree qualification, household weather, medication use, chronic conditions, and depressive symptoms. |
|
| Ong, 2017 | Everyday unfair treatment was assessed using the Everyday Discrimination Scale. Items (n=9) were scored on a 4-point Likert scale and summed. Lifetime unfair treatment was assessed using the Major Experiences of Discrimination Scale. Summary score calculated by coding responses into categories including none, 1 to 2, and 3 or more instances for analyses. | 22 biomarkers. Risk scores (0–1) were created for seven systems depending on the percent of biomarkers in that system that were high-risk. System level risk scores were summed to compute an AL summary score resulting in a possible range of 0 to 7. |
Discrimination:
|
Multivariate linear regression | Age (in years), gender, and educational attainment, medication use, smoking status, presence of alcohol problems, depression symptomatology and global perceived stress |
|
| Rosemberg, 2019 | Everyday Discrimination Scale. Items (n=9) were scored on a 6-point Likert scale. Items that were experienced a few times a year or more were scored “1”. Dichotomized item scores were summed. For some analyses, discrimination was dichomotized as high (experiencing any item a few times a year or more) verse low. | 9 biomarkers. Two composite measures of AL were calculated. First, the number of high-risk biomarkers were summed to create an AL-clinical score. Second, high-risk quartiles were summed to compute an AL-quartile score. Both summary scores had a possible range of 0 to 9. Medication use was adjusted for. |
Discrimination:
|
Multiple linear regression, Pearson correlation analyses, t-tests | Age, education, income, hourly wage, insurance, race, foreign born status, marital status, smoking status and alcohol use |
|
| Thomas, 2019 | Everyday Discrimination Scale. Items (n=10) were scored on a 6-point Likert and summed to compute a score that ranged from 10 to 60. Categorized into none (≤ 20), low (21–30) moderate (31–40), high (41–50) and very high (51–60). Instiutional discrimination was measured using the. Experiences of Discrimination Scale. Items (n=8) were scored on a 5-point Likert scale and summed to compute a score that ranged from 8 to 40. Categorized into none (8), low (9–16), moderate (17–24), high (25–32) and very high (33–40). | 15 biomarkers. One point was assigned to high-risk biomarkers. Biomarkers were summed to compute an AL summary score, resulting in a possible range of 0 to 15. |
Discrimination:
|
Multiple linear regression | Age, education, employment, poverty, marital/partnership status, medication use |
|
| Upchurch, 2015 | Modified version of the Everyday Discrimination Scale. Items (n=10) were scored on a 4-point Likert scale and averaged within each year and then used as a simple latent variables of discrimination. | 11 biomarkers. AL summary score was computed by summing the number of biomarkers in a high-risk quartile, resulting in a possible range of 0 to 11. |
Discrimination:
|
Latent growth curve analysis | Race, educational attainment, household income, marital status, men (demographic variables included in latent growth curve) |
|
| Vadiveloo, 2017 | Everyday Discrimination Scale. Items (n=9) were scored on a 4-point Likert scale. A continuous measure of discrimination was computed for individuals who reported weight as a primary reason for discrimination. A categorical indicator variable was created for individuals experienced any verse no weight discrimination. | 24 biomarkers. AL summary score was computed by summing risk scores across seven systems, resulting in a possible range of 0 to 7. Individuals that reported use of medication were categorized as high risk for that parameter. A binary indicator variable was created for high versus low AL, in which scores ≥3 were considered “high” and scores <3 were considered “low. |
Discrimination:
|
Mixed linear regression and Poisson regression | Sex, age, race, household income, educational attainment, smoking status, physical activity, baseline body mass index, and discrimination related to age, race and/or sex |
|
| Zilioli, 2017 | Everyday Discrimination Scale. Items (n=9) were scored on a 4-point Likert scale and summed to compute a score that ranged from 9 to 30. | 24 biomarkers. Risk scores (0–1) were created for seven systems depending on the percent of biomarkers in that system that were high-risk. System level risk scores were summed to compute an AL summary score, resulting in a possible range of 0 to 7. |
Discrimination:
|
Multiple linear regression | Age, gender, presence of chronic conditions in the past 12 months, and psychological covariates (anger in, anger out, trait anger, positive affect and negative affect) |
|
Note:β indicates a standardized coefficient; AL: Allostatic Load; NR: Not Reported; CI: Confidence Interval
Types of Discrimination Measured
Several types of discrimination were measured in this analytic sample. Three of the articles focused on discrimination due to race, ethnicity or skin color (Allen, Thomas, et al., 2019; Currie, Copeland, & Metz, 2019; Currie, Copeland, Metz, et al., 2019) and two of the articles focused on discrimination due to weight (Daly et al., 2019; Vadiveloo & Mattei, 2017). The remaining articles measured perceived discrimination/unfair treatment for any reason, including everyday (Cuevas et al., 2019; Ong et al., 2017; Rosemberg et al., 2019; Thomas et al., 2019; Upchurch et al., 2015; Zilioli et al., 2017), major lifetime (Cuevas et al., 2019) and/or experiences of discrimination across institutions (Thomas et al., 2019). One article focused on discrimination that was experienced during childhood (Currie, Copeland, & Metz, 2019). Three articles measured more than one type of perceived discrimination (Cuevas et al., 2019; Ong et al., 2017; Thomas et al., 2019), one of which included the second type of discrimination as a covariate (Ong et al., 2017). Further details on the operationalization of discrimination can be found in Table 5.
Analytic Approach
Multiple linear regression was the most frequently used analytic approach among the 11 studies (Cuevas et al., 2019; Rosemberg et al., 2019; Thomas et al., 2019; Zilioli et al., 2017). Two studies, which completed their analyses in the same study population, examined the association between discrimination and allostatic load using bootstrapped linear regresion (Currie, Copeland, & Metz, 2019; Currie, Copeland, Metz, et al., 2019). One study used multivariate linear regression (Ong et al., 2017) and one study used ordiniary least sqaures or ordered logisitic models dependent upon the dependent variable (Allen, Thomas, et al., 2019) . The longitudinal studies included in this review used a latent-change-score approach (Daly et al., 2019), latent growth curve analysis (Upchurch et al., 2015), and mixed linear and poisson regression (Vadiveloo & Mattei, 2017).
Main Findings
Objective 1
The main findings are highlighted in Table 5. A significant, positive association was found between discrimination and AL in nine of the studies (Cuevas et al., 2019; Currie, Copeland, & Metz, 2019; Currie, Copeland, Metz, et al., 2019; Daly et al., 2019; Ong et al., 2017; Rosemberg et al., 2019; Upchurch et al., 2015; Vadiveloo & Mattei, 2017; Zilioli et al., 2017). Among these, major lifetime discrimination (Cuevas et al., 2019), childhood racial discrimination (Currie, Copeland, & Metz, 2019), past-year discrimination (Currie, Copeland, Metz, et al., 2019), everyday discrimination/unfair treatment (Ong et al., 2017; Rosemberg et al., 2019; Upchurch et al., 2015; Zilioli et al., 2017), and everyday weight discrimination (Daly et al., 2019; Vadiveloo & Mattei, 2017) were found to be predictive of higher AL in adults. Of the studies that found a significant, positive association between discrimination an AL, four were among samples that included one minority/ethnic group (Cuevas et al., 2019; Currie, Copeland, & Metz, 2019; Currie, Copeland, Metz, et al., 2019; Ong et al., 2017), three were among predominantly (>90%) White samples (Daly et al., 2019; Vadiveloo & Mattei, 2017; Zilioli et al., 2017), and two were among samples that included several racial/ethnic groups (Rosemberg et al., 2019; Upchurch et al., 2015). The two studies that included several racial/ethnic groups only included females in their samples (Rosemberg et al., 2019; Upchurch et al., 2015).
Contrastingly, Allen et al. and Thomas et al. both found that individuals reporting very high discrimination (racial and everyday) had significantly lower AL scores than individuals with moderate discrimination (Allen, Thomas, et al., 2019; Thomas et al., 2019). These two analyses were done in the same sample of African American women.
In the studies that measured more than one type of discrimination, none found significant associations between both types of discrimination and AL. Specifically, Thomas et al. did not find a significant association between experiences of discrimination across institutions and AL (Thomas et al., 2019) and Cuevas et al. did not find a significant association between everyday discrimination and AL (Cuevas et al., 2019), and Ong et al. did not find a relationship between lifetime unfair treatment and AL (Ong et al., 2017).
Objective 2
The second objective of this review was to identify if the association between discrimination and AL differed based on race/ethnicity, gender, or socioeconomic status. A total of 7 studies explored moderating effects of discrimination and AL by interaction terms or stratification (Allen, Thomas, et al., 2019; Cuevas et al., 2019; Currie, Copeland, & Metz, 2019; Currie, Copeland, Metz, et al., 2019; Daly et al., 2019; Ong et al., 2017; Vadiveloo & Mattei, 2017), in which several studies tested the moderating effects of socioeconomic status, including education, poverty status, income group, and several studies tested the moderating effects of sex/gender. No study tested the moderating effects of race/ethnicity.
One study found a difference in the association between discrimination and AL by education level (Allen, Thomas, et al., 2019; Upchurch et al., 2015). Specifically, Allen and colleagues found that individuals experiencing low or high perceived racial discrimination who had a high school diploma or more had lower levels of AL compared to individuals of a lower education level who experienced the same levels of racial discrimination (Allen, Thomas, et al., 2019). The same study found that the association between discrimination and AL varied by poverty status, however, this finding was only significant for one of the four AL summary scores tested in their analyses (Allen, Thomas, et al., 2019). No other studies identified moderating effects of sociodemographic characteristics on the association between discrimination and AL. These findings are detailed in Table 5.
Select studies conceptualized and tested discrimination as a mediator between sociodemographic characteristics and AL. For example, Upchurch and colleagues (2015) found that discrimination was a significant mediator between sociodemographic factors and AL intercept, which represented the long-term effects of these factors. More specifically, using latent class growth analysis, the authors identified African American race to be an indirect and significant predictor of AL intercept through discrimination (p<0.001) and lower income to be an indirect and significant predictor of AL intercept through discrimination (p<0.001). In the same model, discrimination did not mediate the association between being White, education status, being married or age and AL intercept. Discrimination was also a direct and significant predictor of AL intercept (p<0.05), as described above in objective 1. Discrimination did not directly predict AL slope, nor did it mediate the association between other sociodemographic factors and AL slope, which represented the short-term effects of these factors during the study duration (Upchurch et al., 2015). In a separate study, Zilioli and colleagues identified that socioeconomic disadvantage had a significant indirect effect on AL through perceived discrimination (95% CI: 0.0013, 0.0244), however, these analyses lacked longitudinal data (Zilioli et al., 2017).
Discussion
Understanding the contribution of psychosocial stressors, including discrimination, on the physiologic dysregulation of the body is an area that requires further research. As such, this integrative review of literature sought to understand the association between discrimination and AL in adults, in addition to how this association may differ by sociodemographic characteristics, including race/ethnicity, sex, and socioeconomic status. In our review of 11 studies, we found that discrimination was positively associated with AL in adults in most studies (n=9), and that this association varied by education level (n=1). However, due to the various types of discrimination and AL measurements utilized, drawing conclusions remains difficult.
A majority of the articles included in this review reported a significant, positive association between discrimination and AL. Three of these studies measured more than one type of discrimination, in which mixed findings were noted. The studies were predominantly cross-sectional in design, limiting the strength of the findings. A study that assessed the baseline and long-term effects of discrimination did note that individuals experiencing long-term discrimination had a higher risk for obesity than those who experienced baseline-only or no discrimination. This finding underscores the importance of investigating the long-term and chronic effects of discrimination, as AL is conceptualized as cumulative risk, and therefore would likely be affected by repeated stressors overtime.
The way in which AL was derived is likely to influence the findings. To date, there is no gold standard to calculate AL (Duong et al., 2017). As such, we observed considerable differences in which biomarkers were included in the measurement of AL and how the summary score is calculated. All studies in this review included at least one biomarker from the cardiovascular, metabolic and immune systems. However, the range of biomarkers in each system and the measurement methods of individual biomarkers varied widely. For example, cortisol may be assessed using a hair test, a salivary test, or a blood test, and this choice may have implications on results of the study (Levine, Zagoory-Sharon, Feldman, Lewis, & Weller, 2007). Further, even if identical biomarkers were utilized in two studies, the summary score may be more or less sensitive to specific biomarkers or populations (Duong et al., 2017; R. P. Juster et al., 2010; Li, Rosemberg, Dalton, Lee, & Seng, 2019). These differences present challenges in comparing results across studies. Despite these discrepancies in AL measurement, there is general consensus that the measure of AL should include cardiovascular, metabolic, neuroendocrine and immune biomarkers (Duong et al., 2017; R. P. Juster et al., 2010). Inasmuch, future studies should aim to include, to the extent possible, biomarkers in each of these physiologic systems.
The association between discrimination and AL was examined with several analytic approaches. These approaches, in many instances, were a reflective of the way in which discrimination and AL were derived, which as discussed above, do not have a gold standard measurement. Nonetheless, these differences should be taken into consideration when interpreting results. For example, many studies dichotomized discrimination and/or AL in analyses, which decreases the variability in summary scores and our ability to distinguish small differences (Altman & Royston, 2006). Other studies categorized discrimination into levels or frequencies, which provides more variability than a dichotomous score, but still may influence the findings. In fact, the two studies that categorized discrimination into 5 levels were the only studies to identify a negative relationship between discrimination and AL, in that individuals experiencing very high discrimination had significantly lower AL than those experiencing moderate discrimination (Allen, Thomas, et al., 2019; Thomas et al., 2019). It is important that investigators consider these factors carefully and identify modeling strategies that are aligned with their conceptualization of the constructs and the relationship of interest.
One study in this review found evidence that educational attainment moderates the relationship between discrimination and AL (Allen, Thomas, et al., 2019). However, no other study found evidence that sociodemographic characteristics moderate this relationship. Due to several of the samples being limited to one racial/ethnic group and/or one gender, subgroup analyses for demographic characteristics, specifically race and ethnicity, were not completed in many of the articles. This gap highlights the need for future work in investigating how a person’s sociodemographic characteristics influence their stress response to discrimination. A previous review of research examining the influence of discrimination on HPA axis activity, a key element in AL and the appraisal of psychosocial stressors, highlighted the possibility of sociodemographic characteristics, specifically socioeconomic status and race, moderating this relationship (Busse, Yim, Campos, & Marshburn, 2017). Similarly, in a meta-analytic review analyzing discrimination and health, authors hypothesized that identity groups would moderate the relationship between discrimination and the stress response (Pascoe & Smart Richman, 2009). Both reviews reiterated the need for future research in this area.
Two studies in this review conceptualized discrimination as a mediator between sociodemographic factors and AL (Upchurch et al., 2015; Zilioli et al., 2017). Upchurch and colleagues identified several sociodemographic factors that were indirectly or directly associated with AL intercept and slope, including race, income, age and education. However, having a lower income and being African American were the only two that had an indirect effect on AL intercept through discrimination (Upchurch et al., 2015). Similarly, Zilioli and colleagues identified that socioeconomic disadvantage had a significant indirect effect on AL through perceived discrimination (Zilioli et al., 2017), These findings underscore the importance of researchers being clear on the theoretical conceptualization of the relationships of interest in order to identify key variables that contribute to the development of high AL and how it differs between groups of individuals. Doing so also provides a stronger platform to compare study findings and draw conclusions based on multiple sources of evidence.
This review has limitations. It is possible that there are articles that were missed in the search. To avoid this, key MeSH terms were utilized on the variables of interest, and an extensive search was conducted in four major electronic databases. Hand searching was also completed to address this concern. Much research about discrimination at the structural level does not use the term “discrimination” but may instead use a context-specific term such as “school funding” or “neighborhood access to greenspace”; these studies would not have appeared in our search so we may have inadvertently not included studies that analyzed discrimination beyond the interpersonal level. The search was limited to the English language, and therefore generalizability to studies in non-English languages is not possible. Publication bias may also exist, as authors may be less likely to publish on studies in which they did not find significant associations between variables. Lastly, this reiew was conducted without consultation from a health science librarian or pre-registration in PROSPERO. Despite these limitations, this review has several strengths. To our knowledge, it is the first integrative review to examine the literature on the association between discrimination and AL. In doing so, a thorough and comprehensive search strategy was developed a priori to capture relevant literature. This review takes into account several types of discrimination, providing an overview of how the body’s physiologic dysregulation due to stress might change based on the manner of unfair treatment. Lastly, it provides critique on measurement of AL, offering direction for future research and exploration surrounding discrimination, AL, and disparities in AL.
Conclusion
Our review of 11 articles demonstrates evidence that discrimination, irrespective of type, is associated with AL in adults, and that this relationship may be moderated by educational attainment. At the time of this review, there is no evidence that this relationship is moderated by sex/gender, however, additional longitudinal studies are warranted to better understand these relationships. Moreover, multi-racial and ethnic studies are needed to investigate whether race or ethnicity moderates the relationship between discrimination and AL.
This review underscores the importance of addressing psychosocial and structural factors that affect individuals and communities in order to improve health outcomes. Future research should focus on better understanding how long-term psychosocial stressors, such as discrimination, contribute to increased AL through the utilization of prospective studies and diverse samples. Importantly, socio-cultural and demographic characteristics should be taken into consideration when evaluating these relationships in order to better understand the disparities observed in AL.
Supplementary Material
Highlights:
Evidence indicates that discrimination is positively related to allostatic load in adults
Distinct sources of discrimination may influence allostatic load differently
The relationship between discrimination and allostatic load may differ by educational attainment
Acknowledgement of funding:
HM was supported by the National Institute of Nursing Research grant number T32NR012704. RJT was supported by the National Institute on Aging (K02AG059140) and the National Institute on Minority Health and Health Disparities (U54MD000214).
Footnotes
Publisher's Disclaimer: This is a PDF file of an unedited manuscript that has been accepted for publication. As a service to our customers we are providing this early version of the manuscript. The manuscript will undergo copyediting, typesetting, and review of the resulting proof before it is published in its final form. Please note that during the production process errors may be discovered which could affect the content, and all legal disclaimers that apply to the journal pertain.
The authors have no competing interests to report.
Contributor Information
Janna Stephens, The Ohio State University College of Nursing.
Roland J. Thorpe, Jr, Johns Hopkins University Bloomberg School of Public Health.
References
- Allen A, Thomas M, Michaels E, Reeves A, Okoye U, P. MM, … Chae D (2019). Racial discrimination, educational attainment, and biological dysregulation among midlife African American women. Psychoneuroendocrinology, 99(PG-225–235), 225–235. 10.1016/j.psyneuen.2018.09.001 [DOI] [PMC free article] [PubMed] [Google Scholar]
- Allen A, Wang Y, Chae D, Price M, Powell W, Steed T, … Woods-Giscombe C (2019). Racial discrimination, the superwoman schema, and allostatic load: exploring an integrative stress-coping model among African American women. Annals of the New York Academy of Sciences, (PG-). 10.1111/nyas.14188 [DOI] [PMC free article] [PubMed] [Google Scholar]
- Altman DG, & Royston P (2006). The cost of dichotomising continuous variables. BMJ (Clinical Research Ed.), 332(7549), 1080. 10.1136/bmj.332.7549.1080 [DOI] [PMC free article] [PubMed] [Google Scholar]
- Bailey ZD, Krieger N, Agénor M, Graves J, Linos N, & Bassett MT (2017). Structural racism and health inequities in the USA: evidence and interventions. Lancet (London, England), 389(10077), 1453–1463. 10.1016/S0140-6736(17)30569-X [DOI] [PubMed] [Google Scholar]
- Beckie TM (2012). A systematic review of allostatic load, health, and health disparities. Biological Research for Nursing, 14(4), 311–346. 10.1177/1099800412455688 [DOI] [PubMed] [Google Scholar]
- Borrell LN, Dallo FJ, & Nguyen N (2010). Racial/ethnic disparities in all-cause mortality in U.S. adults: the effect of allostatic load. Public Health Reports (Washington, D.C.: 1974), 125(6), 810–816. 10.1177/003335491012500608 [DOI] [PMC free article] [PubMed] [Google Scholar]
- Busse D, Yim IS, Campos B, & Marshburn CK (2017). Discrimination and the HPA axis: current evidence and future directions. Journal of Behavioral Medicine, 40(4), 539–552. 10.1007/s10865-017-9830-6 [DOI] [PubMed] [Google Scholar]
- Castagne R, Gares V, Karimi M, Chadeau-Hyam M, Vineis P, Delpierre C, & Kelly-Irving M (2018). Allostatic load and subsequent all-cause mortality: which biological markers drive the relationship? Findings from a UK birth cohort. European Journal of Epidemiology, 33(5), 441–458. 10.1007/s10654-018-0364-1 [DOI] [PMC free article] [PubMed] [Google Scholar]
- Centers for Disease Control and Prevention. (2019a). About Chronic Diseases. Retrieved December 9, 2019, from https://www.cdc.gov/chronicdisease/about/index.htm
- Centers for Disease Control and Prevention. (2019b). Health and Economic Costs of Chronic Diseases. Retrieved December 9, 2019, from https://www.cdc.gov/chronicdisease/about/costs/index.htm
- Chyu L, & Upchurch DM (2011). Racial and ethnic patterns of allostatic load among adult women in the United States: findings from the National Health and Nutrition Examination Survey 1999–2004. Journal of Women’s Health (2002), 20(4), 575–583. 10.1089/jwh.2010.2170 [DOI] [PMC free article] [PubMed] [Google Scholar]
- Cuevas A, Wang K, Williams D, Mattei J, Tucker K, & Falcon L (2019). The Association Between Perceived Discrimination and Allostatic Load in the Boston Puerto Rican Health Study. Psychosomatic Medicine, 81(7), 659–667. 10.1097/PSY.0000000000000715 [DOI] [PMC free article] [PubMed] [Google Scholar]
- Currie C, Copeland J, & Metz G (2019). Childhood racial discrimination and adult allostatic load: The role of Indigenous cultural continuity in allostatic resiliency. Social Science and Medicine, 241(September), 112564. 10.1016/j.socscimed.2019.112564 [DOI] [PubMed] [Google Scholar]
- Currie C, Copeland J, Metz G, Moon-Riley K, & Davies C (2019). Past-year racial discrimination and allostatic load among Indigenous adults in Canada: The role of cultural continuity. Psychosomatic Medicine, (PG-). 10.1097/PSY.0000000000000754 [DOI] [PMC free article] [PubMed] [Google Scholar]
- Daly M, Sutin AR, & Robinson E (2019). Perceived Weight Discrimination Mediates the Prospective Association Between Obesity and Physiological Dysregulation: Evidence From a Population-Based Cohort. Psychological Science, 30(7), 1030–1039. 10.1177/0956797619849440 [DOI] [PMC free article] [PubMed] [Google Scholar]
- Duong MT, Bingham BA, Aldana PC, Chung ST, & Sumner AE (2017). Variation in the Calculation of Allostatic Load Score: 21 Examples from NHANES. Journal of Racial and Ethnic Health Disparities, 4(3), 455–461. 10.1007/s40615-016-0246-8 [DOI] [PMC free article] [PubMed] [Google Scholar]
- Geronimus AT, Hicken M, Keene D, & Bound J (2006). “Weathering” and age patterns of allostatic load scores among blacks and whites in the United States. American Journal of Public Health, 96(5), 826–833. 10.2105/AJPH.2004.060749 [DOI] [PMC free article] [PubMed] [Google Scholar]
- Goldman N, Turra CM, Glei DA, Lin Y-H, & Weinstein M (2006). Physiological dysregulation and changes in health in an older population. Experimental Gerontology, 41(9), 862–870. 10.1016/j.exger.2006.06.050 [DOI] [PubMed] [Google Scholar]
- Goosby B, Cheadle J, & Mitchell C (2018). Stress-Related Biosocial Mechanisms of Discrimination and African American Health Inequties. Annual Review of Sociology. [DOI] [PMC free article] [PubMed] [Google Scholar]
- Gruenewald TL, Seeman TE, Karlamangla AS, & Sarkisian CA (2009). Allostatic load and frailty in older adults. Journal of the American Geriatrics Society, 57(9), 1525–1531. 10.1111/j.1532-5415.2009.02389.x [DOI] [PMC free article] [PubMed] [Google Scholar]
- Jones CP (2000). Levels of racism: A theoretic framework and a gardener’s tale. American Journal of Public Health, 90(8), 1212–1215. 10.2105/AJPH.90.8.1212 [DOI] [PMC free article] [PubMed] [Google Scholar]
- Juster R-P, Marin M-F, Sindi S, Nair NPV, Ng YK, Pruessner JC, & Lupien SJ (2011). Allostatic load associations to acute, 3-year and 6-year prospective depressive symptoms in healthy older adults. Physiology & Behavior, 104(2), 360–364. 10.1016/j.physbeh.2011.02.027 [DOI] [PubMed] [Google Scholar]
- Juster RP, McEwen BS, & Lupien SJ (2010). Allostatic load biomarkers of chronic stress and impact on health and cognition. Neuroscience and Biobehavioral Reviews, 35(1), 2–16. 10.1016/j.neubiorev.2009.10.002 [DOI] [PubMed] [Google Scholar]
- Karlamangla AS, Singer BH, & Seeman TE (2006). Reduction in allostatic load in older adults is associated with lower all-cause mortality risk: MacArthur studies of successful aging. Psychosomatic Medicine, 68(3), 500–507. 10.1097/01.psy.0000221270.93985.82 [DOI] [PubMed] [Google Scholar]
- Krieger N (2012). Methods for the scientific study of discrimination and health: an ecosocial approach. American Journal of Public Health, 102(5), 936–944. 10.2105/AJPH.2011.300544 [DOI] [PMC free article] [PubMed] [Google Scholar]
- Levine A, Zagoory-Sharon O, Feldman R, Lewis JG, & Weller A (2007). Measuring cortisol in human psychobiological studies. Physiology & Behavior, 90(1), 43–53. 10.1016/j.physbeh.2006.08.025 [DOI] [PubMed] [Google Scholar]
- Li Y, Rosemberg M-AS, Dalton VK, Lee SJ, & Seng JS (2019). Exploring the optimal allostatic load scoring method in women of reproductive age. Journal of Advanced Nursing, 75(11), 2548–2558. 10.1111/jan.14014 [DOI] [PubMed] [Google Scholar]
- Mattei J, Demissie S, Falcon L, Ordovas J, & Tucker K (2010). Allostatic load is associated with chronic conditions in the Boston Puerto Rican Health Study. Social Science and Medicine, 70(12), 1988–1996. 10.1016/j.socscimed.2010.02.024 [DOI] [PMC free article] [PubMed] [Google Scholar]
- McEwen BS (1998). Stress, Adaption and Disease: Allostatis and Allostatic Load. Annals of New York Academy of Sciences, 112(483), 211–212. 10.1192/bjp.112.483.211-a [DOI] [PubMed] [Google Scholar]
- McEwen BS (2004). Protection and damage from acute and chronic stress: allostasis and allostatic overload and relevance to the pathophysiology of psychiatric disorders. Annals of the New York Academy of Sciences, 1032, 1–7. 10.1196/annals.1314.001 [DOI] [PubMed] [Google Scholar]
- McEwen BS, & Stellar E (1993). Stress and the Individual: Mechanisms Leading to Disease. Arch Intern Med, 153, 2093–2101. [PubMed] [Google Scholar]
- Moher D, Liberati A, Tetzlaff J, & Altman DG (2009). Preferred reporting items for systematic reviews and meta-analyses: the PRISMA statement. PLoS Medicine, 6(7), e1000097. 10.1371/journal.pmed.1000097 [DOI] [PMC free article] [PubMed] [Google Scholar]
- Moola S, Munn Z, Tufanaru C, Aromataris E, Sears K, Sfetcu R, Currie M, Qureshi R, Mattis P, Lisy K, M. P-F (2017). Systematic reviews of etiology and risk. In Aromataris E & Munn Z (Eds.), Joanna Briggs Institute Reviewer’s Manual. The Joanna Briggs Institute. [DOI] [PubMed] [Google Scholar]
- Ong A, Williams D, Nwizu U, & Gruenewald T (2017). Everyday unfair treatment and multisystem biological dysregulation in African American adults. Cultural Diversity & Ethnic Minority Psychology, 23(1), 27–35. 10.1037/cdp0000087 [DOI] [PMC free article] [PubMed] [Google Scholar]
- Pascoe EA, & Smart Richman L (2009). Perceived discrimination and health: a meta-analytic review. Psychological Bulletin, 135(4), 531–554. 10.1037/a0016059 [DOI] [PMC free article] [PubMed] [Google Scholar]
- Rosemberg M, Li Y, McConnell D, McCullagh M, & Seng J (2019). Stressors, allostatic load, and health outcomes among women hotel housekeepers: A pilot study. Journal of Occupational and Environmental Hygiene, 16(3 PG-206–217), 206–217. 10.1080/15459624.2018.1563303 [DOI] [PMC free article] [PubMed] [Google Scholar]
- Seeman TE, Singer BH, Rowe JW, Horwitz RI, & McEwen BS (1997). Price of adaptation--allostatic load and its health consequences. MacArthur studies of successful aging. Archives of Internal Medicine, 157(19), 2259–2268. [PubMed] [Google Scholar]
- Seeman T, Merkin SS, Crimmins E, Koretz B, Charette S, & Karlamangla A (2008). Education, income and ethnic differences in cumulative biological risk profiles in a national sample of US adults: NHANES III (1988–1994). Social Science & Medicine (1982), 66(1), 72–87. 10.1016/j.socscimed.2007.08.027 [DOI] [PMC free article] [PubMed] [Google Scholar]
- Seplaki CL, Goldman N, Weinstein M, & Lin Y-H (2004). How are biomarkers related to physical and mental well-being? The Journals of Gerontology. Series A, Biological Sciences and Medical Sciences, 59(3), 201–217. 10.1093/gerona/59.3.b201 [DOI] [PubMed] [Google Scholar]
- Sterling P, & Eyer J (1988). Allostasis: A new paradigm to explain arousal pathology. In Fisher S & Reason J (Eds.), Handbook of life stress, cognition, and health (pp. 629–649). New York, NY: Wiley. [Google Scholar]
- Suglia SF, Koenen KC, Boynton-Jarrett R, Chan PS, Clark CJ, Danese A, … Zachariah JP (2018). Childhood and Adolescent Adversity and Cardiometabolic Outcomes: A Scientific Statement From the American Heart Association. Circulation, 137(5), e15–e28. 10.1161/CIR.0000000000000536 [DOI] [PMC free article] [PubMed] [Google Scholar]
- Szanton SL, Allen JK, Seplaki CL, Bandeen-Roche K, & Fried LP (2009). Allostatic load and frailty in the women’s health and aging studies. Biological Research for Nursing, 10(3), 248–256. 10.1177/1099800408323452 [DOI] [PMC free article] [PubMed] [Google Scholar]
- Thomas M, Michaels E, Reeves A, Okoye U, Price M, Hasson R, … Allen A (2019). Differential associations between everyday versus institution-specific racial discrimination, self-reported health, and allostatic load among black women: implications for clinical assessment and epidemiologic studies. Annals of Epidemiology, 35, 20–28.e3. 10.1016/j.annepidem.2019.05.002 [DOI] [PMC free article] [PubMed] [Google Scholar]
- Upchurch D, Stein J, Greendale G, Chyu L, Tseng C, Huang M, … Seeman T (2015). A Longitudinal Investigation of Race, Socioeconomic Status, and Psychosocial Mediators of Allostatic Load in Midlife Women: Findings From the Study of Women’s Health Across the Nation. Psychosomatic Medicine, 77(4), 402–412. 10.1097/PSY.0000000000000175 [DOI] [PMC free article] [PubMed] [Google Scholar]
- Vadiveloo M, & Mattei J (2017). Perceived Weight Discrimination and 10-Year Risk of Allostatic Load Among US Adults. Annals of Behavioral Medicine : A Publication of the Society of Behavioral Medicine, 51(1), 94–104. 10.1007/s12160-016-9831-7 [DOI] [PMC free article] [PubMed] [Google Scholar]
- Yang Y, & Kozloski M (2011). Sex differences in age trajectories of physiological dysregulation: inflammation, metabolic syndrome, and allostatic load. The Journals of Gerontology. Series A, Biological Sciences and Medical Sciences, 66(5), 493–500. 10.1093/gerona/glr003 [DOI] [PMC free article] [PubMed] [Google Scholar]
- Zilioli S, Imami L, Ong A, Lumley M, & Gruenewald T (2017). Discrimination and anger control as pathways linking socioeconomic disadvantage to allostatic load in midlife. Journal of Psychosomatic Research, 103, 83–90. 10.1016/j.jpsychores.2017.10.002 [DOI] [PubMed] [Google Scholar]
Associated Data
This section collects any data citations, data availability statements, or supplementary materials included in this article.