

Graphical abstract
The mobile phone is a fast-growing E-waste stream that includes hazardous substances and valuable metals. Smartphone touch screens (SPTS) contain a considerable amount of critical metals, such as indium and strontium that can be recovered from end of life devices as a secondary resource. Bioleaching is an emerging and environmentally friendly method for metal recovery from electronic waste. In the present study, bioleaching was assessed for the extraction of indium and strontium from organic light emitting diode type smartphone touch screens. A statistical approach based on the response surface methodology was successfully applied. The effects of influential variables: pH, ferrous sulfate, elemental sulfur, and solid content and their interactions on indium and strontium recovery using adapted Acidithiobacillus ferrooxidans were evaluated. Under optimum conditions (ferrous sulfate: 13.0 g/L; solid content; 3.0 g/L; elemental sulfur: 5.6 g/L; and initial pH of 1.1), a complete indium extraction was observed, with a concentration in solution of about 200 mg/L indium. As concerns strontium, a 5% extraction efficiency was observed, which, even if quite low, resulted in a relatively high strontium concentration in solution, around 3000 mg/L, due to its high content in the solid (2%). This work opens new perspectives in the application of clean technologies for the extraction of valuable metals, such as indium and strontium from smartphone screens.

Keywords: Bioleaching, Waste OLED type SPTS, Indium recovery, Acidithiobacillus ferrooxidans, Strontium recovery, Optimization
Introduction
High consumption and short life span of smartphones have led to the accumulation of large amounts of end-of-life phones as waste electrical and electronic equipment (WEEE). With regard to the lifetime of a mobile phone (approximately 1 year), it is estimated that about 100 million mobile phones are discarded annually in the world [1].
Smartphones contain different electronic components such as printed wire boards, screens, batteries and plastics [2]. Smartphone touch screens (SPTS) are important components from the urban mining perspective because of their indium content. Indeed, indium has been classified as a critical raw material by European Commission standards because of its supply risk and economic importance [3, 4]. Smartphone screens comprise glass, organic materials, and electrodes. In the recent decade, the SPTS used OLED technology. OLEDs are an attractive type of flat panel display technology that is lightweight, transparent and offers tunable color. OLEDs have a conductive layer and emissive layer placed between two electrodes. The conductive layer is usually an organic plastic that transports the holes from the anodes while the emissive layer transport electrons from the cathodes. Indium is available in the anode as indium-tin-oxide (ITO). ITO is a mixture of In2O3 (80–90%) and SnO2 (10–20%) [5]. About 70% of the world’s production of indium is for the manufacture of ITO [6]. Indium is a critical metal, is present in small amounts (0.24 ppm) in the earth’s crust, and is a by-product of zinc mining [7]. The indium concentration in mineral ores is 1–100 ppm while the indium content of smart displays has been reported to be around 250 ppm [6]. Most strontium is used as the carbonate in special glass for television screens and visual display units. Strontium is an alkaline earth metal element with a content of 0.02–0.04% in the crust and 0.048% on the Earth’s surface. Because of its high chemical activity, it can only exist in the form of compounds in nature and not in its elemental state. This high chemical activity makes it very difficult to separate these alkaline earth elements. Strontium is present in smartphone touch screens more than 2000 ppm [8].
There is a need for a cost-effective treatment method to recover the precious metal and remove hazardous material from WEEE for a circular economy approach [9, 10]. Bioleaching is a new and eco-friendly approach to metal recovery from electronic waste. In this method, microorganisms convert insoluble metal compounds into a soluble form [11]. Research has shown that chemolithoautotrophic mesophilic bacteria are effective for bioleaching of e-waste [12]. The most common of these are acidophilic bacteria, especially Acidithiobacillus ferrooxidans, which obtains energy by oxidizing ferrous ions to ferric ions. This bacteria has proven to be effective for bioleaching of e-wastes such as household batteries [13], nickel-cadmium batteries [14], laptop lithium-ion batteries [15], and computer PCBs [16]. Indium recovery from liquid crystal panels has been performed using methods such as acid leaching [17], metalloids leaching [6], and grinding and electrical disintegration [5]. Jowkar et al., (2018) bioleached laptop monitor liquid crystal displays (LCD) which are rich in In and Sr. They used a high concentration of sulfur (8.6 g/L) for recovering total indium from LCD [18]. Currently, strontium is extracted from the soil where it is present in concentrations of about 30 ppm by bioleaching technology [19].
In bioleaching, various factors will affect the dissolution of the metallic fraction from SPTS waste. The use of ferrous iron and sulfur has its own challenges, its precipitation, and potential toxicity to bacteria. The jarosite and sulfur synthesized in the SPTS bioleaching system can get distributed on the SPTS surfaces and inhibit SPTS bioleaching. The environmental pH will influence the surface charge of both the material and the bacteria. The solid content has limiting role in scaling up bioleaching.
The best of our knowledge was to evaluate simultaneously effect of the two energy source and their interaction in In and Sr dissolution from SPTS waste. Therefore, the objectives of the present study were to (1) A bio-hydrometallurgical process was designed to recycle the spent OLEDs; (2) Suggest a cost-effective bioleaching process with low energy source concentration and high critical metal extraction efficiency for scale-up. RSM is a combination of mathematical and statistical methods for determining the effects of influential variables and optimizing the process; (3) reduction of jarosite and sulfur passive layer formation by optimization.
Materials and methods
Sample preparation
A sufficient number of SPTS were collected from electronic repair centers in Tehran, Iran. The touch screens were attached to a glass substrate that was first separated manually. Then, the SPTS was cut into small pieces (1 cm2) with scissors. Subsequently, a manual mill was used to reduce the size of these parts to less than 1 mm. In order to achieve a fine powder with a particle size of fewer than 100 μm, it was ground in a ball mill for 13 h. The resulting powder was sieved through the #200 mesh in an orbital shaker to obtain a particle size of <75 μm.
The SPTS powder was digested by the alkaline digestion method. In this method, 0.25 g of sample powder was put into a platinum crucible, mixed with sodium potassium carbonate and boric acid at a ratio of 4:3, and heated to 950 °C in an electric furnace for 15 min. The contents were then cooled to room temperature and dissolved in HCL (1:1). Next, 10 ml of HNO3 and HCl (1:3) were added and the volume was adjusted to 100 mL using distilled water. The final solution was analyzed using inductively-coupled plasma optical emission spectrometer (ICP-OES). The results of ICP analysis indicated that the OLED powder consisted of high levels of strontium (20,500 mg/kg ±100) and indium (69 mg/kg ±1). The pH of the SPTS powder was measured by dissolving 1 g of the powder in 50 mL of deionized water. This was placed in a shaker incubator at 140 rpm and 25 °C for 24 h [20]. The pH of the sample was measured to be 7, which indicates the neutral nature of the SPTS.
Microorganism and culture medium
A. ferrooxidans (PTCC 1647) was purchased from the Iranian Research Organization for Science and Technology (IROST) in Tehran. A suitable culture medium for this microorganism is a 9K medium containing 3 g of (NH4)2SO4, 0.5 g of K2HPO4, 0.5 g of MgSO4.7H2O, 0.1 g of KCl, 0.01 g of Ca(NO3)2 and 44.22 g of FeSO4.7H2O in 1 L of distilled water. FeSO4.7H2O is the energy source for A. ferrooxidans growth and activity. The pH was adjusted to 2.0 using sulfuric acid 98%. 2 mL of A. ferrooxidans (6 × 10⁷ cells/mL) was added in 250 mL Erlenmeyer flask containing 100 mL of the medium and incubated at 140 rpm in an shaker incubator (Wise Cube; South Korea) at 29 °C [19].
Adaptation of bacteria to SPTS powder
In this study, A. ferrooxidans was initially cultivated in a 9K medium with 2% v/v inoculum ratio in a 250 mL Erlenmeyer flask containing 1 g/L SPTS powder. The flask was put in a shaker incubator at 140 rpm and 29 °C. When the cell count reached 5 × 10⁷ cells/mL, the bacteria were considered as adapted [19] and a new inoculum was carried out in the next stage, with higher SPTS solid content. The adaptation process was achieved by a stepwise increase in powder over five intervals from 1% to 2.5% w/v. Finally, 15 g/L was considered to be the threshold of bacterial resistance to the SPTS powder. The adapted bacteria were used for further bioleaching experiments.
Analytical methods
ICP-OES (Vista-pro; Varian; Australia) was used to measure the concentration of metals available in the SPTS powder and the leachate. X-ray diffraction (XRD) (Philips; the Netherlands) was used for detection of the component phases in the SPTS powder.
The original SPTS powder and bioleached SPTS were collected and dried at 70 °C, then all the samples attached to the special holder and were coated by a thin gold layer before observation by Scanning electron microscopy (SEM) (Prox; Phenom; the Netherlands). Fourier transform infrared spectroscopy (FTIR) (Frontier-Perkins Elmer; USA) was used to detect the chemical functional group of the sample. An Eh meter (Metrohm 691; Switzerland) equipped with Ag/AgCl reference electrode was utilized to measure the Eh value.
The ferric ion concentration in the solution was determined using the 5-sulfosalicylic acid (SSA) dehydrate method [21]. The sulfate ion concentration in bacteria culture was measured using the turbidimetry method based on the standard procedure [22, 23] by a spectrophotometer (Optizen 3220UV, Korea).
A digital multimeter (CP-500 L; ISTEK; South Korea) was used for measuring the pH of the solution wherever needed. Also, a cell count was conducted periodically under a phase-contrast microscope (Standard 25; Zeiss; Germany) at 1000× magnification in a Neubauer counting chamber with a depth of 0.1 mm and area of 0.0025 mm2.
All the tests were done in triplicate and the mean measured values were reported.
Design of experiments
RSM was used to optimize the bioleaching and investigate the effects of the parameters. The central composite design (CCD) in RSM, which fits second-order mathematical models, was used for the prediction of the relation between the process variables and responses and for optimization of the results [24]. The mathematical models are empirical, consequently, no detail about the reaction mechanism during modeling was required. In this method, the number of experiments was calculated to be 2k + na + n0, where k is the number of factors in the experiment, na is the number of axial points and n0 is the number of center points (4 in this study) [25].
The CCD uses five levels (−α, −1, 0, +1, +α) to represent the lowest and the highest values in the form of the coded values. The value of α is calculated as α = 2k/4 where k is the number of the influential factors chosen in the design of the experiment. In this study, the four variables of ferrous sulfate (FeSO4.7H2O) concentration and elemental sulfur concentration (S0) as energy sources, solid content for its inhibitory effect on bacterial growth and activity, and initial pH were considered. In accordance with the design of the experiments, the number of experiments required was calculated to be 28 runs. The recovery of In and Sr was selected as a response because they are the target metal of the bioleaching process. A.ferrooxidans can mediate leaching indirectly by oxidizing reduced elemental sulfur to generate sulfuric acid and oxidized ferrous iron to ferric iron. The solid content range was assigned according to the results of the adaptation process. The pH range and the maximum amount of ferrous sulfate and elemental sulfur were selected based on the literature [26]. Tables 1 and 2 show the levels and the values of the variables for 28 experiments, respectively. All experiments were carried out in 250 mL Erlenmeyer flasks containing 100 mL of culture medium with 5% inoculation. The experiments were performed in a shaker incubator at 140 rpm and 29 °C. Figure 1 is a bio-recycling process for SPTS.
Table 1.
Range of the independent factors used in design of the experiments
| Factors | Codes | Units | Coded variable levels | ||||
|---|---|---|---|---|---|---|---|
| −2 | −1 | 0 | +1 | +2 | |||
| FeSO4.7H2O | A | g/L | 0 | 11.17 | 22.35 | 33.53 | 44.7 |
| S0 | B | g/L | 0 | 2.5 | 5 | 7.5 | 10 |
| Solid content | C | g/L | 1 | 7 | 13 | 19 | 25 |
| Initial pH | D | – | 1 | 1.75 | 2.5 | 3.25 | 4 |
Table 2.
CCD matrix for four variables and three responses
| Run | Factors | Responses | ||||
|---|---|---|---|---|---|---|
| A: FeSO4.7H2O (g/L) |
B: S0 (g/L) | C: Solid content (g/L) |
D: Initial pH (g/L) |
In extraction efficiency (%) | Sr extraction efficiency (%) | |
| 1 | 33.53 | 7.50 | 19 | 1.75 | 100 | 2.50 |
| 2 | 22.35 | 0.00 | 13 | 2.50 | 100 | 1.50 |
| 3 | 11.17 | 7.50 | 7 | 3.25 | 66 | 4.30 |
| 4 | 33.53 | 7.50 | 7 | 3.25 | 72 | 4.00 |
| 5 | 11.17 | 2.50 | 7 | 1.75 | 100 | 4.80 |
| 6 | 33.53 | 7.50 | 19 | 3.25 | 80 | 3.50 |
| 7 | 33.53 | 2.50 | 19 | 3.25 | 74 | 2.50 |
| 8 | 11.17 | 7.50 | 19 | 3.25 | 78 | 3.00 |
| 9 | 11.17 | 2.50 | 19 | 1.75 | 66 | 2.00 |
| 10 | 44.70 | 5.00 | 13 | 2.5 | 65 | 3.00 |
| 11 | 11.17 | 7.50 | 7 | 1.75 | 100 | 5.00 |
| 12 | 11.17 | 2.50 | 19 | 3.25 | 65 | 2.00 |
| 13 | 22.35 | 5.00 | 13 | 2.5 | 100 | 4.00 |
| 14 | 22.35 | 5.00 | 13 | 4.00 | 50 | 4.00 |
| 15 | 0.00 | 5.00 | 13 | 2.50 | 14 | 2.00 |
| 16 | 22.35 | 5.00 | 13 | 1.00 | 100 | 5.00 |
| 17 | 22.35 | 5.00 | 1 | 2.50 | 100 | 7.00 |
| 18 | 11.17 | 2.50 | 7 | 3.25 | 58 | 4.00 |
| 19 | 22.35 | 5.00 | 13 | 2.50 | 100 | 4.00 |
| 20 | 33.53 | 7.50 | 7 | 1.75 | 89 | 4.00 |
| 21 | 33.53 | 2.50 | 19 | 1.75 | 100 | 2.50 |
| 22 | 11.17 | 7.50 | 19 | 1.75 | 98 | 3.50 |
| 23 | 22.35 | 5.00 | 13 | 2.50 | 100 | 3.50 |
| 24 | 22.35 | 5.00 | 25 | 2.50 | 100 | 2.50 |
| 25 | 22.35 | 5.00 | 13 | 2.50 | 100 | 3.50 |
| 26 | 33.53 | 2.50 | 7 | 1.75 | 100 | 4.00 |
| 27 | 22.35 | 10.00 | 13 | 2.50 | 100 | 4.00 |
| 28 | 33.53 | 2.50 | 7 | 3.25 | 97 | 3.50 |
Fig. 1.

Biorecycling process for SPTS
Results and discussion
Indium recovery
Table 2 shows indium extraction efficiencies observed in all the investigated treatments. In order to assess the effect of ferrous sulfate concentration, elemental sulfur, and solid content and initial pH on indium recovery, the experimental data on Table 2 were analyzed with response surface methodology (RSM) and the following model was achieved for the prediction of indium extraction efficiency (%):
| 1 |
Where Y is the predicted amount of indium extraction as the response. The constant values 100.00 are the offset terms and A, B, C, and D represent the FeSO4.7 H2O concentration (g/L), sulfur concentration (g/L), solid content (g/L), and initial pH, respectively.
The significance of the effect of parameters was evaluated by ANOVA and is shown in the ANOVA Table 3. The F-value (Fischer variation ratio) is the ratio between the model variance and the error variance. Relatively high F-value of models, and consequently low P-values denotes the significance of the source in the prediction model.
Table 3.
Summary of ANOVA results for RSM CCD
| Response | Model | Anova | ||||
|---|---|---|---|---|---|---|
| Source | sum of square | df | F-value | P-value | ||
| In recovery(%) | Quadratic | model | 11,289.96 | 14 | 9.82 | <0.0001 |
| A: FeSO4.7H2O | 1395.37 | 1 | 16.99 | 0.0012 | ||
| B: S0 | 22.04 | 1 | 0.27 | 0.6131 | ||
| C: solid content | 18.38 | 1 | 0.22 | 0.6441 | ||
| D: Initial pH | 2882.04 | 1 | 35.09 | <0.0001 | ||
| AB | 430.56 | 1 | 5.24 | 0.0394 | ||
| AC | 10.56 | 1 | 0.13 | 0.7256 | ||
| AD | 60.06 | 1 | 0.73 | 0.4080 | ||
| BC | 390.06 | 1 | 4.75 | 0.0483 | ||
| BD | 22.56 | 1 | 0.27 | 0.6090 | ||
| CD | 52.56 | 1 | 0.64 | 0.4381 | ||
| A2 | 4866.36 | 1 | 59.25 | <0.0001 | ||
| B2 | 18.82 | 1 | 0.23 | 0.6402 | ||
| C2 | 18.82 | 1 | 0.23 | 0.6402 | ||
| D2 | 690.69 | 1 | 8.41 | 0.0124 | ||
| Residual | 1067.75 | 13 | 82.13 | |||
| Lack of fit | 1067.75 | 10 | 106.87 | |||
| Pure error | 0.000 | 3 | 0.000 | |||
| Cor total | 12,357.71 | 27 | ||||
| Sr recovery(%) | Quadratic | model | 35.72 | 14 | 12.25 | 0.0001 |
| A: FeSO4.7H2O | 0.016 | 1 | 0.074 | 0.7893 | ||
| B: S0 | 3.58 | 1 | 18.49 | 0.0.0007 | ||
| C: solid content | 20.41 | 1 | 105.36 | 0.0001 | ||
| D: Initial pH | 0.33 | 1 | 1.72 | 0.2104 | ||
| AC | 0.62 | 1 | 3.20 | 0.0952 | ||
| AD | 0.34 | 1 | 1.75 | 0.2069 | ||
| BC | 0.095 | 1 | 0.49 | 0.4962 | ||
| BD | 0.026 | 1 | 0.14 | 0.7175 | ||
| CD | 1.15 | 1 | 5.94 | 0.0288 | ||
| A2 | 3.44 | 1 | 17.75 | 0.0009 | ||
| B2 | 2.17 | 1 | 11.22 | 0.0048 | ||
| C2 | 1.31 | 1 | 6.79 | 0.0208 | ||
| D2 | 0.31 | 1 | 1.61 | 02249 | ||
| Residual | 2.71 | 14 | 0.323 | |||
| Lack of fit | 2.56 | 11 | 4.59 | 0.1181 | ||
| Pure error | 0.15 | 3 | ||||
| Cor total | 38.43 | 27 |
A negative sign of the coefficient in Eq. (1) indicated that the metal recovery decreased as the level of the variable increased. Moreover, taking into account that variables are normalized before the regression, the highest is the coefficient, the highest is the contribution of the variable [27]. The negative effect of initial pH and solid content on metal recovery is evident: indium extraction efficiency decreases as either pH or solid content increases. Moreover, the highest coefficient of initial pH (factor D) in Eq. (1) indicates the dominance of the acid dissolution mechanism for In recovery: indeed, acidolysis of the indium oxide by biogenic sulfuric acid is supposed to occur.
The model indicates that a complete In recovery was achievable. Figure 2 shows the data predicted by the model versus the actual data collected from the experimental results. A graph of actual vs predicted helps to detect values that are not easily predicted by the model. The proximity of the data (scattered dots) to the 45° line as well as the high correlation coefficient between the experimental data and the predicted values (R2 > 0.9) for indium confirms the suitability of models for predicting the responses.
Fig. 2.

Predicted versus actual for In recovery
The empirical model also shows interactions between variables with negative effects (between ferrous sulfate (A) and solid content (C), and the amount of sulfur (B) and ferrous sulfate (A)). It is obvious from Eq. (1) that a greater amount of In bioleaching resulted from a higher amount of sulfur and ferrous sulfate concentration, but, at the same time, the negative quadratic effects and negative interactions between parameters had to be considered.
The effect of solid content and elemental sulfur content on In recovery was shown in Fig. 3a. It shows that, at high concentrations of elemental sulfur, more indium could be recovered at high pulp densities. Higher concentrations of elemental sulfur increased bacterial growth, and thus, increased production of biogenic sulfuric acid as an oxidant agent (according to Eq. (2)) [26]. In fact, an increase in initial elemental sulfur content in the system made more sulfur surfaces available for bacterial adsorption through an increase of the van der Waals force, which increased subsequent oxidation and metal recovery [28]. The metals reacted with acid according to the Eqs. (3–7). Therefore we can conclude that H2SO4 can be used as the leaching reagent [18]. A. ferrooxidans produces sulfuric acid according to Eq. (2). The protons attack In2O3 according to Eq. (8) and produced In3+ [29].
| 2 |
| 3 |
| 4 |
| 5 |
| 6 |
| 7 |
| 8 |
Fig. 3.
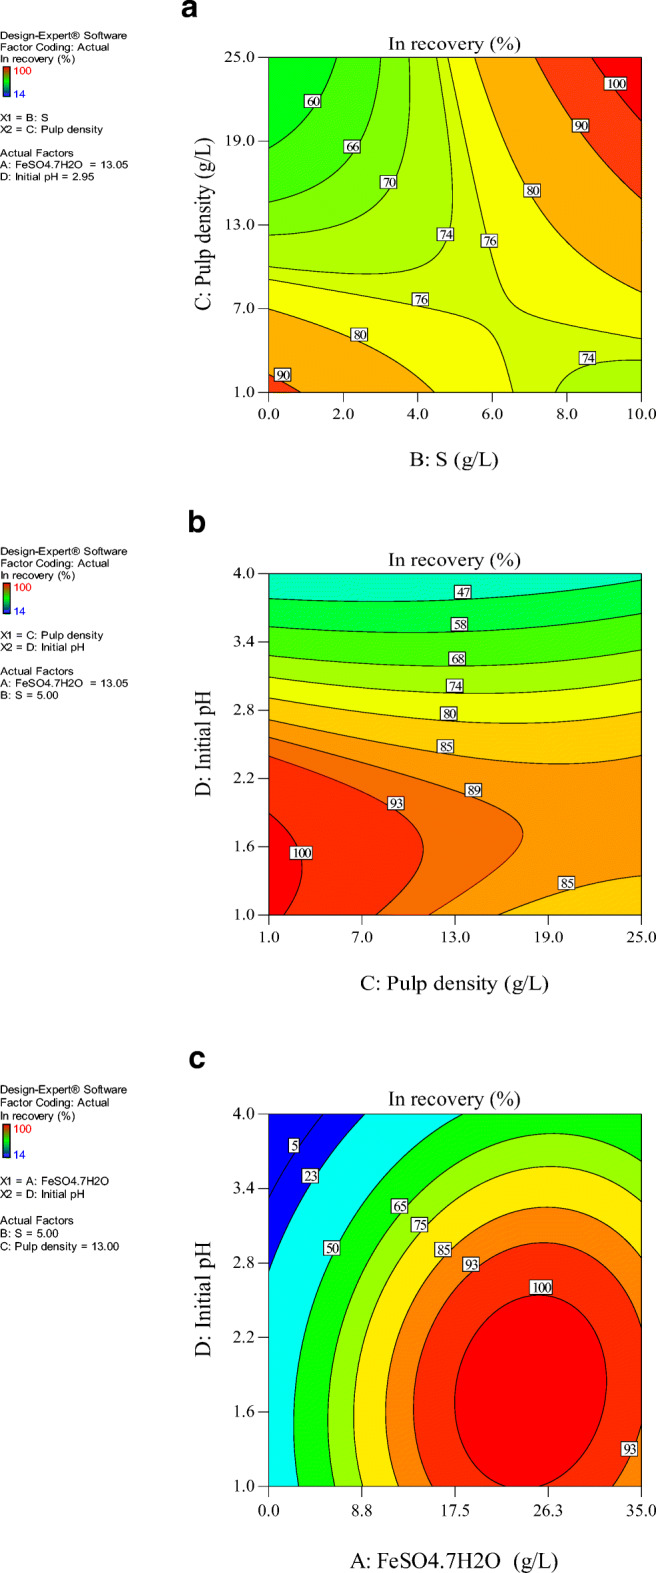
Two-dimensional contour plots of interaction for indium recovery between. a solid content and sulfur concentration. b initial pH and solid content. c initial pH and ferrous sulfate concentration
At a low elemental sulfur content and high solid content, the indium recovery decreased. At a high elemental sulfur concentration and low solid content, a passivating sulfur layer formed on the surface of the sample particles from the excess amount of elemental sulfur which limited bacterial access to the sample particles and decreased metal recovery [30]. The thin sulfur layer decreased the active surface for SPTS bio-oxidation [31].
Figure 3b present the effect of initial pH of medium and solid content on In extraction efficiency at a constant ferrous sulfate concentration of 13 g/L and elemental sulfur concentration of 5.63 g/L. As can be seen, the maximum recovery of In was obtained at low solid content and initial pH. It means that at higher pulp densities, the number of leaching agents are not sufficient to react with metals completely. The SPTS samples include metals and polymeric materials that can negatively affect bacterial growth and activity for many reasons: i) reduction of the transfer rate of oxygen and carbon dioxide, ii) physical damage to the bacterial cells in contact with solid waste particles and iii) toxic nature of the waste for the bacteria [32].
Also, increasing the solid content of the waste increased the toxic substances in the solution and increased their inhibitory effects on the activity of the bacteria. An increase in solid content increased solution viscosity and limited air and dissolved oxygen distribution in the system [33, 34]. By increasing the solid content in the bioleaching flask, shaking can decrease and the transport phenomena that occur during leaching can become slower. This, in addition to the toxicity of the waste, inhibited the proper growth and activity of the biomass. Moreover, an increase in solid content increased the rate of collision between the waste powder particles and bacteria, which decreased recovery.
Figure 3c shows the interaction plot of initial pH and ferrous sulfate concentration on In extraction efficiency at a constant elemental sulfur concentration of 5.63 g/L and solid content of 3 g/L. Figure 3c shows that at ferrous sulfate concentration of around 20–24 g/L, the maximum recovery of indium was achieved. As said before, the ferrous ions were converted to ferric ions due to bacterial activity. Ferric ions attacked the metallic compounds and reacted with metals, thus ferric ions were reduced to ferrous ions. The generated ferrous ions are used again by bacteria as an energy source. This cycle between ferric and ferrous resulted in metal mobilization [16].
At a lower ferrous sulfate concentration, insufficient oxidation agents were available and the bacteria suffered from a lack of ferrous iron as an energy source. The decrease in bacterial growth decreased metal recovery [35]. An excessive increase in ferrous sulfate concentration caused an increase in ferric ion concentration as a result of bacterial activity. According to Eq. (2), the pH of the culture increased due to oxidization of the ferrous ions to ferric ions upon consumption of H+ ions. On the other hand, at higher pH values, the formation of iron salts such as jarosite (precipitated at pH ≈ 3) occurred. Formation of jarosite removed the ferric ions (Eq. (9)) and as a result, the metal recovery decreased [36]. Besides, it was reported that A. ferrooxidans is sensitive to high ferric concentrations in solution [37]. The high concentration of ferrous ion results in increased the formation of the jarosite layer. Jarosite creates a layer around of bacteria surface, which hinders the metabolism of bacteria [22, 38].
| 9 |
Strontium recovery
Table 2 shows the strontium extraction efficiency with value ranging 1 to 5% after 15 day bioleaching at each of the 4 factor levels. In order to describe the interaction effects of the influential factors on strontium recovery, a model was established using Design Expert and the extraction of the metal data were subjected to the following equation (Eq. 10). It has been demonstrated that the concentrations of ferrous sulfate (A); Sulfur; (B) pulp density (C); and pH (D) could all affect the bioleaching of strontium in SPTS. Furthermore, as seen, Sr recovery was more sensitive to the solid content due to the higher coefficient of solid content (C).
| 10 |
The statistical analysis (Table 3) indicated this model was significant with a very small P-value (p < 0.0001). The fitness of the model was further confirmed by the coefficient of determination R2(0.92), which indicating perfect coherence between experimental data and predicted value by the model (Fig. 4).
Fig. 4.

Predicted versus actual for Sr recovery
Figure 5a represents the effect of initial ferrous sulfate concentration and solid content on Sr extraction efficiency at a constant initial pH of 1.1 and initial elemental sulfur content of 5.63 g/L. As can be seen, the recovery of strontium reduced by increasing the solid content same as for indium. At low solid content and a broad range of initial ferrous sulfate concentration up to 33 g/L, the maximum recovery of Sr could be obtained.
Fig. 5.

Two-dimensional contour plots of interaction for strontium recovery between. a initial and ferrous sulfate concentration. b initial pH and solid content. c initial sulfur and solid content
The higher initial pH of the culture medium had a negative effect on bacterial activity and Sr recovery, as seen in Fig. 5b. Furthermore, the negative effect of solid content on Sr recovery can be observed the same as for In recovery.
As can be seen in Table 2, the strontium recovery was very low for all the ranges of variables. Strontium in the sample structure has not changed and is stable in its insoluble form, because of the formation of sediment such as Sr2CrO4 (as seen in XRD pattern) and from possible Fe precipitation and adsorption of dissolved Sr by colloidal suspensions in the solution [19]. The Sr(SO4) produced by acidolysis has poor solubility, which may be another reason for the low recovery of Sr [18].
| 11 |
Optimization of bioleaching condition and confirmation test
The process was optimized to maximize the recovery of the two metals. The optimal condition was a ferrous sulfate concentration of 13 g/L, the elemental sulfur concentration of 5.63 g/L, solid content of 3 g/L, and initial pH of 1.1. Metal extraction by A. ferrooxidans occurs in the following steps: First, A. ferrooxidans produce H2SO4 as bioleaching agent as expressed in Eq. (2). Next, H2SO4 is responsible for bio-oxidizing metals in the SPTS (Eq. (8–9)). During bioleaching, systems containing a high concentration of biogenic sulfuric acid (H2SO4) enhanced metal removal efficiency. In fact, the formed sulfuric acid was responsible for the decrease in pH the during bioleaching process.
A confirmation test was conducted under the optimal conditions proposed by the software. Under the optimal conditions, the extraction efficiencies were 100% for indium and 5% for strontium. The results showed that the predicted values were in good agreement with the experimental confirmation test at the 95% confidence level. Figure 6 shows the Sankey diagram for the overall mass balance of the critical metal recovery from spent SPTS. The calculations were based on the use of 0.25 g of SPTS powder in 100 mL bioleaching solution under the best condition, which produced 72 mg of indium and 1000 mg strontium per kg of SPTS powder. Hence, it was possible to extract 1 kg of strontium from 1000 kg of SPTS. The highest strontium extraction by bioleaching process with A. ferrooxidanse was 30 ppm from ore mine [19]. The recovery of strontium obtained in this work was significantly high compared to bioleaching studies conducted on LCD waste. The extracted strontium was 241.56 mg/ kg of LCD waste has previously been reported for bioleaching of LCD waste [18]. Also their reports regarding possible treatments to recover indium and strontium after its mobilization (e.g., precipitation, cementation, extraction with solvents or surfactants). The metals can be recycled and used to produce new SPTS, employing techniques such as chemical precipitation.
Fig. 6.

Sankey diagram for mass balance of the metal recovery process
Structural analysis of bioleached SPTS
The metallic compound phase in the SPTS powder and bioleached SPTS under optimum conditions was determined by XRD. Prior to bioleaching, the SPTS powder contained indium in deposited form on the vitrified structure. For sample preparation, the SPTS samples were fractured by ball milling and the XRD pattern in Fig. 7a shows distortion in the crystalline arrangement of the SPTS after milling pre-treatment. Carbon speciation of the SPTS powder was observed with their crystalline structures.
Fig. 7.

XRD analysis. a before bioleaching. b bio-leached sample at optimum conditions
The jarosite formed due to Fe3+ hydrolysis in accordance with Eq. (9). The Gibbs free energy (ΔG°f) of the formation of potassium jarosite is 3309.08 kJ/mol, indicating the highly stable nature of jarosite. The high amount of the Fe3+ available in the solution was likely to be precipitated from the solution [39].
The XRD pattern of the bioleached samples in optimum condition (Fig. 7b) shows that the amount of jarosite was very low, species in bioleaching was elemental sulfur, which formed a passivation layer on the SPTS surface during bioleaching under optimum conditions with A. ferrooxidans that hindered further leaching [40]. Under optimum conditions, the amount of Fe2+ in the 9K medium was 13 g/L. The difference between input Fe2+ (13 g/L) and the total dissolved Fe3+ content is an indication of the amounts of Fe colloidal in suspension. When Fe2+ was externally supplied the Sr recovery was much lower because it was adsorbed onto the Fe2+.
The FTIR pattern in Fig. 8 revealed the presence of silicon and polymer in the SPTS powder structure. In Fig. 8a, the peak at 459 cm−1 is related to the Si-O in the SPTS powder and is due to the presence of the glass substrate in the OLED [41]. The weak broad peak at 691 cm−1 and the peak at 1070 cm−1 can be attributed to N-H bending vibrations and C-N stretching vibrations, respectively, available in the polyaniline in the OLED conductive polymer. The C-H, C-C, C=C, and C-H bonds are related to the benzene ring for both the emissive and conducting polymers in OLED. C–H stretching vibrations can be observed at 3100 cm−1. In this study, C–C bending vibrations can be seen clearly at 1442 cm−1. The peaks at 1630–1680 cm−1 are related to C=C stretching vibrations and those at 780–850 cm−1 are related to the C=C out-of-plane bending vibration in benzene [42].
Fig. 8.

FTIR analysis. a before bioleaching. b bio-leached sample at optimum conditions
The FTIR pattern of bioleached SPTS powder under optimum conditions is shown in Fig. 8b. The deep vibration observed at 1046 cm−1 in the IR spectra on the sample obtained after bioleaching can be attributed to jarosite. The peaks at 1350–1450 cm−1 are related to sulfate [43]. It can be concluded that bioleaching affected the polymeric material in the OLED powder, which caused the polymer peaks for Si-O, C-H, C-C, C=C, N-H, and C-N vibrations in OLED to be shortened or removed after bioleaching.
The XRD spectroscopy results were compared with the IR spectra pattern. The XRD pattern showed excellent agreement with the IR of the SPTS powder before and after bioleaching.
The XRD spectroscopy results were compared with the IR spectra pattern. The XRD pattern showed excellent agreement with the FTIR pattern of the SPTS powder and bioleached SPTS powder under optimum conditions.
Figure 9 shows the surface morphology of the SPTS and bioleached SPTS under optimum conditions. Figure 9a shows the flat surface of the SPTS powder without coarseness. The effect of bioleaching and bacterial activity on particles are shown in Fig. 9b. The images indicate a clog formation and significant scattering of powder particles. The increase in the porous and reactive surface after bioleaching is due to the acidic conditions of the medium, redox reactions, and the effect of bacterial metabolites. These conditions caused erosion of the powder surface [44]. It must be noted that jarosite and sulfur were undetected in the bioleached SPTS surface by SEM analysis. The reason is that the precipitation of jarosite and sulfur minerals was controlled by optimization of pH of the solution, ferrous sulfate, and sulfur concentration. As a result, the amount of jarosite and sulfur on the bioleached SPTS powder was too low, so that the passive layer of jarosite and sulfur is removed by simultaneous optimization of biotic factor (ferrous sulfate, sulfur, and pH of solution).
Fig. 9.

SEM image of particles of mobile phone touch screen. a before bioleaching. c bio-leached residue at optimum conditions
Conclusion
This study for the first time optimized the key process performance variables for metal bio-recovery from smart phone touch screens, by adapted A. ferrooxidans using RSM. This adapted A. ferrooxidans clearly overcome inhibition effect of toxic SPTS at various levels of solid content. The effect of the influential parameter (ferrous sulfate concentration, sulfur concentration, pH, and solid content) on In and Sr recovery was analyzed using CCD. The CCD design showed the importance of medium composition rather than culture conditions (pH) for maximal In bioleaching from the SPTS by A. ferrooxidans. The most efficient conditions were determined to be a ferrous sulfate concentration of 13 g/L, the elemental sulfur concentration of 5.63 g/L, solid content of 3 g/L, and initial pH of 1.1 for maximal In recovery from SPTS. The results show that indium could be completely recovered, but strontium could not be recovered properly (only 5%). The optimal values gained by CCD experiments for ferrous sulfate and sulfur concentrations were, respectively, 2.38 and 0.6 fold smaller than reported in previous reports on In bioleaching. The optimized condition established in this study proved a very successful result from the point of view of higher Indium recovery from amorphous SPTS powder and the lesser process cost. The bioleaching by A. ferrooxidans was mainly associated with the formation of a passivation layer (jarosite or sulfur) on the surface of the powder and reduced metal recovery. On the other hand, initial ferrous sulfate and sulfur concentrations above a certain level led to increased formation of jarosite layer and reduced metal recovery. The excessive initial elemental sulfur concentration and the formation of a layer on the sample surface slowed bioleaching. It must be noted that jarosite and sulfur were undetected in the bioleached SPTS surface by SEM analysis because of precipitation of jarosite and sulfur minerals was controlled by optimization in pH of the solution, ferrous sulfate, and sulfur concentration. This indicates that bioleaching with A. ferrooxidans by using ferrous sulfate and elemental sulfur as an energy source is not a suitable method for total Sr recovery. The insolubility of Sr was confirmed by analytical methods such as XRD. The structure of the strontium in the sample did not change. Formation of sediment such as Sr2CrO4 or adsorption of Sr by colloidal suspensions could be another reason.
Acknowledgments
This study was financially supported by Tarbiat Modares University under grant number IG-39701.
Declarations
Competing interests
The authors declare that they have no competing interests.
Footnotes
Highlights
• Bioleaching of mobile phone touch screen was performed for indium and strontium recovery.
• The effects of optimization on jarosite production in bioleaching process was first studied.
• Total In recovery (100%) was achieved under the optimum condition.
• The ferrous sulfate and sulfur concentration as medium components decreased by optimization.
• Optimization decreased passive layer formation which observed by FTIR and XRD.
Publisher’s note
Springer Nature remains neutral with regard to jurisdictional claims in published maps and institutional affiliations.
References
- 1.Needhidasan S, Samuel M, Chidambaram R. Electronic waste – an emerging threat to the environment of urban India. J Environ Heal Sci Eng. 2014;12(1):1–9. [DOI] [PMC free article] [PubMed]
- 2.Yadav S, Yadav S. Investigations of metal leaching from mobile phone parts using TCLP and WET methods. J Environ Manag. 2014;144:101–107. doi: 10.1016/j.jenvman.2014.05.022. [DOI] [PubMed] [Google Scholar]
- 3.Rocchetti L, Amato A, Fonti V, Ubaldini S, De Michelis I, Kopacek B, Vegliò F, Beolchini F. Cross-current leaching of indium from end-of-life LCD panels. Waste Manag. 2015;42:180–187. doi: 10.1016/j.wasman.2015.04.035. [DOI] [PubMed] [Google Scholar]
- 4.Zhang K, Wu Y, Wang W, Li B, Zhang Y, Zuo T. Recycling indium from waste LCDs: a review. Resour Conserv Recycl. 2015;104:276–290. doi: 10.1016/j.resconrec.2015.07.015. [DOI] [Google Scholar]
- 5.Dodbiba G, Nagai H, Wang LP, Okaya K, Fujita T. Leaching of indium from obsolete liquid crystal displays: comparing grinding with electrical disintegration in context of LCA. Waste Manag. 2012;32:1937–1944. doi: 10.1016/j.wasman.2012.05.016. [DOI] [PubMed] [Google Scholar]
- 6.Savvilotidou V, Hahladakis JN, Gidarakos E. Leaching capacity of metals–metalloids and recovery of valuable materials from waste LCDs. Waste Manag. 2015;45:314–324. doi: 10.1016/j.wasman.2015.05.025. [DOI] [PubMed] [Google Scholar]
- 7.Dodson JR, Hunt AJ, Parker HL, Yang Y, Clark JH. Elemental sustainability: towards the total recovery of scarce metals. Chem Eng Process Process Intensif. 2012;51:69–78. doi: 10.1016/j.cep.2011.09.008. [DOI] [Google Scholar]
- 8.Dong YP, Meng QF, Feng HT, Cui XM, Xu B, Wu W, Gao DD, Li W. Separation and economic recovery of strontium from Nanyishan oil-field water, China. Nat Resour Environ Issues. 2009;15:42. [Google Scholar]
- 9.Xia M, Bao P, Liu A, Wang M, Shen L, Yu R, Liu Y, Chen M, Li J, Wu X, Qiu G, Zeng W. Bioleaching of low-grade waste printed circuit boards by mixed fungal culture and its community structure analysis. Resour Conserv Recycl. 2018;136:267–275. doi: 10.1016/j.resconrec.2018.05.001. [DOI] [Google Scholar]
- 10.Chandane P, Jori C, Chaudhari H, Bhapkar S, Deshmukh S, Jadhav U. Bioleaching of copper from large printed circuit boards for synthesis of organic-inorganic hybrid. Environ Sci Pollut Res. 2020;27:5797–5808. doi: 10.1007/s11356-019-07244-x. [DOI] [PubMed] [Google Scholar]
- 11.Chang CY, Chen SY, Klipkhayai P, Chiemchaisri C. Bioleaching of heavy metals from harbor sediment using sulfur-oxidizing microflora acclimated from native sediment and exogenous soil. Environ Sci Pollut Res. 2019;26:6818–6828. doi: 10.1007/s11356-019-04137-x. [DOI] [PubMed] [Google Scholar]
- 12.Awasthi AK, Zeng X, Li J. Integrated bioleaching of copper metal from waste printed circuit board—a comprehensive review of approaches and challenges. Environ Sci Pollut Res. 2016;23:21141–21156. doi: 10.1007/s11356-016-7529-9. [DOI] [PubMed] [Google Scholar]
- 13.Ijadi Bajestani M, Mousavi SM, Shojaosadati SA. Bioleaching of heavy metals from spent household batteries using Acidithiobacillus ferrooxidans: statistical evaluation and optimization. Sep Purif Technol. 2014;132:309–316. doi: 10.1016/j.seppur.2014.05.023. [DOI] [Google Scholar]
- 14.Velgosová O, Kaduková J, Marcinčáková R, Palfy P, Trpčevská J. Influence of H2SO4 and ferric iron on cd bioleaching from spent Ni–cd batteries. Waste Manag. 2013;33:456–461. doi: 10.1016/j.wasman.2012.10.007. [DOI] [PubMed] [Google Scholar]
- 15.Zeng G, Deng X, Luo S, Luo X, Zou J. A copper-catalyzed bioleaching process for enhancement of cobalt dissolution from spent lithium-ion batteries. J Hazard Mater. 2012;199–200:164–169. doi: 10.1016/j.jhazmat.2011.10.063. [DOI] [PubMed] [Google Scholar]
- 16.Arshadi M, Mousavi SM. Simultaneous recovery of Ni and cu from computer-printed circuit boards using bioleaching: statistical evaluation and optimization. Bioresour Technol. 2014;174:233–242. doi: 10.1016/j.biortech.2014.09.140. [DOI] [PubMed] [Google Scholar]
- 17.Fontana D, Forte F, De Carolis R, Grosso M. Materials recovery from waste liquid crystal displays: a focus on indium. Waste Manag. 2015;45:325–333. doi: 10.1016/j.wasman.2015.07.043. [DOI] [PubMed] [Google Scholar]
- 18.Jowkar MJ, Bahaloo-horeh N, Mousavi SM. Bioleaching of indium from discarded liquid crystal displays. J Clean Prod. 2018;180:417–429. doi: 10.1016/j.jclepro.2018.01.136. [DOI] [Google Scholar]
- 19.Park HS, Lee JU, Ahn JW. The effects of Acidithiobacillus ferrooxidans on the leaching of cobalt and strontium adsorbed onto soil particles. Environ Geochem Health. 2007;29:303–312. doi: 10.1007/s10653-007-9095-z. [DOI] [PubMed] [Google Scholar]
- 20.Vakilchap F, Mousavi SM, Shojaosadati SA. Role of Aspergillus niger in recovery enhancement of valuable metals from produced red mud in Bayer process. Bioresour Technol. 2016;218:991–998. doi: 10.1016/j.biortech.2016.07.059. [DOI] [PubMed] [Google Scholar]
- 21.Pourhossein F, Mousavi SM. Enhancement of copper, nickel, and gallium recovery from LED waste by adaptation of Acidithiobacillus ferrooxidans. Waste Manag. 2018;79:98–108. doi: 10.1016/j.wasman.2018.07.010. [DOI] [PubMed] [Google Scholar]
- 22.Rastegar SO, Mousavi SM, Shojaosadati SA, Gu T. Bioleaching of fuel-oil ash using Acidithiobacillus thiooxidans in shake flasks and a slurry bubble column bioreactor. RSC Adv. 2016;6:21756–21764. doi: 10.1039/c5ra24861b. [DOI] [Google Scholar]
- 23.Heydarian A, Mousavi SM, Vakilchap F, Baniasadi M. Application of a mixed culture of adapted acidophilic bacteria in two-step bioleaching of spent lithium-ion laptop batteries. J Power Sources. 2018;378:19–30. doi: 10.1016/j.jpowsour.2017.12.009. [DOI] [Google Scholar]
- 24.Gholami RM, Borghei SM, Mousavi SM. Bacterial leaching of a spent Mo-co-Ni refinery catalyst using Acidithiobacillus ferrooxidans and Acidithiobacillus thiooxidans. Hydrometallurgy. 2011;106:26–31. doi: 10.1016/j.hydromet.2010.11.011. [DOI] [Google Scholar]
- 25.Rastegar SO, Mousavi SM, Shojaosadati SA. Cr and Ni recovery during bioleaching of dewatered metal-plating sludge using Acidithiobacillus ferrooxidans. Bioresour Technol. 2014;167:61–68. doi: 10.1016/j.biortech.2014.05.107. [DOI] [PubMed] [Google Scholar]
- 26.Li L, Lv Z, Zuo Z, Yang Z, Yuan X. Effect of energy source and leaching method on bio-leaching of rock phosphates by Acidithiobacillus ferrooxidans. Hydrometallurgy. 2016;164:238–247. doi: 10.1016/j.hydromet.2016.06.018. [DOI] [Google Scholar]
- 27.Arshadi M, Mousavi SM, Rasoulnia P. Enhancement of simultaneous gold and copper recovery from discarded mobile phone PCBs using Bacillus megaterium: RSM based optimization of effective factors and evaluation of their interactions. Waste Manag. 2016;57:158–167. doi: 10.1016/j.wasman.2016.05.012. [DOI] [PubMed] [Google Scholar]
- 28.Pradhan D, Mishra D, Kim DJ, Ahn JG, Chaudhury GR, Lee SW. Bioleaching kinetics and multivariate analysis of spent petroleum catalyst dissolution using two acidophiles. J Hazard Mater. 2010;175:267–273. doi: 10.1016/j.jhazmat.2009.09.159. [DOI] [PubMed] [Google Scholar]
- 29.Lee CH, Jeong MK, Fatih Kilicaslan M, Lee JH, Hong HS, Hong SJ. Recovery of indium from used LCD panel by a time efficient and environmentally sound method assisted HEBM. Waste Manag. 2013;33:730–734. doi: 10.1016/j.wasman.2012.10.002. [DOI] [PubMed] [Google Scholar]
- 30.Altinkaya P, Mäkinen J, Kinnunen P, Kolehmainen E, Haapalainen M, Lundström M. Effect of biological pretreatment on metal extraction from flotation tailings for chloride leaching. Miner Eng. 2018;129:47–53. doi: 10.1016/j.mineng.2018.09.012. [DOI] [Google Scholar]
- 31.Chang-Li L, Jin-Lan X, Zhen-Yuan N, Yi Y, Chen-Yan M. Effect of sodium chloride on sulfur speciation of chalcopyrite bioleached by the extreme thermophile Acidianus manzaensis. Bioresour Technol. 2012;110:462–467. doi: 10.1016/j.biortech.2012.01.084. [DOI] [PubMed] [Google Scholar]
- 32.Ilyas S, Ruan C, Bhatti HN, Ghauri MA, Anwar MA. Column bioleaching of metals from electronic scrap. Hydrometallurgy. 2010;101:135–140. doi: 10.1016/j.hydromet.2009.12.007. [DOI] [Google Scholar]
- 33.Pradhan JK, Kumar S. Metals bioleaching from electronic waste by Chromobacterium violaceum and Pseudomonads sp. Waste Manag Res. 2012;30:1151–1159. doi: 10.1177/0734242X12437565. [DOI] [PubMed] [Google Scholar]
- 34.Arshadi M, Mousavi SM. Enhancement of simultaneous gold and copper extraction from computer printed circuit boards using Bacillus megaterium. Bioresour Technol. 2015;175:315–324. doi: 10.1016/j.biortech.2014.10.083. [DOI] [PubMed] [Google Scholar]
- 35.Yang T, Xu Z, Wen J, Yang L. Factors influencing bioleaching copper from waste printed circuit boards by Acidithiobacillus ferrooxidans. Hydrometallurgy. 2009;97:29–32. doi: 10.1016/j.hydromet.2008.12.011. [DOI] [Google Scholar]
- 36.Rastegar SO, Mousavi SM, Shojaosadati SA, Sarraf Mamoory R. Bioleaching of V, Ni, and cu from residual produced in oil fired furnaces using Acidithiobacillus ferrooxidans. Hydrometallurgy. 2015;157:50–59. doi: 10.1016/j.hydromet.2015.07.006. [DOI] [Google Scholar]
- 37.Bakhtiari F, Atashi H, Zivdar M, Seyedbagheri S, Fazaelipoor MH. Bioleaching kinetics of copper from copper smelters dust. J Ind Eng Chem. 2011;17:29–35. doi: 10.1016/j.jiec.2010.10.005. [DOI] [Google Scholar]
- 38.Zhang R, Wei D, Shen Y, Liu W, Lu T, Han C. Catalytic effect of polyethylene glycol on sulfur oxidation in chalcopyrite bioleaching by Acidithiobacillus ferrooxidans. Miner Eng. 2016;95:74–78. doi: 10.1016/j.mineng.2016.06.021. [DOI] [Google Scholar]
- 39.Tu Z, Guo C, Zhang T, Lu G, Wan J, Liao C, Dang Z. Investigation of intermediate sulfur species during pyrite oxidation in the presence and absence of Acidithiobacillus ferrooxidans. Hydrometallurgy. 2017;167:58–65. doi: 10.1016/j.hydromet.2016.11.001. [DOI] [Google Scholar]
- 40.Jones FS, Bigham JM, Gramp JP, Tuovinen OH. Formation and characterization of ternary (Na, NH4, H3O)-jarosites produced from Acidithiobacillus ferrooxidans cultures. Appl Geochem. 2018;91:14–22. doi: 10.1016/j.apgeochem.2018.01.010. [DOI] [Google Scholar]
- 41.Luna-López JA, Carrillo-López J, Aceves-Mijares M, Morales-Sánchez YA, Falcony C. FTIR and Photoluminescence of Annealed Silicon Rich Oxide films. Superf. y Vacío. 2009;22:11–14. [Google Scholar]
- 42.Qiu S, Wei J, Pan F, Liu J, Zhang A. Vibrational, NMR spectrum and orbital analysis of 3,3′,5,5′- tetrabromobisphenol a: a combined experimental and computational study. Spectrochim Acta - Part A Mol Biomol Spectrosc. 2013;105:38–44. doi: 10.1016/j.saa.2012.12.004. [DOI] [PubMed] [Google Scholar]
- 43.Pourhossein F, Mousavi SM. A novel step-wise indirect bioleaching using biogenic ferric agent for enhancement recovery of valuable metals from waste light emitting diode (WLED) J Hazard Mater. 2019;378:120648. doi: 10.1016/j.jhazmat.2019.05.041. [DOI] [PubMed] [Google Scholar]
- 44.Nikfar S, Parsa A, Bahaloo-Horeh N, Mousavi SM. Enhanced bioleaching of Cr and Ni from a chromium-rich electroplating sludge using the filtrated culture of. J Clean Prod. 2020;264:121622. doi: 10.1016/j.jclepro.2020.121622. [DOI] [Google Scholar]