Abstract
Air pollution associated with particulate matters results in different types of disease including allergy, lung destruction, heart failure, and related problems. This study has been designed and performed to examine the concentration of PM2.5-bound heavy metals, risk assessment, possible sources and effect of meteorological parameters on 17 sites of the air of the most industrial city of Iran (Karaj) in 2018-19. For this purpose, four samples were taken from every point of Karaj air over one year using a pump (Leland Legacy (SKC)) with flow rate of 3 L/min on PTFE filter for 24 h. Overall, 68 samples of PM2.5-bound heavy metals were collected. Note that during the sampling, atmospheric parameters including temperature, pressure, humidity, and wind speed were regularly recorded using PHB318 portable device. In examining the chemical composition of these particles, the concentration of metals (Al-Zn- Ar-Cd-Cr-Cu-Fe-Hg-Mn-Ni-Pb) was determined after digestion of the collected samples and through injection into ICP-OEC device. The results indicated that the mean annual concentration of PM2.5 particles range from 21.84 to 72.75 µg/m3. The mean concentration of heavy metals lied within the range of 25.63 to 336.27 ng/m3. Among heavy metals, the maximum concentration belonged to aluminum (277.95 ng/m3) and iron (336.27 ng/m3), which are known as elements with a ground source (sources such as car fuels, exhaust gases, decorative materials, batteries, indoor smoking, the paint used for painting walls, erosion and corrosion of rubber of cars). Meanwhile, there was a positive relationship between heavy metals and temperature(r: 0.418, p < 0.019), pressure (r: 0.184, p < 0.0.402), as well as wind speed (r: 0.38, p < 0.017), while an inverse relationship was observed with relative humidity (r: -0.219, p < 0.018). The ecological risk of the metals calculated was very notable, with the maximum environmental risk being related to cadmium in children (6.61) and manganese in adults (0.82). The largest HQ in children and adults was associated with Cr. Finally, ILCR values for cadmium in both children (1.19 E-04) and adult (4.81 E-04) groups indicated high risk of developing cancer in humans.
Keywords: Ambient air, Health risk, Heavy metals, Karaj City, PM2.5
Introduction
Air pollution results from economic development and in turn increasing population in most parts of the world [1, 2]. It can be stated that currently there is virtually no clean or healthy air, and the human life is interwoven with unhealthy air [3]. One of the most important compounds present in the air which causes air pollution and adverse health effects for both humans and animals is particulate matters and their constituents [4–6]. Processes such as waste incineration, combustion of fossil fuels, the exhaust fumes of diesel trucks, emissions produced by vehicles, as well as dust can produce particulate matters, which can spread throughout the atmosphere [7]. Meanwhile, the metal compounds present in the particulate matters of the ambient air especially in minute particles have recently been a major factor adversely affecting the human health [8, 9]. Studies have shown that increasing rates of lung cancer as well as cardiopulmonary mortality are observed after long-term exposure to particulate matter air pollution [10]. Also, the international agency for research on Cancer (IRAC( has classified the ambient air pollution and particulate matter pollution in group 1 of human carcinogens [11]. Metal compounds including aluminum, arsenic, cadmium, chromium, copper, iron, mercury, manganese, nickel, lead, and zinc can be found in particulate matters (PM2.5) in the air [12]. Studies have indicated that the biological degradation of PM2.5-bound heavy metals is complex, and these metal compounds practically enter the human body through the respiratory system [13]. These particles are not degraded in the body and accumulate in the body, thereby impairing the physiological functioning [14, 15]. Identifying these PM2.5−bound metal compounds can be important and essential in determining the strategies required for reducing air pollution and the resulting mortality [16]. Metals such as iron and aluminum also exist in the Earth’s crust; thus their concentration in the air far higher than that of other metals [17]. Metals including vanadium, nickel, chromium, and copper have attracted the attention of researchers because of the potential in producing active oxygen species in biological tissues [18]. Meanwhile, implication of lead has been proven in blood and cardiovascular disease [19]. Exposure to PM2.5-bound metals results in complications including nausea and vomiting, cardiac arrhythmia and damage to blood vessels (for arsenic), severe damage to the lungs and stomach irritation (for cadmium), mucous irritation, respiratory problems such as asthma and cough (for chromium), damage to the brain and kidneys, abortion in pregnant women (for lead), damage to growing fetuses, brain and kidney (for Mercury) [20]. The level of each of these heavy metals in the ambient air can be different depending on the industrial structure of that region, meteorological conditions, and their surrounding sources of emission [21].
Karaj, the capital of Alborz province, is located in west of the capital of Iran. This city is located in the geographical coordinates of 51 ° 00´ E and 35 ° 48´ N. According to the last census of 2016, its population was approximately 2.3 million people, with an area of about 175.5 km2 and is located at a length of 16 km and 1300 meters above the sea level. Currently, there are about 840 industrial units (large and small) throughout the city, which has made this city one of the most industrial cities in Iran. As this city is the main road connecting 15 provinces of the country, every day it faces a high volume of vehicle traffic, as well as, a high traffic and finally a high and frequent braking of drivers, and as all around the city is surrounded by mountains that prevent the exit of these types of pollutants produced by vehicles and industries, it can cause very high environmental problems and pollution. Also, due to the geographical location of the city of Karaj, the city has faced extremely worrying pollution in recent years. This city has air pollution in most seasons due to its rich resources of small and large industries (known as the industrial capital of Iran) and climatic conditions (temperate and cold). The main pollutants in this region are industries and operations related to mining and exploration, in which air pollutants such as smoke and suspended solids have the largest share [22].
Based on the above points and since currently no study has been performed on PM2.5-bound heavy metals as well as their health impact on various urban communities, and since the pollution characteristics and seasonal changes of PM2.5 particles as well as their bound metals have remained understudied, and given the inadequate information about the properties of heavy metals plus PM2.5 particles for decision-making and strategies required for controlling or mitigating your pollution as well as their health impacts, supervision on these harmful pollutants is essential. Hence, this study has been performed with the following objectives: (1) determining the concentration of PM2.5 particles as well as their analysis, (2) determining the concentration and analysis of PM2.5-bound heavy metals (Al, Ar, Cd, Cr, Cu, Fe, Hg, Mn, Ni, Pb, Zn), (3) determining of Possible sources of heavy metal in ambient air of Karaj, (4) determining the impact of meteorological parameters on the concentration of PM2.5-bound heavy metals, and (5) assessing the health effects resulting from exposure to PM2.5-bound heavy metals in Karaj air from 21 to 2018 to 20 March 2019. Hopefully, these findings would provide an insight into the properties, sources, as well as health and environmental hazards of PM2.5-bound heavy metals in the atmosphere of the most industrial city of Iran.
Materials and methods
Description of study area and sampling
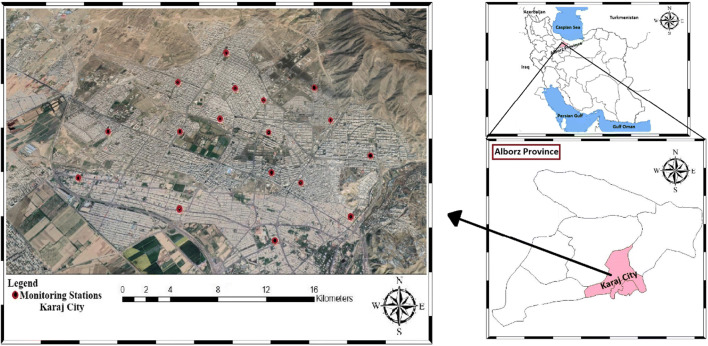
This city is located in the geographical coordinates of 51 ° 00´ E and 35 ° 48´ N. According to the last census of 2016, its population was approximately 2.3 million people, with an area of about 175.5 km2 and is located at a length of 16 km and 1300 meters above the sea level. This descriptive cross-sectional study has been performed to analyze and identify the sources, examining the impact of meteorological parameters, and assessing the risk of PM2.5-bound heavy metals in Karaj air. The sampling sites were chosen such that the entire area of Karaj city will be covered. Figure 1 presents the studied region and the sampling sites. The samples were collected from 21 to 2018 to 20 March 2019 to one year, with 6-day intervals to examine the effect of seasonal and meteorological changes. Overall, 68 samples were taken for particles from all stations over one year. The sampling was done for 24 h based on EPA-TO/13A guidelines [23]. Also, during the sampling of PM2.5 particles, temperature, pressure, humidity, and wind speed were recorded using PHB318 portable device. PM2.5 particles were collected using a high-volume peripheral pump (Leland Legacy (SKC)) with 3 L/min flow rate for 24 h on polytetrafluoroethylene (PTFE) filter with the pore size of 1 micron and diameter of 37 mm. The sampling equipment was installed at least 1.5-2 m above the ground level so that it would not absorb the ground dust (Fig. 2). Also, before the sampling, all devices and equipment used were calibrated.
Fig. 1.
Geographical location and sampling points of the study area
Fig. 2.
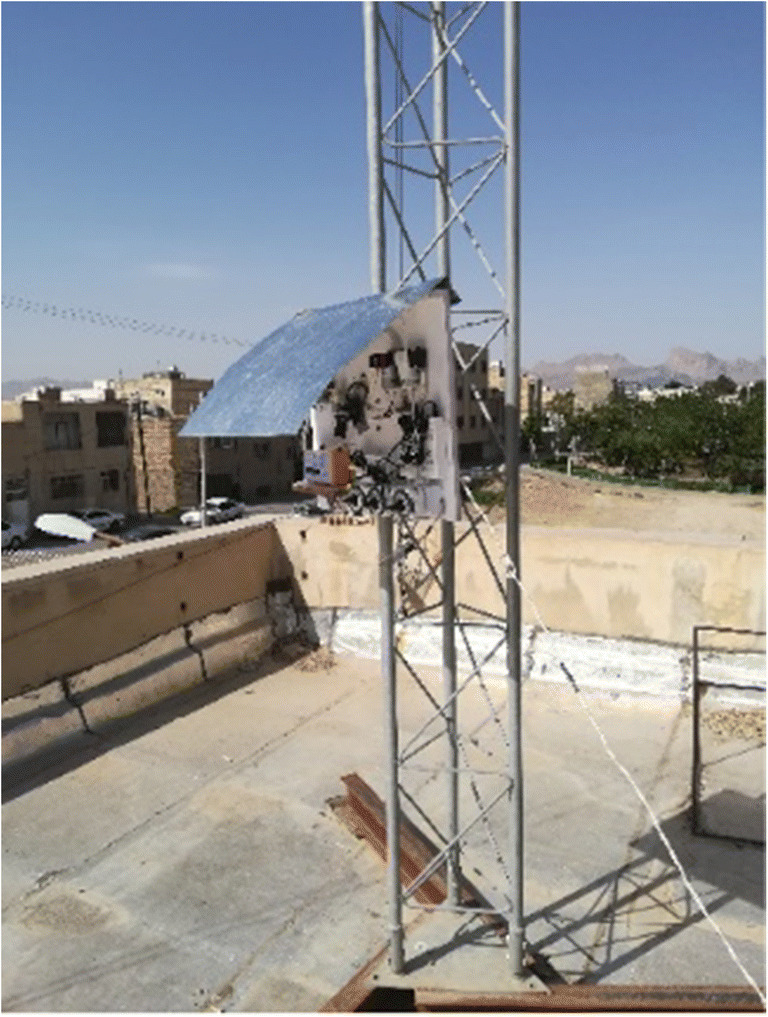
Sampling Pilot
Meteorological parameters
Throughout the study course and during sampling of Karaj air particles, meteorological parameters including temperature, humidity, pressure, and wind speed were also measured. Temperature, pressure, and humidity were measured by PHB218 portable device, while the data related to wind speed were taken from Karaj Environmental Protection Agency. Next, the data of meteorological parameters obtained were organized by Excel software, where the data normality was tested using SPSS24 via KALMOGAROV-Smiranov test. Next, the relationship between each of the meteorological parameters and the concentration of PM2.5-bound heavy metals was performed by ANOVA test.
Sample preparation
After taking samples from 17 sites across Karaj city, the samples were kept at -18 °C [24]. Next, the samples were placed inside a desiccator for 48 h with relative humidity of 25–30%. In order to determine the concentration of PM2.5 particles, PTFE filters were weighed using RADWAG digital balance (AS 220.R2) with 0.0001 accuracy. At the beginning and end of sampling, the flow rate of the suction pump for collection of particles was measured using a rotameter, where their mean flow rate was calculated. Next, based on the flow rate and volume of air taken for 24 h, the concentration of PM2.5 particles was calculated by formula:
In this formula, Wf is the weight of the filter after sampling (g), Wi is the weight of the filter before sampling (g), V is the total volume of standardized sampling air (m3) and PM2.5 is the particle concentration of 2.5 microns (µg/m3).
In order to determine the concentration of PM2.5-bound heavy metals, the collected PTFE filter was cut into two equal parts: one part (one half of the filter) was used for determining the concentration of heavy metals. This half filter was transformed into very tiny pieces, and then poured into a Teflon container. Next, 10 ml nitric acid, 3 ml perchlorate acid, and 1 ml hydrofluoric acid were added to it, and then placed inside an oven for 4 h at 170 °C. After this time, the device was turned off for 30 min so that the Teflon containers would cool down. Thereafter, the lid of Teflon containers containing acids and crushed filters was opened slowly with extreme caution under a hood, and placed on a heater, so that the acids inside these containers would completely dry through 90–100 °C dry temperature. After drying, the contents of the Teflon containers were diluted to 25 cc using double distilled water [25]. Eventually, the resulting solution was filtered using syringe filter 0.45 micron so that ICP device would not get damaged. The resulting solution was poured into acid-washed polyethylene containers, and kept inside refrigerator at 4 °C until injection into the device. The PM2.5-bound heavy metals were determined using ICP-OES (Optima 8000) device (Perkin Elmer, USA) with 5 s retention time. Before injecting the samples, a specific amount of the mother solution was taken based on its molecular mass and the molecular mass of the element of interest, whereby a 1000 ppm solution was made. Next, 100, 400, 700, and 1000 ppm standards were also synthesized from the 1000 ppm solution. After investigating the calibration curves presented by ICP device as well as Pearson correlation coefficient for each metal, sample injection was performed. Every sample ingested by the above method was read with the three above standards. Concurrent with completion of experiments, one sample of the sample free PTFE filter was prepared using the same digestion method for the filters containing the sample and used as control. The resulting values were subtracted from the results obtained for each element. The solution obtained from digestion of the air samples was injected into ICP device. The output results were read as raw data in terms of mg/L. In order to convert the numbers based on mcg/m3, the following calculations were performed. The number read from the device (the control concentration would be subtracted from it) was multiplied by the sample volume (after preparation) and then divided by 1000:
| 1 |
Where C1 is the concentration of the observed metal in one half of the filter, CA is the concentration read from the ICP, CB is the concentration of the desired metal in the control sample (blank) and Vs is the sample volume after preparation (m3). The number obtained in the above equation is multiplied by the number 2 (total filter).
| 2 |
C2 is the desired metal concentration in the whole filter. Finally, to obtain the desired metal concentration in micrograms per cubic meter, the number obtained from the above equation is divided by the volume of air sampled:
| 3 |
C3 is the metal concentration obtained in micrograms per cubic meter and VAir is the volume of sampled air.
Spatial distribution of heavy metals
In this study, Arc GIS10.3 was used to show the spatial distribution of PM2.5 bounded with heavy metals concentrations in the ambient air of Karaj. Geographic Information System (GIS) is a computer-based information system that studies geographic phenomena and events that occur on the surface of the earth. The reason for using GIS software is the surety of a proper management and fast and optimal achievement of the specified goals by this software. Reverse weighting method (IDW) was also used for interpolation or zoning of heavy metals concentrations. This is a common method for zoning and distribution of air pollution. IDW is one of the simplest and most popular methods of interpolation. This type of interpolation is a correct and robust interpolation method that estimates the required unknown values by weighting the average values of the sample data points with weighting factors proportional to the inverse distance. This method considers a weight for each measuring point based on the distance between those points and the position of the unknown points. These weights are then controlled by the weighting power, so that larger powers reduce the effects of these points more than the estimated point, and the smaller powers distribute weights more evenly among the adjacent points [26, 27]. Of course, regardless of the position and arrangement of points, this method only considers their distance. That is, the points that have the same distance from the estimated point have the same weight. The weight factor is calculated using the following equation:
| 4 |
In this formula λi: Station weight, D: Station distance (i) to an unknown point, and is the weighting power.
Possible emission sources of PM2.5-bound heavy metals
Principal component analysis (PCA) was also used as a statistical technique to determine possible sources of heavy metals in suspended particulate matter collected from ambient air of Karaj city. This mathematical method analyzes the relationship between the observational variables with a reduction of the size of the original data sets and the principal components. In this study, the varimax normalized rotation was used to maximize a loading factor value and minimize an ambiguity for each component in relation to each rotated principal component [28]. To validate the obtained results by PCA analysis, a number of the samples should be (n > 30 + ((V + 3)) /2) (n is the number of samples and V is the number of variables).
Health effect
The need for health risk assessment may be affected by various spatial or particular factors. For example, in metropolises, exposure to environmental pollutants is associated with human health risk, thus absolutely necessitating health risk assessment. In other words, the general understanding of risk differs across various individuals or groups, and may even change over time. Hence, temporal and spatial dimensions may be considered for risk. Risk analysis for exposure to pollutants and the associated health effects is a systematic process for assessing, managing, and determining the relationship between risk of environmental pollutants and human health [29]. Risk assessment determines possible positive and negative outcomes of various risk management measures on human health. Indeed, this method involves advanced high-level scientific processes and principles providing a suitable ground for usage of scientific data to assess and compare the possible complications of human exposure to different risks (risk sources) and the risks originating from managerial decisions with different interventions [30]. Risk assessment can significantly help in determining the priorities of risky pollutants as well as decision-making on proper controlling solutions to reduce people’s exposure to pollutants and in turn mitigate the resulting health effects. In addition, by performing risk assessment studies, we will be able to determine the share of each of the routes of exposure to special environmental pollutants [31]. Then, this group of information can be used to localize the standards, which is one of the important and valuable aspects of risk assessment studies. This is because the distribution of pollutants in routes of exposure is not the same across all parts of the world. For example, in European countries concerning their geographical, industrial, social, and other characteristics, water may claim the largest share of exposure to a special pollutant. However, in other countries intake of the same pollutant from a source other than water may be notable. In addition, the pattern of exposure to environmental pollutants is a function of culture, age, and performance of citizens, and it is not logical to determine a single prescription for the allowable limits of exposure and to compare the extent of exposure of the people to the standard limits determined for other countries. This would cause lawmakers to deviate from their main goal which is maintaining the public health [32]. In risk assessment, the risk of carcinogenicity and non-carcinogenicity for humans through skin, respiration, and digestion can be considered. PM2.5 particles are less of an interest in terms of digestion and skin because of their penetrative power into the respiratory system. Hence, in this study, risk assessment has been done for PM2.5-bound heavy metals for children and adults. The average daily dose in milligrams per kilogram per day is calculated by inhalation based on the following formula [33]:
In this formula: ADD is the average daily dose in mg/kg/day. C is the concentration of heavy metals in PM2.5 (mg/kg), InhR is the particle inhalation rate of 2.5 µm (15 to 20 m3/day m3/day), EF is the frequency of exposure (350 to 365 days/years), ED is the duration of exposure (70 years), BW is the body weight of the exposed person (71 ± 13.6 kg), AT is the average time (24,500 to 25,500 days) and PEF is the particle emission factor (cubic meters per kg). In this study, the carcinogenic and non-carcinogenic effects of heavy metals were examined using hazard quotient (HQ) and hazard index (HI). Also, the reference dose (RfD) was also calculated which is the maximum daily dose intake from different paths for children and adults. The extent of non-carcinogenicity in people because of exposure to PM2.5-bound heavy metals can be calculated through HQ. In this regard, if HQ < 1, then there is no carcinogenicity or adverse effects on health, but if HQ > 1, there are adverse effects on human health [34].
Data analysis
Before analyzing the data related to heavy metals and PM2.5 particles, the data normality was assessed through KALMOGAROV- Smirnov test. Also, to determine the relationship between meteorological parameters and the PM2.5-bound heavy metal concentration, Pearson test was done using SPSS 21. Next, all diagrams were drawn by R and Microsoft Excel 2013 software. Meanwhile, using Arc GIS (10.3) software, the zoning of the heavy metal and PM2.5 concentration was performed. Eventually, to determine the possible sources of emission of PM2.5-bound heavy metals, principal component analysis (PCA) was used.
Results and discussion
Concentration of PM2.5 particles
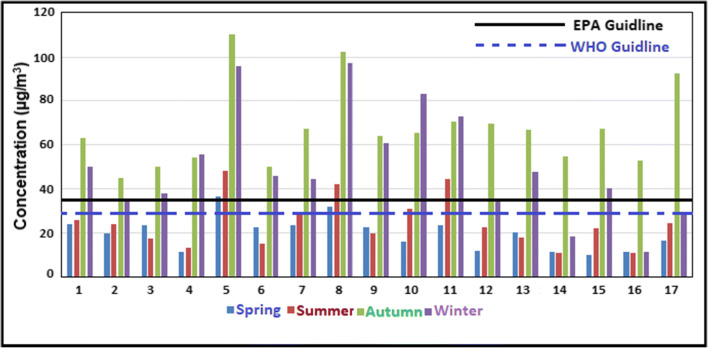
The standard level of concentration of PM2.5 particles for Iran is the same as the value set by World Health Organization guideline (25 µg/m3). According to Fig. 3, indicating the concentrations of air pollution measurement stations across four seasons, it is observed that in spring 95% and in summer 80% of these stations have had a concentration below WHO guideline. On the other hand, in autumn, all stations and in winter 95% of stations had a concentration above the WHO limit. In autumn, a high level of pollutants is observed due to inversion.
Fig. 3.
Concentration of PM2.5 particles in the four seasons 2018–2019 and comparison with WHO and EPA standards
The box plot of mean seasonal PM2.5 concentration throughout the study period can be seen in Fig. 4. PM2.5 particles had the largest value in autumn (67.48 µg/m3), while in winter, summer, and spring, the values were 50.50, 24.65, and 19.85 µg/m3 respectively. Goudarzi indicated that in the cold season, PM2.5 concentration was significantly higher in Ahwaz than in other seasons, which is in line with our study [35]. On the other hand, Bahramiasl observed the maximum concentration of particles during spring, since in that study precipitations during the cold season caused breakdown of particles in the air [36]. Miri showed that the mean PM2.5 concentration was higher in autumn than in other seasons, which is in line with our study [37]. Dobaradaran found that the autumn experienced the maximum concentration, while winter, summer, and spring showed lower concentrations [38]. On the other hand, Wang observed the maximum concentration during spring, whose main reason was monsoons, which brought the pollutants from the outside into the inner city [39]. On the other hand, as can be seen the mean four-season concentration of PM2.5 particles of Karaj ambient air is 40.65 µg/m3, which is larger than the guideline values. Hence, because of the carcinogenicity risk of this type of particles, necessary measures should be taken to reduce and maintain the health of the residents of this region. Zhang et al., in southern China indicated that the mean annual concentration for PM2.5 particles is equal to 42.55 µg/m3 [40]. On the other hand, Tai et al. estimated the mean annual concentration PM2.5 particles as 68.98 µg/m3 [41]. Finally, Ezaz in Hong Kong obtained the mean annual concentration PM2.5 particles as 57.40 µg/m3 [42].
Fig. 4.
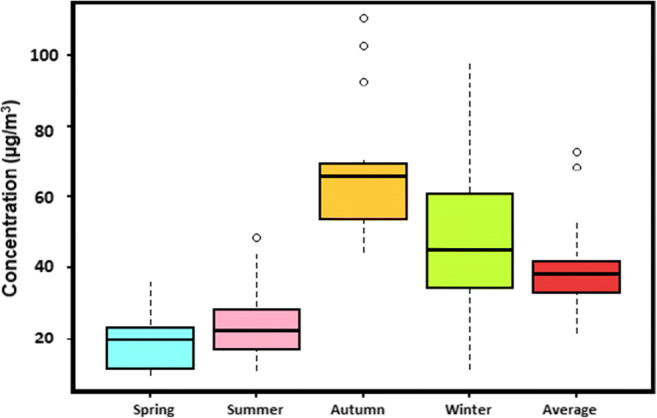
Box plot of the average concentration of PM2.5 particulate in different seasons of the year 2018-19
Since the largest hospital of Karaj city and even Alborz province is located in station 5, it can be claimed that its high traffic load and crowd may be one of the reasons of high PM2.5 concentration in that station. On the other hand, station 8 accommodates three adjacent hospitals experiencing considerable vehicle traversal. Plus, since this station is close to the healthcare center of East of Karaj, as many people refer to this place, high PM2.5 concentration can be attributed to these points. In Karaj city, the maximum extent of particulate matter emission is related to bus fleet (44%), single-line buses (38%), and minibuses (12%). Currently, around 60,000 and 95,000 worn-out cars and public transits vehicles respectively are commuting in the province, whose annual emission level amounts to about 120.45 tons [22]. Generally, the city is one of the industrial centers of Iran, which produces extensive amount of pollution into the environment because of presence of industrial towns, manufacturing units, and other industries.
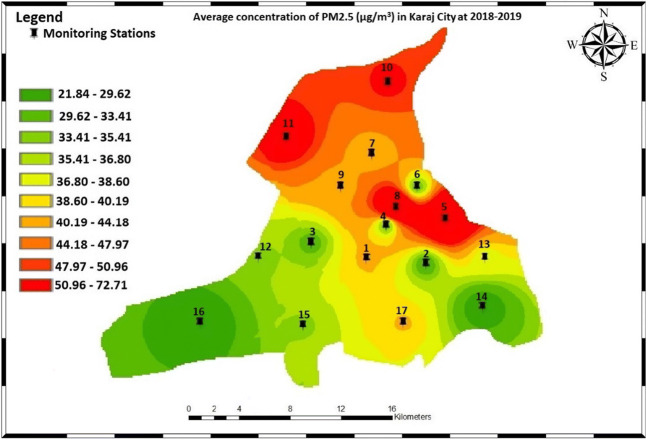
The concentration of PM2.5 particles in Karaj city was also different across the seasons of 2018–2019. Based on the analysis, it was observed that station 5 had the maximum PM2.5 concentration has the average four season value (72.75 µg/m3), followed by station 8 (68.41 µg/m3). On the other hand, station 16 had the minimum mean annual PM2.5 concentration (21.84 µg/m3). This indicates that station 5 (around the largest hospital of Karaj city) is facing a serious health risk. Figure 5 demonstrates distribution of PM2.5 particles based on the mean annual concentration in the ambient air of Karaj city. Based on this figure, the more we approach the North, because of the presence of mainlines of the city to other cities and provinces of the country as well as the various factories and industries that are potentially pollutant, PM2.5 concentration grows. Meanwhile, in the eastern side of the city, because of the presence of the largest hospital and never-ending traffic, again high concentrations are observed. On the other hand, the more we approach the south of the city, PM2.5 concentration diminishes. In some points located in the center of the city such as site 2, lower PM2.5 concentrations are observed. The concentration of PM2.5 measured in our study, compared to previous studies in Europe and Asia, is shown in Table 1.
Fig. 5.
Distribution of average annual concentration of PM2.5 in stations of monitoring
Table 1.
PM2.5 concentration in Karaj (the present study) and comparison with data from other countries (µg/m3)
| Country | Site | Year | PM2.5 Concentration(µg/m3) | Reference |
|---|---|---|---|---|
| Pakistan | Karachi | 2009 | 75 | [43] |
| Saudi Arabia | Jeddeh | 2011 | 28.4 | [44] |
| Italy | Milan | 2004 | 49.74 | [45] |
| China | Hong Kong | 2008 | 58.41 | [42] |
| Iran | Urmia | 2013 | 30 | [46] |
| Iran | Ahwaz | 2012 | 114.80 | [47] |
| Iran | Bushehr | 2016 | 65.77 | [38] |
| Iran | Karaj | 2019 | 40.65 | The present study |
Concentrations and seasonal variations of heavy-metal components in PM2.5
Generally, metals are different from other toxic substances, as they are neither created nor degraded by the human body. Nevertheless, its usage by the body causes potential health effects in two ways: (a) direct emission into the air by human activities, (b) changes in biochemistry of elements, geological and biological cycles, and naturally physical processes and bioaccumulation result in redistribution of metals. Hence, redistribution of metals is reflected by both natural and to some extent industrial sources.
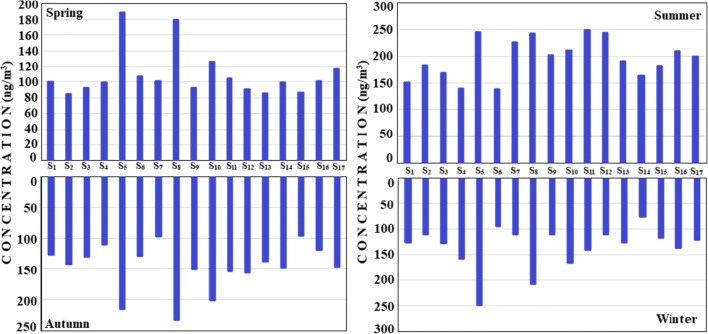
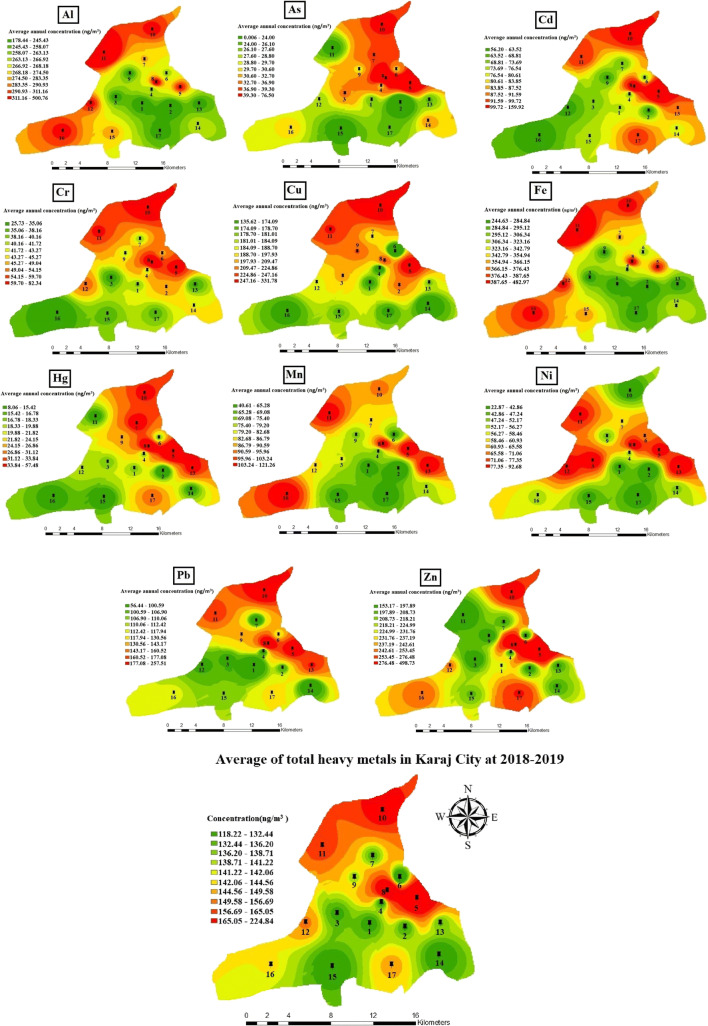
Figure 6 demonstrates the range of the mean concentration of the 11 heavy metals present in PM2.5 in Karaj between 2018 and 2019. Based on this box plot, the mean total concentration of heavy metals was obtained as 138.69 ng/m3. Based on this diagram, iron with the mean of 336.86 ng/m3 claimed the largest value throughout the study period, followed by aluminum (278.91), zinc (241.77), copper (203.23), lead (133.11), manganese (84.67), cadmium (83.97), nickel (60.83), chromium (49.51), arsenic (32.09), and mercury (24.82) ng/m3. From among the heavy metals in PM2.5, iron and aluminum also exist abundantly in the earth’s crust, and naturally their concentration is higher than that of other metals. Further, the presence of these two metals in PM2.5 is also due to local as well as regional dust in the soil and roads. Barraza et al., reported the maximum concentration of heavy metals for iron [48]. Hus also showed that the iron concentration was higher than that of other elements [49]. Lead is another PM2.5-bound heavy metal, whose mean value in this study was lower than the standard limit set by WHO (500 ng/m3). Although lead has been removed completely from the fuel consumed by vehicles, the amount of lead found in different parts of air can be due to worn-out parts of vehicles as well as the dust emitted in response to wind blow in the air. In the study by Deng, the concentration of lead was obtained as around 215 ng/m3, which is similar to our study given its lower concentration compared to the standard [50]. Also, Wang obtained 133 ng/m3 [32]. Figure 7 displays the mean seasonal value of the sampling sites. As can be seen, stations 5 and 8 have the maximum extent of pollution in terms of total concentration of heavy metals in four seasons. The high total concentration of metals in these two sites is due to the type of land-use and topographic conditions as well as the winds that blow from east to north of the city. Further, these two points are considered as high-traffic regions. Meanwhile, there are industrial sources around these points which use fossil fuels, which can thus contribute to the high concentration of metals.
Fig. 6.
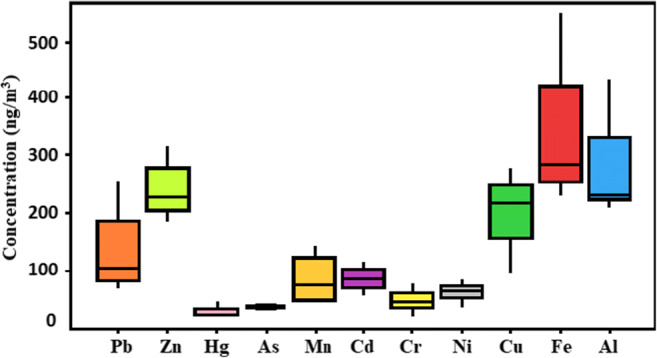
Box plot Concentration of heavy metals bounded with PM2.5 particulate in period of this study
Fig. 7.
Averages of heavy metals concentrations at different seasons
Figure 8 indicates the mean seasonal total concentration of heavy metals throughout the study in Karaj. In summer due to higher consumption of fossil fuels and development of factories in this city as well as frequent trips inside the city because of the routes connecting the city to 15 provinces of the country, the metals’ concentration has increased. In autumn, because of temperature inversion, the concentration has increased beyond winter and spring. In autumn and winter, because of the increase in the human emission sources such as burning biomass, coal combustion for meeting the heating demands, as well as unsuitable meteorological conditions including low wind speed and temperature inversion, the distribution of pollutants is higher in these two seasons compared to spring. Figure 9 indicates the distribution of every single metal across the sampling station. Clearly, sites 5, 8, and 10 have had the greatest pollution in terms of heavy metals. Thus, necessary measures should be taken to mitigate air pollution and in turn reduce the mortality in these points.
Fig. 8.
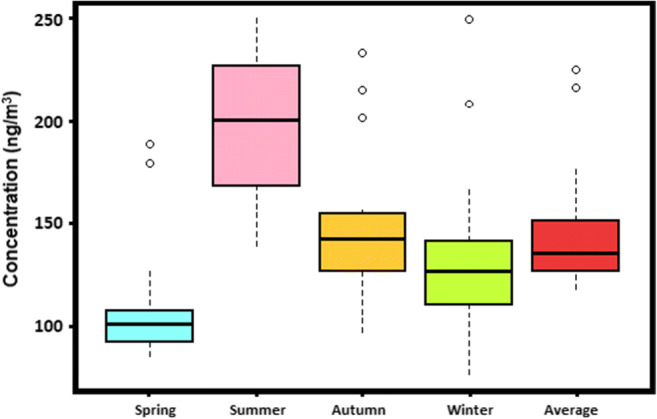
Box plot of the average concentration of heavy metals in different seasons of the year 2018-19
Fig. 9.
Distribution of average annual concentration of heavy metals in stations of monitoring
The relationship between meteorological parameters and concentration of PM2.5-bound heavy metals
In the present study, throughout the sampling period, meteorological parameters (temperature, pressure, humidity, and wind speed) have been measured by PHB-318 portable device to examine their impact on the concentration of PM2.5-bound heavy metals. Nevertheless, other factors such as the level of precipitation, dew point, and UV radiation should not be neglected. The PM2.5-bound heavy metals have a weak and negative relationship with relative humidity (r = -0.219, p < 0.018), but there is a positive relationship with wind speed (r = 0.38, p < 0.017), temperature (r = 0.418, p < 0.019), and pressure (r = 0.184, p < 0.402). The wind blow causes displacement of particles thereby scattering them in the air, and as such can be considered as one of the reasons for elevation of heavy metal concentration. Also, Ansari et al., found a positive relationship between temperature and concentration of PM2.5 particles (r = 0.42, p < 0.018) [51]. In another study, Bahrami et al., showed that there is a positive relationship between temperature and PM2.5 concentration [36]. Also, Hou et al. observed that PM2.5 concentration has a positive relationship with air temperature in four seasons [52]. Also, Wang et al. [53] and IL ten [54] found similar results to ours regarding the effect of each of these parameters on concentration.
Possible sources of heavy metal in ambient air of Karaj
To simplify the results, three principal components were extracted that explained 43.12, 26.98 and 19.56% of the total variance, respectively. According to the Fig. 10, the first component (C1) contains zinc, copper, iron, manganese, and aluminum, indicating that these types of metals may have a common source. The second component (C2) was also linked to lead and cadmium, which probably had a common source. Finally, the third component (C3) relates to chromium. Heavy metal profile of Factor 1 in PCA analysis with emission characteristics of aluminum, zinc, copper, iron, magnesium, and nickel from sources such as scrap packaging, clothing accessories, stainless steel, ceramics, electronic products, mechanical wear of electrical components, automotive parts and metal parts of used equipment are compatible. In general, factors such as high temperatures also accelerate the corrosion processes of metal parts of buildings (doors and windows), which often include Al, Zn, Cu, Mn, Fe and Ni alloys, eventually releasing these metals into the environment and accumulating of them at the particulate matter in the air. In the case of Factor 2 (lead, cadmium, arsenic and mercury), it is also noted that these metals originate from sources such as car fuels, exhaust gases, decorative materials, batteries, indoor smoking, the paint used for painting walls, erosion and corrosion of rubber of cars [55]. Therefore, Factor 2 appears to come from traffic sources and latex paint additives. Also, based on the analysis of the results and the presented figure, it is observed that the chromium metal itself is in factor 3 alone. Based on the obtained results and various studies, it can be concluded that chromium metal mainly originates from natural sources.
Fig. 10.
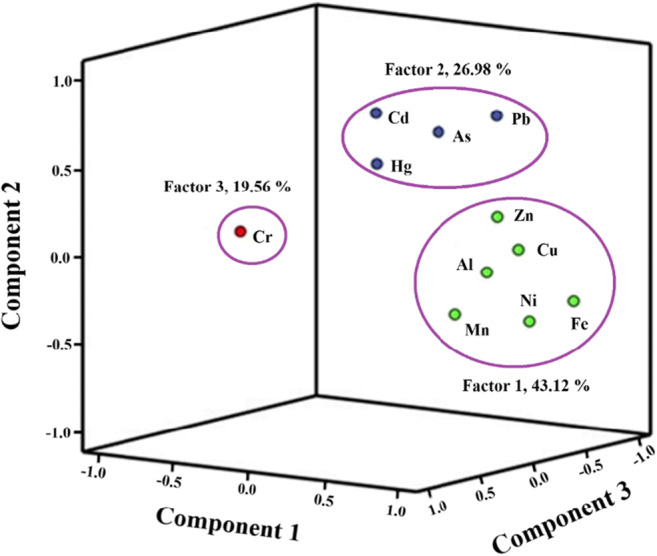
Score plots of principal component analysis (PCA) from relative contributions of the heavy metals for ambient air samples as well as suspected sources
Potential health effects
Risk assessment can reveal negative health effects (carcinogenic and non-carcinogenic) resulting from exposure to environmental pollutants. The model recommended for this purpose has been presented by American Environmental Protection Agency (EPA) [56]. Hazard quotient (HQ) indeed indicates the level of nocarcinogenic risk for each of the heavy metals through the respiratory pathway. If HQ < 1, then it means low risk, while HQ > 1 is considered as high-risk. ILCR shows the risk of developing cancer throughout the lifetime. In case this value is ILCR < 10− 6, the risk is low, 10− 6 <ILCR < 10− 4 indicates acceptable risk, and ILCR > 10− 4 shows high-risk. Due to differences in behaviors and respiratory system, the calculations related to risk assessment have been performed for children and adult groups. Generally, people can be exposed to heavy metals in air particles in three ways: (1) direct inhalation of atmospheric particles through the mouth and nose, (2) Absorption of trace elements in particles attached to the exposed skin, and (3) Entrance of atmospheric particles into the digestive system because of sedimentation [57].
In this study, risk assessment was performed for both children and adults for 17 points in Karaj. As can be seen in Table 2, HQ had the maximum and minimum values for cadmium and aluminum for children respectively, while the respective values for adults belonged to nickel and cadmium respectively. Further, for ILCR, cadmium claimed the largest value while nickel showed the minimum value for children, while for adults manganese and lead showed the maximum and minimum values. Our results concurred with the study by dobaradaran et al. [38].
Table 2.
The chronic Hazard Quotient (HQ) and excess life cancer risk (ILCR) of heavy metals in Karaj city
| Trace Element | Children | Adult | ||
|---|---|---|---|---|
| HQ | ILCR | HQ | ILCR | |
| AL | 0.024 | 3.91E-06 | 0.39 | 1.56E-05 |
| Mn | 0.03 | 1.17E-05 | 0.82 | 4.74E-05 |
| As | 0.76 | 4.92E-05 | 0.30 | 1.97E-06 |
| Cd | 6.61 | 1.19E-04 | 0.28 | 4.81E-04 |
| Cr | 0.77 | 6.52E-05 | 0.31 | 2.66E-06 |
| Ni | 2.57 | 8.63E-06 | 0.267 | 2.77E-6 |
| Pb | - | 1.86E-06 | - | 7.47E-06 |
Conclusions
For the first time in the most industrial city of Iran, we studied and examined PM2.5-bound heavy metals and the effect of meteorological parameters on them. We also performed risk assessment of exposure to these compounds and possible sources of heavy metal in ambient air of Karaj four seasons in 2018–2019. The results indicated that Karaj citizens are exposed to PM2.5 concentrations above the WHO guideline, causing this city to be considered as one of the top six polluted cities of Iran, thereby jeopardizing the citizens’ health. The spatial distribution of PM2.5 concentration indicated that as we moved northward, because of huge traffic as well as presence of commercial centers and the routes connecting this city to most cities of the country, higher PM2.5 concentration is observed. The location of this city (48 away from capital of Iran) is also another reason for this high concentration. The level of heavy-metal concentration in Karaj city was high, which can cause considerable health and environmental risks. Thus, in terms of potential environmental risks, it was found that heavy metals in this city have exceeded serious ecological levels and can have considerable adverse environmental effects. In addition, the risk assessment of exposure to PM2.5-bound heavy metals in Karaj ambient air showed that the noncarcinogenic risk values are lower than the values recommended by EPA. Hence, concerning the geographical location of Karaj city and because of presence of numerous industries in this city, more attention should be paid to vehicle and fuel standards, developing their public transit systems, and relocating the industries to the outside of cities. Also, more extensive research is absolutely required alongside due attention by policymakers to air pollution in the city.
Acknowledgements
This article is the result of MSc approved thesis, research project no. 33150. Thus, the authors are thankful for the funding provided by the Department of Environmental Health Engineering Research Center of Environmental Health Technology, Iran University of Medical Sciences.
Funding
Support of this work by Recerch Center of Environmental Health Tecnology is gratefully acknowledged.
Compliance with ethical standards
Ethical approval
The authors of this article have covered all the ethical points, including non-plagiarism, duplicate publishing, data distortion, and data creation in this article. This project has been registered in Iran University of Medical Sciences with the code of ethics of IR.IUMS.REC.1397.312.
Conflict of interest
The authors of this article declare that they have no conflict of interests.
Footnotes
Publisher’s Note
Springer Nature remains neutral with regard to jurisdictional claims in published maps and institutional affiliations.
References
- 1.Hao Y, Peng H, Temulun T, Liu L-Q, Mao J, Lu Z-N, Chen H. How harmful is air pollution to economic development? New evidence from PM2. 5 concentrations of Chinese cities. J Clean Prod. 2018;172:743–57. [Google Scholar]
- 2.Nabizadeh R, Yousefi M, Azimi F. Study of particle number size distributions at Azadi terminal in Tehran, comparing high-traffic and no traffic area. MethodsX. 2018;5:1549–55. doi: 10.1016/j.mex.2018.11.013. [DOI] [PMC free article] [PubMed] [Google Scholar]
- 3.VU VT, Shi Z, Cheng J, Zhang Q, He K, Wang S, Harrison R. Assessing the impact of clean air action on air quality trends in Beijing using a machine learning. Atmos Chem Phys. 2019;19:11303–14. [Google Scholar]
- 4.Hajizadeh Y, Jafari N, Mohammadi A, Momtaz SM, Fanaei F, Abdolahnejad A. Concentrations and mortality due to short-and long-term exposure to PM 2.5 in a megacity of Iran (2014–2019) Environ Sci Pollut Res. 2020;27(30):38004–14. doi: 10.1007/s11356-020-09695-z. [DOI] [PubMed] [Google Scholar]
- 5.Kermani M, Arfaeinia H, Masroor K, Abdolahnejad A, Fanaei F, Shahsavani A, et al. Health impacts and burden of disease attributed to long-term exposure to atmospheric PM10/PM2. 5 in Karaj, Iran: effect of meteorological factors. Int J Environ Anal Chem. 2020;1–17. 10.1080/03067319.2020.1807534.
- 6.Dehghani MH, Jarahzadeh S, Hadei M, Mansouri N, Rashidi Y, Yousefi M. The data on the dispersion modeling of traffic-related PM10 and CO emissions using CALINE3; A case study in Tehran, Iran. Data in brief. 2018;19:2284–90. doi: 10.1016/j.dib.2018.07.019. [DOI] [PMC free article] [PubMed] [Google Scholar]
- 7.Arfaeinia H, Nabipour I, Ostovar A, Asadgol Z, Abuee E, Keshtkar M, Dobaradaran S. Assessment of sediment quality based on acid-volatile sulfide and simultaneously extracted metals in heavily industrialized area of Asaluyeh, Persian Gulf: concentrations, spatial distributions, and sediment bioavailability/toxicity. Environ Sci Pollut Res. 2016;23(10):9871–90. doi: 10.1007/s11356-016-6189-0. [DOI] [PubMed] [Google Scholar]
- 8.Bolognin S, Messori L, Zatta P. Metal ion physiopathology in neurodegenerative disorders. Neuromol Med. 2009;11(4):223–38. doi: 10.1007/s12017-009-8102-1. [DOI] [PubMed] [Google Scholar]
- 9.Jafari N, Ebrahimi AA, Mohammadi A, Hajizadeh Y, Abdolahnejad A. Evaluation of seasonal and spatial variations of Air Quality Index and ambient air pollutants in Isfahan using Geographic Information System. J Environ Health Sustain Dev. 2017;2(2):263–72. [Google Scholar]
- 10.Vahidi MH, Fanaei F, Kermani M. Long-term health impact assessment of PM2. 5 and PM10: Karaj, Iran. Int J Environ Health Eng. 2020;9(1):8. [Google Scholar]
- 11.Loomis D, Huang W, Chen G. The International Agency for Research on Cancer (IARC) evaluation of the carcinogenicity of outdoor air pollution: focus on China. Chin J Cancer. 2014;33(4):189. doi: 10.5732/cjc.014.10028. [DOI] [PMC free article] [PubMed] [Google Scholar]
- 12.Hassanvand MS, Naddafi K, Faridi S, Nabizadeh R, Sowlat MH, Momeniha F, Gholampour A, Arhami M, Kashani H, Zare A. Characterization of PAHs and metals in indoor/outdoor PM10/PM2. 5/PM1 in a retirement home and a school dormitory. Sci Total Environ. 2015;527:100–10. doi: 10.1016/j.scitotenv.2015.05.001. [DOI] [PubMed] [Google Scholar]
- 13.Lin YC, Li YC, Amesho KT, Shangdiar S, Chou FC, Cheng PC. Chemical characterization of PM2. 5 emissions and atmospheric metallic element concentrations in PM2. 5 emitted from mobile source gasoline-fueled vehicles. Sci Total Environ. 2020;739:139942. [DOI] [PubMed]
- 14.Hajizadeh Y, Mokhtari M, Faraji M, Abdolahnejad A, Mohammadi A. Biomonitoring of airborne metals using tree leaves: Protocol for biomonitor selection and spatial trend. MethodsX. 2019;6:1694–700. doi: 10.1016/j.mex.2019.07.019. [DOI] [PMC free article] [PubMed] [Google Scholar]
- 15.Fanaei F, Kermani M, Jafari AJ, Gholami MGM, Farzadkia M, Arfaeinia H, Shahsavani A, Norouzian A, Dowlati M. Investigation of relationship between particulate matter (PM2. 5) and meteorological parameters in Isfahan, Iran. J Air Pollut Health. 2020;5(2):97–106. [Google Scholar]
- 16.Liu K, Ren J. Characteristics, sources and health risks of PM2. 5-bound potentially toxic elements in the northern rural China. Atmos Pollut Res. 2019;10(5):1621–6. [Google Scholar]
- 17.Li W, Xu L, Liu X, Zhang J, Lin Y, Yao X, Gao H, Zhang D, Chen J, Wang W. Air pollution–aerosol interactions produce more bioavailable iron for ocean ecosystems. Sci Adv. 2017;3(3):e1601749. doi: 10.1126/sciadv.1601749. [DOI] [PMC free article] [PubMed] [Google Scholar]
- 18.Domingo JL, García F, Nadal M, Schuhmacher M. Autopsy tissues as biological monitors of human exposure to environmental pollutants. A case study: Concentrations of metals and PCDD/Fs in subjects living near a hazardous waste incinerator. Environ Res. 2017;154:269–74. doi: 10.1016/j.envres.2017.01.014. [DOI] [PubMed] [Google Scholar]
- 19.Rahama SM, Khider HE, Mohamed SNH, Abuelmaali SA, Elaagip AH. Environmental pollution of lead in traffic air and blood of traffic policemen in Khartoum State, Sudan. East Afr J Public Health. 2011;8(2):148–51. [PubMed] [Google Scholar]
- 20.Happo M, Salonen R, Hälinen A, Jalava P, Pennanen A, Dormans J, Gerlofs-Nijland M, Cassee F, Kosma V-M, Sillanpää M. Inflammation and tissue damage in mouse lung by single and repeated dosing of urban air coarse and fine particles collected from six European cities. Inhal Toxicol. 2010;22(5):402–16. doi: 10.3109/08958370903527908. [DOI] [PubMed] [Google Scholar]
- 21.Chen P, Bi X, Zhang J, Wu J, Feng Y. Assessment of heavy metal pollution characteristics and human health risk of exposure to ambient PM2. 5 in Tianjin, China. Particuology. 2015;20:104–9. [Google Scholar]
- 22.Kermani M, Jafari AJ, Gholami M, Fanaei F, Arfaeinia H. Association between meteorological parameter and PM2. 5 concentration in Karaj, Iran. Int J Environ Health Eng. 2020;9(1):4. [Google Scholar]
- 23.EPA. Compendium method TO-17: Determination of volatile organic compounds in ambient air using active sampling onto sorbent tubes. In Compendium of methods for the determination of toxic organic compounds in ambient air, 2nd ed., EPA/625/R-96/010b.1999. https://www3.epa.gov/ttnamti1/.
- 24.Rohra H, Tiwari R, Khare P, Taneja A. Indoor-outdoor association of particulate matter and bounded elemental composition within coarse, quasi-accumulation and quasi-ultrafine ranges in residential areas of northern India. Sci Total Environ. 2018;631:1383–97. doi: 10.1016/j.scitotenv.2018.03.095. [DOI] [PubMed] [Google Scholar]
- 25.Tahir NM, Poh S, Suratman S, Ariffin M, Shazali N, Yunus K. Determination of trace metals in airborne particulate matter of Kuala Terengganu, Malaysia. Bull Environ Contam Toxicol. 2009;83(2):199–203. doi: 10.1007/s00128-009-9751-3. [DOI] [PubMed] [Google Scholar]
- 26.Pandey B, Agrawal M, Singh S. Assessment of air pollution around coal mining area: emphasizing on spatial distributions, seasonal variations and heavy metals, using cluster and principal component analysis. Atmos Pollut Res. 2014;5(1):79–86. [Google Scholar]
- 27.Farrokhzadeh H, Jafari N, Sadeghi M, Talesh Alipour M, Amin MM, Abdolahnejad A. Estimation of spatial distribution of PM10, lead, and radon concentrations in Sepahanshahr, Iran using Geographic Information System (GIS) J Mazandaran Univ Med Sci. 2018;27(159):84–96. [Google Scholar]
- 28.Chen X, Lu X. Contamination characteristics and source apportionment of heavy metals in topsoil from an area in Xi’an city, China. Ecotoxicol Environ Saf. 2018;151:153–60. doi: 10.1016/j.ecoenv.2018.01.010. [DOI] [PubMed] [Google Scholar]
- 29.Mojarrad H, Fouladi Fard R, Rezaali M, Heidari H, Izanloo H, Mohammadbeigi A, et al. Spatial trends, health risk assessment and ozone formation potential linked to BTEX. Hum Ecol Risk Assess. 2020;26(10):2836–57.
- 30.Mohammadi A, Hajizadeh Y, Taghipour H, Mosleh Arani A, Mokhtari M, Fallahzadeh H. Assessment of metals in agricultural soil of surrounding areas of Urmia Lake, northwest Iran: A preliminary ecological risk assessment and source identification. Hum Ecol Risk Assess Int J. 2018;24(8):2070–87. [Google Scholar]
- 31.Mohammadi A, Ghassoun Y, Löwner M-O, Behmanesh M, Faraji M, Nemati S, Toolabi A, Abdolahnejad A, Panahi H, Heydari H. Spatial analysis and risk assessment of urban BTEX compounds in Urmia, Iran. Chemosphere. 2020;246:125769. doi: 10.1016/j.chemosphere.2019.125769. [DOI] [PubMed] [Google Scholar]
- 32.Wang F, Wang J, Han M, Jia C, Zhou Y. Heavy metal characteristics and health risk assessment of PM2. 5 in students’ dormitories in a university in Nanjing, China. Build Environ. 2019;160:106206. [Google Scholar]
- 33.U.S. Environmental Protection Agency. Risk assessment guidance for Superfund, Vol 1: Human health evaluation manual. Part A, Interim Final. EPA 540/1-89/002. Office of Emergency and Remedial Response, Washington, DC.1989.
- 34.Li Z, Ma Z, van der Kuijp TJ, Yuan Z, Huang L. A review of soil heavy metal pollution from mines in China: pollution and health risk assessment. Sci Total Environ. 2014;468:843–53. doi: 10.1016/j.scitotenv.2013.08.090. [DOI] [PubMed] [Google Scholar]
- 35.Karimi A, Shirmardi M, Hadei M, Birgani YT, Neisi A, Takdastan A, Goudarzi G. Concentrations and health effects of short-and long-term exposure to PM2. 5, NO2, and O3 in ambient air of Ahvaz city, Iran (2014–2017) Ecotoxicol Environ Saf. 2019;180:542–548. doi: 10.1016/j.ecoenv.2019.05.026. [DOI] [PubMed] [Google Scholar]
- 36.Asl FB, Leili M, Vaziri Y, Arian SS, Cristaldi A, Conti GO, Ferrante M. Health impacts quantification of ambient air pollutants using AirQ model approach in Hamadan, Iran. Environ Res. 2018;161:114–21. doi: 10.1016/j.envres.2017.10.050. [DOI] [PubMed] [Google Scholar]
- 37.Miri A, Ahmadi H, Ghanbari A, Moghaddamnia A. Dust storms impacts on air pollution and public health under hot and dry climate. Int J Energy Environ. 2007;2(1):101–5. [Google Scholar]
- 38.Ghasemi FF, Dobaradaran S, Saeedi R, Nabipour I, Nazmara S, Abadi DRV, Arfaeinia H, Ramavandi B, Spitz J, Mohammadi MJ. Levels and ecological and health risk assessment of PM 2.5-bound heavy metals in the northern part of the Persian Gulf. Environ Sci Pollut Res. 2020;27(5):5305–13. doi: 10.1007/s11356-019-07272-7. [DOI] [PubMed] [Google Scholar]
- 39.Wang Y, Zhuang G, Zhang X, Huang K, Xu C, Tang A, Chen J, An Z. The ion chemistry, seasonal cycle, and sources of PM2. 5 and TSP aerosol in Shanghai. Atmos Environ. 2006;40(16):2935–52. [Google Scholar]
- 40.Zhang P, Hong B, He L, Cheng F, Zhao P, Wei C, Liu Y. Temporal and spatial simulation of atmospheric pollutant PM2. 5 changes and risk assessment of population exposure to pollution using optimization algorithms of the back propagation-artificial neural network model and GIS. Int J Environ Res Public Health. 2015;12(10):12171–95. doi: 10.3390/ijerph121012171. [DOI] [PMC free article] [PubMed] [Google Scholar]
- 41.Tai AP, Mickley LJ, Jacob DJ. Correlations between fine particulate matter (PM2. 5) and meteorological variables in the United States: Implications for the sensitivity of PM2. 5 to climate change. Atmos Environ. 2010;44(32):3976–84. [Google Scholar]
- 42.Ho K, Lee S, Chan CK, Jimmy CY, Chow JC, Yao X. Characterization of chemical species in PM2. 5 and PM10 aerosols in Hong Kong. Atmos Environ. 2003;37(1):31–9. [Google Scholar]
- 43.Shahid I, Kistler M, Mukhtar A, Ghauri BM, Ramirez-Santa Cruz C, Bauer H, Puxbaum H. Chemical characterization and mass closure of PM10 and PM2. 5 at an urban site in Karachi–Pakistan. Atmos Environ. 2016;128:114–23. [Google Scholar]
- 44.Khodeir M, Shamy M, Alghamdi M, Zhong M, Sun H, Costa M, Chen L-C, Maciejczyk P. Source apportionment and elemental composition of PM2. 5 and PM10 in Jeddah City, Saudi Arabia. Atmos Pollut Res. 2012;3(3):331–40. doi: 10.5094/apr.2012.037. [DOI] [PMC free article] [PubMed] [Google Scholar]
- 45.Marcazzan G, Ceriani M, Valli G, Vecchi R. Source apportionment of PM10 and PM2. 5 in Milan (Italy) using receptor modelling. Sci Total Environ. 2003;317(1–3):137–47. doi: 10.1016/S0048-9697(03)00368-1. [DOI] [PubMed] [Google Scholar]
- 46.Gholampour A, Nabizadeh R, Hassanvand MS, Nazmara S, Mahvi AH. Elemental composition of particulate matters around Urmia Lake, Iran. Toxicol Environ Chem. 2017;99(1):17–31. [Google Scholar]
- 47.Shahsavani A, Naddafi K, Haghighifard NJ, Mesdaghinia A, Yunesian M, Nabizadeh R, Arahami M, Sowlat M, Yarahmadi M, Saki H. The evaluation of PM10, PM2. 5, and PM1 concentrations during the Middle Eastern Dust (MED) events in Ahvaz, Iran, from april through september 2010. J Arid Environ. 2012;77:72–83. [Google Scholar]
- 48.Barraza F, Jorquera H, Valdivia G, Montoya LD. Indoor PM2. 5 in Santiago, Chile, spring 2012: Source apportionment and outdoor contributions. Atmos Environ. 2014;94:692–700. [Google Scholar]
- 49.Hsu C-Y, Chiang H-C, Lin S-L, Chen M-J, Lin T-Y, Chen Y-C. Elemental characterization and source apportionment of PM10 and PM2. 5 in the western coastal area of central Taiwan. Sci Total Environ. 2016;541:1139–50. doi: 10.1016/j.scitotenv.2015.09.122. [DOI] [PubMed] [Google Scholar]
- 50.Deng W, Louie P, Liu W, Bi X, Fu J, Wong MH. Atmospheric levels and cytotoxicity of PAHs and heavy metals in TSP and PM2. 5 at an electronic waste recycling site in southeast China. Atmos Environ. 2006;40(36):6945–55. [Google Scholar]
- 51.Ansari M, Ehrampoush MH. Meteorological correlates and AirQ + health risk assessment of ambient fine particulate matter in Tehran, Iran. Environ Res. 2019;170:141–50. doi: 10.1016/j.envres.2018.11.046. [DOI] [PubMed] [Google Scholar]
- 52.Hou X, Fei D, Kang H, Zhang Y, Gao J. Seasonal statistical analysis of the impact of meteorological factors on fine particle pollution in China in 2013–2017. Nat Hazards. 2018;93(2):677–98. [Google Scholar]
- 53.Wang H, Li J, Peng Y, Zhang M, Che H, Zhang X. The impacts of the meteorology features on PM2. 5 levels during a severe haze episode in central-east China. Atmos Environ. 2019;197:177–89. [Google Scholar]
- 54.Ilten N, Selici AT. Investigating the impacts of some meteorological parameters on air pollution in Balikesir, Turkey. Environ Monit Assess. 2008;140(1–3):267–77. doi: 10.1007/s10661-007-9865-1. [DOI] [PubMed] [Google Scholar]
- 55.Yongming H, Peixuan D, Junji C, Posmentier ES. Multivariate analysis of heavy metal contamination in urban dusts of Xi’an, Central China. Sci Total Environ. 2006;355(1–3):176–86. doi: 10.1016/j.scitotenv.2005.02.026. [DOI] [PubMed] [Google Scholar]
- 56.Wu S, Peng S, Zhang X, Wu D, Luo W, Zhang T, Zhou S, Yang G, Wan H, Wu L. Levels and health risk assessments of heavy metals in urban soils in Dongguan, China. J Geochem Explor. 2015;148:71–8. [Google Scholar]
- 57.Awad AHA. Airborne asbestos fibres and mesothelioma in the last 20 years in Egypt: a review. Atmos Pollut Res. 2011;2(4):445–51. [Google Scholar]


