Abstract
In the present study, reactive red 198 (RR198) dye removal from aqueous solutions by adsorption using municipal solid waste (MSW) compost ash was investigated in batch mode. SEM, XRF, XRD, and BET/BJH analyses were used to characterize MSW compost ash. CNHS and organic matter content analyses showed a low percentage of carbon and organic matter to be incorporated in MSW compost ash. The design of adsorption experiments was performed by Box–Behnken design (BBD), and process variables were modeled and optimized using Box–Behnken design-response surface methodology (BBD-RSM) and genetic algorithm-artificial neural network (GA-ANN). BBD-RSM approach disclosed that a quadratic polynomial model fitted well to the experimental data (F-value = 94.596 and R2 = 0.9436), and ANN suggested a three-layer model with test-R2 = 0.9832, the structure of 4-8-1, and learning algorithm type of Levenberg–Marquardt backpropagation. The same optimization results were suggested by BBD-RSM and GA-ANN approaches so that the optimum conditions for RR198 absorption was observed at pH = 3, operating time = 80 min, RR198 = 20 mg L−1 and MSW compost ash dosage = 2 g L−1. The adsorption behavior was appropriately described by Freundlich isotherm, pseudo-second-order kinetic model. Further, the data were found to be better described with the nonlinear when compared to the linear form of these equations. Also, the thermodynamic study revealed the spontaneous and exothermic nature of the adsorption process. In relation to the reuse, a 12.1% reduction in the adsorption efficiency was seen after five successive cycles. The present study showed that MSW compost ash as an economical, reusable, and efficient adsorbent would be desirable for application in the adsorption process to dye wastewater treatment, and both BBD-RSM and GA-ANN approaches are highly potential methods in adsorption modeling and optimization study of the adsorption process. The present work also provides preliminary information, which is helpful for developing the adsorption process on an industrial scale.
Subject terms: Environmental sciences, Chemistry
Introduction
In parallel with rapid population increase and high urbanization and industrialization rate, the concerns related to the release of various pollutants to many groundwater resources have grown dramatically around the world in the last decades1. Many industries like paper printing, textile dyeing, and other sectors such as photography, pharmaceuticals, food, and cosmetic industries annually generate wastewaters containing a wide variety of synthetic aromatic dyes in large quantity2. Among different types of water pollutants, synthetic dyes are regarded as an important toxic group for humans, the fauna and flora, even at a low level of exposure3. Therefore, human health and environmental problems make the efficient treatment of these types of wastewaters so necessary. So far, different processes have been investigated and developed for industrial wastewater treatment. Although biological processes have attracted significant interest as an economical and efficient treatment method, those are faced with several problems of the grown death rate of bacteria population exposed to the high toxicity wastewaters and hard biodegradability of the dye wastewaters4. Recently, advanced oxidation processes have received great attention as alternative treatments for recalcitrant wastewaters. However, the production of toxic by-products remains a major disadvantage of these methods5. The adsorption process has received wide attention for efficient treatment of different water matrices due to its simplicity, economic feasibility, regulatory compliance, public acceptance, and environmentally friendly procedure6. Availability, cheapness, high efficiency, and environmentally friendly user, easy to use, easy operation and non-susceptibility of an adsorbent to pollutants can potentially encourage authorities to consider the adsorption process as one of the most deserved treatment technique7. In spite of the abundant application of activated carbon as an efficient adsorbent due to its virtues such as superior adsorption capacity, large specific surface area, high production cost and reuse-related drawback causes that the environmental researchers make more effort to find new efficient adsorbent without shortcomings coming from activated carbon8. Composting is an efficient, sustainable, and cheap solid waste management approach is used for the biological degradation of biodegradable organic wastes in aerobic conditions9. In some study, fly ash derived from various sources has attracted significant interest as novel adsorbents for the uptake of various pollutants from aquatic environments, including date seed ash10, activated fly ash11, coal fly ash12,13, fly ash zeolite14, and municipal solid waste incineration fly ash15. No study was reported in the literature to investigate the adsorptive ability of ash derived from the combustion of municipal solid waste (MSW) compost. Therefore, the present study aimed to investigate the adsorptive capability of MSW compost ash for RR198 dye in synthetic wastewater. Under the treatment process, the process parameters, namely initial pH of the solution, contact time, adsorbent dosage, and initial dye concentration, were modeled and optimized by Box–Behnken design-response surface methodology (BBD-RSM) and artificial neural network (GA-ANN). RSM technique estimates the possible correlation between the input parameters and dependent parameter, revealing quadratic and interactive effects of independent variables on a response, in parallel to the linear effect estimation, and reduces the replicate of experiments, and subsequently material cost and consuming time16. ANN approach is a robust mathematical tool for modelling different behaviors, even the complex non-linear relationship. Unlike RSM, ANN does not require necessarily any experimental design, so that this approach can be successful to model any informal set of the experimental data17,18. In the following, isotherm, kinetic, and thermodynamic characteristics of the RR198 dye absorption onto MSW compost ash, and reusability test of MSW compost ash were performed at the optimal condition of the process parameters. The other objectives were to characterize MSW compost ash by some analyses such as SEM, XRD, XRF, BET-BJH. Additionally, carbon content and CHNS analyses were done for MSW compost ash.
Materials and method
Materials
MSW compost was supplied by the waste management organization of Tehran municipality, Iran. RR198 was purchased from Alvan Sabet Company (Hamedan, Iran). The properties of the compost supplied were tabulated in Table 1.
Table 1.
Properties of the MSW compost.
| Sample | MSW compost |
|---|---|
| Organic matter content (%) | 68.8 ± 0.4 |
| Dry matter content (%) | 77.1 ± 0.7 |
| pH | 8.14 ± 0.17 |
| Electrical conductivity (mS cm−1) | 2.57 ± 0.4 |
| Respiration index (mg O2 g−1 OM h−1) | 1.67 |
| Bulk density (kg L−1) | 0.42 |
| Air-filled porosity (%) | 59 |
| Nitrogen Kjeldahl (%, dry basis) | 1.98 ± 0.13 |
| C/N ratio | 16 |
| E. coli (CFU g−1) | < 10 |
All the other chemicals and solvents used in this study were of analytical reagent grade and obtained from Merck Company. MSW compost ash was produced by keeping MSW compost under 550 °C temperature for 4 h in a furnace. Thereafter, compost ash was sieved below 20 mesh and stored in a bottle for further application6.
Experimental procedure
All the adsorption experiments were conducted in batch mode in a 500 mL sample volume. The effect of independent variables, namely initial pH of the solution, reaction time, MSW compost ash loading and initial RR198 concentration at the range and levels presented in Table 1, was investigated on the efficiency of RR198 uptake by MSW compost ash. Further, RR198 adsorption isotherm, kinetic and thermodynamic studies were performed based on experimental data at optimal condition. The initial pH of the medium was regulated by 0.1 N NaOH and 0.1 N H2SO4 solution, and the solution temperature was set by incubator shaker for thermodynamic studies. After each experiment, the MSW compost ash was isolated from the sample by centrifuging at 10,000 rpm for 15 min. DR 5000 spectrophotometer was employed to determine the remaining concentration of RR198 at a maximum absorptive wavelength of 518 nm19. All the adsorption experiments were conducted triplicate, and the results were reported as average values.
Characterization techniques for MSW compost ash
In order to evaluate surface characteristics of MSW compost ash, SEM analysis (SEM, HITACHI S-4160, Japan) was used, and XRD analysis was used in order to assess crystalline properties of MSW compost ash using an X'Pert Pro diffractometer (Rigaku RINT2200, Japan) at scanning range from 10° to 80° at 40 kV with the electron probe current of 30 mA. The chemical composition of MSW compost ash was identified using the Philips XRF machine (Philips PW1480 model). Specific surface area and pore size distribution of MSW compost ash were analyzed by using BET/BJH analysis by Quanta chrome NOVA2000 automatic analyzer. The organic content of the sample was determined based on the ASTM D-2974 method20. CHNS-O Thermo Finnigan Elementary Analyzer Flash EA 1112 was employed to measure the total content of carbon, hydrogen, nitrogen, and sulphur via combustion of MSW compost ash in the presence of O2. The carbonate content of the sample was quantified by calcimetry in a Bernard calcimeter21.
Experimental design, modeling, and optimization
In the present work, BBD experimental design approach was applied to provide data for process modeling in the range and level of the input parameters tabulated in Table 2. It was done in Design-Expert software.
Table 2.
Experimental ranges and levels of the process parameters used in the Box–Behnken design.
| Variable | Symbol | − 1 | 0 | + 1 |
|---|---|---|---|---|
| pH | X1 | 3 | 7 | 11 |
| Contact time(min) | X2 | 20 | 50 | 80 |
| MSW compost ash dosage (g) | X3 | 0.5 | 1.25 | 2 |
| RR198 concentration (mg L−1) | X4 | 20 | 60 | 100 |
The BBD-RSM approach was used to determine the relationships between the input variables and adsorption efficiency of RR198 by fitting the experimental data with a quadratic multivariate mathematical equation expressed as:
| 1 |
Here, y is predicted value (%), a0 the constant-coefficient described as intercept, ai, aii, aij stand for the linear, quadratic, and interaction regression coefficient, respectively, xi and xj correspond to the actual values of input variables, n and e are assigned to the input variable number and model error, respectively. Optimization of the input variables to maximize removal efficiency in the BBD-RSM technique was conducted based on a desirable function, in which the input factors were set in the fractional range, and the response was maximized22–24.
ANN approach was also used for modeling RR198 adsorption by MSW compost ash based on the same dataset. Multi-layered perception (MLP) is the most widely applied and researched neural network model, owing to its comparably simple algorithm and clear architecture24–26. In the present study, the MLP-ANN model constituted from Levenberg–Marquardt backpropagation training algorithm with three layers consisting of an input layer (four neurons), a hidden layer, and an output layer (one neuron), 1000 epochs, 1e−07 min-grad, and 1000 max-fail was used for process modeling. Tansig and purlin functions were used in the hidden layer and the last layer, respectively, as transfer functions. As predictive accuracy and performance of the ANN model are significantly affected by the number of hidden neurons, the best number of hidden neurons of the neural network was searched by means of empirical testing or trial and error. For this propose, the number of hidden neurons was varied from a minimum of 1 to a maximum of 20, and the optimal number was chosen based on the traditional measures of mean squared error (MSE) and determination coefficient (R2), which are determined as follows:
| 2 |
| 3 |
where zp,i is the predicted value, zexp,i and zav show the experimental value and the mean of experimental values, and N is the number of experimental runs. The experimental design matrix used in the ANN model was the one used in the BBD-RSM model. The dataset was partitioned into three groups in a random manner, including training (75%), validation (15%), and test (15%) dataset. The dataset was normalized to 0.1–0.9 range by Eq. (4) to minimize the error. It causes that the training happens more efficiently27:
| 4 |
Here, yi stands for the normalized xi, and xmin the minimum value of xi, and xmax the maximum value of xi.
The prediction capability of the developed BBD-RSM and ANN models was finally evaluated by MSE and R2 statistics. GA approach was used to optimize the ANN model in MATLAB 2013 software. For this purpose, the developed model was written in a script file, and the fractional points were considered as the upper and lower levels of the independent factors. Finally, the optimization results of the process parameters based on BBD-RSM and GA-ANN approaches were compared to each other, and some control experiments were done to assess the accuracy of the results7.
Results and discussion
Characterization of MSW compost ash
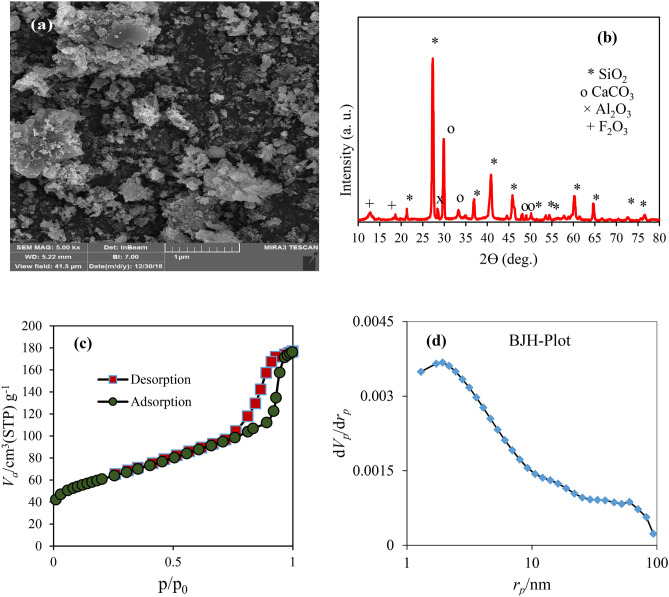
Morphology, geometries, and structural properties of MSW compost ash samples were analyzed using SEM images with a magnification of ×50,000. Figure 1a shows the size distribution, surface morphology and particle shape of MSW compost ash. As can be seen, the synthesized sample is porous, coarse, angled and irregular in nature. Also, it is also found that the sample is fabricated from micro-nano multi-scale particles. The chemical composition of MSW compost ash was determined by the XRF technique. The corresponding result revealed that the most abundant oxide components in the sample structure are related to SiO2 (52.7), CaO (15.9%) and Al2O3 (7.9%). Also, a small portion of MSW compost ash is produced from Fe2O3, MgO, K2O, and TiO2. XRD patterns of MSW compost ash are given in Fig. 1b. As expected, the spectrum identified the major contribution of SiO2 (JCPDS Card ID 01-077-1066), CaCO3 (JCPDS Card ID 98-005-2151), and a minor contribution of crystalline phases of Al2O3 and Fe2O3 (JCPDS Card ID 98-001-6597) in the MSW compost ash sample, which is in a consistent with the findings observed in XRF analysis21. The result of the BET surface area of the MSW compost ash powder is displayed in Fig. 1c. The analysis showed a specific surface area of 50.14 m2/g and a total pore volume of 0.214 m3/g for the MSW compost ash sample. BJH test was also utilized to identify the pore size distribution of MSW compost ash. The related results, as displayed in Fig. 1d, illustrated that the pore size distribution of the material is mesoporous, where pore size mainly falls into a range from 2 to 50. The larger pore size can be assigned to intra-aggregate porosity, and the smaller pore size can be related to intra-particle porosity.
Figure 1.
SEM (a), XRD (b), BET (c) and BJH analyses for CA.
Table 3 shows the results of CNHS analysis for MSW compost ash. It was found that MSW compost ash contains carbon of 4.2%, hydrogen of 0.17%, nitrogen of 0.1%, and sulfur of 0.06%. The total organic matter content of MSW compost ash was determined to be about 6.48%, arising from incomplete combustion of the MSW compost. Also, the obtained carbonate content was measured to be about 5.61%.
Table 3.
CNHS analysis and carbonate content of MSW compost ash.
| Sample | Organic matter content (%) | Carbonate content (%) | %C | %H | %N | %S |
|---|---|---|---|---|---|---|
| CA | 6.48 ± 0.14 | 5.61 ± 74 | 4.2 ± 0.01 | 0.17 ± 0.07 | 0.1 ± 0.009 | 0.06 ± 0.04 |
Statistical analysis and model fitting
The constraints of independent variables, experimental removal efficiency along with the predicted removal efficiency of RR 198 by the BBD-RSM approach is presented in Table 4. Based on the statistical ANOVA analysis (see Table 5), suggested a reduced polynomial quadratic model. P-value > 0.05 was the criteria for the removal of some model terms from the developed model. The F-test and probability value statistics for the model were found to be 2543 and < 0001, respectively, representing that there exists only a 0.01% chance for F-value to be due to noise. It confirms the significance of the developed model. The higher values of R2 (close to 1) justify a strong correlation between the experimental and predicted values. The correlation coefficient, R2 was found to be 0.9755, indicating that only less than 3% of the total variation is not explained by the model. The results also show a reasonable agreement between Pred R2 (0.9436) and the Adj R2 (0.9652), which is quite satisfactory. It validates that the unnecessary variables are not included in the final model. The lack of fit value was calculated as 0.4961, which was most preferred. It is worthy to note that the value greater than 0.05 was not significant relative to the pure error24. The following mathematical equation expresses the developed model:
| 5 |
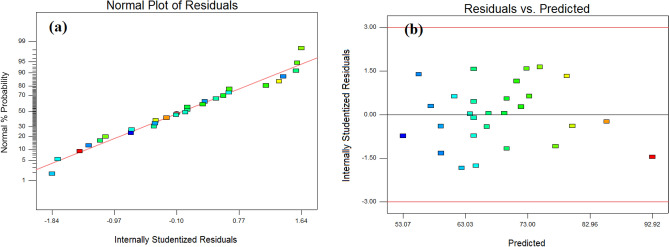
Diagnostic tools of normal plots were used to further verify the adequacy of the model. Figure 2a displays that the residual points are normally distributed around the straight line. Figure 2b shows a randomized distribution of residual points around the straight line, and the points do not follow a specific trend. To recognize the most effective parameters on the adsorption efficiency, the Pareto effect was calculated as follows28:
| 6 |
Here, Pi demonstrates the Pareto effect of each term included in the predicted model and bi shows the regression coefficients from the regression equation in terms of coded values. Figure 3 indicates that the adsorbent dose, initial solution pH, and contact time present the highest impact on the adsorption efficiency, respectively.
Table 4.
Box–Behnken design matrix and the experimental and response values of RR198 uptake by MSW compost ash.
| pH | Time (min) | Adsorbent dose (mg L−1) | RR198 Con. | Experimental removal (%) | Predicted value (%) (BBD-RSM) | Predicted value (%) (GA-ANN) |
|---|---|---|---|---|---|---|
| 3 | 20 | 0.5 | 20 | 65.9 | 66.45 | 65.87 |
| 11 | 20 | 2 | 100 | 66.8 | 66.74 | 64.92 |
| 7 | 50 | 1.25 | 20 | 70.4 | 69.64 | 69.54 |
| 3 | 80 | 0.5 | 20 | 81 | 79.25 | 80.96 |
| 7 | 80 | 1.25 | 60 | 67.8 | 69.63 | 67.72 |
| 7 | 50 | 2 | 60 | 73 | 71.21 | 72.87 |
| 11 | 80 | 0.5 | 20 | 63.8 | 63.77 | 64.25 |
| 7 | 50 | 0.5 | 60 | 58 | 57.54 | 58.30 |
| 3 | 20 | 2 | 100 | 74.9 | 72.82 | 75.04 |
| 11 | 80 | 0.5 | 100 | 62.1 | 61.27 | 60.49 |
| 7 | 50 | 1.25 | 100 | 62.3 | 64.74 | 61.90 |
| 11 | 20 | 0.5 | 20 | 57.4 | 55.57 | 57.38 |
| 7 | 50 | 1.25 | 60 | 65.1 | 64.38 | 64.66 |
| 11 | 20 | 2 | 20 | 69.3 | 69.24 | 69.30 |
| 3 | 80 | 2 | 20 | 91 | 92.92 | 90.62 |
| 11 | 20 | 0.5 | 100 | 52.1 | 53.07 | 55.75 |
| 11 | 80 | 2 | 20 | 76 | 77.44 | 74.55 |
| 3 | 20 | 0.5 | 100 | 57.4 | 59.15 | 57.48 |
| 3 | 50 | 1.25 | 60 | 74.1 | 73.23 | 75.71 |
| 11 | 50 | 1.25 | 60 | 59.9 | 62.45 | 59.50 |
| 3 | 20 | 2 | 20 | 79.6 | 80.12 | 79.58 |
| 11 | 80 | 2 | 100 | 77.1 | 74.94 | 70.76 |
| 3 | 80 | 0.5 | 100 | 72.3 | 71.95 | 72.20 |
| 7 | 20 | 1.25 | 60 | 58.5 | 59.13 | 58.63 |
| 3 | 80 | 2 | 100 | 85.3 | 85.62 | 84.82 |
| 7 | 50 | 1.25 | 60 | 63.2 | 64.38 | 64.66 |
| 7 | 50 | 1.25 | 60 | 66.9 | 64.38 | 64.66 |
| 7 | 50 | 1.25 | 60 | 64.2 | 64.38 | 64.66 |
Table 5.
ANOVA results and determination coefficients for the BBD-RSM model developed for the treatment process.
| Source | Sum of squares | Mean square | F value |
p-value Prob > F |
|---|---|---|---|---|
| Model | 2225.231 | 278.1538 | 94.59664 | < 0.0001 |
| A-pH | 522.7222 | 522.7222 | 177.7713 | < 0.0001 |
| B-Time | 496.125 | 496.125 | 168.7259 | < 0.0001 |
| C-Adsorbent dose | 840.5 | 840.5 | 285.8435 | < 0.0001 |
| D-RR198 Con. | 108.045 | 108.045 | 36.74475 | < 0.0001 |
| AB | 21.16 | 21.16 | 7.196252 | 0.0147 |
| AD | 23.04 | 23.04 | 7.835616 | 0.0114 |
| A^2 | 40.40358 | 40.40358 | 13.74075 | 0.0015 |
| D^2 | 26.6438 | 26.6438 | 9.061224 | 0.0072 |
| Residual | 55.86798 | 2.94042 | ||
| Lack of fit | 48.45798 | 3.028623 | 1.226163 | 0.4961 |
| R2 = 0.9755 | Adj R2 = 0.9652 | Pred R2 = 9436 | ||
Figure 2.
The normal plot of residual values (a), the diagnostic plot of residuals versus predicted values (b).
Figure 3.
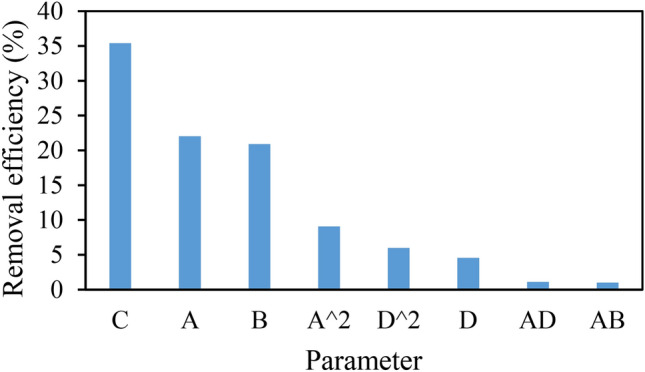
Pareto chart for adsorption of RR198 on MSE compost ash.
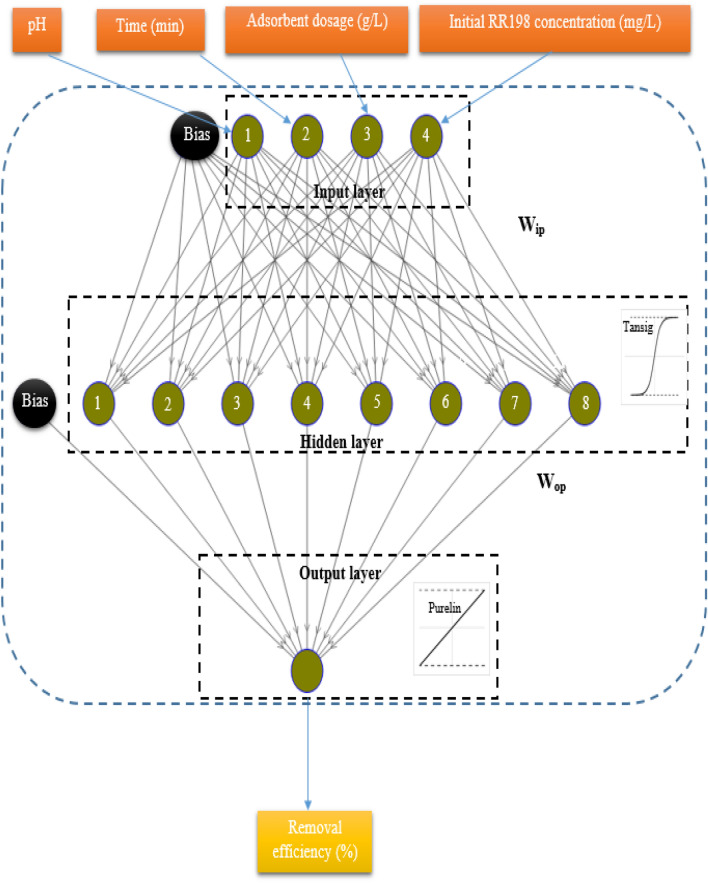
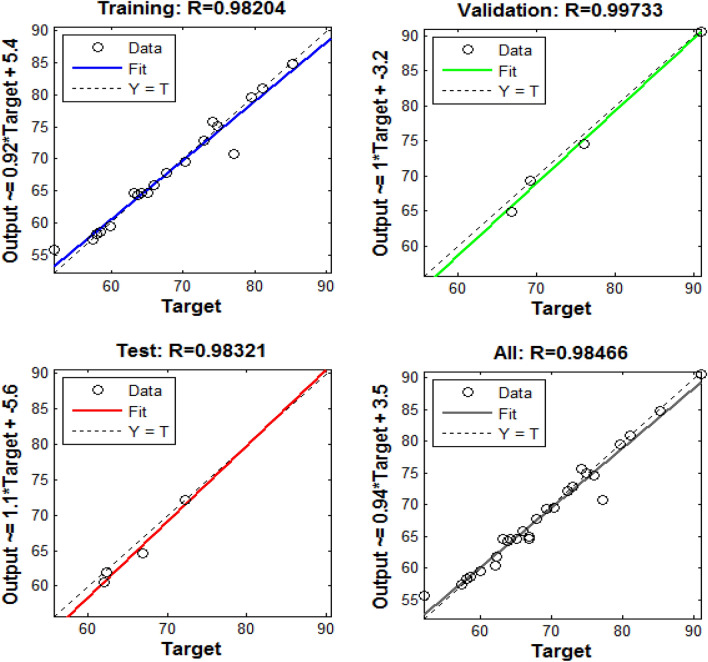
The dataset in Table 4 was also modeled using the ANN method. As before stated, the number of hidden neurons was varied from 1 to 20 to search for the best number of neurons with the lowest MSE value and highest R2 value. The results showed that 8 hidden neurons present the smallest MSE and highest R2, which give the robust prediction by the ANN model. Accordingly, 4-8-1 topology (Fig. 4) was chosen as the best architecture of the ANN model. Figure 5 shows the R2 values of 0.9820, 0.9973, 0.9832, and 0.9846 for training, validation, test, and all data, respectively. These results demonstrate a close correlation and a satisfactory agreement between the experimental and predicated removal efficiency so that this model predicts experimental data with very high accuracy24. ANN model predictions are presented in Table 4. ANN model can be expressed as Eq. (7) with the weights and biases given in Table 6.
| 7 |
where Yn presents predicated value, f0 transfer function (here, tangent sigmoid) associated with output layer, b0 bias of output layer, wk the weights of the output layer, fh shows transfer function (here, purelin) in the hidden layer, bhk bias associated with the hidden layer, wik the weights of the hidden layer, and Xni independent variable.
Figure 4.
The neural network architecture for a three-layer ANN model with 4-5-1 topology.
Figure 5.
Regression plots for training, testing, and validation, and all data of the three-layer ANN model.
Table 6.
Obtained weights and biases of the built ANN model for the RR198 adsorption by MSE compost ash.
| Input (4)-hidden layer (8) | Hidden layer (8)-output (1) | |||||
|---|---|---|---|---|---|---|
| Weights | Bias | Weight | Bias | |||
| 0.049364 | 1.8911 | 1.3882 | − 0.85547 | 0.26853 | − 2.7228 | 0.25515 |
| − 0.83297 | 1.9481 | − 1.2487 | 1.217 | − 0.047469 | 2.087 | |
| − 1.1795 | − 2.4692 | 0.68868 | 1.3754 | − 0.041984 | 1.1439 | |
| 1.1868 | − 1.468 | 1.2176 | 0.95268 | 0.09805 | − 1.3409 | |
| − 0.80077 | − 2.5144 | 0.54167 | − 0.32138 | − 0.1717 | 0.47525 | |
| 1.5611 | 1.6247 | 1.2859 | − 0.82074 | − 0.27311 | − 0.84014 | |
| 1.1779 | 1.7681 | − 0.84595 | − 1.1771 | 0.052601 | − 0.090767 | |
| − 1.9679 | 1.0206 | 1.2434 | 0.86506 | 0.14268 | − 0.53357 | |
Prediction precision of the BBD-RSM and ANN developed models are assessed by comparing the R2 (as criteria for describing the strength and direction of predicated and experimental values) and MSE (revealing error distribution and the magnitude of errors) values of the ANN and BBD-RSM model and model. R2 and MSE were calculated as 0.9755 and 0.0791 for the BBD-RSM model and 0.9846 and 0.0259 for the ANN model. Although statistical criteria show relatively better values for the ANN model compared with the BBD-RSM model, both the models manifested that an excellent prediction ability of experimental data, thus, can be used for modeling and recognizing the behavior of the adsorption process.
Univariate optimization of the adsorption process
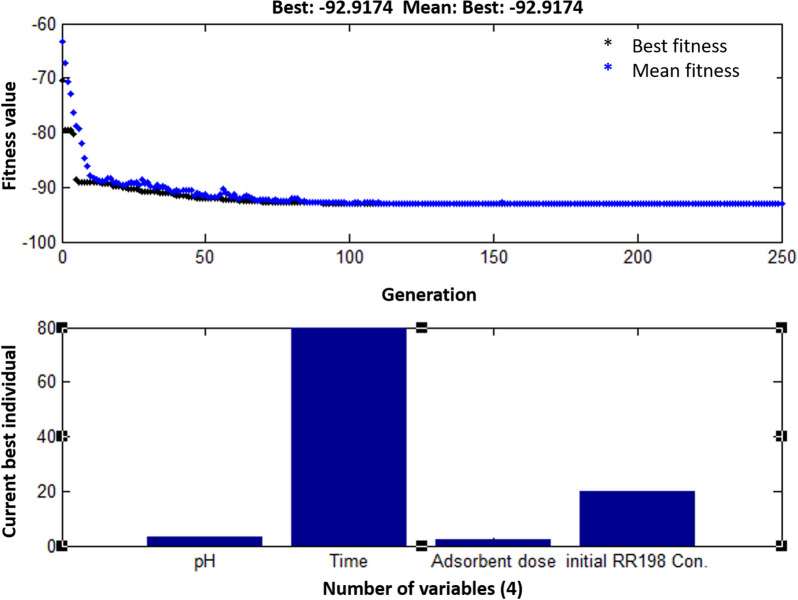
BBD-RSM and GA-ANN methods were used for optimizing the corresponding models in order to explore the levels of the input factors that maximize removal efficiency. The optimization results of the second-order polynomial regression model based on the BBD-RSM method have been presented in Fig. 6. It can be observed that the highest removal efficiency of 92.92% is obtained at solution pH 3, contact time 80 min, adsorbent loading 2 g L−1, and initial RR198 concentration 20 mg L−1. The developed ANN model was optimized by the GA tool. Figure 7 displays that the generation of solutions at around 100 repetitions showed no improvement in the fitness value and consequently was stopped at 250 repetitions. The current best individual plot demonstrates that the optimal levels of the input variables are consistent with those obtained from the BBD-RSM method, so that that the maximum removal efficiency (92.9%) has been achieved at pH = 3, contact time = 80 min, adsorbent loading = 2 g L−1, RR198 concentration = 20 mg L−1. The control experiments at the obtained optimum condition were conducted, and the experimental removal efficiency was 93.2% (± 1.2). This confirms a promising capability of both the BBD-RSM and GA-ANN methods for the optimization of the adsorption parameters.
Figure 6.
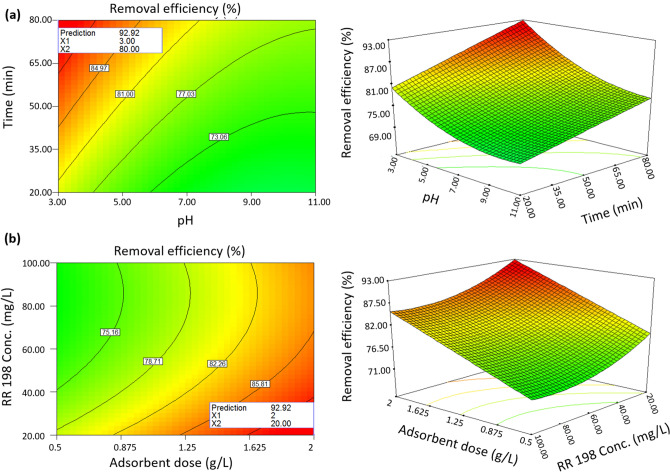
3D response surface plot and contour plot of the absorption of RR198 onto MSW compost ash as a function of pH versus time (a) and adsorbent dose versus RR198 Con. (b).
Figure 7.
Optimization results of the adsorption process using the GA-ANN approach.
Influence of parameters
3D and contour plots were used to display variations of the removal efficiency of RR198 by MSW compost ash as a function of the independent variables. Figure 6a shows the effect of the initial pH solution on the adsorption capability of the adsorbent. Results revealed that by increasing the initial solution pH, RR198 uptake by MSW compost ash starts to drop. The highest adsorption efficiency was obtained at initial solution pH of 3. Removal efficiency declined from 92.92 to 77.44% by varying pH from 3 to 11 at the condition of contact time = 80, adsorbent loading = 2 g L−1 and initial RR198 concentration = 20 mg L−1. This result can be associated with producing repulsive electrostatic force of the adsorbent surface with dye molecules in the basic condition of the solution and attractive electrostatic force in acidic conditions29.
The effectiveness of contact time on adsorbent performance is visible in Fig. 7a. It is verified that the adsorbent shows higher removal efficiencies at the prolonged contact time. By rising contact time from 20 to 80 min, the adsorption efficiency showed a 13% increase at the condition of pH = 3, adsorbent loading = 2 g L−1, and initial RR198 concentration = 20 mg L−1. Increasing removal efficiency at the higher contact time is likely due to the more opportunity and higher chance to collide adsorbent and dye molecules. The rapid RR98 uptake into the adsorbent in the early contact time comes from the fact that more adsorbent surface is available for the solute to be adsorbed at the earlier contact time, while increased saturation of the adsorbent by dye molecules at the longer contact time causes that the adsorption rate is enhanced more slowly. A similar observation was reported in the literature8.
Figure 6b exhibits the impact of the adsorbent loading and initial RR198 concentration on adsorption efficiency. As can been seen, removal efficiency is favored by the higher adsorbent dosage. Removal efficiency showed an increasing rate from 79.25 to 92.92% with the increase of the adsorbent dose from 0.5 to 2 g L−1 at the condition of pH = 3, contact time = 80 g L−1, and initial RR198 concentration = 20 mg L−1. It seems that by enhancing adsorbent dosage at the fixed pollutant concentration, a more active surface will be available for adsorption. On the contrary, the adsorption capacity was lessened at the higher adsorbent dosage owing to the improved chance of the collision between the adsorbate and adsorbent30.
It is observed in Fig. 6b that at a higher initial RR198 concentration, removal efficiency rises. The results show that under e condition of pH = 3, contact time = 80 g L−1, and adsorbent loading = 2 g L−1, adsorption efficiency is elevated from 85.62 to 92.92% by reducing initial RR198 concentration from 100 to 20 mg L−1. This comes from the fact that by increasing the initial RR198 concentration at the constant adsorbent dosage, the accessible active surface for the adsorption process will be dropped, leading to dropping the removal efficiency31.
Isotherm studies
Adsorption type, adsorbent surface properties, adsorption capacity, and equilibrium relationship between adsorbent and adsorbate can be identified by designing proper adsorption isotherms32,33. For this purpose, linear and nonlinear forms of Freundlich, Langmuir, Temkin, and Dubinin-Radushkevich isotherms were taken to evaluate RR198 adsorption onto the MSW compost ash. Langmuir isotherm model figures out a monolayer adsorption phenomenon of sorbate onto the adsorbent surface. Assumptions for the model include (a) no reaction takes place among sorbate molecules during adsorption, (b) adsorption energy is supposed to be constant onto the adsorbent surface, (c) single layer adsorption appears, and (d) maximum adsorbed amount is dependent on the saturability of adsorption layer34. The nonlinear Langmuir adsorption model is expressed as follows:
| 8 |
The linear form for Eq. (8) is written as Eq. (9)5:
| 9 |
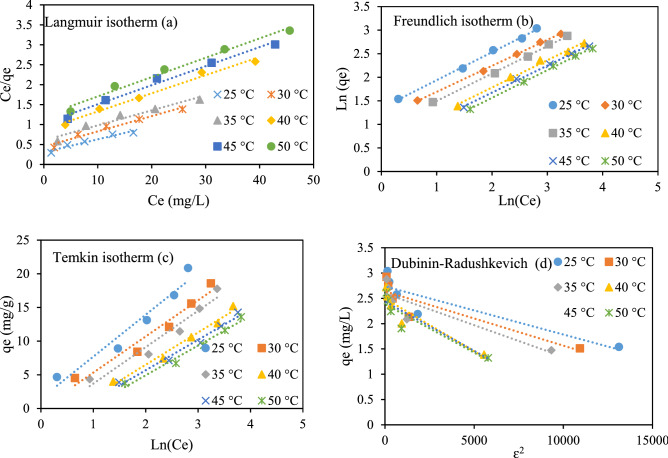
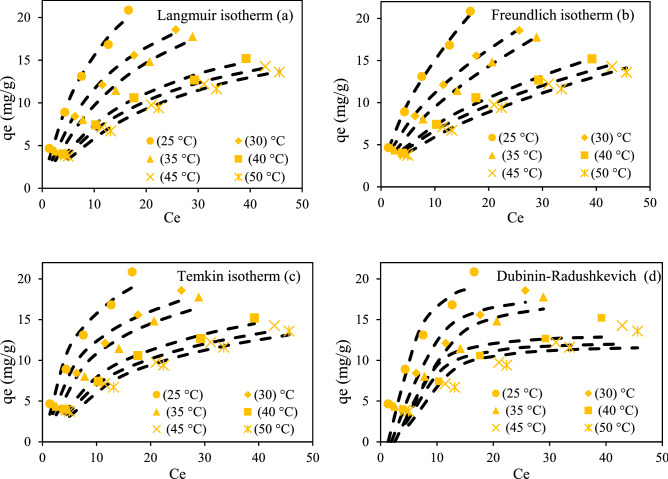
Here, Ce signifies RR198 dye concentration at equilibrium (mg L−1), qe is equilibrium adsorption capacity (mg L−1), qm is the maximum adsorption capacity (mg g−1), KL is the Langmuir adsorption constant (L mg−1). By plotting a linear graph between y = 1/qe versus x = 1/Ce, the values of qmax and kL are obtained from intercept and slope, respectively (Fig. 8a). Also, these parameters were calculated by the nonlinear form of Langmuir isotherm (Fig. 9a). The maximum adsorption capacity was obtained to be within the range of 30.96 mg L−1 to 20.619 by changing the solution temperature from 25 to 50 °C, for both nonlinear and linear Langmuir isotherm models. The fitness of data with the isotherm model was checked with statistical metrics of R2, Root means square errors (RMSE), and Chi-square (X2). The RMSE and X2 are calculated according to Eqs. (10) and (11).
| 10 |
| 11 |
Figure 8.
Linear isotherm models for RR 198 adsorption by MSW compost ash.
Figure 9.
Nonlinear isotherm models for RR 198 uptake by MSW compost ash.
As given in Tables 7 and 8, the value of R2 at the studied solution temperatures was found higher value, and the values of RMSE and X2 were found to lower values in nonlinear Langmuir isotherm when compared to its linear form. The results confirm that nonlinear Langmuir isotherm is superior over linear form to fit equilibrium data of the adsorption process.
Table 7.
Information of linear isotherm models for RR 198 adsorption onto MSW compost ash.
| Tem | Linear Langmuir isotherm | Linear Freundlich isotherm | ||||||||
|---|---|---|---|---|---|---|---|---|---|---|
| KL (L mg−1) | qm (mg g−1) | R2 | RMSE | X2 | n (L g−1) | KF (mg g−1) | R2 | RMSE | X2 | |
| 25 | 0.105 | 30.960 | 0.944 | 0.877 | 0.399 | 1.684 | 3.837 | 0.9975 | 0.382 | 0.050 |
| 30 | 0.086 | 26.110 | 0.963 | 0.706 | 0.355 | 1.812 | 3.122 | 0.999 | 0.195 | 0.015 |
| 35 | 0.063 | 26.525 | 0.949 | 0.699 | 0.334 | 1.720 | 2.499 | 0.9987 | 0.173 | 0.017 |
| 40 | 0.052 | 21.978 | 0.987 | 0.369 | 0.069 | 1.730 | 1.871 | 0.9911 | 0.393 | 0.096 |
| 45 | 0.046 | 20.921 | 0.985 | 0.390 | 0.088 | 1.746 | 1.696 | 0.9987 | 0.199 | 0.021 |
| 50 | 0.040 | 20.619 | 0.983 | 0.394 | 0.107 | 1.706 | 1.479 | 0.9988 | 0.173 | 0.013 |
| Tem. | Linear Temkin isotherm | Linear Dubinin–Radushkevich | ||||||||
|---|---|---|---|---|---|---|---|---|---|---|
| B1 | KT (L g−1) | R2 | RMSE | X2 | qs | KD | R2 | RMSE | X2 | |
| 25 | 6.225 | 1.267 | 0.9426 | 1.366 | 0.938 | 15.445 | 0.0001 | 0.8112 | 3.235 | 5.112 |
| 30 | 5.369 | 0.993 | 0.9548 | 1.062 | 0.655 | 13.999 | 0.0001 | 0.8046 | 2.893 | 4.927 |
| 35 | 5.413 | 0.727 | 0.9474 | 1.091 | 0.687 | 13.414 | 0.0001 | 0.8041 | 2.842 | 4.797 |
| 40 | 4.797 | 0.524 | 0.9824 | 0.522 | 0.166 | 12.130 | 0.0002 | 0.8595 | 1.931 | 2.075 |
| 45 | 4.523 | 0.475 | 0.9792 | 0.529 | 0.182 | 11.419 | 0.0002 | 0.8524 | 1.822 | 1.891 |
| 50 | 4.421 | 0.413 | 0.9756 | 0.546 | 0.223 | 10.860 | 0.0002 | 0.8393 | 1.772 | 2.010 |
Table 8.
Information of non-linear isotherm models for RR 198 adsorption onto MSW compost ash.
| Tem. | Non-linear Langmuir isotherm | Non-linear Freundlich isotherm | ||||||||
|---|---|---|---|---|---|---|---|---|---|---|
| KL (L mg−1) | qm (mg g−1) | R2 | RMSE | X2 | n (L g−1) | KF (mg g−1) | R2 | RMSE | X2 | |
| 25 | 0.105 | 30.960 | 0.9854 | 0.772 | 0.351 | 1.652 | 3.743 | 0.9955 | 0.393 | 0.050 |
| 30 | 0.086 | 26.110 | 0.9893 | 0.616 | 0.310 | 1.809 | 3.118 | 0.9985 | 0.196 | 0.015 |
| 35 | 0.063 | 26.525 | 0.9884 | 0.603 | 0.289 | 1.679 | 2.406 | 0.9987 | 0.198 | 0.017 |
| 40 | 0.052 | 21.978 | 0.992 | 0.361 | 0.064 | 1.850 | 2.099 | 0.9902 | 0.459 | 0.099 |
| 45 | 0.046 | 20.921 | 0.9913 | 0.344 | 0.072 | 1.881 | 1.971 | 0.9976 | 0.256 | 0.065 |
| 50 | 0.040 | 20.619 | 0.994 | 0.307 | 0.072 | 1.770 | 1.632 | 0.9983 | 0.319 | 0.061 |
| Tem. | Non-linear Temkin isotherm | Non-linear Dubinin–Radushkevich | ||||||||
|---|---|---|---|---|---|---|---|---|---|---|
| B1 | KT (L g−1) | R2 | RMSE | X2 | qs | KD | R2 | RMSE | X2 | |
| 25 | 398.001 | 1.267 | 0.9426 | 1.366 | 0.938 | 20.415 | 0.009 | 0.9243 | 2.425 | 3.634 |
| 30 | 469.242 | 0.993 | 0.9548 | 1.062 | 0.655 | 18.170 | 0.016 | 0.9242 | 2.284 | 3.290 |
| 35 | 473.111 | 0.727 | 0.9474 | 1.091 | 0.687 | 17.495 | 0.024 | 0.9164 | 2.229 | 3.497 |
| 40 | 542.540 | 0.524 | 0.9824 | 0.522 | 0.166 | 13.164 | 0.014 | 0.8176 | 1.755 | 1.725 |
| 45 | 584.562 | 0.475 | 0.9792 | 0.529 | 0.182 | 12.273 | 0.015 | 0.7961 | 1.706 | 1.585 |
| 50 | 594.331 | 0.401 | 0.9756 | 0.555 | 0.247 | 11.830 | 0.019 | 0.7896 | 1.666 | 1.615 |
Freundlich isotherm was originally developed to explain heterogeneous multilayer adsorption. Also, an energy reduction is assumed to occur in adsorbing sites and intermolecular reaction among adsorbed molecules for the adsorption process, which follows Freundlich isotherm5. For the Freundlich adsorption model, nonlinear and linear forms were expressed as follows:
| 12 |
| 13 |
Kf stands for the Freundlich constant (mg g−1), presenting adsorption capacity, 1/n describes the exponent of non-linearity. n is the Freundlich constants. Overall, n < 1 signifies poor adsorption, n = 1–2 indicates average adsorptions and n = 2–10 is obtained for good adsorptions. Thealues of n and kf are obtained by the linear graph between log (Ce) versus log (qe) or from drawing a nonlinear form of Eq. (13) (Figs. 8b, 9b). The fitness of the isotherm model to equilibrium data was evaluated with statistical metrics of R2, RMSE and X2. As given in Tables 7 and 8, nonlinear Langmuir isotherm had larger R2 values and lowered RMSE and X2 values at the studied solution temperatures than its linear form. As a result, the linear Freundlich isotherm was found superior over the nonlinear form in terms of fitness to equilibrium data.
Temkin adsorption isotherm assumes that the heat of adsorption of all the molecules drops linearly with coverage, due to due to adsorbent–adsorbate interactions. The derivation of the Temkin isotherm reveals a linear heat loss of sorption rather than logarithmic, as implied in the Freundlich model34. The nonlinear form of the Temkin isotherm model is given as35:
| 14 |
Equation (15) shows the linearized form of Eq. (14).
| 15 |
R is the universal gas constant (8.314 J mol−1 K−1), KT shows Temkin itherm constant (L g−1), BT is the Temkin constant corresponding to the heat of the adsorption (J mol−1), and T is the temperature in Kelvin. b and KT values are obtained from the slope and intercept of the linear graph of x = ln (Ce) versus y = qe (Fig. 8c). These parameters were also calculated by a nonlinear form of Temkin isotherm (Fig. 9c). The information related to calculated coefficients has been given in Tables 7 and 8. Also, the values of R2, RMSE, and X2 to evaluate the finesse of linear and nonlinear Temkin isotherm are presented in Tables 7 and 8, respectively. These parameters proved that both linear and nonlinear forms of Temkin isotherm appear almost similar fitness values.
In general, Dubinin–Radushkevich isotherm model was developed as an empirical model to predict the physical or chemical nature of the adsorption process. It shows successful adsorption in liquid-solid heterogeneous systems. Dubinin–Radushkevich model than Langmuir is considered more general as constant sorption potential, and derivation homogenous surface in the isotherm is not assumed. The nonlinear Dubinin–Radushkevich isotherm model is written as36,37.
| 16 |
Equation (17) shows the linearized form of Eq. (16).
| 17 |
where qm stands for the adsorption capacity (mg g−1) based on the Dubinin-R monolayer adsorption approach, β shows sorption energy, and ε is the Polanyi potential representing the equilibrium concentration. It is calculated as:
| 18 |
By drawing ln qe via , the slope and intercept of the plot give KD and qs values (Fig. 8d). These parameters were also calculated from the nonlinear isotherm form (Fig. 9d). The nonlinear form of the model demonstrates a more accurate fitness value than the linear form, according to R2, RMSE, and X2 parameters (Tables 7, 8). Dubinin–Radushkevich isotherm shows a successful application for the determination of the physical or chemical nature of sorption. For this purpose, Equation (19) is used to calculate the parameter of E.
| 19 |
E < 8 kJ mol−1 indicates physical adsorption, and the values ranging from 8 to 16 kJ mol−1 describe chemical adsorption. The value of E calculated for the adsorption process based on nonlinear Dubinin–Radushkevich isotherm was below 8 kJ mol−1, suggesting the physical nature of RR198 adsorption onto the MSW compost ash.
As initially stated, the findings related to the different isotherm models fitted to experimental data are given in Tables 7 and 8. According to the calculated values of statistical metrics of R2, RMSE and X2, the equilibrium data are better described by both linear and nonlinear Freundlich isotherm, as compared with Langmuir, Temkin, and Dubinin–Radushkevich isotherm models.
Kinetic studies
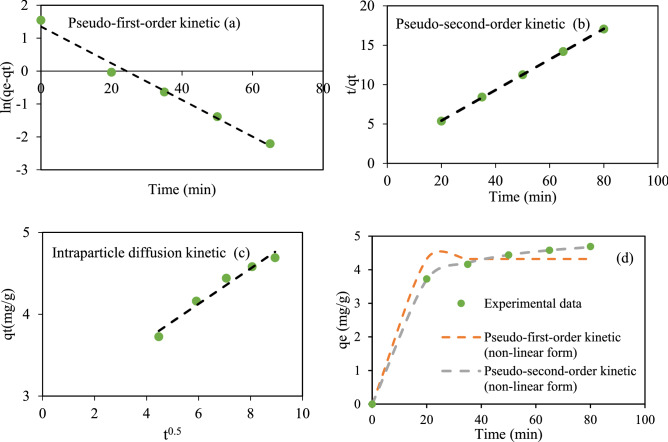
Kinetic models including pseudo-first-order, pseudo-second-order, and intraparticle diffusion models were applied to explore the best-fitted model to the experimental data. The kinetic study helps to describe solute uptake rate, contact time needed for the adsorption process, mechanism of sorption and adsorption constant rate, as well as chemical reactions7. The pseudo-first-order kinetic model was tested to fit experimental data38. The model is typically developed to study liquid/solid adsorption system, indicating that penetration depends on adsorption capacity, and variation of adsorption amount as a function of time is proportional to unoccupied sites on the adsorbent surface. The nonlinear and linear forms of pseudo-first-order kinetic model are given as39,40:
| 20 |
| 21 |
qe and qt show the adsorption capacities at equilibrium and time t (mg g−1), and k1 stands for the rate constant (min−1), respectively. ln(qe) and k1 are the intercept and slope of the linear graph of x = t versus y = ln(qe−qt), respectively. qe and k1 values are obtained from a linear graph between y = and x = t (Fig. 10a). Those were also determined from the nonlinear pseudo-first-order kinetic model (Fig. 10d). The information related to parameters of linear and nonlinear forms of the pseudo-first-order kinetic model has been represented in Table 9. A comparative study between linear and nonlinear forms by statistical metrics of R2, RMSE, and X2 indicated that the linear form is better suited to explain the experimental data compared to the nonlinear form. Table 9 shows R2 = 0.9853, RMSE = 0.193, and X2 = 0.0245 for linear pseudo-first-order kinetic model and R2 = 0.9629, RMSE = 0.346, and X2 = 0.148 for its nonlinear form.
Figure 10.
Linear and nonlinear kinetic models for RR 198 adsorption by MSW compost ash.
Table 9.
Information of linear and non-linear kinetic models for RR 198 adsorption onto MSW compost ash.
| Pseudo-first-order kinetic | Pseudo-second-order kinetic | Intraparticle diffusion kinetic | qexp (mg g−1) | ||||||||||
|---|---|---|---|---|---|---|---|---|---|---|---|---|---|
| K2 )g mg−1 min−1) | qe (mg g−1) | R2 | RMSE | X2 | K1 (min−1) | qe (mg g−1) | R2 | RMSE | X2 | Kp (mg g−1 min−1/2) | Kp (mg g−1 min−1/2) | ||
| Linear parameters | 0.0558 | 3.864 | 0.9853 | 0.193 | 0.0245 | 0.1262 | 5.144 | 0.9999 | 0.0223 | 0.0006 | 2.831 | 0.9669 | 4.96 |
| Non-linear parameters | 1.000 | 4.319 | 0.9629 | 0.346 | 0.148 | 0.026 | 5.119 | 0.9998 | 0.0243 | 0.000753 | |||
Pseudo-second-order kinetic model suggests that adsorption behavior obeys pseudo-second-order reaction with the rate-limiting step. In chemical adsorption, the occupancy rate of adsorption sites has a direct relationship with the square number of unoccupied sites38. The nonlinear and linear forms of the kinetic model are written as Eqs. (22) and (23), respectively39,41.
| 22 |
| 23 |
qe and qt denote the amounts of RR198 adsorbed at equilibrium and time t (mg g−1), and k2 is devoted to the rate constant (g mg−1 min−1), respectively. Qe and k2 values are determined by a linear graph between y = and x = t (Fig. 10b), and also nonlinear pseudo-second-order kinetic model (Fig. 10d). The linear and nonlinear parameters of the kinetic model are shown in Table 9. Error functions of R2, RMSE, and X2 for the nonlinear pseudo-second-order kinetic model were calculated as 0.9998, 0.0243, and 0.00075, respectively. Those for linear form were found to be 0.9999, 0.0223, and 0.0006. The results indicate that both linear and nonlinear forms of the kinetic model have similar fitness values to experimental data.
In particle diffusion kinetic model as a commonly used kinetic model was also used in the present study. Four consecutive stages were involved in the kinetic model as follows: (a) transport of sorbate in the bulk solution; (b) film diffusion; (c) mass diffusion migration of sorbate molecules within the pores of sorbent; (d) Adsorption of solute molecules onto adsorbent via chemical reactions like complexation, ion exchange, and chelating reactions42. The intraparticle diffusion kinetic model is given as35.
| 24 |
In Eq., qt represents the adsorption capacity at time t in (mg g−1), kpt describes the intraparticle diffusion rate constant (mg g−1 min−1/2). kp value is calculated from the linear graph of x = t1/2 versus y = qt (Fig. 10c) and shown in Table 9.
To made a comparison among the different kinetic models in terms of fitness value, the error functions of R2, RMSE and X2 were applied. As shown in Table 9, the calculated values of R2, RMSE, and X2 revealed that both the linear and nonlinear form of the pseudo-second-order kinetic model offers the best fit to the experimental equilibrium data when compared with pseudo-first-order and intraparticle diffusion kinetic models.
Thermodynamic studies
Thermodynamic properties of the RR198 adsorption onto the MSW compost ash were studied under the optimal condition of the process parameters and a temperature of 298, 303, 308, 313, and 318, and 323 °C. Equation (25) was used to determine the thermodynamic parameter and and are obtained from the intercept and slope factor of Eq. (26)43. Keo represents the thermodynamic equilibrium constant (dimensionless).
| 25 |
| 26 |
| 27 |
| 28 |
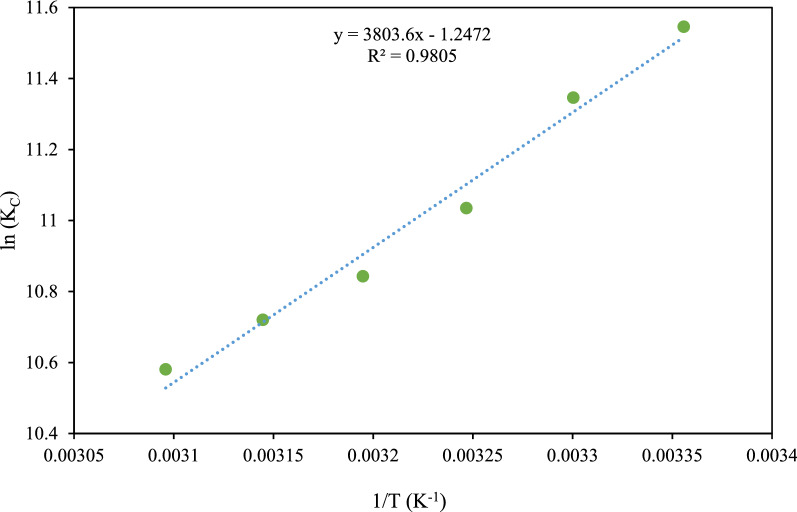
Here, stands for the change of free Gibbs energy (kJ mol−1), R represents the gas constant (8.314 J mol−1 K−1), T describes the temperature in Kelvin, shows enthalpy change (kJ mol−1), is entropy change (J mol−1 K−1), and Kd is distribution coefficient, MW is the molecular weight of adsorbate (Reactive red 198; 967.5 g mol−1), [adsorbate]o describes the standard adsorbate concentration (1 mol L−1), KL is the best-fitted isotherm constant (L mg−1), and γ is the activity coefficient (dimensionless). We considered the adsorbate solution very diluted to assume the activity coefficient of unitary (equal to 1). By plotting via 1/T, the slope and intercept were used to calculate the values of and respectively (Fig. 11). The obtained thermodynamic information for the adsorption process model is summarized in Table 10. Negative value is an indication of spontaneous adsorption. Further, the less value of at the higher temperatures indicates undesirability of the adsorption process at the elevated temperature. The negative value of suggests the exothermic sorption so that adsorption efficiency is increased at the lower temperatures. The negative value reflected the randomness at the solid/liquid interface44.
Figure 11.
A thermodynamic model for RR 198 adsorption by MSW compost ash.
Table 10.
Thermodynamic information of RR198 adsorption on MSW compost ash.
| Temperature (°K) | KL (L mg−1) | Ko | R2 | |||
|---|---|---|---|---|---|---|
| 298 | 0.0017 | 1598.3 | − 28.414 | − 10.369 | − 31.623 | 0.9805 |
| 303 | 0.0018 | 1750.2 | − 28.343 | |||
| 308 | 0.0017 | 1624.4 | − 28.217 | |||
| 313 | 0.0019 | 1789.9 | − 28.207 | |||
| 318 | 0.0019 | 1819.9 | − 28.183 | |||
| 323 | 0.0018 | 1712.5 | − 28.106 |
Reusability test of MSW compost ash
The recovery of adsorbent was considered a very important feature in the present study because of its practical application and economic feasibility. In this context, reusability study of the adsorbent was carried out for successive five cycles, where after each run, the adsorbent was separated from the medium, dissolved in 0.1 mol L−1 NaOH solution for 3 h, and finally rinsed by deionized water to isolate form the adsorbate7. The relevant results, as given in Fig. 12, show that the adsorption efficiency of MSW compost ash has maintained over 80%. So, it confirms the promising reusability of MSW compost ash. The slight decline of removal efficiency can be assigned to the decrease in the available active surface area of the adsorbent due to the trapped dye molecules in the adsorbent pores even after frequent washing of the adsorbent and the mass loss of the adsorbent after washing operation.
Figure 12.
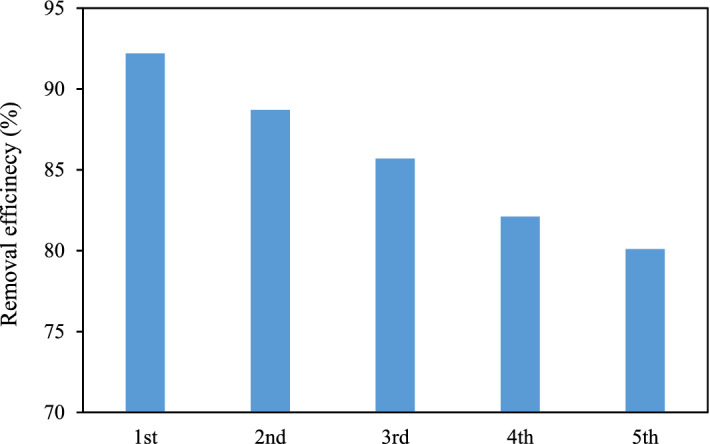
Reusability test for the MSW compost ash.
Comparison with other adsorbents
In the present study, MSW compost ash as a low-cost and efficient adsorbent was used for RR 198 adsorption from an aquatic matrix, showing a remarkably good performance in the adsorption process. To further signify its efficiency, the prepared adsorbent was compared with some other reported natural adsorbents with respect to their adsorption capacity for dye pollutants in an aqueous solution. Table represents the maximum adsorption capacity for different natural adsorbents. As seen, MSW compost ash has superiority in dye adsorption when compared with some given adsorbents in Table 11. As a result of reasonable adsorption capacity, low cost and abundance, availability, it can be proposed as an attractive alternative for dye’s removal.
Table 11.
Comparison of dye adsorption efficiency of different adsorbents.
| Adsorbents | Dyes | Maximum adsorption capacity (mg g−1) | References |
|---|---|---|---|
| Fly ash | Crystal violet | 4.73 | 45 |
| Rosaniline hydrochloride | 4.81 | ||
| Carbon slurry | Ethyl orange | 198.4 | 46 |
| Metanil yellow | 211.9 | ||
| Acid blue 113 | 221.2 | ||
| Carbon slurry | Chrysoidine G | 80.6 | 47 |
| Crystal violet | 163.0 | ||
| Meldola blue | 171.2 | ||
| Red Mud | Rhodamine B | 5.5 | 48 |
| fast green | 7.5 | ||
| methylene blue | 16.7 | ||
| Boron Industry Waste | Acid Red 183 | 48.5 | 49 |
| Reactive Blue 4 | 46.7 | ||
| Sugar cane dust | Malachite Green | 4.879 | 50 |
| Rhodamine B | 4.261 | ||
| Neem sawdust | malachite green | 4.354 | 51 |
| Orange peel | Acid violet 17 | 19.88 | 52 |
| Flyash | Methylene blue dye | 3.074 | 53 |
| Activated carbon | 9.813 | ||
| Flyash | Congo red dye | 4.125 | |
| Activated carbon | 15.80 | ||
| Clinoptilolite | Basic Yellow 28 | 59.6 | 54 |
| Amberlite XAD-4 | 8.7 | ||
| MSW compost ash | Reactive red 198 | 30.9 | This study |
Conclusion
In the present study, MSW compost ash was characterized by using several methods, and its capacity in the adsorptive removal of RR198 from synthetic wastewater was studied and optimized. BBD-RSM approach developed a quadratic polynomial regression model with F-value = 94.596 and R2 = 0.9436, and ANN suggested a three-layer model with test-R2 = 0.9832, the structure of 4-8-1 and learning algorithm type of Levenberg–Marquardt backpropagation. By comparing the two modeling approaches, the ANN model can be introduced as a more reliable model to predict the responses closer to the experimental results. The same optimization results were achieved by BBD-RSM and GA-ANN techniques. The maximum removal efficiency of RR198 (92.8%) was observed under the condition of pH = 3, contact time = 80 min, RR198 = 20 mg L−1 and MSW compost ash loading = 2 g L−1. The adsorption behavior was more in line with Freundlich isotherm, pseudo-second-order kinetic models, which demonstrate multilayer adsorption with a heterogeneous system and heterogeneous chemical adsorption on the adsorbent surface, respectively. Also, the thermodynamic study indicated the exothermic nature of the RR198 adsorption onto MSW compost ash. The reusability test of the adsorbent shows no obvious decline of removal efficiency after five successive cycles of reuse. In conclusion, MSW compost ash as an economical, reusable and efficient adsorbent can be proposed to be applied in the adsorption process for dye pollutants removal from aquatic environments, and both BBD-RSM and ANN approaches are highly potential methods for modeling the adsorption process. This study also provides preliminary information, which is helpful for developing the adsorption process on an industrial scale.
Author contributions
Conceptualization: M.H.D., R.B.; Formal analysis: M.H.D., R.B.; Investigation: M.H.D., R.B.; Methodology: R.B., M.S.; Project administration: M.H.D.; Resources: F.H.; Supervision: M.H.D.; Validation: R.B., R.R.K.; Writing and original draft: M.H.D., R.B.; Review and editing: M.H.D., R.B.
Competing interests
The authors declare no competing interests.
Footnotes
Publisher's note
Springer Nature remains neutral with regard to jurisdictional claims in published maps and institutional affiliations.
Contributor Information
Mohammad Hadi Dehghani, Email: hdehghani@tums.ac.ir.
Roghayeh Bahadori, Email: roghayehb@gmail.com.
References
- 1.Bayram E, Kızıl Ç, Ayrancı E. Flow-through electrosorption process for removal of 2, 4-D pesticide from aqueous solutions onto activated carbon cloth fixed-bed electrodes. Water Sci. Technol. 2017;77(3):848–854. doi: 10.2166/wst.2017.598. [DOI] [PubMed] [Google Scholar]
- 2.Croce R, Cinà F, Lombardo A, Crispeyn G, Cappelli CI, Vian M, Maiorana S, Benfenati E, Baderna D. Aquatic toxicity of several textile dye formulations: acute and chronic assays with Daphnia magna and Raphidocelis subcapitata. Ecotoxicol. Environ. Saf. 2017;144:79–87. doi: 10.1016/j.ecoenv.2017.05.046. [DOI] [PubMed] [Google Scholar]
- 3.Huang T, Yan M, He K, Huang Z, Zeng G, Chen A, Peng M, Li H, Yuan L, Chen G. Efficient removal of methylene blue from aqueous solutions using magnetic graphene oxide modified zeolite. J. Colloid Interface Sci. 2019;543:43–51. doi: 10.1016/j.jcis.2019.02.030. [DOI] [PubMed] [Google Scholar]
- 4.Hu C, Jimmy CY, Hao Z, Wong PK. Photocatalytic degradation of triazine-containing azo dyes in aqueous TiO2 suspensions. Appl. Catal. B Environ. 2003;42(1):47–55. doi: 10.1016/S0926-3373(02)00214-X. [DOI] [Google Scholar]
- 5.Azari A, Salari M, Dehghani MH, Alimohammadi M, Ghaffari H, Sharafi K, Shariatifar N, Baziar M. Efficiency of magnitized graphene oxide nanoparticles in removal of 2,4-dichlorophenol from aqueous solution. J. Mazandaran Univ. Med. Sci. 2017;26(144):265–281. [Google Scholar]
- 6.Shams M, Nabipour I, Dobaradaran S, Ramavandi B, Qasemi M, Afsharnia M. An environmental friendly and cheap adsorbent (municipal solid waste compost ash) with high efficiency in removal of phosphorus from aqueous solution. Fresenius Environ. Bull. 2013;22(3):2604. [Google Scholar]
- 7.Salari M, Dehghani MH, Azari A, Motevalli MD, Shabanloo A, Ali I. High performance removal of phenol from aqueous solution by magnetic chitosan based on response surface methodology and genetic algorithm. J. Mol. Liq. 2019;285:146–157. doi: 10.1016/j.molliq.2019.04.065. [DOI] [Google Scholar]
- 8.Senturk HB, Ozdes D, Gundogdu A, Duran C, Soylak M. Removal of phenol from aqueous solutions by adsorption onto organomodified Tirebolu bentonite: Equilibrium, kinetic and thermodynamic study. J. Hazard. Mater. 2009;172(1):353–362. doi: 10.1016/j.jhazmat.2009.07.019. [DOI] [PubMed] [Google Scholar]
- 9.Bari QH, Koenig A. Effect of air recirculation and reuse on composting of organic solid waste. Resour. Conserv. Recycl. 2001;33(2):93–111. doi: 10.1016/S0921-3449(01)00076-3. [DOI] [Google Scholar]
- 10.Al-Ithari AJ, Sathasivan A, Ahmed R, Vuthaluru HB, Zhan W, Ahmed M. Superiority of date seed ash as an adsorbent over other ashes and ferric chloride in removing boron from seawater. Desalin. Water Treat. 2011;32(1–3):324–328. doi: 10.5004/dwt.2011.2717. [DOI] [Google Scholar]
- 11.Gupta S, Babu B. Experimental, kinetic, equilibrium and regeneration studies for adsorption of Cr (VI) from aqueous solutions using low cost adsorbent (activated flyash) Desalin. Water Treat. 2010;20(1–3):168–178. doi: 10.5004/dwt.2010.1546. [DOI] [Google Scholar]
- 12.Álvarez-Ayuso E, Querol X. Study of the use of coal fly ash as an additive to minimise fluoride leaching from FGD gypsum for its disposal. Chemosphere. 2008;71(1):140–146. doi: 10.1016/j.chemosphere.2007.10.048. [DOI] [PubMed] [Google Scholar]
- 13.Matheswaran M. Kinetic studies and equilibrium isotherm analyses for the adsorption of Methyl Orange by coal fly ash from aqueous solution. Desalin. Water Treat. 2011;29(1–3):241–251. doi: 10.5004/dwt.2011.1739. [DOI] [Google Scholar]
- 14.Fungaro DA, Bruno M, Grosche LC. Adsorption and kinetic studies of methylene blue on zeolite synthesized from fly ash. Desalin. Water Treat. 2009;2(1–3):231–239. doi: 10.5004/dwt.2009.305. [DOI] [Google Scholar]
- 15.Liu Q, Zhou Y, Zou L, Deng T, Zhang J, Sun Y, Ruan X, Zhu P, Qian G. Simultaneous wastewater decoloration and fly ash dechlorination during the dye wastewater treatment by municipal solid waste incineration fly ash. Desalin. Water Treat. 2011;32(1–3):179–186. doi: 10.5004/dwt.2011.2696. [DOI] [Google Scholar]
- 16.Asgari G, Shabanloo A, Salari M, Eslami F. Sonophotocatalytic treatment of AB113 dye and real textile wastewater using ZnO/persulfate: modeling by response surface methodology and artificial neural network. Environ. Res. 2020 doi: 10.1016/j.envres.2020.109367. [DOI] [PubMed] [Google Scholar]
- 17.Dehghani MH, Karri RR, Yeganeh ZT, Mahvi AH, Nourmoradi H, Salari M, Zarei A, Sillanpää M. Statistical modelling of endocrine disrupting compounds adsorption onto activated carbon prepared from wood using CCD-RSM and DE hybrid evolutionary optimization framework: Comparison of linear vs non-linear isotherm and kinetic parameters. J. Mol. Liq. 2020;302:112526. doi: 10.1016/j.molliq.2020.112526. [DOI] [Google Scholar]
- 18.Dehghani MH, Yetilmezsoy K, Salari M, Heidarinejad Z, Yousefi M, Sillanpää M. Adsorptive removal of cobalt(II) from aqueous solutions using multi-walled carbon nanotubes and γ-alumina as novel adsorbents: Modelling and optimization based on response surface methodology and artificial neural network. J. Mol. Liq. 2020;299:112154. doi: 10.1016/j.molliq.2019.112154. [DOI] [Google Scholar]
- 19.Baghapour MA, Pourfadakari S, Mahvi AH. Investigation of Reactive Red Dye 198 removal using multiwall carbon nanotubes in aqueous solution. J. Ind. Eng. Chem. 2014;20(5):2921–2926. doi: 10.1016/j.jiec.2013.11.029. [DOI] [Google Scholar]
- 20.ASTM D-2974, 1987, Standard test method for moisture, ash, and organic matter of peat and other organic soils.
- 21.Eliche-Quesada D, Felipe-Sesé M, López-Pérez J, Infantes-Molina A. Characterization and evaluation of rice husk ash and wood ash in sustainable clay matrix bricks. Ceram. Int. 2017;43(1):463–475. doi: 10.1016/j.ceramint.2016.09.181. [DOI] [Google Scholar]
- 22.Asgari G, Salari M. Optimized synthesis of carbon-doped nano-MgO and its performance study in catalyzed ozonation of humic acid in aqueous solutions: Modeling based on response surface methodology. J. Environ. Manag. 2019;239:198–210. doi: 10.1016/j.jenvman.2019.03.055. [DOI] [PubMed] [Google Scholar]
- 23.Pirsaheb M, Moradi M, Ghaffari H, Sharafi K. Application of response surface methodology for efficiency analysis of strong non-selective ion exchange resin column (A 400 E) in nitrate removal from groundwater. Int. J. Pharmacy Technol. 2016;8(1):11023–11034. [Google Scholar]
- 24.Shokoohi R, Salari M, Safari R, Zolghadr Nasab H, Shanehsaz S. Modelling and optimisation of catalytic ozonation process assisted by ZrO2-pumice/H2O2 in the degradation of Rhodamine B dye from aqueous environment. Int. J. Environ. Anal. Chem. 2020 doi: 10.1080/03067319.2019.1704748. [DOI] [Google Scholar]
- 25.Witek-Krowiak A, Chojnacka K, Podstawczyk D, Dawiec A, Pokomeda K. Application of response surface methodology and artificial neural network methods in modelling and optimization of biosorption process. Bioresour. Technol. 2014;160:150–160. doi: 10.1016/j.biortech.2014.01.021. [DOI] [PubMed] [Google Scholar]
- 26.Ghosal PS, Kattil KV, Yadav MK, Gupta AK. Adsorptive removal of arsenic by novel iron/olivine composite: Insights into preparation and adsorption process by response surface methodology and artificial neural network. J. Environ. Manag. 2018;209:176–187. doi: 10.1016/j.jenvman.2017.12.040. [DOI] [PubMed] [Google Scholar]
- 27.Karri RR, Tanzifi M, Yaraki MT, Sahu J. Optimization and modeling of methyl orange adsorption onto polyaniline nano-adsorbent through response surface methodology and differential evolution embedded neural network. J. Environ. Manag. 2018;223:517–529. doi: 10.1016/j.jenvman.2018.06.027. [DOI] [PubMed] [Google Scholar]
- 28.Shokoohi R, Bajalan S, Salari M, Shabanloo A. Thermochemical degradation of furfural by sulfate radicals in aqueous solution: optimization and synergistic effect studies. Environ. Scie. Pollut. Res. 2019;26(9):8914–8927. doi: 10.1007/s11356-019-04382-0. [DOI] [PubMed] [Google Scholar]
- 29.Charles H, Alvin W, Barford J, McKay G. Use of incineration MSW ash: a review. Sustainability. 2010;2:1943–1968. doi: 10.3390/su2071943. [DOI] [Google Scholar]
- 30.Sarı A, Tuzen M. Equilibrium, thermodynamic and kinetic studies on aluminum biosorption from aqueous solution by brown algae (Padina pavonica) biomass. J. Hazard. Mater. 2009;171(1–3):973–979. doi: 10.1016/j.jhazmat.2009.06.101. [DOI] [PubMed] [Google Scholar]
- 31.Zazouli MA, Balarak D, Mahdavi Y, Barafrashtehpour M, Ebrahimi M. Adsorption of bisphenol from industrial wastewater by modified red mud. J. Health Dev. 2013;2(1):1–11. [Google Scholar]
- 32.Li J-M, Meng X-G, Hu C-W, Du J. Adsorption of phenol, p-chlorophenol and p-nitrophenol onto functional chitosan. Bioresour. Technol. 2009;100(3):1168–1173. doi: 10.1016/j.biortech.2008.09.015. [DOI] [PubMed] [Google Scholar]
- 33.Nadavala SK, Swayampakula K, Boddu VM, Abburi K. Biosorption of phenol and o-chlorophenol from aqueous solutions on to chitosan–calcium alginate blended beads. J. Hazard. Mater. 2009;162(1):482–489. doi: 10.1016/j.jhazmat.2008.05.070. [DOI] [PubMed] [Google Scholar]
- 34.Alyüz B, Veli S. Kinetics and equilibrium studies for the removal of nickel and zinc from aqueous solutions by ion exchange resins. Journal of hazardous materials. 2009;167(1–3):482–488. doi: 10.1016/j.jhazmat.2009.01.006. [DOI] [PubMed] [Google Scholar]
- 35.Shokoohi R, Salari M, Mahmoudi MM, Azizi S, Ghiasian SA, Faradmal J, Faraji H. The sorption of cationic and anionic heavy metal species on the biosorbent of Aspergillus terreus: Isotherm, kinetics studies. Environ. Progress Sustain. Energy. 2020;1:1–1. doi: 10.1002/ep.13309. [DOI] [Google Scholar]
- 36.Batool F, Akbar J, Iqbal S, Noreen S, Bukhari SNA. Study of isothermal, kinetic, and thermodynamic parameters for adsorption of cadmium: an overview of linear and nonlinear approach and error analysis. Bioinorg. Chem. Appl. 2018 doi: 10.1155/2018/3463724. [DOI] [PMC free article] [PubMed] [Google Scholar]
- 37.López-Luna J, Ramírez-Montes LE, Martinez-Vargas S, Martínez AI, Mijangos-Ricardez OF, María del Carmen A, Carrillo-González R, Solís-Domínguez FA, del Carmen Cuevas-Díaz M, Vázquez-Hipólito V. Linear and nonlinear kinetic and isotherm adsorption models for arsenic removal by manganese ferrite nanoparticles. SN Appl. Sci. 2019;1(8):950. doi: 10.1007/s42452-019-0977-3. [DOI] [Google Scholar]
- 38.Kumar PS, Ramalingam S, Senthamarai C, Niranjanaa M, Vijayalakshmi P, Sivanesan S. Adsorption of dye from aqueous solution by cashew nut shell: Studies on equilibrium isotherm, kinetics and thermodynamics of interactions. Desalination. 2010;261(1–2):52–60. doi: 10.1016/j.desal.2010.05.032. [DOI] [Google Scholar]
- 39.Mahmoudi MM, Nasseri S, Mahvi AH, Dargahi A, Khubestani MS, Salari M. Fluoride removal from aqueous solution by acid-treated clinoptilolite: isotherm and kinetic study. Desalin. Water Treat. 2019;146:333–340. doi: 10.5004/dwt.2019.23625. [DOI] [Google Scholar]
- 40.Dehghani MH, Ghadermazi M, Bhatnagar A, Sadighara P, Jahed-Khaniki G, Heibati B, McKay G. Adsorptive removal of endocrine disrupting bisphenol A from aqueous solution using chitosan. J. Environ. Chem. Eng. 2016;4(3):2647–2655. doi: 10.1016/j.jece.2016.05.011. [DOI] [Google Scholar]
- 41.Moradi M, Soltanian M, Pirsaheb M, Sharafi K, Soltanian S, Mozafari A. The efficiency study of pumice powder to lead removal from the aquatic environment: Isotherms and kinetics of the reaction. J. Mazandaran Univ. Med. Sci. 2014;23(1):65–75. [Google Scholar]
- 42.Ho Y, McKay G. Batch lead (II) removal from aqueous solution by peat: equilibrium and kinetics. Trans IChemE. 1999;77:165–173. doi: 10.1205/095758299529983. [DOI] [Google Scholar]
- 43.Qiusheng LXiaoyan Z, Jin Q, Jing LXuegang W. Porous zirconium alginate beads adsorbent for fluoride adsorption from aqueous solutions. RSC Adv. 2015;5(3):2100–2112. doi: 10.1039/C4RA12036A. [DOI] [Google Scholar]
- 44.Tran HN, Nguyen DT, Le GT, Tomul F, Lima EC, Woo SH, Sarmah AK, Nguyen HQ, Nguyen PT, Nguyen DD. Adsorption mechanism of hexavalent chromium onto layered double hydroxides-based adsorbents: A systematic in-depth review. J. Hazard. Mater. 2019;373:258–270. doi: 10.1016/j.jhazmat.2019.03.018. [DOI] [PubMed] [Google Scholar]
- 45.Mohan D, Singh KP, Singh G, Kumar K. Removal of dyes from wastewater using flyash, a low-cost adsorbent. Ind. Eng. Chem. Res. 2002;41(15):3688–3695. doi: 10.1021/ie010667+. [DOI] [Google Scholar]
- 46.Jain AK, Gupta VK, Bhatnagar A, Suhas Utilization of industrial waste products as adsorbents for the removal of dyes. J. Hazard. Mater. 2003;101(1):31–42. doi: 10.1016/S0304-3894(03)00146-8. [DOI] [PubMed] [Google Scholar]
- 47.Jain A, Gupta V, Bhatnagar A, Suhas A comparative study of adsorbents prepared from industrial wastes for removal of dyes. Sep. Sci. Technol. 2003;38(2):463–481. doi: 10.1081/SS-120016585. [DOI] [Google Scholar]
- 48.Gupta V, Suhas I. Ali, Saini V. Removal of rhodamine B, fast green, and methylene blue from wastewater using red mud, an aluminum industry waste. Ind. Eng. Chem. Res. 2004;43(7):1740–1747. doi: 10.1021/ie034218g. [DOI] [Google Scholar]
- 49.Atar N, Olgun A, Wang S, Liu S. Adsorption of anionic dyes on boron industry waste in single and binary solutions using batch and fixed-bed systems. J. Chem. Eng. Data. 2011;56(3):508–516. doi: 10.1021/je100993m. [DOI] [Google Scholar]
- 50.Khattri S, Singh M. Colour removal from dye wastewater using sugar cane dust as an adsorbent. Adsorpt. Sci. Technol. 1999;17(4):269–282. doi: 10.1177/026361749901700404. [DOI] [Google Scholar]
- 51.Khattri SD, Singh MK. Removal of malachite green from dye wastewater using neem sawdust by adsorption. J. Hazard. Mater. 2009;167(1):1089–1094. doi: 10.1016/j.jhazmat.2009.01.101. [DOI] [PubMed] [Google Scholar]
- 52.Sivaraj R, Namasivayam C, Kadirvelu K. Orange peel as an adsorbent in the removal of Acid violet 17 (acid dye) from aqueous solutions. Waste Manag. 2001;21(1):105–110. doi: 10.1016/S0956-053X(00)00076-3. [DOI] [PubMed] [Google Scholar]
- 53.Basava Rao VV, Ram Mohan Rao S. Adsorption studies on treatment of textile dyeing industrial effluent by flyash. Chem. Eng. J. 2006;116(1):77–84. doi: 10.1016/j.cej.2005.09.029. [DOI] [Google Scholar]
- 54.Yener J, Kopac T, Dogu G, Dogu T. Adsorption of Basic Yellow 28 from aqueous solutions with clinoptilolite and amberlite. J. Colloid Interface Sci. 2006;294(2):255–264. doi: 10.1016/j.jcis.2005.07.040. [DOI] [PubMed] [Google Scholar]


