

Abstract

Organic contaminant degradation by suspended bacteria in chemostats has shown that isotope fractionation decreases dramatically when pollutant concentrations fall below the (half-saturation) Monod constant. This masked isotope fractionation implies that membrane transfer is slow relative to the enzyme turnover at μg L–1 substrate levels. Analogous evidence of mass transfer as a bottleneck for biodegradation in aquifer settings, where microbes are attached to the sediment, is lacking. A quasi-two-dimensional flow-through sediment microcosm/tank system enabled us to study the aerobic degradation of 2,6-dichlorobenzamide (BAM), while collecting sufficient samples at the outlet for compound-specific isotope analysis. By feeding an anoxic BAM solution through the center inlet port and dissolved oxygen (DO) above and below, strong transverse concentration cross-gradients of BAM and DO yielded zones of low (μg L–1) steady-state concentrations. We were able to simulate the profiles of concentrations and isotope ratios of the contaminant plume using a reactive transport model that accounted for a mass-transfer limitation into bacterial cells, where apparent isotope enrichment factors *ε decreased strongly below concentrations around 600 μg/L BAM. For the biodegradation of organic micropollutants, mass transfer into the cell emerges as a bottleneck, specifically at low (μg L–1) concentrations. Neglecting this effect when interpreting isotope ratios at field sites may lead to a significant underestimation of biodegradation.
Keywords: bioavailability; 2,6-dichlorobenzamide; reactive-transport model; flow-through system; GC-IRMS; CSIA
Short abstract
Please provide a synopsis
Introduction
The combined interpretation of solute concentrations and isotope ratios in sediment profiles and groundwater samples is a common approach to unravel natural transformations of nutrients and organic compounds, most prominently organic pollutants.1−4 The interpretation relies on the phenomenon that kinetic isotope effects typically favor the transformation of molecules with light isotopes so that molecules with heavy isotopes become enriched in the remaining substrate.5,6 Hence, an increase of isotope ratios, such as of 13C/12C or 15N/14N, along a transport path in groundwater or sediments can provide direct evidence of the natural transformation of a compound. This has been applied in the analysis of sulfate,7,8 nitrate,9 and methane,10 among others, along with redox gradients and organic pollutants (e.g., BTEX, chlorinated ethenes, pesticides, and herbicides)11−17 at contaminated sites. Conversely, the absence of isotope fractionation, despite a concentration decrease, is commonly interpreted as evidence of the absence of reactive turnover.
However, recent studies with suspended cells in chemostats have shown that isotope fractionation may no longer be observable at low concentrations, even though transformation still occurs.18−27 When the mass transfer of a substrate at the cellular level (i.e., through the cell membrane into and out of the cell) is limited, both heavy and light isotopologues are degraded completely inside the cell before they may diffuse out. Consequently, the isotope fractionation of the enzymatic transformation inside the cell can no longer be observed outside of the cell where samples are taken for analysis.28 Such masking of isotope fractionation has been widely recognized in photosynthesis,20 denitrification,21,29 and sulfate respiration.8,22,23,30,31 Because the phenomenon occurs if membrane transfer is slower than the enzymatic turnover, theoretical considerations predict that mass-transfer limitations may become particularly relevant at extracellular substrate concentrations below the Monod or Michaelis–Menten constants of growth and enzymatic turnover when enzyme kinetics shift from zero- to first-order.28,32 Indeed, recent biodegradation experiments of atrazine in chemostats and retentostats showed dramatically decreased isotope fractionation when atrazine concentrations dropped below 30 μg/L.18,19,33,34
Thus far, however, this phenomenon has been demonstrated only in well-mixed liquid culture systems (e.g., chemostats,19,33,34 retentostats,33 or batch reactors18,25,27,35,36) where bacteria were suspended at relatively high cell densities in a liquid culture rather than being attached to sediments. In these cultivations, bacteria were either not adapted to low concentrations (e.g., in batch reactors18,25,27,35,36), or they were adapted to low concentrations, but still they experienced a relatively high substrate flux (e.g., in chemostats19,33,34). Hence, insights from these systems are not directly transferrable to the physiology of microorganisms in field sediments. There, bacteria are mainly attached to sediments in subsurface environments with contaminant concentrations in groundwater governed by advection and dispersion coupled to the reactive turnover. Under such circumstances, a low extent of isotope fractionation is normally interpreted as evidence of the decreasing degradation rate with depth37 or isotopologue-specific transverse dispersion,38,39 where concentration trends are explained by dilution13 or heterogeneity of groundwater systems.40,41 While mass-transfer limitation due to aquifer heterogeneities is well recognized,40−42 the possible relevance of slow transfer through the bacterial cell wall and its influence on observable isotope fractionation is currently overlooked in the evaluation of degradation at field sites. Neglecting mass transfer through the cell wall may overestimate the effect of dilution, dispersion, or heterogeneity on the observed isotope values. More importantly, such slow membrane permeation may constitute an overlooked bottleneck for degradation that could explain the widely observed persistence of organic micropollutants specifically at low concentrations in the environment.
Hence, the question arises whether and at which concentration an onset of mass-transfer limitation into bacterial cells can be observed during biodegradation in porous media under realistic in situ conditions. To investigate this phenomenon, sediment-attached degrading bacteria would have to be exposed to different steady-state contaminant concentrations over a longer time so that they can adapt their physiology to prevailing substrate fluxes. Sampling would need to allow for a closed mass balance to determine the true turnover. While pronounced degradation-induced isotope fractionation would be observable at high concentrations, isotope fractionation may or may not be masked at low concentrations depending on the absence or presence of mass transfer limitations, respectively.
Unfortunately, large-scale studies in natural aquifers lack the high sampling resolution needed for such an in-depth characterization. We therefore set up a two-dimensional (2-D) flow-through sediment microcosm/tank system43 which allowed (i) establishing a closed mass balance with (ii) sufficient sample resolution at the outlet (every 1 cm) to capture the defined steady-state concentrations within gradients, while (iii) allowing us to collect sufficiently large samples over time for compound-specific isotope analysis (CSIA) at low concentrations. By feeding an anoxic pollutant solution into the center port of the tank, and a medium containing dissolved oxygen (DO) above and below, strong transverse concentration cross-gradients of the organic substrate and DO were established. The organic substrate concentration ranged from high values, at the plume center, to low steady-state levels toward the upper and lower boundaries. Under otherwise identical conditions, bacteria could therefore adapt to different steady-state concentrations, with oligotrophic conditions in the upper and lower regions of the tank (Figure 1).
Figure 1.

Schematic illustration of the 2-D flow-through sediment tank and expected profiles of isotope ratios at the outlet. Scenario (a): in the absence of mass-transfer limitation, isotope values (blue solid line) are expected to increase strongly with degradation at low concentrations. Scenario (b): with mass-transfer limitation, isotope fractionation would be masked at low concentrations.
Figure 1 illustrates our targeted hypotheses. Greater changes in isotope values are expected when the fraction of remaining contaminant decreases by degradation. In the plume center, contaminant concentrations are so high that much turnover is needed to significantly decrease the fraction relative to its initial value. Because such a large extent of degradation is limited by the availability of oxygen, only moderate changes in isotope values are expected. In contrast, larger changes in the isotope values could arise at low concentrations toward the upper and lower boundaries of the tank where degradation is not limited by oxygen availability. Here, isotope values are expected to increase strongly with degradation in the absence of mass transfer (Figure 1, scenario a). In contrast, despite ongoing degradation such a trend would not become apparent if mass transfer into the bacterial cell is limiting (Figure 1, scenario b). Hence, the predicted trends can be tested by the observations, where interpretations are supported by mass balance calculations and via a reactive transport model that accounts for mass transfer into bacterial cells, among other factors controlling solute transport and turnover.
To target a particularly relevant scenario, 2,6-dichlorobenzamide (BAM), a metabolite of the herbicides dichlobenil and chlorthiamide, was chosen as a model compound.44 BAM has been frequently detected at low concentrations in groundwater, exceeding drinking water guidelines (0.1 μg/L) and causing problems for drinking water production in many European countries.44−47 The bacterial degrader inoculated here was Aminobacter sp. MSH1, an aerobic, Gram-negative, motile bacterium,48 exhibiting a documented potential for the purification of BAM-contaminated water in bioaugmented sand filters.44,46,49 Furthermore, BAM is highly water soluble (Kow = 0.7750), ruling out sorption to the sediment as a confounding factor.
The primary objective of this study was to investigate whether mass transfer into bacterial cells limits the in situ biodegradation of BAM at low substrate concentrations in groundwater. Following the hypotheses of Figure 1, CSIA together with concentration and biomass data were applied to calibrate and validate a reactive transport model. The model, in turn, allowed a quantitative elucidation of the interactions between mass transfer, degradation kinetics, solute transport, and isotope fractionation. In addition, by simultaneously evaluating changes in concentrations and isotope values, the model allowed estimating a threshold concentration range below which biodegradation became strongly limited by mass transfer into the cells.
Experimental Section
2-D Flow-Through Sediment-Tank Experiment
We adapted the experimental setup of Bauer et al.43 At the inlet and outlet of the tank, 16 ports (distance: 1 cm) were equally spaced to accurately inject different constituents at specified depths at the inlet and to sample with a high-depth resolution at the outlet. Via depth-resolved sampling at steady state, enough sample volume could be collected at the outlet ports of the tank to enable isotope analysis in a low (μg/L) concentration range. The inner dimensions of the domain were 95 cm × 18 cm × 1 cm (L × H × W), such that the tank represents a quasi-2-D system. A detailed description of the setup is provided in the Supporting Information, as are additional details regarding chemicals, media preparation, and bacterial cultivation.
The water-saturated, sand-packed tank was inoculated with the bacterial strain Aminobacter sp. MSH1 by injecting an inoculum containing 1 × 10⁷ cells/mL across all inlet ports, except the central one, at a pumping rate of 45 ± 2 μL/min/port for 24 h. During the inoculation, a 50 mg/L anoxic BAM solution was continuously injected at the central inlet port. After inoculation, the flow was stopped for 3 h to give bacteria time to adhere to the sediment. Subsequently, an anoxic 50 mg/L BAM solution was continuously introduced through the central inlet port and an oxic medium solution without an additional carbon or nitrogen source was continuously pumped in through all other inlet ports at a pumping rate of 45 ± 2 μL/min/port. This initial injection of BAM resulted in transient breakthrough profiles. The system did not reach steady state during the initial period of 4 weeks. Specifically, the biomass exhibited a transient planktonic behavior, which was likely an artifact from previous growth under well-mixed conditions. Consequently, the time period of the 50 mg/L injection was considered as a preliminary injection phase, where bacteria were still undergoing physiological adaptations after their inoculation, and this initial phase was not considered in the present study.
After 4 weeks, the inlet concentration of BAM was increased to 100 mg/L. The system reached a steady state in the 7th week, that is, 3 weeks after increasing the concentration, as indicated by stable BAM concentrations at the outflow. In this study, Aminobacter sp. MSH1 used BAM as the sole source of carbon, nitrogen, and energy. It is well established that in the catalytic breakdown of BAM, hydrolysis of BAM to 2,6-dichlorobenzoic acid (2,6-DCBA) by Aminobacter sp. MSH1 is the initial, irreversible step,44,51,52 which is associated with a large normal isotope fractionation for both carbon (εC = −7.8 ± 0.2‰) and nitrogen (εN = −13.5 ± 0.2‰).53
For sample collection, the outflow solution was filtered through 0.22 μM syringe filters (Merck KGaA, Germany; filter exchange every 12 h) and pumped into separate sampling vials for each outlet port. The sterilizing filtration can remove the bacteria from the outflow and stop the biodegradation in the solution right after filtration. Samples were collected and stored at −20 °C from week 8 to week 12 and from week 12 to week 16 (where sampling time is in relation to the start time of inoculation). Each sampling period lasted for 30 days until a sufficient sample volume (2 L) was collected at each outlet port to enable CSIA of low substrate concentrations. The Results and Discussion section presents data from this second sampling period.
Carbon and Nitrogen Isotope Analysis of BAM
Carbon and nitrogen isotope values of BAM were measured on a GC-IRMS system. A DB-5 analytical column (60 m, 0.25 mm i.d., 0.5 μm film, Agilent Technologies, Germany) was used in a TRACE GC Ultra gas chromatograph (Thermo Fisher Scientific, Italy) which was coupled to a Finnigan MAT 253 isotope-ratio mass spectrometer through a Finnigan GC Combustion III interface (Thermo Fisher Scientific, Germany). The typical total uncertainty of carbon isotope measurements is ±0.5‰, and the uncertainty of nitrogen isotope measurements is ±1‰. The method, including solid-phase extraction before CSIA, is described by Sun et al.54 and provided in the Supporting Information.
Concentration Measurements of BAM, DO, ATP, and Total Cell Counts
The concentrations of BAM and 2,6-DCBA were measured every 3–5 days. After solid-phase extraction, measurements were conducted via liquid chromatography tandem mass spectrometry (LC–MS/MS) by adapting the method of Jensen et al.55 LC was conducted on an Agilent 1100 HPLC system (Agilent Technologies Inc, USA); MS was performed on a QTrap 4000 system using electrospray ionization (ESI) (Sciex, USA); and separation was carried out on a Kinetex C18 column (2.6 μm, 10 nm, 100 × 2.1 mm i.d., Phenomenex, USA) at 40 °C, with 5 mM of ammonium acetate at pH 2.4 as the mobile phase A and acetonitrile as mobile phase B. A detailed method description is provided in the Supporting Information.
DO concentrations were measured daily via oxygen-sensitive polymer optode foils (18 cm × 0.5 cm; PreSens GmbH, Regensburgs, Germany) glued onto the inner side of the tank and read out by a FIBOX2 Fiber-optic oxygen meter (PreSens, Regensburg, Germany). The intracellular ATP concentrations were measured on a Glomax luminometer (Turner Biosystems, Sunnyvale, CA), according to a method adapted from Hammes et al.56 For total cell counts, samples were collected every 3–5 days from the outlet ports of the tank, fixed with 2.5% glutaraldehyde, and stored at 4 °C in the fridge until measurement. The samples were stained with SYBR Green I and measured on a Cytomics FC 500 flow cytometer (Beckmann Coulter, Hebron, KY) according to the method of Bayer et al.57
Conceptual Model
The model accounts for the possibility of substrate mass transfer through the cell membrane due to passive diffusion driven by concentration differences. The intracellular irreversible hydrolysis of BAM to 2,6-DCBA via an amidase enzyme (Reaction 1) was simulated to follow Michaelis–Menten kinetics (eq 10) and to be the sole step that led to carbon and nitrogen isotope fractionation, resulting in an enrichment of heavy isotopologues of BAM within the cells.53 Subsequently, this enrichment may or may not equilibrate with BAM in the bulk solution depending on the rate of back diffusion through the cell membrane relative to the rate of the enzyme turnover. For the calculation of mass balances, it is assumed that no other reactive intermediates accumulated and that 2,6-DCBA was either degraded to CO2 via aerobic respiration (Reaction 2a) or utilized for biomass synthesis (C5H7O2N), that is, cell growth (Reaction 2b). All microbially mediated reactions were assumed to take place inside the bacterial cells and, thus, to depend on the kinetics of the mass transfer into the bacterial cells.28
| 1 |
| 2a |
| 2b |
Both mobile (planktonic cells) and immobile biomass (cells attached onto the sediment matrix) were considered in the model. Partitioning between mobile and immobile biomass was described by the growth-mediated release of daughter cells and by the first-order attachment of mobile cells onto the sand.58 Because the planktonic cells made up only a very small fraction58−60 (<5%) of the total biomass in the tank, only the immobile biomass was assumed to be responsible for biodegradation.61−65 Biomass was generated by growth from the aerobic degradation of 2,6-DCBA, as parameterized by a dual-Monod kinetic rate expression (eq 12). (Note: Carbon isotope fractionation arising from 2,6-DCBA degradation was not considered in our model formulation because this transformation occurred after the first irreversible step, i.e., the hydrolysis of BAM). Herein, we refer to both Michaelis–Menten kinetics and Monod kinetics interchangeably when referring to saturation-type kinetics, as they are mathematically identical. For rate expressions containing both an electron acceptor and donor dependence, we explicitly state that these are dual-Monod expressions.
Upon the calibration of the model with the experimentally determined high-resolution vertical profiles of concentrations and isotope ratios, we could convert concentration measurements into rates, determine all rate coefficients, and quantify the influence of mass transfer on the reactive turnover at a high spatial resolution under conditions that mimic field applications.
Governing Equations
The 2-D reactive transport of substrates in the bulk solution, and the mass transfer and reactions inside the cell, coupled to the microbial dynamics in the model are described by the following set of partial differential equations.
In the bulk solution
| 3 |
| 4 |
| 5 |
Inside the bacterial cell
| 6 |
| 7 |
| 8 |
in which cbulki [μmol L–1] is the concentrations of substrate i (heavy or light isotopologues of BAM, 2,6-DCBA, or oxygen) in the bulk solution; Xmob [μmolbio L–1] is the mobile biomass concentration; Xim [μmolbio L–1] is the immobile biomass concentration; l,hcintBAM [μmol L–1] is the intracellular concentration of light and heavy BAM isotopologues, respectively; cint [μmol L–1] and cintO2 [μmol L–1] are the intracellular concentrations of 2,6-DCBA and oxygen, respectively; D [m2 s–1] is the dispersion tensor of different substrates and mobile biomass, respectively; v [m s–1] is the velocity vector; rmt [μmol Lcell–1 s–1] is the mass-transfer rate of each substrate through the cell membrane; rdaughter [μmolbio L–1 s–1] is the growth-dependent detachment rate; rattach [μmolbio L–1 s–1] is the bacterial attachment rate; l,hrdegBAM [μmolbio Lint–1 s–1] is the intracellular hydrolysis rate of either the heavy (hrdeg) or the light (lrdegBAM) isotopologue of BAM to 2,6-DCBA; rdeg [μmol Lint–1 s–1] is the intracellular degradation rate of 2,6-DCBA; rdegO2 [μmol Lint–1 s–1] is the consumption rate of oxygen during the degradation of 2,6-DCBA; and ρbio [μmolbio Lint–1] is the molar density of the bacteria, which is defined as biomass (Mcell [μmolbio]) per bacterial cell volume (Vcell [Lint]).
The mass-transfer rate rmti of each substrate through the bacterial cell membrane from the bulk solution to the location of the enzymes is approximated via a linear-driving force model66
| 9 |
in which ktri [s–1] is the first-order mass-transfer coefficient of compound i for diffusion into and out of the cell. We assumed that the mass-transfer coefficients of heavy and light isotopologues of BAM are identical due the negligible difference of their diffusion coefficients.54 In the presence of BAM, the intermediate product 2,6-DCBA is transformed inside the bacterial cell, such that the direction of the mass transfer of 2,6-DCBA is in the opposite direction.
The hydrolysis of both the heavy and light isotopologues of BAM to 2,6-DCBA inside the cell follows Michaelis–Menten kinetics52
| 10 |
| 11 |
in which rmaxhydro [μmol Lint–1 s–1] is the maximum hydrolysis reaction rate and Km [μmol Lint–1] is the half-saturation constant. During the hydrolysis reaction of BAM, 2,6-DCBA is produced inside the cell. The fractionation coefficient α [-] describes the ratio of the pseudo first-order rate coefficient irdegBAM/icint between the heavy and the light isotopologues. The fractionation may either be caused by differences between the isotopologues in the maximum hydrolysis rate, or by differences in the half-saturation concentration.
The rate of 2,6-DCBA degradation, rdegDCBA [μmol Lint–1 s–1], was parameterized as a dual-Monod kinetic rate expression
| 12 |
in which the maximum degradation rate of 2,6-DCBA inside the cell is expressed as μmax·ρbio/Y, μmax [s–1] is the specific growth rate of the bacteria, Y [μmolbio μmol–1] is the growth yield coefficient, and KmDCBA and Km [μmol Lint–1] are the half-saturation constants of 2,6-DCBA and O2, respectively.
The total transformation of 1 mol of BAM to CO2 needs 6.5 mol O2 (Reaction 2a) and the total transformation from 1 mol BAM to biomass (C5H7O2N) requires 1.5 mol O2 (Reaction 2b). Thus, the specific stoichiometric ratio for O2 to degrade 2,6-DCBA to CO2 was computed from a linear combination of both reactions
| 13 |
in which p is the effective stoichiometric coefficient for O2. Thus, the oxygen consumption rate rdegO2 g[μmol Lint–1 s–1] is
| 14 |
The growth rate of immobile biomass rgrowthim [μmolbio L–1 s–1] depends on the biodegradation rate of 2,6-DCBA rdeg, immobile biomass in the bulk solution Xim [μmolbio L–1], cell density ρbio, and yield coefficient Y,
| 15 |
rdaughter [μmolbio L–1 s–1] is the growth-dependent detachment rate. The release of daughter cells rdaughter depends on the proximity of the attached cell concentration Xim to the maximum carrying capacity Xmax [μmolbio L–1]. Thus, as the attached population approaches its maximum capacity, all newly produced cells (via growth) are effectively expelled into the mobile phase
| 16 |
In addition, we assumed that only new grown cells can detach and there was no detachment due to mortality. The adhesion of the planktonic bacteria onto the sediment is represented as the attachment rate rattach,
| 17 |
in which katt is [s–1] is the first-order rate coefficient for attachment. With increasing attachment, the corresponding reduction in carrying capacity (or maximum allowable attached biomass concentration) was assumed to inhibit the attachment rate via: (1–Xim/Xmax).
The isotope ratio of the heavy and light isotopologues of BAM was evaluated by
| 18 |
in which Rsample is the ratio of heavy to light isotopologues of the substrate (hc/lc) and Rstandard is the reference isotope ratio.
The standard model to predict changes in isotope ratios is the Rayleigh equation67,68
| 19 |
in which isotope values at time zero, δ13C0, and time t, δ13Ct, are linked to the remaining substrate concentration fraction f by ε = α – 1.5 The Rayleigh model, however, requires that the isotope fractionating step of a reaction is also the rate-limiting one. Hence, we do not expect that the Rayleigh model holds in the given setup over the whole concentration range if mass transfer becomes limiting at low concentrations, as shown in Figure 1, scenario b.
Numerical Method
The coupled system of equations for the multidimensional reactive transport was solved in MATLAB following the approach of Eckert et al.62 and Mellage et al.58 in which the spatial discretization was done by the cell-centered Finite Volume Method (Δz = 0.001 m and Δx = 0.01 m) with the upwind differentiation of the advective term, and physical transport was coupled to the reactions via a global implicit approach. The Newton–Raphson method was applied to linearize the system of equations. The experiment was simulated with an adaptive time stepping.
Results and Discussion
Stoichiometry of Bacterial Growth and Model Fit
Figure 2 shows the quasi-steady-state profiles with a 100 mg/L BAM inlet concentration at the center port (from week 12 to week 16). The concentration of each species (Figures 2 and 3) was adequately simulated using the calibrated parameters (Table S2) of the reactive transport model, which reached steady state after a simulated time of 17 days (Figure S2). Steep oxygen concentration gradients showed that oxygen was limiting in the plume center, where BAM and 2,6-DCBA concentrations were highest. In contrast, high oxygen concentrations evidenced sufficient O2 supply for aerobic BAM degradation at the plume fringes. A mass balance of the measured concentrations gave a reduction of the total mass flux of BAM from 34.1 ± 1.5 μmol/d in the inlet to 6.2 ± 1.6 μmol/d in the outlet (total reduction by 82%). Concurrently, fluxes of total DO decreased from 237 ± 12 μmol/d at the inlet to 151 ± 5 μmol/d at the outlet and 14.9 ± 2.3 μmol/d out of the produced 2,6-DCBA were not further degraded but reached the outlet, likely because of depleted DO at the plume center. Estimated conversion rates from BAM to 2,6-DCBA were 27.9 ± 1.2 μmol/d and from 2,6-DCBA to biomass and CO2 were 13.0 ± 0.6 μmol/d, resulting in a molar ratio of oxygen to converted 2,6-DCBA of 6.6. This is close to the stoichiometric factor of 6.5 for oxygen in Reaction 2a suggesting that the consumed 2,6-DCBA was primarily used for respiration rather than for growth. Independently, a fitted yield coefficient Y of 0.24 could be derived from the reactive transport model (Table S2), which implies that 24% of the transformed 2,6-DCBA was used in biomass growth whereas 76% was respired, resulting in a stoichiometry of oxygen to 2,6-DCBA of 5.3 (eq 13). While both results confirm that respiratory- and maintenance-driven carbon consumptions were greater than carbon assimilation via growth, the reactive transport model considers additional biomass data so that the value of 5.3 is more reliable to represent the effective stoichiometry of the catabolic reaction.
Figure 2.

Experimental and simulated concentrations of (a) BAM and 2,6-DCBA in the bulk solution (circles with error bars, solid lines) and inside the cell (dashed lines) along the outlet vertical face, (b) oxygen in the bulk solution along the vertical inlet, middle, and outlet faces, (c) total suspended bacterial (mobile) cell numbers at the outlet ports, and (d) ATP per cell calculated by dividing the measured total ATP by the total suspended bacterial cell number at the outlet ports. Error bars represent the standard errors of measurements during the sampling period in a quasi-steady state.
Figure 3.

Carbon and nitrogen isotope values of BAM at the outlet of the tank for a BAM inlet concentration of 100 mg/L. Δδ13C and Δδ15N represent the carbon- and nitrogen isotope value difference between the outlet samples and the BAM inlet solution. Panels (a) and (b): Δδ13C and Δδ15N profiles along the outlet face. Solid lines and dashed lines represent the simulated isotope values with and without the assumption of mass-transfer limitations, respectively. Asterisk symbols represent the data of one-time measurements due to the limited analyte mass at low concentrations, which were not considered for modeling (panel b) and regression (panel c). A dual element isotope plot (Δδ13C vs Δδ15N), with 95% confidence intervals, is shown in panel (c). Error bars represent the instrument uncertainties of ±0.5‰ for carbon isotope measurements and of ±1‰ for nitrogen isotope measurements.
Even though biomass was depleted at the upper and lower boundaries of the tank, where BAM and 2,6-DCBA concentrations were the lowest (<0.1 μmol/L), suspended cell concentrations from 1 × 10⁵ to 5 × 10⁵ cells/mL cells were continuously detected in outflow samples. This continuous outwash may be explained by: (i) trace dissolved organic carbon or nitrogen contained in the medium solution that may have provided an additional low-level source of carbon and nitrogen for bacterial growth61,69 and/or (ii) some washed-out cells were remnants of the initial inoculation.
Evidence of High Cell Activity at the Plume Fringes
The distribution pattern of the suspended bacterial cell numbers informs about the adaptation of the degrader strain Aminobacter sp. MSH1 to different concentrations along the concentration profile (Figure 2). At the plume fringes, the breakthrough of the suspended cells [(3.38 ± 0.36) × 106 cells/mL to (3.88 ± 0.60) × 106 cells/mL] and the ATP concentrations [(7.2 ± 1.4) × 10–9 nmol/cell to (10.9 ± 1.0) × 10–9 nmol/cell] were the highest, indicating that biodegradation was most active where BAM and oxygen were well mixed via transverse dispersion (Figure 2c,d). In contrast, at the center of the plume, the comparatively lower bacterial cell numbers indicated that degradation was limited by the depletion of the electron acceptor (i.e., oxygen). This is supported by the observation that although a large number of cells [(2.70 ± 0.09) × 106 cells/ml] were washed out from the center of the plume, the measured ATP of those cells [(1.78 ± 0.75) × 10–9 nmol/cell] was lower than the ATP at the fringes [(1.09 ± 0.10) × 10–8 nmol/cell] (Figure 2d).
Mass-Transfer Limitation Revealed by Decreased Isotope Fractionation
Figure 3 shows the experimental and simulated profiles of carbon and nitrogen isotope values of BAM in the form of the differences in δ13C and δ15N values between the outlet and the inlet of the tank. The dual-element isotope plot of Δδ13C vs Δδ15N (Figure 3c) shows a slope λ of 1.4 ± 0.5, which is consistent with a value of 1.75 ± 0.03 expected for bacterial BAM hydrolysis reported by Reinnicke et al.53 We experimentally observed the strongest changes in isotope values (Δδ13C values between 9.3 ± 0.5 and 12.4 ± 0.5‰, Δδ15N values between 21 ± 1 and 24 ± 1‰) at the fringes where the electron donor and acceptor were mixed, bacterial activity was high (see Figure 2), and BAM concentrations ranged from 0.4 ± 0.6 μmol/L to 15 ± 9 μmol/L (z = 6, 7 and 10 cm). In contrast, and as expected, the center of the plume (z = 8 cm and z = 9 cm) showed comparatively small changes in isotope values (Δδ13C = 7.3 ± 0.5 and 7.9 ± 0.5‰, Δδ15N = 17 ± 1 and 18 ± 1‰). Here, biodegradation was limited by the lack of the electron acceptor (i.e., oxygen).
At the upper and lower boundaries of the plume, where the electron acceptor was in excess, the residual BAM concentrations were 0.1–50 μg/L (z = 1–5, 11–16 cm), corresponding to the concentrations at which BAM is often detected in groundwater across Europe.44−47 In these zones, where BAM concentrations decreased most strongly, isotope values did not strongly increase but rather decreased significantly. This was contrary to the expected behavior depicted in Figure 1, scenario (a), and to the simulation results in the absence of mass transfer (dashed lines in Figure 3a,b). The drop in δ-values at low concentrations was accurately reproduced by our model that considered the mass transfer of the substrate into and out of the bacteria (solid lines in Figure 3a,b corresponding to the predictions in Figure 1, scenario (b)). Thus, both experimental and simulated results indicate that mass transfer through the cell membrane masked the isotope fractionation at low concentrations in the flow-through porous-media system. This is consistent with the hypothesis of concentration-dependent mass transfer limitation predicted by Thullner et al.,27,28 and the observation that atrazine isotope fractionation was masked at low concentrations in batch and chemostat experiments.18,19
Mass Transfer of BAM Through the Cell Membrane
If the substrate supply into the cell is rate limiting, the intracellular substrate will be used up, resulting in smaller concentrations compared to the concentrations outside at steady state. At high surrounding concentrations in the plume center, when the enzyme reaction was still the rate-determining step, model predictions imply that this intracellular substrate depletion was not yet strongly pronounced. The simulated intracellular BAM concentration still reached 80% of the bulk-phase concentration (Figure S3c), and the isotope fractionation of BAM observed in the bulk phase largely reflected the fractionation by the enzyme. In contrast, at low bulk concentrations, where mass transfer through the cell membrane was the limiting factor (Figure 3a), model simulations predicted a much steeper concentration gradient across the cell membrane so that the simulated intracellular BAM concentration made up only 4% of the surrounding bulk-phase concentration (Figure S3c).
The model simulations resulted in a well-constrained mass transfer coefficient of BAM of 7.6 ± 0.5 s–1, which can be converted (eq S1) to an estimated apparent permeation coefficient PappBAM of (1.1 ± 0.1) × 10–6 m s–1 that describes how fast BAM permeates through the two lipid bilayers of the cell wall. Papp is proportional to the effective membrane diffusion coefficient Dmem and the lipid–water distribution coefficient Klipw.70 Compared to the permeation coefficient derived for mass transfer of atrazine through the cell membrane of Arthrobacter aurescens TC1, Papp = 3.5 × 10⁻⁵ m s–1, the smaller permeation coefficient of BAM is likely attributable to a smaller lipid–water distribution coefficient (KlipwBAM = 11 vs Klipw = 74119). Hence, BAM does not penetrate as easily through the lipid membrane because it is more hydrophilic than atrazine. In contrast, the modeled effective membrane diffusion coefficients agree within one order of magnitude (DmemBAM = (1.0 ± 0.1) × 10–15 m2 s–1 vs Dmem = 1.9 × 10⁻¹⁶ m2 s–1),19 which is in very good agreement considering that different organisms with different cell walls were involved.
In Which Concentration Range Does a Mass-Transfer Limitation Appear?
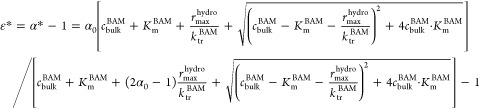
To estimate the concentration range in which mass transfer became limiting, we plotted the changes in carbon isotope values against the concentrations of BAM and visually assessed the concentration at which the carbon isotope fractionation became strongly masked (Figure 4a). The experimental data suggested a BAM threshold range between 5.3 ± 7.6 and 70 ± 112 μg/L (z = 5–6 cm) in the lower region of the plume and a threshold range between 51 ± 78 and 900 ± 400 μg/L (z = 10–11 cm) in the upper region of the plume (grey zone in Figure 4a). To quantitatively analyze the masked isotope fractionation due to mass transfer limitation, we calculated the apparent carbon isotope fractionation enrichment factor *ε based on eq 20 (derivation is provided in the Supporting Information) which is analogous to the expression brought forward by Thullner et al.28
 |
20 |
With fitted values of rmaxhydro(67.3 ± 1.3 μmol Lcell–1 s–1), Km (0.38 ± 0.03 μmol Lint–1), and ktrBAM (7.6 ± 0.5 s–1) and a fixed enzymatic fractionation factor α0 of 0.992 (ε0 = −8‰),53 the calculated value of ε * in the outflow was in the range between −6.3 and −0.33‰ (Figure 4b,c). The turning point at which |ε*| ≤ 0.5‰ was at a bulk concentration value of 600 μg/L (Figure 4b), which was in agreement with the observed threshold range between 51 ± 78 and 900 ± 400 μg/L (z = 10–11 cm). In this threshold range, mass transfer would start to become strongly limiting, as evidenced by masked isotope fractionation. This estimated threshold concentration value of 600 μg/L was somewhat higher than the fitted Km (72 ± 6 μg Lint–1) and a reported Km of BAM in the literature (Km = 135 ± 17 μg/L),52 which is consistent with the prediction that the threshold domain may extend over a certain range because masking is predicted to depend on the magnitude of several rate parameters relative to each other (i.e., KmBAM, rmax, and ktrBAM).28 Even at a relatively high substrate concentration of 8000 μg/L, the enzymatic fractionation factor was already masked with ε* = −6.3‰, which was comparable to the observed reduced atrazine isotope fractionation factor of atrazine hydrolysis with ε* = −3.5‰ at an atrazine concentration of 4000 μg/L.18
Figure 4.

Threshold concentration for mass-transfer limitation determined by the distribution curve of the observed carbon isotope values Δδ13C, and the simulated apparent enrichment factor *ε. (a) Carbon isotope fractionation plotted against the BAM bulk concentration in the outlet. Blue solid lines and dashed lines represent the simulated isotope values with and without the assumption of mass-transfer limitations, respectively. Measured data were labeled with the position of each outlet port (z = 1–16 cm). The gray zone represents the estimated threshold concentration range where the observed isotope values indicate the influence of mass-transfer limitations. (b) Simulated apparent enrichment factor *ε based on eq 20 (circles) and Thullner et al. (plus signs, eq S29) vs the corresponding bulk concentration and (c) along the outlet vertical profile. The vertical black dashed lines in panels (a) and (b) represent a simulated BAM threshold concentration of 600 μg/L (*ε = −0.5‰).
Implications for Interpretation of Isotope Fractionation to Assess Biodegradation in Field Studies
The recognition of cellular mass transfer as a limiting factor in field settings has implications for both interpretations of isotope fractionation and the understanding of bottlenecks in micropollutant degradation. For the interpretation of isotope fractionation at contaminated sites, mass transfer on the cellular level has received little attention thus far. Instead, the Rayleigh equation has been extended to explain cases of small isotope fractionation by introducing different additional factors: (a) variable degradation rates,71 (b) diffusion- or dispersion-induced isotope fractionation,38,39 (c) an isotopic interference from mixing by dispersion or from secondary sources,72,73 and (d) the diminishing effect of a mixing-controlled transport process,13,42,74 or other physical and chemical heterogeneity.40,41
-
(a)
Regarding variable degradation rates, Wanner and Hunkeler observed decreased changes in carbon isotope ratios with depth in contaminated clay, which were explained by a nonuniform, depth-dependent degradation rate due to nutrient availability in the aquitard.37 Our results suggest that mass-transfer limitation by cell–wall permeation could provide an alternative explanation.
-
(b)
As per dispersion, several studies have assumed that isotopologue-specific transverse dispersion may explain isotope patterns observed in transverse profiles of steady-state plumes.38,39 In contrast, recent work from our lab demonstrates that diffusion- and transverse dispersion-induced isotope fractionation of BAM at natural isotopic abundance in a 2-D flow-through sediment system is negligible:54 Diffusion- and transverse dispersion-induced isotope enrichment factors ε were smaller than −0.4‰, and changes in carbon and nitrogen isotope values were within ±0.5 and ±1‰, respectively. Thus, isotope effects of the dispersion can be excluded as an explanation of the observed isotope patterns in the present study.
-
(c)
With regard to mixing with a secondary source, Prommer et al.72 observed muted carbon isotope fractionation of toluene with decreasing toluene concentration at a tar oil-contaminated field site. The failure to detect strong changes in the isotope gradient at low concentrations was explained as the combined result of the additional dissolution of fresh toluene that would dwarf any degradation-induced changes, and a lack of degradation. Muted isotope fractionation was also reported for N2O when tracing microbial N2O production and consumption, where Wenk et al.73 observed significantly weaker N and O isotope effects than expected in lake basins at N2O < 80 μmol/L. Therein, the interference from sedimentary N2O consumption or production was considered as the potential reason. Alternatively, our study brings forward mass-transfer limitation at the cellular level as a possible explanation.
-
(d)
When mass transfer is considered, aquifer heterogeneity is commonly assumed to be the main factor during the reactive transport of contaminants. Druhan and Maher42 simulated diminished isotope fractionation by describing the reactive transport with a travel time distribution as a modifying factor in the Rayleigh equation. Our results show that observable isotope fractionation can be strongly masked by membrane mass transfer even in a homogeneous system.
Our findings are, however, in line with the work on microbial sulfate reduction, where studies22,75−77 converge to a balance between the mass transfer of sulfate through the cell membrane and net sulfate respiration rates, with decreasing isotope fractionation at decreasing extracellular sulfate levels.7,8,22,30,31 Wing and Halevy8 combined kinetic sulfur isotope fractionation, selective sulfate uptake, and equilibrium between extracellular and intracellular sulfur pools. Our model, in contrast, suggests that isotope fractionation may not decrease linearly with concentrations—as conceptualized by Wing and Halevy8 and implemented by Crowe et al.31—but would follow a steeper decline within a narrower range as defined by Michaelis–Menten enzyme kinetics, as hypothesized by Habicht et al.30
To further highlight the impact of mass transfer through the cell membrane, Figure 5b compares simulations using the Rayleigh equation (red solid line) and simulations from a reactive transport model with (blue solid line) and without (blue dashed line) cellular mass transfer. According to Figure 5b, a direct application of the Rayleigh equation at low remaining concentrations would significantly underestimate the extent of degradation. Even reactive transport modeling without the mass-transfer limitation on the cellular level would fail to explain the extent by which observable isotope fractionation was diminished at low concentrations. This illustrates that it is important to consider mass transfer at the cellular level in reactive transport models.
Figure 5.

(a) Δδ13C plotted against the remaining fraction of BAM in the bulk solution after normalization to conservative transport concentrations f(z) = creac(z)/cconservative(z). Measured data were labeled with the position of each outlet port (z = 1–16 cm, from the lower to upper boundary). Regime (i) (blue data points) represents Δδ13C with none-to-little mass-transfer limitation; Regime (ii) (green data points) represents Δδ13C with strong mass-transfer limitation; Regime (iii) (purple data points) represents Δδ13C with the combined effect of strong mass-transfer limitation and physiological limitation. Panel (b) represents the relation between ln(f) and ln(Rt/R0). The blue solid line represents the simulated trend in isotope ratios when considering both dispersion and mass-transfer limitations on the cellular level. The blue dashed line neglects the cellular mass transfer but accounts for the effect of the dispersion on degradation-induced isotope ratio gradients. The red solid line represents the classical Rayleigh relation that would be observed in a well-mixed experimental batch with εcarbon = −8‰.
Implications for Bacterial Adaptation to Biodegradation at Low Concentrations
Figure 5a reveals three different concentration regimes that give rise to different limitations and adaptations of bacterial activity. In regime (i), where BAM concentrations were higher than the threshold of around 600 μg/L (z = 7–10 cm, blue data points in Figure 5a) isotope fractionation followed a trend close to Rayleigh-type isotope fractionation, indicating an unlimited substrate supply into the cells. In regime (ii), at the plume fringes (z = 6 and 11 cm, green data points in Figure 5a), the combination of lower concentrations and higher biomass created a constellation in which mass transfer became limiting and isotope fractionation started to become masked. When moving further toward the low-concentration regime (z = 5, 11–13 cm) isotope values continued to decline due to the mass-transfer limitation. In regime (iii), when substrate concentrations became even lower (z = 1–4, 14–16 cm, purple data points in Figure 5a), changes in isotope values remained equally small. At the same time, however, the remaining concentration fraction f was higher corresponding to a smaller extent of degradation. Therefore, these greater values of f indicated a slowdown of biodegradation, which may point to physiological adaptation or decreased biomass at such lower concentrations. Given that in this very low-concentration region bacteria were less metabolically active,61 degradation was likely not only mass-transfer limited but in addition limited by subsequent bacterial adaptation. The reactive transport model (solid blue line in Figure 5a) accurately simulated the trend in f values and the decrease of isotope values in regime (i) and (ii). However, because the model did not include bacterial adaptation, it did not capture the countertrend toward larger f values at even lower concentrations in regime (iii).
The results of this study revealed a concentration-dependent microbial degradation in a bench-scale physical aquifer model that was limited by mass transfer at the cellular level, at low concentrations, and, possibly, subsequent bacterial adaptation. The results further demonstrate that the assumption of a constant isotopic enrichment factor over the entire substrate concentration range would not be appropriate when evaluating such biodegradation and bacterial activity at low concentrations. To account for this, reactive transport models need to be complemented by a term accounting for mass transfer through the bacterial cell membrane. Finally, the relationship between degradation, ln(f), and isotope fractionation, ln(Rt/R0) (Figure 5a), holds potential to recognize underlying limitations (mass transfer vs physiological adaptation) during ongoing biodegradation. The approach may, therefore, help to identify optimum substrate concentrations for maximum degradation (points farthest to the left in Figure 5a) in bioremediation schemes.
Acknowledgments
This work was funded by an ERC consolidator grant (“MicroDegrade”, grant no. 616861) awarded by the European Research Council. We acknowledge Prof. Dr. Jens Aamand from the Department of Geochemistry, GEUS Geological Survey of Denmark and Greenland for his contribution in providing the strain Aminobacter sp. MSH1. We thank Prof. Christine Stumpp (University of Natural Resources and Life Sciences Vienna), Dr. Sviatlana Marozava, Dr. Benno N. Ehrl, and Dr. Kankana Kundu (Helmholtz Zentrum München) for valuable discussions.
Supporting Information Available
The Supporting Information is available free of charge at https://pubs.acs.org/doi/10.1021/acs.est.0c08566.
More detailed experimental section, description of numerical simulations, parameters of target analytes on MS, flow, and transport parameters and reaction rate coefficients, parameter sensitivities plotted at each measurement location, simulated transient development, and concentration difference (PDF)
Author Contributions
The manuscript was written through contributions of all the authors. All the authors have given approval to the final version of the manuscript.
The authors declare no competing financial interest.
Supplementary Material
References
- Meckenstock R. U.; Morasch B.; Griebler C.; Richnow H. H. Stable isotope fractionation analysis as a tool to monitor biodegradation in contaminated acquifers. J. Contam. Hydrol. 2004, 75, 215–255. 10.1016/j.jconhyd.2004.06.003. [DOI] [PubMed] [Google Scholar]
- Kuntze K.; Eisenmann H.; Richnow H.-H.; Fischer A.. Compound-specific stable isotope analysis (CSIA) for evaluating degradation of organic pollutants: An overview of field case studies. In Anaerobic Utilization of Hydrocarbons, Oils, and Lipids; Boll M., Ed.; Springer: Cham, 2019, pp 323–360. [Google Scholar]
- Fischer A.; Manefield M.; Bombach P. Application of stable isotope tools for evaluating natural and stimulated biodegradation of organic pollutants in field studies. Curr. Opin. Biotechnol. 2016, 41, 99–107. 10.1016/j.copbio.2016.04.026. [DOI] [PubMed] [Google Scholar]
- Braeckevelt M.; Fischer A.; Kästner M. Field applicability of compound-specific isotope analysis (CSIA) for characterization and quantification of in situ contaminant degradation in aquifers. Appl. Microbiol. Biotechnol. 2012, 94, 1401–1421. 10.1007/s00253-012-4077-1. [DOI] [PubMed] [Google Scholar]
- Elsner M. Stable isotope fractionation to investigate natural transformation mechanisms of organic contaminants: Principles, prospects and limitations. J. Environ. Monit. 2010, 12, 2005–2031. 10.1039/c0em00277a. [DOI] [PubMed] [Google Scholar]
- Elsner M.; Zwank L.; Hunkeler D.; Schwarzenbach R. P. A new concept linking observable stable isotope fractionation to transformation pathways of organic pollutants. Environ. Sci. Technol. 2005, 39, 6896–6916. 10.1021/es0504587. [DOI] [PubMed] [Google Scholar]
- Brunner B.; Bernasconi S. M.; Kleikemper J.; Schroth M. H. A model for oxygen and sulfur isotope fractionation in sulfate during bacterial sulfate reduction processes. Geochim. Cosmochim. Acta 2005, 69, 4773–4785. 10.1016/j.gca.2005.04.017. [DOI] [Google Scholar]
- Wing B. A.; Halevy I. Intracellular metabolite levels shape sulfur isotope fractionation during microbial sulfate respiration. Proc. Natl. Acad. Sci. U.S.A. 2014, 111, 18116–18125. 10.1073/pnas.1407502111. [DOI] [PMC free article] [PubMed] [Google Scholar]
- Kritee K.; Sigman D. M.; Granger J.; Ward B. B.; Jayakumar A.; Deutsch C. Reduced isotope fractionation by denitrification under conditions relevant to the ocean. Geochim. Cosmochim. Acta 2012, 92, 243–259. 10.1016/j.gca.2012.05.020. [DOI] [Google Scholar]
- Humez P.; Mayer B.; Nightingale M.; Becker V.; Kingston A.; Taylor S.; Bayegnak G.; Millot R.; Kloppmann W. Redox controls on methane formation, migration and fate in shallow aquifers. Hydrol. Earth Syst. Sci. 2016, 20, 2759–2777. 10.5194/hess-20-2759-2016. [DOI] [Google Scholar]
- Kolhatkar R.; Kuder T.; Philp P.; Allen J.; Wilson J. T. Use of compound-specific stable carbon isotope analyses to demonstrate anaerobic biodegradation of MTBE in groundwater at a gasoline release site. Environ. Sci. Technol. 2002, 36, 5139. 10.1021/es025704i. [DOI] [PubMed] [Google Scholar]
- Koster van Groos P. G.; Hatzinger P. B.; Streger S. H.; Vainberg S.; Philp R. P.; Kuder T. Carbon isotope fractionation of 1,2-dibromoethane by biological and abiotic processes. Environ. Sci. Technol. 2018, 52, 3440–3448. 10.1021/acs.est.7b05224. [DOI] [PubMed] [Google Scholar]
- Kuder T.; Wilson J. T.; Kaiser P.; Kolhatkar R.; Philp P.; Allen J. Enrichment of stable carbon and hydrogen isotopes during anaerobic biodegradation of MTBE: Microcosm and field evidence. Environ. Sci. Technol. 2005, 39, 213. 10.1021/es040420e. [DOI] [PubMed] [Google Scholar]
- Wu L.; Verma D.; Bondgaard M.; Melvej A.; Vogt C.; Subudhi S.; Richnow H. H. Carbon and hydrogen isotope analysis of parathion for characterizing its natural attenuation by hydrolysis at a contaminated site. Water Res. 2018, 143, 146–154. 10.1016/j.watres.2018.06.039. [DOI] [PubMed] [Google Scholar]
- Fischer A.; Theuerkorn K.; Stelzer N.; Gehre M.; Thullner M.; Richnow H. H. Applicability of stable isotope fractionation analysis for the characterization of benzene biodegradation in a BTEX-contaminated aquifer. Environ. Sci. Technol. 2007, 41, 3689–3696. 10.1021/es061514m. [DOI] [PubMed] [Google Scholar]
- Höhener P.; Elsner M.; Eisenmann H.; Atteia O. Improved constraints on in situ rates and on quantification of complete chloroethene degradation from stable carbon isotope mass balances in groundwater plumes. J. Contam. Hydrol. 2015, 182, 173–182. 10.1016/j.jconhyd.2015.09.006. [DOI] [PubMed] [Google Scholar]
- Höhener P.; Li Z. M.; Julien M.; Nun P.; Robins R. J.; Remaud G. S. Simulating stable isotope ratios in plumes of groundwater pollutants with BIOSCREEN-AT-ISO. Groundwater 2017, 55, 261–267. 10.1111/gwat.12472. [DOI] [PubMed] [Google Scholar]
- Ehrl B. N.; Gharasoo M.; Elsner M. Isotope Fractionation Pinpoints Membrane Permeability as a Barrier to Atrazine Biodegradation in Gram-negativePolaromonas sp.Nea-C. Environ. Sci. Technol. 2018, 52, 4137–4144. 10.1021/acs.est.7b06599. [DOI] [PMC free article] [PubMed] [Google Scholar]
- Ehrl B. N.; Kundu K.; Gharasoo M.; Marozava S.; Elsner M. Rate-limiting mass transfer in micropollutant degradation revealed by isotope fractionation in chemostat. Environ. Sci. Technol. 2019, 53, 1197–1205. 10.1021/acs.est.8b05175. [DOI] [PMC free article] [PubMed] [Google Scholar]
- O’Leary M. H. Carbon isotopes in photosynthesis. Bioscience 1988, 38, 328–336. 10.2307/1310735. [DOI] [Google Scholar]
- Wunderlich A.; Heipieper H. J.; Elsner M.; Einsiedl F. Solvent stress-induced changes in membrane fatty acid composition of denitrifying bacteria reduce the extent of nitrogen stable isotope fractionation during denitrification. Geochim. Cosmochim. Acta 2018, 239, 275–283. 10.1016/j.gca.2018.07.037. [DOI] [Google Scholar]
- Rees C. E. A steady-state model for sulphur isotope fractionation in bacterial reduction processes. Geochim. Cosmochim. Acta 1973, 37, 1141–1162. 10.1016/0016-7037(73)90052-5. [DOI] [Google Scholar]
- Mangalo M.; Einsiedl F.; Meckenstock R. U.; Stichler W. Influence of the enzyme dissimilatory sulfite reductase on stable isotope fractionation during sulfate reduction. Geochim. Cosmochim. Acta 2008, 72, 1513–1520. 10.1016/j.gca.2008.01.006. [DOI] [Google Scholar]
- Qiu S.; Gözdereliler E.; Weyrauch P.; Lopez E. C. M.; Kohler H.-P. E.; Sørensen S. R.; Meckenstock R. U.; Elsner M. Small13C/12C Fractionation Contrasts with Large Enantiomer Fractionation in Aerobic Biodegradation of Phenoxy Acids. Environ. Sci. Technol. 2014, 48, 5501–5511. 10.1021/es405103g. [DOI] [PubMed] [Google Scholar]
- Chen S.; Zhang K.; Jha R. K.; Chen C.; Yu H.; Liu Y.; Ma L. Isotope fractionation in atrazine degradation reveals rate-limiting, energy-dependent transport across the cell membrane of gram-negative rhizobium sp. CX-Z. Environ. Pollut. 2019, 248, 857–864. 10.1016/j.envpol.2019.02.078. [DOI] [PubMed] [Google Scholar]
- Nijenhuis I.; Andert J.; Beck K.; Kästner M.; Diekert G.; Richnow H.-H. Stable isotope fractionation of tetrachloroethene during reductive dechlorination by Sulfurospirillum multivorans and Desulfitobacterium sp. strain PCE-S and abiotic reactions with cyanocobalamin. Appl. Environ. Microbiol. 2005, 71, 3413–3419. 10.1128/aem.71.7.3413-3419.2005. [DOI] [PMC free article] [PubMed] [Google Scholar]
- Kampara M.; Thullner M.; Richnow H. H.; Harms H.; Wick L. Y. Impact of bioavailability restrictions on microbially induced stable isotope fractionation. 2. Experimental evidence. Environ. Sci. Technol. 2008, 42, 6552–6558. 10.1021/es702781x. [DOI] [PubMed] [Google Scholar]
- Thullner M.; Kampara M.; Richnow H. H.; Harms H.; Wick L. Y. Impact of bioavailability restrictions on microbially induced stable isotope fractionation. 1. Theoretical calculation. Environ. Sci. Technol. 2008, 42, 6544–6551. 10.1021/es702782c. [DOI] [PubMed] [Google Scholar]
- Sigman D. M.; Casciotti K. L.; Andreani M.; Barford C.; Galanter M.; Böhlke J. K. A bacterial method for the nitrogen isotopic analysis of nitrate in seawater and freshwater. Anal. Chem. 2001, 73, 4145–4153. 10.1021/ac010088e. [DOI] [PubMed] [Google Scholar]
- Habicht K. S.; Salling L.; Thamdrup B.; Canfield D. E. Effect of Low Sulfate Concentrations on Lactate Oxidation and Isotope Fractionation during Sulfate Reduction by Archaeoglobus fulgidus Strain Z†. Appl. Environ. Microbiol. 2005, 71, 3770–3777. 10.1128/aem.71.7.3770-3777.2005. [DOI] [PMC free article] [PubMed] [Google Scholar]
- Crowe S. A.; Paris G.; Katsev S.; Jones C.; Kim S.-T.; Zerkle A. L.; Nomosatryo S.; Fowle D. A.; Adkins J. F.; Sessions A. L.; Farquhar J.; Canfield D. E. Sulfate was a trace constituent of Archean seawater. Science 2014, 346, 735–739. 10.1126/science.1258966. [DOI] [PubMed] [Google Scholar]
- Thullner M.; Fischer A.; Richnow H.-H.; Wick L. Y. Influence of mass transfer on stable isotope fractionation. Appl. Microbiol. Biotechnol. 2013, 97, 441–452. 10.1007/s00253-012-4537-7. [DOI] [PubMed] [Google Scholar]
- Kundu K.; Marozava S.; Ehrl B.; Merl-Pham J.; Griebler C.; Elsner M. Defining lower limits of biodegradation: atrazine degradation regulated by mass transfer and maintenance demand in Arthrobacter aurescens TC1. ISME J. 2019, 13, 2236–2251. 10.1038/s41396-019-0430-z. [DOI] [PMC free article] [PubMed] [Google Scholar]
- Gharasoo M.; Ehrl B. N.; Cirpka O. A.; Elsner M. Modeling of contaminant biodegradation and compound-specific isotope fractionation in chemostats at low dilution rates. Environ. Sci. Technol. 2019, 53, 1186–1196. 10.1021/acs.est.8b02498. [DOI] [PMC free article] [PubMed] [Google Scholar]
- Marozava S.; Meyer A. H.; Pérez-de-Mora A.; Gharasoo M.; Zhuo L.; Wang H.; Cirpka O. A.; Meckenstock R. U.; Elsner M. Mass transfer limitation during slow anaerobic biodegradation of 2-methylnaphthalene. Environ. Sci. Technol. 2019, 53, 9481–9490. 10.1021/acs.est.9b01152. [DOI] [PubMed] [Google Scholar]
- Cichocka D.; Imfeld G.; Richnow H.-H.; Nijenhuis I. Variability in microbial carbon isotope fractionation of tetra- and trichloroethene upon reductive dechlorination. Chemosphere 2008, 71, 639–648. 10.1016/j.chemosphere.2007.11.013. [DOI] [PubMed] [Google Scholar]
- Wanner P.; Parker B. L.; Chapman S. W.; Aravena R.; Hunkeler D. Quantification of degradation of chlorinated hydrocarbons in saturated low permeability sediments using compound-specific isotope analysis. Environ. Sci. Technol. 2016, 50, 5622–5630. 10.1021/acs.est.5b06330. [DOI] [PubMed] [Google Scholar]
- Rolle M.; Chiogna G.; Bauer R.; Griebler C.; Grathwohl P. Isotopic fractionation by transverse dispersion: Flow-through microcosms and reactive transport modeling study. Environ. Sci. Technol. 2010, 44, 6167–6173. 10.1021/es101179f. [DOI] [PubMed] [Google Scholar]
- Van Breukelen B. M.; Rolle M. Transverse hydrodynamic dispersion effects on isotope signals in groundwater chlorinated solvents’ plumes. Environ. Sci. Technol. 2012, 46, 7700–7708. 10.1021/es301058z. [DOI] [PubMed] [Google Scholar]
- Abe Y.; Hunkeler D. Does the Rayleigh equation apply to evaluate field isotope data in contaminant hydrogeology?. Environ. Sci. Technol. 2006, 40, 1588–1596. 10.1021/es051128p. [DOI] [PubMed] [Google Scholar]
- Thullner M.; Centler F.; Richnow H.-H.; Fischer A. Quantification of organic pollutant degradation in contaminated aquifers using compound specific stable isotope analysis - Review of recent developments. Org. Geochem. 2012, 42, 1440–1460. 10.1016/j.orggeochem.2011.10.011. [DOI] [Google Scholar]
- Druhan J. L.; Maher K. The influence of mixing on stable isotope ratios in porous media: A revised Rayleigh model. Water Resour. Res. 2017, 53, 1101–1124. 10.1002/2016wr019666. [DOI] [Google Scholar]
- Bauer R. D.; Maloszewski P.; Zhang Y.; Meckenstock R. U.; Griebler C. Mixing-controlled biodegradation in a toluene plume - Results from two-dimensional laboratory experiments. J. Contam. Hydrol. 2008, 96, 150–168. 10.1016/j.jconhyd.2007.10.008. [DOI] [PubMed] [Google Scholar]
- Ellegaard-Jensen L.; Horemans B.; Raes B.; Aamand J.; Hansen L. H. Groundwater contamination with 2,6-dichlorobenzamide (BAM) and perspectives for its microbial removal. Appl. Microbiol. Biotechnol. 2017, 101, 5235–5245. 10.1007/s00253-017-8362-x. [DOI] [PubMed] [Google Scholar]
- Vandermaesen J.; Horemans B.; Degryse J.; Boonen J.; Walravens E.; Springael D. Mineralization of the common groundwater pollutant 2,6-dichlorobenzamide (BAM) and its metabolite 2,6-dichlorobenzoic acid (2,6-DCBA) in sand filter units of drinking water treatment plants. Environ. Sci. Technol. 2016, 50, 10114–10122. 10.1021/acs.est.6b01352. [DOI] [PubMed] [Google Scholar]
- Albers C. N.; Feld L.; Ellegaard-Jensen L.; Aamand J. Degradation of trace concentrations of the persistent groundwater pollutant 2,6-dichlorobenzamide (BAM) in bioaugmented rapid sand filters. Water Res. 2015, 83, 61–70. 10.1016/j.watres.2015.06.023. [DOI] [PubMed] [Google Scholar]
- Pukkila V.; Kontro M. H. Dichlobenil and 2,6-dichlorobenzamide (BAM) dissipation in topsoil and deposits from groundwater environment within the boreal region in southern Finland. Environ. Sci. Pollut. Res. 2014, 21, 2289–2297. 10.1007/s11356-013-2164-1. [DOI] [PubMed] [Google Scholar]
- Sørensen S. R.; Holtze M. S.; Simonsen A.; Aamand J. Degradation and mineralization of nanomolar concentrations of the herbicide dichlobenil and its persistent metabolite 2,6-dichlorobenzamide by Aminobacter spp. isolated from dichlobenil-treated soils. Appl. Environ. Microbiol. 2007, 73, 399–406. 10.1128/AEM.01498-06. [DOI] [PMC free article] [PubMed] [Google Scholar]
- Albers C. N.; Jacobsen O. S.; Aamand J. Using 2,6-dichlorobenzamide (BAM) degrading Aminobacter sp. MSH1 in flow through biofilters-initial adhesion and BAM degradation potentials. Appl. Microbiol. Biotechnol. 2014, 98, 957–967. 10.1007/s00253-013-4942-6. [DOI] [PubMed] [Google Scholar]
- Clausen L.; Larsen F.; Albrechtsen H.-J. Sorption of the Herbicide Dichlobenil and the Metabolite 2,6-Dichlorobenzamide on Soils and Aquifer Sediments. Environ. Sci. Technol. 2004, 38, 4510–4518. 10.1021/es035263i. [DOI] [PubMed] [Google Scholar]
- T’Syen J.; Raes B.; Horemans B.; Tassoni R.; Leroy B.; Lood C.; van Noort V.; Lavigne R.; Wattiez R.; Kohler H. E.; Springael D. Catabolism of the groundwater micropollutant 2,6-dichlorobenzamide beyond 2,6-dichlorobenzoate is plasmid encoded in Aminobacter sp. MSH1. Appl. Microbiol. Biotechnol. 2018, 102, 7963–7979. 10.1007/s00253-018-9189-9. [DOI] [PubMed] [Google Scholar]
- T’Syen J..; Tassoni R.; Hansen L.; Sorensen S. J.; Leroy B.; Sekhar A.; Wattiez R.; De Mot R.; Springael D. Identification of the amidase BbdA that initiates biodegradation of the groundwater micropollutant 2,6-dichlorobenzamide (BAM) in Aminobacter sp. MSH1. Environ. Sci. Technol. 2015, 49, 11703–11713. 10.1021/acs.est.5b02309. [DOI] [PubMed] [Google Scholar]
- Reinnicke S.; Simonsen A.; Sørensen S. R.; Aamand J.; Elsner M. C and N isotope fractionation during biodegradation of the pesticide metabolite 2,6-dichlorobenzamide (BAM): potential for environmental assessments. Environ. Sci. Technol. 2012, 46, 1447–1454. 10.1021/es203660g. [DOI] [PubMed] [Google Scholar]
- Sun F.; Peters J.; Thullner M.; Cirpka O. A.; Elsner M. Magnitude of diffusion- and transverse dispersion-induced isotope fractionation of organic compounds in aqueous systems. Environ. Sci. Technol. 2021, 55, 4772–4782. 10.1021/acs.est.0c06741. [DOI] [PMC free article] [PubMed] [Google Scholar]
- Jensen G. G.; Björklund E.; Simonsen A.; Halling-Sørensen B. Determination of 2,6-dichlorobenzamide and its degradation products in water samples using solid-phase extraction followed by liquid chromatography-tandem mass spectrometry. J. Chromatogr. A 2009, 1216, 5199–5206. 10.1016/j.chroma.2009.05.009. [DOI] [PubMed] [Google Scholar]
- Hammes F.; Goldschmidt F.; Vital M.; Wang Y.; Egli T. Measurement and interpretation of microbial adenosine tri-phosphate (ATP) in aquatic environments. Water Res. 2010, 44, 3915–3923. 10.1016/j.watres.2010.04.015. [DOI] [PubMed] [Google Scholar]
- Bayer A.; Drexel R.; Weber N.; Griebler C. Quantification of aquatic sediment prokaryotes-A multiple-steps optimization testing sands from pristine and contaminated aquifers. Limnologica 2016, 56, 6–13. 10.1016/j.limno.2015.11.003. [DOI] [Google Scholar]
- Mellage A.; Eckert D.; Grösbacher M.; Inan A. Z.; Cirpka O. A.; Griebler C. Dynamics of suspended and attached aerobic toluene degraders in small-scale flow-through sediment systems under growth and starvation conditions. Environ. Sci. Technol. 2015, 49, 7161–7169. 10.1021/es5058538. [DOI] [PubMed] [Google Scholar]
- Grösbacher M.; Eckert D.; Cirpka O. A.; Griebler C. Contaminant concentration versus flow velocity: Drivers of biodegradation and microbial growth in groundwater model systems. Biodegradation 2018, 29, 211–232. 10.1007/s10532-018-9824-2. [DOI] [PMC free article] [PubMed] [Google Scholar]
- Lehman R. M.; Colwell F. S.; Bala G. A. Attached and unattached microbial communities in a simulated basalt aquifer under fracture- and porous-flow conditions. Appl. Environ. Microbiol. 2001, 67, 2799–2809. 10.1128/aem.67.6.2799-2809.2001. [DOI] [PMC free article] [PubMed] [Google Scholar]
- Sekhar A.; Horemans B.; Aamand J.; Sørensen S. R.; Vanhaecke L.; Bussche J. V.; Hofkens J.; Springael D. Surface Colonization and Activity of the 2,6-Dichlorobenzamide (BAM) DegradingAminobactersp. Strain MSH1 at Macro- and Micropollutant BAM Concentrations. Environ. Sci. Technol. 2016, 50, 10123–10133. 10.1021/acs.est.6b01978. [DOI] [PubMed] [Google Scholar]
- Eckert D.; Kürzinger P.; Bauer R.; Griebler C.; Cirpka O. A. Fringe-controlled biodegradation under dynamic conditions: Quasi 2-D flow-through experiments and reactive-transport modeling. J. Contam. Hydrol. 2015, 172, 100–111. 10.1016/j.jconhyd.2014.11.003. [DOI] [PubMed] [Google Scholar]
- Eckert D.; Rolle M.; Cirpka O. A. Numerical simulation of isotope fractionation in steady-state bioreactive transport controlled by transverse mixing. J. Contam. Hydrol. 2012, 140–141, 95–106. 10.1016/j.jconhyd.2012.08.010. [DOI] [PubMed] [Google Scholar]
- Cirpka O. A.; Valocchi A. J. Two-dimensional concentration distribution for mixing-controlled bioreactive transport in steady state. Adv. Water Resour. 2007, 30, 1668–1679. 10.1016/j.advwatres.2006.05.022. [DOI] [Google Scholar]
- Ballarini E.; Beyer C.; Bauer R. D.; Griebler C.; Bauer S. Model based evaluation of a contaminant plume development under aerobic and anaerobic conditions in 2D bench-scale tank experiments. Biodegradation 2014, 25, 351–371. 10.1007/s10532-013-9665-y. [DOI] [PubMed] [Google Scholar]
- Hesse F.; Harms H.; Attinger S.; Thullner M. Linear exchange model for the description of mass transfer limited bioavailability at the pore scale. Environ. Sci. Technol. 2010, 44, 2064–2071. 10.1021/es902489q. [DOI] [PubMed] [Google Scholar]
- Rayleigh L. L. Theoretical considerations respecting the separation of gases by diffusion and similar processes. Mag. J. Sci. 1896, 42, 493–498. 10.1080/14786449608620944. [DOI] [Google Scholar]
- Hoefs J.Stable Isotope Geochemistry; Springer Verlag: Chicago, 1987. [Google Scholar]
- Helbling D. E.; Hammes F.; Egli T.; Kohler H.-P. E. Kinetics and yields of pesticide biodegradation at low substrate concentrations and under conditions restricting assimilable organic carbon. Appl. Environ. Microbiol. 2014, 80, 1306–1313. 10.1128/aem.03622-13. [DOI] [PMC free article] [PubMed] [Google Scholar]
- Ehrl B. N.; Mogusu E. O.; Kim K.; Hofstetter H.; Pedersen J. A.; Elsner M. High permeation rates in liposome systems explain rapid glyphosate biodegradation associated with strong isotope fractionation. Environ. Sci. Technol. 2018, 52, 7259–7268. 10.1021/acs.est.8b01004. [DOI] [PMC free article] [PubMed] [Google Scholar]
- Wanner P.; Hunkeler D. Carbon and chlorine isotopologue fractionation of chlorinated hydrocarbons during diffusion in water and low permeability sediments. Geochim. Cosmochim. Acta 2015, 157, 198–212. 10.1016/j.gca.2015.02.034. [DOI] [Google Scholar]
- Prommer H.; Anneser B.; Rolle M.; Einsiedl F.; Griebler C. Biogeochemical and isotopic gradients in a BTEX/PAH contaminant plume: Model-based interpretation of a high-resolution field data set. Environ. Sci. Technol. 2009, 43, 8206–8212. 10.1021/es901142a. [DOI] [PubMed] [Google Scholar]
- Wenk C. B.; Frame C. H.; Koba K.; Casciotti K. L.; Veronesi M.; Niemann H.; Schubert C. J.; Yoshida N.; Toyoda S.; Makabe A.; Zopfi J.; Lehmann M. F. Differential N2 O dynamics in two oxygen-deficient lake basins revealed by stable isotope and isotopomer distributions. Limnol. Oceanogr. 2016, 61, 1735–1749. 10.1002/lno.10329. [DOI] [Google Scholar]
- Xu S.; Sherwood Lollar B.; Sleep B. E. Rethinking aqueous phase diffusion related isotope fractionation: Contrasting theoretical effects with observations at the field scale. Sci. Total Environ. 2017, 607–608, 1085–1095. 10.1016/j.scitotenv.2017.06.195. [DOI] [PubMed] [Google Scholar]
- Canfield D. E. Isotope fractionation by natural populations of sulfate-reducing bacteria. Geochim. Cosmochim. Acta 2001, 65, 1117–1124. 10.1016/s0016-7037(00)00584-6. [DOI] [Google Scholar]
- Canfield D. E.; Olesen C. A.; Cox R. P. Temperature and its control of isotope fractionation by a sulfate-reducing bacterium. Geochim. Cosmochim. Acta 2006, 70, 548–561. 10.1016/j.gca.2005.10.028. [DOI] [Google Scholar]
- Mangalo M.; Meckenstock R. U.; Stichler W.; Einsiedl F. Stable isotope fractionation during bacterial sulfate reduction is controlled by reoxidation of intermediates. Geochim. Cosmochim. Acta 2007, 71, 4161–4171. 10.1016/j.gca.2007.06.058. [DOI] [Google Scholar]
Associated Data
This section collects any data citations, data availability statements, or supplementary materials included in this article.