

Abstract
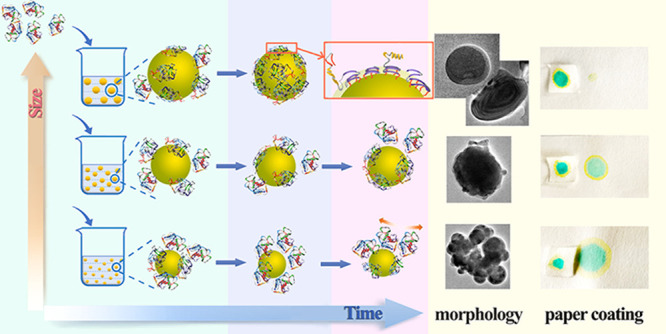
In this work, the effects of droplet size and reaction time on the adsorption-reaction processes between gelatin and α-[3-(2,3-epoxypropoxy) propyl]-ω-butyl-polydimethylsiloxane (PDMS-E) emulsion droplets were studied. Gelatin molecules were only physically adsorbed on the surface of the PDMS-E droplet in the 0–75 min range, which was unrelated to the droplet size (100–1000 nm). For the small-size droplets (<410 nm), the physical adsorption proceeded over 75 min followed by agglomeration. For middle-size droplets (410–680 nm), the physical adsorption finished at 125 min; subsequently, the nucleophilic reaction between the primary amino group and the epoxy group began to happen, and globular-like or core–shell colloidal particles were formed. For large-size droplets (>680 nm), the nucleophilic reaction occurred at 75 min and produced core–shell or multi-layered colloidal particles. In a word, the physical absorption or nucleophilic reaction between gelatin and PDMS-E emulsion droplets could be controlled by controlling the droplet size and reaction time. Furthermore, the soft tissue paper coated with large-size droplets exhibited excellent resistance to water permeability and flame-resistant performance, which were carried out by water resistance and flammability tests.
Introduction
In the process of a chemical reaction, the latex particles isolate the organic molecules from the surrounding water molecules, forming a reaction area of organic molecules, thus successfully “carrying” the organic chemical reactions to the water.1 In the heterogeneous reaction system of polymers, the preparation of monodisperse latex particles with uniform size does not only enable reactions with increased efficiency and under milder reaction conditions2−6 but also avoids the influence of confinement effect caused by the change of particle size on its structure, so that the overall structure and properties can be successfully reproduced repeatedly.7 Therefore, the preparation and surface chemical modification of monodisperse emulsion particles has become a hot spot in the research of oil–water interface chemical reactions during the recent years.8−12 We had studied the preparation of monodisperse emulsion droplet of α-[3-(2,3-epoxypropoxy) propyl]-ω-butyl-polydimethylsiloxane (PDMS-E) and investigated the influence of the size of PDMS-E droplet on the interfacial chemical reaction with gelatin.13,14 During these study, we found that the adsorption of gelatin onto the surface of the PDMS-E droplet may be an important factor affecting the interfacial chemical reactions.
Suen and Morawetz15,16 first studied the physical adsorption of protein on the surface of emulsion particles. When the protein reached a saturation level of adsorption, the interface chemical reaction began to take place. Several subsequent studies provided sufficient proof of this conclusion.17−20 The adsorption capacity depended on the surface structure of emulsion particles, such as surface curvature, charge density, functional group existence, or hydrophobicity.21−23 Sarobe et al. argued that if functional groups existed with a certain surface density on the surface of emulsion particles, all the adsorbed protein would bind covalently.24 With the surface having a greater content of the adsorbed protein, the extent of covalent bonding reduces to a more or less constant value between 60 and 70% and is quite independent of pH and the kind of latex. Lynch and Dawson suggested that protein adsorption can be suppressed by the highly curved surfaces of very small nanoparticles to the point where it no longer takes place.25 The surface curvature should offer a potential route to differential control over the adsorption of protein. Ehrenberg et al. indicated that when surface curvature, which is particularly relevant to surface interactions with proteins, approaches a similar scale of about 10 nm, it begins to vary linearly with size.26 Lynch et al. indicated that for a narrow size range, the surface curvature is definitely not a key factor determining the relative protein affinities of the particles.27 The above research indicated that surface curvature closely depends on the size of monodispersed emulsion particles. Our previous study suggested that charge density and functional group exposure were determined by the size of emulsion droplets.13,14 Hence, it can be deduced that if the size of the monodispersed emulsion particles is adjusted up to a sufficient scale, the adsorption patterns of protein can be efficiently tuned. Further, the extension of the protein chain can be regulated, which can cast a profound effect on the chemical reaction. But so far, there has not been any systematic research report for exploring the effect of scale on the adsorption of protein and the relative chemical reaction.
Moreover, the hydrophobic characteristics of the particle’s surface are also one key factor presumably disturbing protein adsorption. The hydrophobic part of the protein molecules adsorbed on the interface can easily seep into the hydrophobic oil phase, promoting the protein molecular chain to unfold on the surface. Klein found that there is a well-defined difference among the extent of surface coverage of the nanoparticles, for a given level of nanoparticle hydrophobicity, depending on their size, with the greater extent of coverage on the larger-sized particle.28 In addition, the concentration and the secondary structure of protein adsorbed on the surface were also found to be related to the mentioned structural features.29−32 When protein is adsorbed on the emulsion particles, their morphology may change, and the morphology with regular shape and uniform distribution of surface functional groups can accelerate the chemical reaction. In addition, the emulsion with favorable morphology will also show better performance in practical applications.
This study focuses on the effect of the size scale of PDMS-E emulsion droplets on the adsorption of gelatin. The oil–water interface chemical reaction between them has been studied systematically. The adsorption-reaction processes were deduced by controlling the droplet size and time scale, as shown in Scheme 1. The morphology of the product was induced by the process, resulting in the difference in water resistance or flame resistant of the product after coating to the soft tissue paper.
Scheme 1. Adsorption-Reaction Processes Between Gelatin and PDMS-E Emulsion Droplets by Controlling the Droplet Size and Time Scale.

The morphology of the product was induced by the process, resulting in the difference in water resistance or flame resistance of the product after coating to the soft tissue paper.
Experiment
Materials
Sodium dodecylbenzene sulfonate (SDBS), sodium dodecyl sulfate (SDS), and glacial acetic acid were obtained from Alfa Aesar, Shanghai, China. Before using, SDS and SDBS must be recrystallized using ethanol. The Shirasu porous glass (SPG) membrane having a 0.5 μm pore size was procured from China National Pharmaceutical Group Corporation. Type A gelatin from pigskin was purchased from China National Pharmaceutical Group Corporation and used after dialysis. Gel permeation chromatography (GPC) was used to determine the molecular weight (Mw) of gelatin which was determined to be about 1.40 × 10⁵ g mol–1 and Mw/Mn was 1.43 (Table S1). Van Slyke’s method was used to determine the content of primary amino groups in the gelatin at 50 °C and was subsequently estimated as 4.95 × 10⁻⁴ g mol–1. The Van Slyke technique is a method professionally employed to determine the content of amino groups in protein molecules or amino acids. The nitrous acid used in the Van Slyke method undergoes reaction with the free amino groups in the amino acid or protein upon the addition of amino acid or protein into it. This chemical reaction is the underlying principle functioning as the basis of the Van Slyke method for the quantitative estimation of free amino groups. The testing error of the content of free amino groups in gelatin was found to lie well below 1%.33,34
Preparation and Characterization of Monodisperse Latex Particles
The preparation process of PDMS-E (Figure S1) has been elaborated in our previous work. The prepared PDMS-E was added as a dispersed phase into deionized water (200 mL) containing glacial acetic acid (about 0.05 mL) SDBS, SDS to form a water-based emulsion of PDMS-E. The total concentration of surfactant is 0.50 wt %. The dispersed phase (about 2.00 g) passes through the pores of the SPG membrane under certain nitrogen pressure, keeping the pressure, size, and rotating shear speed constant. Upon varying the SDS/SDBS ratio (w/w), latex particles of different particle sizes are obtained.7 Ultrasonic treatment for 2–3 min following preparation of the latex particles can result in maintaining the stability of the emulsion and prevent agglomeration. Scheme 2 presents the illustration of the cross-flow membrane emulsification using tubular SPG membranes.
Scheme 2. Schematic Diagram of the Experimental Apparatus Used for the Preparation of PDMS-E Emulsions Using an SPG Membrane: (a) Circulating Pump; (b) Tubular SPG Membrane With 0.5 μm Pore Size; (c) Magnetic Stirrer; (d) Dispersed Phase; (e) Continuous Phase.

Measurement of the physical size and particle size distribution (PDI) of the emulsion droplets was carried out using a laser particle size analyzer (Zetasizer 2000, Malvern Instruments, U.K.). Mie scattering theory forms the principal idea behind the instrument converting the diffraction spectrum into a PDI curve. First, the emulsion is carefully poured into a color-matching test tube followed by measurement of PDI and size by placing the tube into the ZetaSizer 2000 laser particle analyzer. An optical microscope (Leica Microsystems GmbH, Germany) equipped with a Lecia DFC 420C CCD image capturing system was used to obtain optical microscopic (OM) images. The magnification was 400×.
Characterization of Adsorption and Chemical Grafting Reaction
A gelatin stock solution was prepared by dissolving it in distilled water (5 wt %). After 3 h, the gelatin solution was heated to 50 °C to ensure complete dissolution of gelatin. Subsequently, for each prepared gelatin solution, the pH value was adjusted to 10.0 using sodium hydroxide solution (NaOH, 2.00 mol L–1). The PDMS-E emulsion prepared above was then added into the gelatin solution at a rate of 20 drops min–1 and stirred at 50 °C until the molar ratio PDMS-E/gelatin (0.8: 1.0) was attained. The Mw of the PDMS-E was about 1000. The chemical reaction lasted a total of 300 min. Sample 1–4 was drawn out of the reaction solution at 1, 3, 6, 10, 15, 20, 25, 35, 40, 45, 50, 60, 70, 75, 80, 90, 100, 110, 120, 130, 140, 150, 160, 170, 180, 190, 200, 220, 240, 260, 280, and 300 min; the fluorescence spectra were recorded with Hitachi F-4600 (Hitachi, Japan). The ultraviolet region exhibits broader features (the strongest being at 459 nm).
LabRAM HR800 (HORIBA JY) equipped with an 800 nm red diode laser and a 630 nm argon-ion laser was used to obtain Raman spectra. The emulsion was placed in a capillary tube and focused on the outer surface of latex particles by optical microscope mode. It was then switched to the laser power supply to obtain the Raman spectra of the surface of the latex particles.
Van Slyke’s method was used to determine the content of free amino groups. The viscosity of emulsion was measured using an ubbelohde viscometer. PDMS-E latex particles were characterized for their surface morphology by transmission electron microscopy (TEM, JEM-2100, Japan). First, TEM samples were prepared. The mixture of gelatin and emulsion was diluted up to about 20 times at 50 °C. A droplet mixture was dripped on the copper grid. The excess liquid was absorbed with filter paper and dried with nitrogen at room temperature. TEM images were obtained using JEM-2100.
Experimental Data Analysis Method
Applying a smoothing filtering algorithm to the experimental data, the data was obtained after the median smoothing filtering algorithm. The mean deviation of the experimental data about the median smoothing filtering value was then estimated. The change law of experimental data was expressed intuitively and vividly.
In order to determine the variation of fluorescence intensity with the size scale of the PDMS-E emulsion droplets and reaction time, the concept of dispersion was introduced. First, the maximum fluorescence intensity uij (i = 1, 2, ...,32; j = 1,2, ..., ni) (ni is the number of observed fluorescence intensity data with reaction time ti) measured at 32 points ti within the reaction time of 1 to 300 min is smoothed and denoised by the median smoothing filter algorithm. The data obtained after smooth denoising is referred to as vi (i = 1, 2, ..., 32).
| 1 |
| 2 |
The blue point in the left of Figure 2 represents the original experimental data (ti, uij) (i = 1, 2, ...32; j = 1, 2, ..., ni), and the red point denotes the smoothed and denoised data, which is recorded as (ti, vi) (i = 1, 2, ...,32).
Figure 2.

Fluorescence intensity (blue point) and fluorescence intensity after smooth denoising (red point) at different reaction times 366 (a), 408 (c), 499 (e), 678 (g), and 955 nm (i). The mean deviation trend of fluorescence intensity value with respect to the median smooth denoising values 366 (b), 408 (d), 499 (f), 678 (h), and 955 nm (j).
Second, the following algorithm was used to determine the mean value mdi (i = 1, 2,..., 27) of the absolute deviation between the measured value of each ti (i = 1, 2, ..., 27) (min{ti} = 1, max{ti} = 200) and the median smoothing filter value, which is referred to as the mean deviation about the median smoothing filter value
| 3 |
| 4 |
| 5 |
Performance Study
A representative type of soft tissue paper (thickness about 20 μm) was chosen for these tests. The paper, as the substrate, was prepared into the same size of 10 × 10 mm. The prepared emulsion with different droplet sizes (0.5 mL) was then dripped on the paper by using a dropper, keeping the distance of ∼5 cm between the substrate and the dropper. After coating the layer on the substrate, the sample was kept at room temperature for 12 h. Relative humidity is 24%. The water contact angles were measured on a contact angle meter (SL250 USA KINO Industry). The water resistance tests were carried by dropping acid fruit green dye solution (0.1 M) on the paper samples. Infiltration situation of dye was recorded at 0, 3, 5, 10, 30, 60, and 120 min. The horizontal flame tests were carried out by using a methane flame (about 500 °C) on the samples. The total burning time of the uncoated and coated samples were evaluated.
Results and Discussion
Preparation of Monodisperse PDMS-E Emulsion Droplets
In this work, the passage of a liquid PDMS-E took place through the SPG membrane) into an aqueous solution containing SDS and SDBS (pH = 3.75, adjusted by glacial acetic acid) under a given pressure (P). The total concentration of SDS and SDBS was pre-adjusted at 0.50 wt %. Due to the shear force applied by the stirrer in the continuous phase, emulsion droplets were detached from the pores. There was rapid adsorption of SDS and SDBS at the interface between the water and the generated PDMS-E droplets to stabilize the emulsion droplets. As shown in Figure 1a–e, SPG membranes with a mean pore size of 0.5 or 0.7 μm enabled successful preparation of monodisperse PDMS-E emulsion droplets. The emulsion droplets had mean diameters of 366 ± 70, 408 ± 65, 499 ± 70, 678 ± 65, and 955 ± 70 nm, respectively. Variation in the total concentration of SDS and SDBS, as well as the SDS/SDBS ratio (w/w), resulted in a significant change in the size of emulsion droplets. The mean size of emulsion droplets varies linearly with the interfacial tension (γ) which was tuned by the ratio SDS and SDBS.13 Also, there may be electrokinetic phenomena, such as double-layer screening, ion concentration polarization, and electroosmosis, which also affect the size of the PDMS-E droplet.35,36 The droplets manifested a rather narrow distribution of sizes under each preparation condition, as evident from the small coefficients of variation (CV, <21%).
Figure 1.

Monodisperse PDMS-E droplets as seen in OM images with an average diameter of (a) 366 ± 70, (b) 408 ± 65, (c) 499 ± 70, (d) 678 ± 65, and (e) 955 ± 70 nm. (f) Zeta potential of differently sized monodispersed latex particles.
At constant pH, with an increase in the size of the PDMS-E emulsion droplet, a decrease in the surface charge density was observed leading to a continuous decline in the magnitude of the zeta potential. Ohshima et al. derived the interrelation between the charge density and zeta potential based on Stern theory.37 The pattern obtained in this work is more or less similar, as shown in Figure 1f. Also, it can be inferred that the charged layer on the interface tends to become loose with the increase in droplet size, which pushed the movement of the epoxy group toward the droplet surface. The variation of surface charge density and functional group means that the surface composition of the PDMS-E emulsion droplet has changed, which may result in the changing of the adsorption of gelatin on the surface of these droplets.
Gelatin Adsorption on PDMS-E Emulsion Droplet Surface with Different Sizes
Tryptophan (Trp), tyrosine (Tyr), and phenylalanine (Phe) have aromatic chromophores among all the twenty naturally occurring amino acids. Consequently, these are the primary subject of most laser spectroscopic studies on amino acids so far. These aromatic fluorophores, Trp and Tyr residues, are primarily responsible for the intrinsic fluorescence of gelatin and a number of factors, such as chromophore aggregation and free and bound chromophores affect the fluorescence intensity. In this work, fluorescence spectra were used to analyze the gelatin adsorption on the surface of the PDMS-E emulsion droplet.
In Figures 2 and S2, specific fluorescence spectra shown are similar to each other; however, they have different relative intensities at λmax (459 nm). The fluorescence intensity at the corresponding time was obtained at the reaction time of 1, 3, 6, 10, 15, 20, 25, 35, 40, 45, 50, 60, 70, 75, 80, 90, 100, 110, 120, 130, 140, 150, 160, 170, 180, 190, 200, 220, 240, 260, 280, and 300 min. The results indicate that the variation in fluorescence intensities presents different regulars with the variation of droplet sizes and time scale. The mean deviation of the fluorescence intensities at each time was calculated using eqs 1–5. The statistical data was termed as dispersion.
When the sizes of droplets equal 366 nm, the fluorescence intensity had a large amplitude. Statistical results show that the dispersion of fluorescence intensity is in the range of 5–60%. On the time scale, the fluorescence intensity declined rapidly at 5–75 min. In the range of 75–200 min, the fluorescence intensity started to shrink at some extent. Over 200 min, the dispersion of fluorescence intensity changes to stability; however, the fluorescence intensity shows a rising pattern. When the droplets’ sizes equal 407 and 498 nm, the dispersion shrinks in the range of 5–35%. The fluorescence intensity declined rapidly at 5–75 min and tended to stabilize over 200 min. When droplet sizes are equivalent to 678 and 955 nm, the dispersion shrinks in the range of 5–35%. However, over the entire time scale ranging from 5–300 min, the fluorescence intensity manifested a rapid downward trend. It can be seen that the change in the fluorescence intensity is not only associated with the size scale of the PDMS-E emulsion droplet but also relates to the time scale. Based on the size scale, the change in fluorescence intensity went through three stages, which corresponded to <410, 410–680, and >680 nm, respectively. Similarly, the fluorescence change underwent three stages based on the time scale, which corresponded to the time range of 0–75, 75–200, and 200–300 min, respectively.
At 0–75 min, a rapid decline in fluorescence intensity was observed. It is inferred that the step may be controlled by the long-range van der Waals forces or electrostatic interaction between gelatin molecules and surfactant molecules lying on the surface of the PDMS-E emulsion droplet. The interaction can result in the aggregation of gelatin on the surface of the droplets16 and subsequently lead to a rapid decrease in the fluorescence intensity. In the time range, the decrease of fluorescence intensity has no relative-to-droplet size. In the range of 75–200 min, the fluorescence intensity shocked to a certain extent. The obvious shocking is evident in the smaller size of the emulsion droplet. The surface of the emulsion droplet has a large number of gelatin molecules adsorbed on it, which consequently causes an increase in the density of gelatin molecules on the surface. As the particle size becomes smaller, the surface density of gelatin increases and the distance between neighboring gelatin molecules become smaller. As a consequence of this, surface binding energy will be lost upon reaching the critical packing density, thereby inhibiting the adsorption.38,39 In addition, the gelatin molecules will composite to these surfactant molecules until the emulsion structure is destroyed. Hence, this may be the plausible cause of the violent fluctuation in fluorescence intensity. However, for larger emulsion droplets, the density of gelatin adsorbed on the surface is lower. The intermolecular repulsion is negligible at such low density and intergelatin distances are rather large.23 The gelatin molecular chain will tend to extend, and the primary amino group on the gelatin molecule thus becomes more prone to nucleophilic reaction with the epoxy group. This is presumably the reason for the gradual decrease observed in fluorescence intensity. In addition, the surface curvature, surface charge density, and functional group exposure of latex particles also affect the adsorption process, which is a very complicated process and difficult to be determined using a single parameter. In the range of 200–300 min, the fluorescence intensity changes to stability. It is speculated that this stage is regulated by a chemical reaction process for large droplets. But gelatin–surfactants complex may form in the time range for a small droplet system. According to the results of the fluorescence intensity curve, the larger the size of droplets is a response to the faster reduction for the fluorescence intensity, implying that the reaction speed of amino and epoxy groups was also faster. The chemical reaction between gelatin and PDMS-E emulsion droplet was studied further for analyzing related experimental phenomena.
Effect of Adsorption on Chemical Grafting Reaction
The changes in the primary amino groups of the adsorbed gelatin were determined using the Van-Slyke method. Figure 3 represents the variation in the primary amino content over time.
Figure 3.

Progress in the conversion of amino groups in the PDMS-E latex particles of different sizes with gelatin.
In short, the droplet scale and time scale had a substantial impact on the conversion rate of amino groups. In the 0–75 min stage, the rate of conversion of amino groups varies from 2.5 to 5%. The difference is small. It can be deduced that the chemical reaction has not occurred as yet. At this stage, the conversion rate of amino groups has no significant correlation with the size of the droplet. After the passage of 75 min, the conversion rate of amino groups can be observed to be quickly increasing when the size of the droplet is 938 nm and reached to 13.15% at 300 min. However, for the size of 262 and 618 nm droplets, the increase of conversion rate of amino groups began to increase until 125 min. This result indicated that physical adsorption dominates the stage in the time range of 5–125 min for smaller droplets. At 300 min, the rate of conversion of amino groups reached to 10.13% for 618 nm droplets and only reached to 5.14% for 262 nm droplet. The results indicated that the size of the PDMS-E emulsion droplet has a positive correlation with the conversion rate of amino groups.
The Raman spectra in Figure 4 correspond to PDMS-E droplets upon adsorbing gelatin for 5 and 120 min. The epoxy groups in PDMS-E chains give rise to the peaks at 858 cm–1 (Table S2). The result shows that the peak intensities at 858 cm–1 experience a significant decrease when the time increases from 5 to 120 min. When the size of the droplet is 396, 507, and 891 nm, the percentage of decrease is 91.63, 77.88, and 72.73%, respectively. The results indicated that the epoxy groups are consumed as the duration of the reaction increases, and the rate of consumption of epoxy groups was positively correlated with the size of the PDMS-E emulsion droplet.
Figure 4.

Raman spectra of PDMS-E latex particles of (a) 396, (b) 507, and (c) 891 nm after adsorbing gelatin for 5 and 120 min. The change in 858 cm–1 peak intensity (d).
When the droplet size was small, a tight interface layer would come into existence. The reactive epoxy groups are shielded from being attacked, which leads only to physical adsorption of the gelatin on the PDMS-E emulsion droplet. The hydrophobic part of the protein molecules adsorbed at the interface can easily infiltrate into the hydrophobic oil phase, resulting in the unfolding of the protein molecular chain.24 Therefore, the addition of only a small amount of ionic surfactant can influence the conformation of the adsorbed protein. The fluorescence intensity is closely related to the conformation and aggregation of gelatin molecules. With the increase in droplet size, the charged layer on the interface tends to loosen, which pushed the epoxy groups to move toward the surface of the droplet. Hence, there is a more likely chance of the attack of the amino groups on the epoxy groups. So, when the size of the emulsion droplet increases, physical adsorption is accompanied by a chemical reaction between the gelatin and the PDMS-E emulsion droplet. The conformation of gelatin which is adsorbed on the droplet surface should play a key role in the rate of conversion of amino groups.
Conformation Characterization
Raman spectroscopy is recognized as an effective method to study the conformational mobility and secondary structure of chains of polypeptides. The Amide I (1,720–1,580 cm–1) spectral region was studied in an attempt to determine the various components of the gelatin’s secondary structure. The bands at 1650–1657 cm–1 are assigned to α-helix, 1612–1640 cm–1 are assigned to β-sheets, and 1640–1651 and 1657–1675 cm–1 are assigned to random coils and β-turns, respectively (Figure 5).
Figure 5.

Raman spectra and secondary structure content of emulsion droplets with different particle scales (a,d) 396 nm, (b,e) 502 nm, and (c,f) 891 nm.
Raman spectroscopy precisely provides information on the secondary structure content. The main results have been summarized in Table 1. It is found that at 5 min, the β-sheet predominates in adsorbed gelatin, followed by the random coils. The α-helix and random coil structures are comparatively less. This is probably related to the electrostatic interactions of the particle surfaces.40 At 120 min time, the change of the β-sheet and random coil in 396 nm was not obvious compared with that at 5 min. The content of the α-helix structure increased by 1.486% and that of β-turn decreased by 0.85%. For 502 nm, a comparison of the secondary structure at 5 and 120 min shows that the β-sheet and α-helix decreased by an amount of 1.35 and 2.33%, respectively, while the random coil and β-turn showed an increase by 2.25 and 2.33%. For the comparison between 5 and 120 min in 891 nm, the content of random coil, α-helix, and β-turn decreased by 0.62, 0.48, and 1.22%, while on the contrary, the β-sheet increased by an amount of 1.35%.
Table 1. Secondary Structure at the Reaction Time of 5 min and 120 min.
| secondary
structure content |
|||||
|---|---|---|---|---|---|
| scale/nm | time/min | β-sheet % | random % | α-helix % | β-turn % |
| 396 | 5 | 30.86 | 29.62 | 22.88 | 16.64 |
| 120 | 30.25 | 29.59 | 24.36 | 15.79 | |
| 502 | 5 | 31.00 | 27.42 | 23.40 | 18.18 |
| 120 | 29.66 | 29.67 | 21.06 | 19.60 | |
| 891 | 5 | 28.35 | 26.50 | 23.21 | 21.94 |
| 120 | 30.34 | 25.89 | 22.72 | 20.72 | |
The size scale of the PDMS-E droplet affects the secondary structure of gelatin. The interface layer of the droplet should include the epoxy groups, the headgroups of surfactants as well as the groups connected to them. When the droplet size becomes larger, the density of distribution of headgroups in surfactants undergoes a decline. However, on the contrary, the polar epoxy functionality tends to locate itself in the interface with the increase in the size of the droplet. When gelatin is adsorbed on larger droplets, hydrophobic interaction between gelatin with surfactants and PDMS-E components play an important role. In addition, epoxy groups accumulating on the interface facilitates the attack of nucleophiles on them. These effects are beneficial to the strength of gelatin chains. So, the β-sheet content is produced. Our results agree with the earlier reports in literature according to which the larger the particle scale, the higher the degree of gelatin unfolding on the particle surface, and the greater the effective chemical attack.41 The hydrophobic interaction with the surface of the material makes the helical secondary structure of the protein unstable and a resultant loss in the content of the α-helix.30
For smaller droplets, electrostatic interaction between the headgroups of surfactants and gelatin dominates the interactions among the components. The complex may be formed between gelatin and SDS/SDBS. So, with the increase in time, the complex can strip from the droplet. The α-helix content increases under the influence of interactions.
Viscosity Study
The viscosity of emulsion was measured over time. To explain the relationship between the concentration of the gelatin solution and its viscosity, a standard curve gelatin solution concentration versus viscosity was drawn (Figure 6a). The positive correlation between concentration and viscosity of the emulsion is significant.
Figure 6.

(a) Standard curve of gelatin solution concentration–viscosity. (b) Change of emulsion viscosity with time. (c) Curve highlighting the relationship between the relative viscosity (η/η0) and the time of the emulsion. η and η0 are the viscosity of emulsion at the actual time and 5 min.
Figure 6b,c shows that the viscosity decreases with time at any scale. For the larger droplet, the viscosity undergoes a fast decline (Figure 6b). Jain reported42 that due to the long polymer chains being selectively adsorbed on the nanoparticles and the interparticle distance playing its part, a large decrease is observed in viscosity. Adsorption of chains with a high molar mass on the surface of nanoparticles results in an eventual reduction in the density of entanglement density, thereby increasing the flowability or a decrease in the viscosity. Therefore, we speculated that the orderly colloidal aggregates are obtained with the occurrence of the nucleophilic attack on the surface of the droplet. However, for the smaller droplet, the collapse of the droplet, the attack of the nucleophile, and the formation of complex occur rather simultaneously and there is not a very obvious change in viscosity.
Figure 6c shows the relationship between relative viscosity (η/η0) and time. η/η0 reflects the adsorption rate of gelatin on the surface of the droplet. The results show that η/η0 in a larger droplet system was obviously higher than that smaller one with the increase in time, which implies that the rate of adsorption on a large scale was rather higher. The results are in agreement with the above analysis. Especially, when the time reaches 140 min, the η/η0 in 571, 715, and 814 nm systems present a significant decrease. However, the η/η0 manifests an increase in the 220 nm system. The result shows that during this time, the adsorption behavior on the surface of the large-size latex particles is fast and stable, but when adsorption occurs on the surface of small particles, the process is not only slow but desorption also takes place alongside.
Morphology Characterization
The adsorption mode of protein is closely related to the physicochemical properties and morphology of latex particles. TEM was used to detect the morphology of latex particles with the change in particle sizes.
The reaction between gelatin and PDMS-E latex particles is affected by many factors, and the resulting morphological changes are also rather complicated. It is intuitive to observe the particle aggregation with TEM images of a small scale (Figure 7a,b). This phenomenon also happens at other scales; however, by decreasing the scale, the phenomenon of agglomeration manifests a rise. This is presumably the reason behind the change in the viscosity of emulsion with scale. In addition to small range aggregation, an aggregate with an irregular surface was observed in the medium-scale emulsion (Figure 7c,d). The complex processes of adsorption, desorption, and chemical grafting on the surface at the same time practically makes it impossible to maintain a regular morphology.
Figure 7.

TEM images of emulsions with particle sizes of 262 (a,b), 618 (c,d), and 938 nm (e,f).
A core–shell structure appeared in the large-scale emulsion (Figure 7e). With the increase in time duration, the gelatin molecule gradually adsorbed on the latex particles and combined chemically. It stretched on the surface to form a shell layer, whereas the PDMS-E segments curled into the core. The hydrophobic part of gelatin penetrates the oil phase, and the hydrophilic part is completely mixed in the shell. At around the same time, a multi-layer structure was found to form in the large-size aggregates (Figure 7f). Xu et al. has proved through research that the PDMS-E grafted gelatin polymer forms spherical aggregates in the SDS system and possesses a multilayered structural framework. While the outermost layer is the polypeptide layer, the inward is the PDMS segment layer. Subsequently, the polypeptide layer and the PDMS layer alternately appear in the structure.43,44 The appearance of the multilayer structure is the result of the stable grafting reaction of gelatin and PDMS-E, and it does not appear as such on a small scale.
Water Resistance
As illustrated in Figure 8, the soft tissue paper had a hydrophilic interface (CA < 5°). After coating, the papers showed hydrophobic interfaces (CA > 118°). It was due to the water-repelling character of PDMS-E.45 The results of water permeability test showed that water droplets spread out quickly on the soft tissue paper interface without any coating. After the paper was coated by product that was prepared from different sizes of the PDMS-E droplet, coating obvious increased in its resistance to water permeability with increasing the size of the PDMS droplet. When coating with the 262 nm system, the water droplets showed obvious permeability after 60 min. When coating with the 938 nm system, the water droplets can hardly penetrate paper, which should be attributed to the formation of multi-layer or core–shell structure in the large droplet size system. PDMS-E as an active ingredient can distribute uniformly in the paper.46
Figure 8.

Resistance-to-water permeability test and the change of the contact angle with time. Soft tissue paper without coating (a). Soft tissue paper was coated with products that was prepared from the 262 nm droplet system (b), 618 nm system (c), and 938 nm system (d), respectively.
Flammability Test
As shown in Table 2, the soft tissue paper without coating burned completely with almost no residue. After coating, burned residues were shown, which means that the fire spread rates on the treated samples are retarded. This result indicates that the coating has the ability to resist the fire.47 By the flammability test result analysis and contrast, ideal results can be obtained by coating with the product that was prepared from the large-size emulsion system. The higher PDMS-E grafting ratio in large-size emulsion was achieved, which was an important role in improving the flame retardant of the tissue paper.
Table 2. Horizontal Burning Test Dataa.
| samples | burning time (s) | char residue (wt %) |
|---|---|---|
| (a) | 3.73 | 0.465 |
| (b) | 4.77 | 6.024 |
| (c) | 5.54 | 9.211 |
| (d) | 4.80 | 11.538 |
Soft tissue paper without coating (a). Soft tissue paper was coated with products that was prepared from the 262 nm droplet system (b), 618 nm system (c) and 938 nm system, respectively.
Conclusions
A systematic investigation of the impact of the scale effect on adsorption behavior of gelatin on the PDMS-E monodisperse emulsion droplets has been carried out in this work. The result indicated that physical adsorption of gelatin on the droplets played a key role in the range of 0–75 min for droplets of all sizes. In the 75–200 min range, combined with the rate of conversion of amino groups and analysis of the Raman spectra, it can be deduced that this is a competition stage between physical adsorption and chemical reaction. For droplets <410 nm, adsorption and desorption remained a major continuous process on the time scale. However, chemical reactions play a leading role in droplets with a size of >680 nm. Beyond 200 min, amino and epoxy groups were fast consumed for a droplet with a size >680 nm and resulted in the formation of the β-sheet structure, which evidently induced the ordered aggregation of the polymer. Excellent resistance to water permeability and flame retardancy were presented for soft tissue papers that were coated with product including core–shell and multi-layer structure. This study has valuable importance for controlling the reaction rate of hybridization reaction among incompatible polymers and morphology of the polymer.
Acknowledgments
This work was supported by the Research Leader Studio Project-Jinan (grant no. 2019GXRC060), the Natural Science Foundation of China (grant no. 21606138), Yong Taishan Scholar Program of Shandong Province (no. tsqn201909139), and Program for Scientific Research Innovation Team in Colleges and Universities of Shandong Province.
Supporting Information Available
The Supporting Information is available free of charge at https://pubs.acs.org/doi/10.1021/acsomega.1c01789.
GPC for carrying out the molecular weight characterization of the gelatin; 1H NMR spectra of PDMS-H and PDMS-E; fluorescence intensity of emulsion with different sizes; and peak intensity and change rate of various sizes at 858.1 cm–1 (PDF)
Author Contributions
The manuscript was written through contributions of all authors. All authors have given approval to the final version of the manuscript.
The authors declare no competing financial interest.
Supplementary Material
References
- Lemonick S. For organic chemists, micellar chemistry could be a revolution. Chem. Eng. News 2020, 98, 20–23. [Google Scholar]
- Liu L.; Lv G.; Ren X.; Li X.; Wang T.; Dong J.; Wang Z.; Wu G. Effect of size of latex particles on the mechanical properties of hydrogels reinforced by latex particles. RSC Adv. 2019, 9, 14701–14707. 10.1039/c9ra01688k. [DOI] [PMC free article] [PubMed] [Google Scholar]
- Sarkar A.; Ademuyiwa V.; Stubley S.; Esa N. H.; Goycoolea F. M.; Qin X.; Gonzalez F.; Olvera C. Pickering emulsions co-stabilized by composite protein/ polysaccharide particle-particle interfaces: Impact on in vitro gastric stability. Food Hydrocolloids 2018, 84, 282–291. 10.1016/j.foodhyd.2018.06.019. [DOI] [Google Scholar]
- Guo D.; Zhu D.; Zhou X.; Zheng B. Accelerating the “On Water” reaction: By organic-water interface or by hydrodynamic effects?. Langmuir 2015, 31, 13759–13763. 10.1021/acs.langmuir.5b04031. [DOI] [PubMed] [Google Scholar]
- Ma E.; Ouahbi T.; Wang H.; Ahfir N.-D.; Alem A.; Hammadi A. Modeling of retention and re-entrainment of mono- and poly-disperse particles: Effects of hydrodynamics, particle size and interplay of different-sized particles retention. Sci. Total Environ. 2017, 596–597, 222–229. 10.1016/j.scitotenv.2017.03.254. [DOI] [PubMed] [Google Scholar]
- Zou H.; Wang X. Adsorption of silica nanoparticles onto poly(N-vinylpyrrolidone)-functionalized polystyrene latex. Langmuir 2017, 33, 1471–1477. 10.1021/acs.langmuir.6b03977. [DOI] [PubMed] [Google Scholar]
- Shin J. M.; Kim M. P.; Yang H.; Ku K. H.; Jang S. G.; Youm K. H.; Yi G.-R.; Kim B. J. Monodipserse nanostructured spheres of block copolymers and nanoparticles via cross-flow membrane emulsification. Chem. Mater. 2015, 27, 6314–6321. 10.1021/acs.chemmater.5b02020. [DOI] [Google Scholar]
- Qu Y.; Huang R.; Qi W.; Su R.; He Z. Interfacial polymerization of dopamine in a Pickering emulsion: synthesis of cross-linkable colloidosomes and enzyme immobilization at oil/water interfaces. ACS Appl. Mater. Interfaces 2015, 7, 14954–14964. 10.1021/acsami.5b03787. [DOI] [PubMed] [Google Scholar]
- Piradashvili K.; Alexandrino E. M.; Wurm F. R.; Landfester K. Reactions and polymerizations at the liquid-liquid interface. Chem. Rev. 2016, 116, 2141–2169. 10.1021/acs.chemrev.5b00567. [DOI] [PubMed] [Google Scholar]
- Yang J.; Tan P.; Huang T.; Nischwitz V. Exploring the upper particle size limit for field flow fractionation online with ICP-MS to address the challenges of water samples from the Taihu Lake. Anal. Chim. Acta 2020, 1093, 16–27. 10.1016/j.aca.2019.09.044. [DOI] [PubMed] [Google Scholar]
- Zhang P.; Sundberg D. C.; Tsavalas J. G. Polymerization induced phase separation in composite latex particles during seeded emulsion polymerization. Ind. Eng. Chem. Res. 2019, 58, 21118–21129. 10.1021/acs.iecr.9b02964. [DOI] [Google Scholar]
- Pessoni L.; Veclin C.; El Hadri H.; Cugnet C.; Davranche M.; Pierson-Wickmann A.-C.; Gigault J.; Grassl B.; Reynaud S. Soap- and metal-free polystyrene latex particles as a nanoplastic model. Environ. Sci.: Nano 2019, 6, 2253–2258. 10.1039/c9en00384c. [DOI] [Google Scholar]
- Zhu C.; Xu J.; Hou Z.; Liu S.; Li T. Scale Effect on the interface reaction between PDMS-E emulsion droplets and gelatin. Langmuir 2017, 33, 9926–9933. 10.1021/acs.langmuir.7b02532. [DOI] [PubMed] [Google Scholar]
- Ma H.; Hua Y.; Zhu C.; Hou Z.; Zhao B.; Pu Y.; Cai Z.; Zhang L.; Li T.; Xu J. Reaction kinetics at PDMS-E emulsion droplet–gelatin interface. Langmuir 2019, 35, 894–900. 10.1021/acs.langmuir.8b03633. [DOI] [PubMed] [Google Scholar]
- Suen C. H.; Morawetz H. Reactive latex studies. 1. Kinetics of reactions of poly (vinylbenzyl chloride) latex with water-soluble amines. Macromolecules 1984, 17, 1800–1803. 10.1021/ma00139a030. [DOI] [Google Scholar]
- Suen C.-H.; Morawetz H. Reactive latex studies, 2. Kinetics and retention of enzymatic activity in the covalent protein bonding to a polymer latex. Makromol. Chem. 1985, 186, 255–260. 10.1002/macp.1985.021860205. [DOI] [Google Scholar]
- Hou X.; Liu B.; Deng X.; Zhang B.; Yan J. Monodisperse polystyrene microspheres by dispersion copolymerization of styrene and other vinyl comonomers: characterization and protein adsorption properties. J. Biomed. Mater. Res., Part A 2007, 83, 280–289. 10.1002/jbm.a.31229. [DOI] [PubMed] [Google Scholar]
- Kahraman A. S.; Gümüşderelioğlu M.; Tuncel A. Cellular interactions of monodisperse poly(GDMA) latex particles-containing DMAEM brushes. Colloids Surf., A 2011, 384, 90–97. 10.1016/j.colsurfa.2011.03.022. [DOI] [Google Scholar]
- Taniguchi T.; Duracher D.; Delair T.; Elaïssari A.; Pichot C. Adsorption/desorption behavior and covalent grafting of an antibody onto cationic amino-functionalized poly(styrene-N-isopropylacrylamide) core-shell latex particles. Colloids Surf., B 2003, 29, 53–65. 10.1016/s0927-7765(02)00176-5. [DOI] [Google Scholar]
- Gonzalez V. D. G.; Garcia V. S.; Vega J. R.; Marcipar I. S.; Meira G. R.; Gugliotta L. M. Immunodiagnosis of Chagas disease: Synthesis of three latex-protein complexes containing different antigens of Trypanosoma cruzi. Colloids Surf., B 2010, 77, 12–17. 10.1016/j.colsurfb.2009.12.021. [DOI] [PubMed] [Google Scholar]
- Lück M.; Paulke B. R.; Schröder W.; Blunk T.; Müller R. H. Analysis of plasma protein adsorption on polymeric nanoparticles with different surface characteristics. J. Biomed. Mater. Res. 1998, 39, 478–485. [DOI] [PubMed] [Google Scholar]
- Han D. K.; Park K. D.; Ryu G. H.; Kim U. Y.; Min B. G.; Kim Y. H. Plasma protein adsorption to sulfonated poly(ethylene oxide)-grafted polyurethane surface. J. Biomed. Mater. Res. 1996, 30, 23–30. . [DOI] [PubMed] [Google Scholar]
- Rabe M.; Verdes D.; Seeger S. Understanding protein adsorption phenomena at solid surfaces. Adv. Colloid Interface Sci. 2011, 162, 87–106. 10.1016/j.cis.2010.12.007. [DOI] [PubMed] [Google Scholar]
- Sarobe J.; Molina-Bolívar J. A.; Forcada J.; Galisteo F.; Hidalgo-Álvarez R. Functionalized monodisperse particles with chloromethyl groups for the covalent coupling of proteins. Macromolecules 1998, 31, 4282–4287. 10.1021/ma9707143. [DOI] [Google Scholar]
- Lynch I.; Dawson K. A. Protein-nanoparticle interactions. Nano Today 2008, 3, 40–47. 10.1016/s1748-0132(08)70014-8. [DOI] [Google Scholar]
- Ehrenberg M. S.; Friedman A. E.; Finkelstein J. N.; Oberdörster G.; McGrath J. L. The influence of protein adsorption on nanoparticle association with cultured endothelial cells. Biomaterials 2009, 30, 603–610. 10.1016/j.biomaterials.2008.09.050. [DOI] [PubMed] [Google Scholar]
- Lynch I.; Cedervall T.; Lundqvist M.; Cabaleiro-Lago C.; Linse S.; Dawson K. A. The nanoparticle-protein complex as a biological entity; a complex fluids and surface science challenge for the 21st century. Adv. Colloid Interface Sci. 2007, 134–135, 167–174. 10.1016/j.cis.2007.04.021. [DOI] [PubMed] [Google Scholar]
- Klein J. Probing the interactions of proteins and nanoparticles. Proc. Natl. Acad. Sci. U.S.A 2007, 104, 2029–2030. 10.1073/pnas.0611610104. [DOI] [PMC free article] [PubMed] [Google Scholar]
- Pan H.; Qin M.; Meng W.; Cao Y.; Wang W. How do proteins unfold upon adsorption on nanoparticle surfaces?. Langmuir 2012, 28, 12779–12787. 10.1021/la302258k. [DOI] [PubMed] [Google Scholar]
- Latour R. A. Fundamental principles of the thermodynamics and kinetics of protein adsorption to material surfaces. Colloids Surf., B 2020, 191, 110992. 10.1016/j.colsurfb.2020.110992. [DOI] [PMC free article] [PubMed] [Google Scholar]
- Gagner J. E.; Lopez M. D.; Dordick J. S.; Siegel R. W. Effect of gold nanoparticle morphology on adsorbed protein structure and function. Biomaterials 2011, 32, 7241–7252. 10.1016/j.biomaterials.2011.05.091. [DOI] [PubMed] [Google Scholar]
- Xiao W.; Xiong J.; Zhang S.; Xiong Y.; Zhang H.; Gao H. Influence of ligands property and particle size of gold nanoparticles on the protein adsorption and corresponding targeting ability. Int. J. Pharmacol. 2018, 538, 105–111. 10.1016/j.ijpharm.2018.01.011. [DOI] [PubMed] [Google Scholar]
- Hitchcock D. I. The combination of deaminized gelatin with hydrochloric acid. J. Gen. Physiol. 1923, 6, 95. 10.1085/jgp.6.1.95. [DOI] [PMC free article] [PubMed] [Google Scholar]
- Li T. D.; Tang X. L.; Yang X. D.; Guo H.; Cui Y. Z.; Xu J. Studies on the reaction of allyl glycidyl ether with gelatin by Van Slyke method. Asian J. Chem. 2013, 25, 858–860. 10.14233/ajchem.2013.12945. [DOI] [Google Scholar]
- Liu W.; Tao Y.; Xue R.; Song C.; Wu Q.; Ren Y. Continuous-flow nanoparticle trapping driven by hybrid electrokinetics in microfluidics. Electrophoresis 2020, 42, 939–949. 10.1002/elps.202000110. [DOI] [PubMed] [Google Scholar]
- Liu W.; Tao Y.; Ge Z.; Zhou J.; Xu R.; Ren Y. Pumping of electrolyte with mobile liquid metal droplets driven by continuous electrowetting: a full-scaled simulation study considering surface-coupled electrocapillary two-phase flow. Electrophoresis 2020, 42, 950–966. 10.1002/elps.202000237. [DOI] [PubMed] [Google Scholar]
- Ohsawa K.; Murata M.; Ohshima H. Zeta potential and surface charge density of polystyrene-latex; comparison with synaptic vesicle and brush border membrane vesicle. Colloid Polym. Sci. 1986, 264, 1005–1009. 10.1007/bf01410317. [DOI] [Google Scholar]
- Wertz C. F.; Santore M. M. Adsorption and reorientation kinetics of lysozyme on hydrophobic surfaces. Langmuir 2002, 18, 1190–1199. 10.1021/la0108813. [DOI] [Google Scholar]
- Tie Y.; Calonder C.; Van Tassel P. R. Protein adsorption: Kinetics and history dependence. J. Colloid Interface Sci. 2003, 268, 1–11. 10.1016/s0021-9797(03)00516-2. [DOI] [PubMed] [Google Scholar]
- Dyawanapelly S.; Mehrotra P.; Ghosh G.; Jagtap D. D.; Dandekar P.; Jain R. How the surface functionalized nanoparticles affect conformation and activity of proteins: Exploring through protein-nanoparticle interactions. Bioorg. Chem. 2019, 82, 17–25. 10.1016/j.bioorg.2018.09.020. [DOI] [PubMed] [Google Scholar]
- Vertegel A. A.; Siegel R. W.; Dordick J. S. Silica nanoparticle size influences the structure and enzymatic activity of adsorbed lysozyme. Langmuir 2004, 20, 6800–6807. 10.1021/la0497200. [DOI] [PubMed] [Google Scholar]
- Jain S.; Goossens J. G. P.; Peters G. W. M.; van Duin M.; Lemstra P. J. Strong decrease in viscosity of nanoparticle-filled polymer melts through selective adsorption. Soft Matter 2008, 4, 1848–1854. 10.1039/b802905a. [DOI] [Google Scholar]
- Xu J.; Xu Z.; Qiao C.-D.; Li T.-D. Effect of anionic surfactants on grafting density of gelatin modified with PDMS-E. Colloids Surf., B 2014, 114, 310–315. 10.1016/j.colsurfb.2013.09.014. [DOI] [PubMed] [Google Scholar]
- Xu J.; Xia Y.; Qiao C.-D.; Zhu W.; Wang Y.; Li T.-D. Solid-state structure of gelatin-mono epoxy terminated polydimethylsiloxane polymer: Effect of electrostatic and hydrophobic interactions. Colloids Surf., B 2014, 123, 945–950. 10.1016/j.colsurfb.2014.10.055. [DOI] [PubMed] [Google Scholar]
- Khadak A.; Subeshan B.; Asmatulu R. Studies on de-icing and anti-icing of carbon fiber-reinforced composites for aircraft surfaces using commercial multifunctional permanent superhydrophobic coatings. J. Mater. Sci. 2021, 56, 3078–3094. 10.1007/s10853-020-05459-9. [DOI] [Google Scholar]
- Elzaabalawy A.; Meguid S. A. Development of novel superhydrophobic coatings using siloxane-modified epoxy nanocomposites. Chem. Eng. J. 2020, 398, 125403. 10.1016/j.cej.2020.125403. [DOI] [Google Scholar]
- Pan Y.; Liu L.; Zhao H. Recyclable flame retardant paper made from layer-by-layer assembly of zinc coordinated multi-layered coatings. Cellulose 2018, 25, 5309–5321. 10.1007/s10570-018-1922-0. [DOI] [Google Scholar]
Associated Data
This section collects any data citations, data availability statements, or supplementary materials included in this article.