

Abstract
Background
Non-traditional risk factors like inflammation and oxidative stress play an essential role in the increased cardiovascular disease (CVD) risk prevalent in chronic kidney disease (CKD). Tryptophan catabolism by the kynurenine pathway (KP) is linked to systemic inflammation and CVD in the general and dialysis population. However, the relationship of KP to incident CVD in the CKD population is unknown.
Methods
We measured tryptophan metabolites using targeted mass spectrometry in 92 patients with a history of CVD (old CVD); 46 patients with no history of CVD and new CVD during follow-up (no CVD); and 46 patients with no CVD history who developed CVD in the median follow-up period of 2 years (incident CVD).
Results
The three groups are well-matched in age, gender, race, diabetes status and CKD stage, and only differed in total cholesterol and proteinuria. Tryptophan and kynurenine levels significantly decreased in patients with ‘Incident CVD’ compared with the no CVD or old CVD groups (P = 5.2E–7; P = 0.003 respectively). Kynurenic acid, 3-hydroxykynurenine and kynurenine are all increased with worsening CKD stage (P < 0.05). An increase in tryptophan levels at baseline was associated with 0.32-fold lower odds of incident CVD (P = 0.000014) compared with the no CVD group even after adjustment for classic CVD risk factors. Addition of tryptophan and kynurenine levels to the receiver operating curve constructed from discriminant analysis predicting incident CVD using baseline clinical variables increased the area under the curve from 0.76 to 0.82 (P = 0.04).
Conclusions
In summary, our study demonstrates that low tryptophan levels are associated with incident CVD in CKD.
Keywords: indoleamine dioxygenase, inflammation, kynurenine, metabolomics
INTRODUCTION
Chronic kidney disease (CKD) is prevalent in 15% of the US population, contributing to an excess of 114 billion dollars in Medicare expenditure in 2018 [1]. Cardiovascular disease (CVD) remains the primary cause of mortality and morbidity in the CKD population as the cardiovascular risk in the CKD population is 10- to 40-fold higher than that of the general population [2]. This CVD burden triggers increased hospitalization and healthcare costs [3]. Mitigating the traditional risk factors in CKD still leaves a very high residual risk of CVD, suggesting alternate mechanisms are in play [4]. Nontraditional risk factors unique to CKD like inflammation, oxidative stress, endothelial dysfunction, uremia, bone mineral disease and volume overload likely contribute to the remaining risk [4, 5].
Catabolism of the essential alpha-amino acid tryptophan via the kynurenine pathway (KP) contributes to systemic inflammation and is associated with both CVD and CKD [6]. Under normal physiologic conditions, KP exists mainly in the liver and is responsible for ∼90% of overall tryptophan degradation. With immune activation and inflammation, the contribution from the extrahepatic KP increases [7]. The KP creates many active metabolites such as neuroactive kynurenine; immunosuppressive kynurenine metabolites 3-hydroxykynurenine and 3-hydroxyanthranilic acid; and N-methyl-d-aspartate receptor modulators quinolinic acid, kynurenic acid and anthranilic acid that eventually produce vitamin B3, picolinic acid and redox cofactor nicotinamide adenine dinucleotide phosphate (Figure 1) [8]. The extrahepatic KP exists in macrophages and other immune cells but does not include all enzymes of the pathway, as a result producing different KP metabolite profiles and their corresponding functional changes [8].
FIGURE 1.
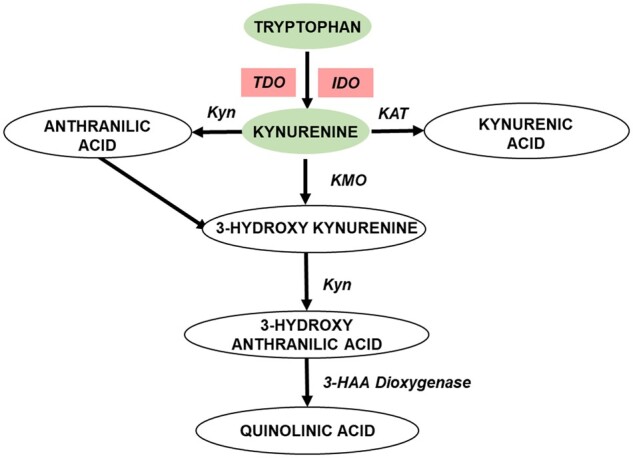
Tryptophan metabolites are altered in early CVD in CKD. Tryptophan catabolism to kynurenine and other downstream metabolites represented in oval shapes; enzymes in this pathway: tryptamine dioxygenase (TDO); IDO1, kynureninase (Kyn); kynurenine aminotransferase (KAT); kynurenine monooxygenase (KMO); 3-hydroxyanthranilic acid dioxygenase (3-HAA dioxygenase); metabolites that are decreased in the new-onset CVD are represented in green ovals and enzymes that potentially altered are represented in red boxes. (Adapted from Figure 1 in Badawy et al. [7].)
The first rate-limiting step of the KP is the production of kynurenine from tryptophan by the enzyme tryptophan dioxygenase and indoleamine dioxygenase 1 (IDO1) in the liver and extra-hepatic tissues, respectively. The overexpression of IDO1 increases plasma kynurenine to tryptophan ratio (KTR) and is associated with inflammation and other traditional cardiovascular risk factors like dyslipidemia and obesity [9, 10]. IDO1 expression is upregulated in the macrophage-loaded core of human atherosclerotic plaques contributing to an upregulated KP pathway in lesions [11]. IDO1 activity (via the KTR) associates with subclinical markers of early atherosclerosis like increased carotid artery intimal media thickness (CIMT) [12]. In addition to the link between early atherosclerosis and tryptophan catabolism, low tryptophan plasma concentration and a high KTR are characteristic of individuals suffering from coronary heart disease [13]. Moreover, a high KTR is a sensitive indicator of future coronary events for older individuals with no history of coronary artery disease [14]. Therefore, the KP pathway activation is linked to inflammation, dyslipidemia, subclinical atherosclerosis and CVD, and able to predict future critical coronary events [15].
IDO1 activity is increased in CKD even as metabolites of tryptophan catabolism accumulate with progressive renal disease [16, 17]. The kynurenine metabolites are associated with markers of oxidative stress and inflammation in patients with CVD and end-stage renal disease (ESRD) [18]. KTR and other kynurenine metabolites are increased in dialysis patients and associated with subclinical markers of atherosclerosis like CIMT [6, 18–20]. Tryptophan metabolites are also linked to the elevated hypercoagulability markers, soluble adhesion molecules and systemic inflammation in the CKD population with evidence of atherosclerosis [21]. However, the role of KP and IDO1 activity and their ability to predict incident CVD in CKD patients remains unknown. Therefore, we hypothesized that altered KP pathway is associated with incident events in patients with no past history of CVD in CKD patients irrespective of their altered levels with renal dysfunction. We used three groups of CKD patients with various degrees of CVD: patients with no history of CVD, patients with a history of CVD and patients with no history of CVD who developed new CVD during follow-up. We measured the metabolites of the KP pathway using state of the art and highly sensitive liquid chromatography (LC) and mass spectrometry (LCMS) platform at baseline. We find that tryptophan and its metabolite kynurenine are both decreased in CKD patients with incident CVD when compared with patients with no history of CVD and prior history of CVD. Reduced levels of tryptophan associate with incident CVD when adjusted for traditional risk factors of CVD. These findings suggest a role for low tryptophan levels and altered KP in early CVD in the CKD population.
MATERIALS AND METHODS
Study cohort
The subjects included 184 subjects recruited between March 2009 and April 2017 into the Clinical Phenotyping Resource and Biobank Core (CPROBE)—a prospective, multicenter, observational cohort with a well-maintained biorepository [22]. By study design, the CPROBE patients returned for yearly visits, lab studies and medical history updates after the initial study visit. Median follow-up was 2 years with a range of 1–10 years. Inclusion criteria for this study included age >18 years and Stages 1–5 CKD [according to the CKD Epidemiology Collaboration creatinine equation (CKD-EPI)]. CVD outcome is defined as myocardial infarction, angina, coronary artery bypass grafting or angioplasty/stenting of a coronary artery, stroke, peripheral arterial disease, congestive heart failure or arrhythmia self-reported by patients and confirmed with electronic health record or by International Classification of Diseases-9 (ICD-9) code review at CPROBE and non-CPROBE sites. The participants were classified into three groups—no CVD, old CVD and incident CVD. The group with no CVD was defined as 46 participants without any self-reported history of CVD at baseline and during the follow-up period. The old CVD group included 92 patients with a positive history of CVD at baseline. The incident CVD group consists of 46 patients with no prior history of CVD at baseline and with new CVD reported during the follow-up period. These three groups were a priori matched for age, gender, race, CKD stage and diabetes status. We used the baseline clinical data, laboratory data and plasma samples collected at the time of enrollment for subsequent analyses. Creatinine was measured on an ADVIA® 2400 analyzer using Jaffe reaction, and estimated glomerular filtration rate (eGFR) was calculated with the CKD-EPI formula.
Quantitative tryptophan metabolite estimation with mass spectrometry
We quantified the downstream metabolites of the KP: tryptophan, kynurenine, 3-hydroxykynurenine, kynurenic acid, anthranilic acid, 3-hydroxyanthranilic acid and quinolinic acid using a targeted LCMS platform. Tryptophan 15N2, kynurenic acid D5 and anthranilic acid 13C6 and all authentic standards were purchased from Sigma Aldrich. Plasma (50 μL) was extracted with 200 µL chilled acetonitrile spiked with internal standards, vortexed and centrifuged. The supernatant was transferred to glass vials that were dried under nitrogen. The dried samples were reconstituted in 50 µL of water with 0.1% formic acid (FA). The samples are then analyzed with Agilent 6490 QQQ mass spectrometer with a 1290 Agilent LC machine attached. LC parameters included Waters Acuity HSS T3 column, 2.1 mm × 50 mm; mobile phase A: water with 0.1% FA and mobile phase B: acetonitrile with 0.1% FA; gradient: 0 min, 100% A; 12 min, 60% A, 17 min, 5% A, 17.1–19 min, 100% A, flow rate: 0.375 mL/min. Mass spectrometry parameters include electron spray ionization in positive mode, 275°C, N2 collision gas, dwell 25 V and fragmentor 380 V. The following Multiple Reaction Monitoring transitions were followed: Tryptophan m/z 205.1 to m/z 118 and 146; kynurenine m/z 209.1 to m/z 192.1; 3-hydroxykynurenine m/z 225.1 to m/z 161.9; kynurenic acid m/z 190.1 to m/z 144.1; anthranilic acid m/z 138.1 to m/z 120; 3-hydroxyanthranilic acid m/z 154.1 to m/z 80; quinolinic acid m/z 168 to m/z 78; internal standards—Tryptophan15N2m/z 207.1 to m/z 147; 119; kynurenic acid D5m/z 195 to m/z 149.1; and anthranilic acid 13C6m/z 144.1 to m/z 126.1. The coefficients of variation of metabolites—tryptophan, kynurenine, kynurenine acid, 3-hydroxyl kynurenine, anthranilic acid, 3-hydroxyl anthranilic acid and quinolinic acid—were 4.3, 7.7, 5.5, 1.5, 9.2, 3.8 and 1.6%, respectively.
Statistical analysis
Normal distribution of continuous variables was verified using the univariate Kolmogorov–Smirnov test. All normally distributed variables were represented as mean ± standard deviation (SD), and the rest were represented as median and interquartile range and log-transformed before parametric tests were applied. We used analysis of variance (ANOVA) with the Dunnett correction for multiple comparisons to compare the means of normally distributed baseline continuous clinical variables with a reference category in three groups. To test the association of categorical variables by the CVD group or by CKD stages, we used Chi-square analysis. To identify whether the concentration of a metabolite differed significantly by study groups and CKD stages, we used ANOVA with post hoc Bonferroni correction with a significance threshold of P < 0.00714 (0.05/7). To test the correlation between urine protein creatinine ratio and KP metabolites, we use both Pearson and Spearman correlations.
We applied multinomial logistic regression models aimed at evaluating the independence of the top differentially regulated metabolites and estimating the risk associated with their varying levels. We applied different models with varying degrees of adjustments, including unadjusted top differentially regulated metabolites—tryptophan (Model 1) and kynurenine (Model 2)—adjusted by metabolites that have passed the statistical threshold (Model 3), adjusted by components of Model 3 plus clinical variables that differed between the three groups: urine protein creatinine ratio, total cholesterol and use of diuretics and β-blockers (Model 4), and fully adjusted Model 5 comprised of components of Model 4 plus age, gender, race, smoking status, diabetes, systolic blood pressure, use of statins, serum albumin, C-reactive protein and eGFR. We applied the z-score standardized values of the differentially regulated metabolites in the logistic regression models.
We then calculated probabilities of CVD group membership by discriminant analysis [23] using models consisting of the baseline clinical variables with and without the top differentially regulated metabolites. The baseline clinical variables included age, gender, race, smoking status, diabetes, systolic blood pressure, serum albumin, C-reactive protein, total cholesterol, log-transformed urine protein creatinine ratio and use of statins, diuretics and β-blockers. We then constructed the Receiver Operator Characteristics (ROC) curves and compared the c-statistics using the scores of the probabilistic models made above. The P-value difference between the two ROC curves was calculated using the DeLong method [24]. SPSS version 25 (Armonk, NY, USA), GraphPad Prism (San Diego, CA, USA) and STATA version 10 (College Station, TX, USA) were applied for the analysis and generation of the figures.
RESULTS
Baseline characteristics of the three CVD groups
We examined the distribution of baseline demographic characteristics, medications and comorbidities in the three groups (Table 1). The three groups of CVD patients were matched by age, gender, race, diabetes status and CKD stage by design. The patients also did not differ in body weight, blood pressure, high-density lipoprotein and triglycerides. Distribution of total cholesterol, serum albumin, C-reactive protein, urine protein creatinine and use of diuretic and β-blocker was different by CVD group (P < 0.05), indicating that the incident CVD group had higher mean cholesterol, C-reactive protein, proteinuria and percentage of diuretic and β-blocker use compared with other groups. Meanwhile, the incident CVD group had lower serum albumin at baseline.
Table 1.
Baseline demographics and lab characteristics of the three CVD groups
| Variables | No CVD | Old CVD | Incident CVD | P-value |
|---|---|---|---|---|
| n | 46 | 92 | 46 | |
| Age, years | 55.3 ± 12.1 | 57.1 ± 12.8 | 54.2 ± 12.5 | 0.421 |
| Female, % | 31 (32.6) | 63 (31.5) | 31 (32.6) | 0.988 |
| Race, % | 0.735 | |||
| Black | 10 (21.7) | 27 (29.4) | 10 (21.7) | |
| White | 31 (67.4) | 58 (63.0) | 33 (71.8) | |
| Others | 5 (10.9) | 7 (7.6) | 3 (6.5) | |
| Diabetes | 16 (34.8) | 34 (37.0) | 16 (34.8) | 0.954 |
| Weight, kg | 90.0 ± 25.2 | 90.4 ± 25.4 | 64.6 ± 25.4 | 0.599 |
| BMI, kg/m2 | 32.5 ± 8.3 | 32.0 ± 8.4 | 33.4 ± 7.6 | 0.652 |
| Systolic BP, mmHg | 132 ± 18 | 139 ± 23 | 134 ± 19 | 0.19 |
| Diastolic BP, mmHg | 72 ± 12 | 75 ± 12 | 75 ± 14 | 0.302 |
| Total cholesterol, mg/dL | 185 ± 38 | 168 ± 51 | 197 ± 58 | 0.005 |
| HDL, mg/dL | 48 ± 13 | 45 ± 15 | 45 ± 13 | 0.365 |
| Triglycerides, mg/dL | 193 ± 124 | 171 ± 123 | 216 ± 127 | 0.134 |
| Current smokers, % | 5 (10.9) | 16 (17.4) | 7 (15.2) | 0.603 |
| Serum albumin, g/dL | 4.03 ± 0.5 | 3.68 ± 0.7 | 3.92 ± 0.5 | 0.012 |
| C-reactive protein, mg/dLa | 0.32 (0.08–0.62) | 0.45 (0.15–1.30) | 0.41 (0.20–0.94) | 0.017 |
| Serum creatinine, mg/dL | 1.57 ± 0.77 | 1.57 ± 0.75 | 1.75 ± 0.90 | 0.438 |
| eGFR, mL/min | 54 ± 29 | 52 ± 26 | 53 ± 32 | 0.945 |
| UPC, g/g creatinine | 0.39 (0.16–1.09) | 0.4 (0.1–1.85) | 2.69 (0.4–5.64) | 0.003 |
| Medications(%) | ||||
| Statin | 26 (56.5) | 53 (57.6) | 18 (39.1) | 0.102 |
| Diuretic | 16 (34.8) | 54 (58.7) | 29 (63.0) | 0.01 |
| Calcium channel blocker | 18 (39.1) | 30 (32.6) | 16 (34.8) | 0.75 |
| β-blockers | 15 (32.6) | 53 (57.6) | 19 (41.3) | 0.014 |
| ACEI/ARB/RB | 33 (71.7) | 55 (59.8) | 32 (69.6) | 0.295 |
| Other BP medication | 8 (17.4) | 29 (31.5) | 9 (19.6) | 0.121 |
| CKD stage, % | 0.111 | |||
| Stage 1 | 9(19.6) | 11 (12.0) | 9 (19.6) | |
| Stage 2 | 6 (13.0) | 15 (16.3) | 7 (15.2) | |
| Stage 3 | 21 (45.7) | 48 (52.2) | 12 (26.1) | |
| Stage 4 | 9 (19.6) | 17 (18.5) | 15 (32.6) | |
| Stage 5 | 1 (2.2) | 1 (1.1) | 3 (6.5) | |
| Tryptophan metabolites, μM | ||||
| Tryptophan | 76.2 ± 25.8 | 74.6 ± 24.7 | 51.5 ± 24.1b | 5.20E-07 |
| Kynurenine | 5.2 ± 2.5 | 5.1 ± 2.2 | 3.8 ± 2.1b | 0.003 |
| Quinolinic acida | 0.24 (0.21–0.26) | 0.22 (0.21–0.25) | 0.23 (0.21–0.26) | 0.33 |
| Kynurenine to tryptophan ratio | 0.07 ± 0.04 | 0.08 ± 0.04 | 0.07 ± 0.04 | 0.356 |
| Hydroxykynurenine, nM | 95.7 ± 30.4 | 104.1 ± 37.2 | 101.2 ± 40.2 | 0.458 |
| Kynurenic acid, nMa | 0.8 (0.3–1.7) | 0.8 (0.4–1.8) | 0.7 (0.2–1.8) | 0.77 |
| Anthranilic acid, μM | 0.27 ± 0.02 | 0.28 ± 0.03 | 0.27 ± 0.02 | 0.791 |
| 3-hydroxyanthranilic acid, nM | 67.0 ± 75.6 | 73.9 ± 69.0 | 67.6 ± 60.5 | 0.808 |
Values are mean and SD or counts and relative frequency.
UPC, C-reactive protein, quinolinic acid and kynureninc acid are presented as median and interquartile range.
Compared with other CVD groups.
BMI, body mass index; BP, blood pressure; HDL, high-density lipoprotein; UPC, urine protein creatinine ratio; ACEI, angiotensin-converting enzyme inhibitor; ARB, angiotensin receptor blocker; RB, renin blocker.
Examining the three CVD groups based on their CKD stage in three groups—CKD Stages 1 and 2, CKD Stage 3, and CKD Stages 4 and 5, the groups did not differ in demographics and lab characteristics (Table 2). The three groups differ only in the use of statins, calcium channel blockers and β-blockers. The three CVD groups are well represented across the three CKD groups.
Table 2.
Baseline demographics and lab characteristics by CKD status
| Variables | CKD 1–2 | CKD 3 | CKD 4–5 | P-value |
|---|---|---|---|---|
| n | 57 | 81 | 46 | |
| Age, years | 48.2 ± 11.9 | 58.9 ± 11.2 | 60.1 ± 11.6 | <0.001 |
| Female, % | 41 (71.9) | 54 (66.7) | 30 (65.2) | 0.729 |
| Race, % | ||||
| Black | 13 (22.8) | 23 (28.4) | 11 (23.9) | 0.878 |
| White | 38 (66.7) | 52 (64.2) | 32 (69.6) | |
| Others | 6 (10.5) | 6 (7.4) | 3 (6.5) | |
| Diabetes, % | 12 (21.1) | 33 (40.7) | 21 (45.7) | 0.017 |
| Weight, kg | 90.0 ± 24.4 | 92.9 ± 24.8 | 90.0 ± 27.6 | 0.749 |
| BMI, kg/m2 | 32.1 ± 8.0 | 33.2 ± 8.1 | 31.8 ± 8.6 | 0.587 |
| Systolic BP, mmHg | 132 ± 19 | 139 ± 23 | 136 ± 20 | 0.139 |
| Diastolic, mmHg | 77 ± 15 | 74 ± 10 | 72 ± 13 | 0.153 |
| Total cholesterol, mg/dL | 189 ± 48 | 179 ± 55 | 166 ± 46 | 0.068 |
| HDL, mg/dL | 47 ± 12 | 46 ± 15 | 44 ± 15 | 0.511 |
| Triglycerides, mg/dL | 214 ± 163 | 186 ± 113 | 159 ± 78 | 0.081 |
| Current smokers, % | 7 (12.3) | 12 (14.8) | 9 (19.6) | 0.587 |
| Serum albumin, g/dL | 3.79 ± 0.7 | 3.93 ± 0.6 | 3.92 ± 0.5 | 0.345 |
| C-reactive protein, mg/dLa | 0.40 (0.2–1.1) | 0.44 (0.2–0.96) | 0.29 (0.1–0.7) | 0.244 |
| Serum creatinine, mg/dL | 0.88 ± 0.20 | 1.52 ± 0.29 | 2.69 ± 0.69 | <0.001 |
| eGFR, mL/min | 89 ± 18 | 44 ± 8 | 23 ± 5 | <0.001 |
| UPC, g/g creatininea | 1.05 (0.15–2.87) | 0.40 (0.10–1.69) | 0.87 (0.28–2.92) | 0.155 |
| Medications, % | ||||
| Statin | 19 (33.3) | 50 (61.7) | 28 (60.9) | 0.002 |
| Diuretic | 25 (43.9) | 48 (59.3) | 26 (56.5) | 0.185 |
| Calcium channel blocker | 7 (12.3) | 38 (46.9) | 19 (41.3) | <0.001 |
| β-blockers | 9 (15.8) | 49 (60.5) | 29 (63.0) | <0.001 |
| ACEI/ARB/RB | 39 (68.4) | 55 (67.9) | 26 (56.5) | 0.359 |
| Other BP medication | 9 (15.8) | 26 (32.1) | 11 (23.9) | 0.091 |
| CVD group | ||||
| Never | 15 (26.3) | 21 (25.9) | 10 (21.7) | 0.037 |
| New | 16 (28.1) | 12 (14.8) | 18 (39.1) | |
| Old | 14 (45.6) | 21 (59.3) | 11 (39.1) | |
| Tryptophan metabolites | ||||
| Kynurenic acid, nMa | 0.27 (0.03–0.44) | 0.88 (0.49–1.60) | 1.92 (1.36–3.05) | 1E-17 |
| Kynurenine to tryptophan ratio | 0.06 ± 0.03 | 0.08 ± 0.03 | 0.09 ± 0.04 | 5E-08 |
| Hydroxykynurenine, nM | 86.0 ± 31.0 | 98.9 ± 35.9 | 124.2 ± 36.0b | 4E-07 |
| Kynurenine, μM | 3.9 ± 2.1 | 5.1 ± 2.1b | 5.6 ± 2.3 b | 1E-05 |
| Anthranilic acid, μM | 0.27 ± 0.02 | 0.27 ± 0.02 | 0.29 ± 0.02b | 0.001 |
| 3-hydroxyanthranilic acid, nM | 57.2 ± 45.6 | 70.5 ± 70.7 | 87.5 ± 84.3 | 0.081 |
| Quinolic acid, μMa | 0.21 (0.21–0.25) | 0.23 (0.21–0.26) | 0.23 (0.21–0.26) | 0.055 |
| Tryptophan, μM | 69.5 ± 27.3 | 71.4 ± 27.6 | 65.2 ± 24.5 | 0.455 |
Values are a mean and SD or counts and relative frequency.
UPC, C-reactive protein, kynurenic acid and quinolinic acid are presented as median and interquartile range.
Compared with other CVD groups.
BMI, body mass index; BP, blood pressure; HDL, high-density lipoprotein; UPC, urine protein creatinine ratio; ACEI, angiotensin-converting enzyme inhibitor; ARB, angiotensin receptor blocker; RB, renin blocker.
Tryptophan metabolites differ between the three CVD and CKD groups
When comparing the metabolites by CVD status, both tryptophan and kynurenine levels were significantly lower in patients with incident CVD compared with patients with no history of CVD and history of CVD (Table 1 and Figure 2). Kynurenic acid, 3-hydroxykynurenine, kynurenine and KTR are all increased with worsening CKD stage (Table 2 and Figure 3). The other metabolites anthranilic acid and 3-hydroxyanthranilic acid showed similar trends of increase with worsening renal function though the alterations did not reach the statistical threshold.
FIGURE 2.

Tryptophan metabolites by cardiovascular groups. Tryptophan metabolites that are altered by the cardiovascular group are represented as box plots that represent median and interquartile range. The error bars represent the 5–95% range. (A) Tryptophan and (B) kynurenine.
FIGURE 3.

Tryptophan metabolites altered by CKD stage. Tryptophan metabolites that are elevated with increasing CKD stage are represented as bar plots that represent median and interquartile range. The error bars represent the 5–95% range. (A) Kynurenic acid, (B) hydroxykynurenine and (C) kynurenine.
Tryptophan metabolites associate with new CVD events
When multinominal logistic regression models were constructed with tryptophan as the independent variable, each 1 SD increase in tryptophan was associated with 0.32-fold lower odds of incident CVD [95% confidence interval (CI) 0.20–0.54; P = 0.000014] compared with the no CVD group (Figure 4). Increasing the level of adjustment from minimally adjustment in Model 3 to full adjustment in Model 5 (included age, gender, race, diabetes, smoking status, use of statin, diuretic and β-blocker, total cholesterol, serum albumin, C-reactive protein, eGFR and proteinuria) did not alter the direction or significance of tryptophan. However, after adjusting for tryptophan, kynurenine was not independently associated with incident CVD. The c-statistic from the ROC curves constructed by the baseline clinical variables had an area under the curve of 0.766, compared with 0.823 when tryptophan and kynurenine were added (P = 0.0482; Figure 5). The addition of KP metabolites—tryptophan and kynurenine—to base clinical variables improved the ability to predict incident CVD. The ability of eGFR and proteinuria to independently predict incident CVD and the correlation of KP metabolites and urine protein to creatinine ratio are represented in Supplementary data, Tables S1 and S2, respectively.
FIGURE 4.

Forest plot representing the relative risk of CVD. Forest plot describes multinomial logistic regression models with dots representing the odds ratio and the error bars representing 95% CI. The odds ratios of incident and old CVD groups compared with the no CVD group (reference) are represented for each model. Model 1 includes unadjusted tryptophan; Model 2 includes unadjusted kynurenine; Model 3 is tryptophan adjusted by kynurenine (kynure); Model 4 includes tryptophan adjusted by kynurenine, total cholesterol, urine protein creatinine ratio and the use of β-blockers and diuretic use; Model 5 includes the tryptophan fully adjusted for kynurenine, age, gender, race, smoking status, body mass index, systolic blood pressure, total cholesterol, serum albumin, serum C-reactive protein, eGFR, urine protein creatinine ratio and use of statins, β-blockers and diuretics.
FIGURE 5.
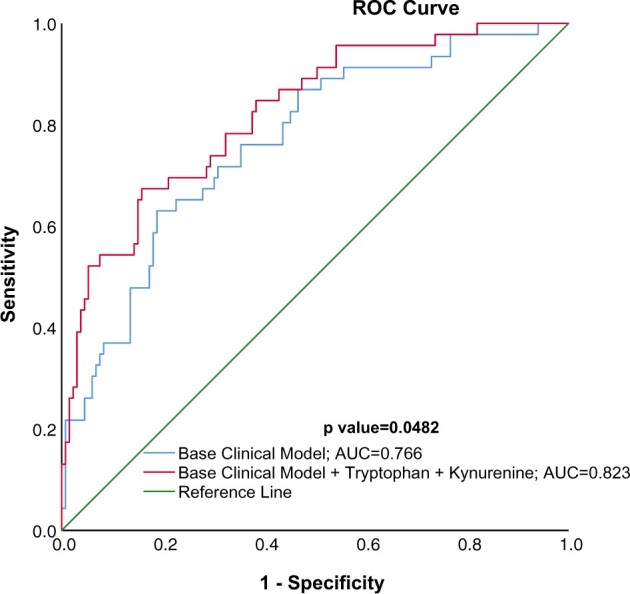
ROC curve prediction of new CVD in CKD patients. ROC curve using probabilities of group membership in incident cardiovascular group using discriminant analysis controlling for base clinical model including age, gender, race, smoking status, body mass index, systolic blood pressure, serum albumin, serum C-reactive protein, eGFR, total cholesterol, urine protein creatinine ratio and use of statins, β-blockers and diuretics results in an area under the curve (AUC) of 0.766 and addition of tryptophan (TRYP) and kynurenine (KYN) to the base clinical model increases the AUC to 0.823 (P = 0.0482).
DISCUSSION
Our study is the first to delineate the role of the KP pathway in incident CVD in a CKD cohort. We used a highly sensitive and specific targeted LCMS platform to comprehensively capture the entire metabolome of tryptophan catabolism via the KP. Our data demonstrate that despite impaired clearance in CKD, incident CVD is associated with low tryptophan and kynurenine levels. The decreased tryptophan levels at baseline were able to predict incident CVD after adjustment for traditional clinical risk factors, suggesting a role for tryptophan catabolism in the development of early CVD in CKD.
Recent studies have emphasized the role of inflammation in atherosclerotic disease independent of other traditional risk factors [25]. Extensive epidemiological studies with long follow-ups report a strong correlation between tryptophan, kynurenine and 3-hydroxykynurenine and cardiovascular mortality in the general population [26]. Increased KTR is related to CIMT and classic risk factors of atherosclerosis, suggesting a role for immune regulation in early atherosclerosis [10, 12]. Smaller studies on patients with confirmed coronary artery disease confirm the inflammation and immune activation associated with the upregulation of the KP compared with healthy controls [13]. In patients with stable coronary disease, increased urinary and circulating KTR were both associated with mortality and significant coronary event at follow-up [15, 27, 28]. In addition to future events, high KTR is also related to initial stroke severity at admission and subsequent long-term stroke outcomes [29]. Therefore, high KTR and upregulation of KP are related to early, atherosclerotic disease in addition to its ability to predict future CVD outcomes and mortality.
IDO1 is a heme enzyme that plays an immunomodulatory role in macrophages, T cells, epithelial cells and dendritic cells [8]. Cytokine interferon-γ (IFN-γ) induces IDO1 both by signal transducer and activator of transcription 1α and interferon regulatory factor-1 [30], whereas lipopolysaccharide induces IDO1 in a non-IFN-γ-dependent manner by Nuclear Factor Kappa-light-chain-enhancer of activated B cells and Mitogen-activated protein kinase pathways [31]. Human atherosclerotic lesions show marked upregulation of IDO1 protein and gene expression, and upregulation of IDO1-related genes and gene-enriched pathways [11]. Increased KP activation in human coronary plaques also associates with tissue factor expression in activated macrophages in patients with unstable angina [32]. IDO1 deficiency in mouse atherosclerosis models causes an increase in serum lipids, especially triglycerides [33]. Cole et al. demonstrated that whole-body IDO1 deficiency and IDO1 inhibition with methyl tryptophan both increased atherosclerosis, vascular inflammation and plaque vulnerability in ApoE knock-out mice [34, 35], whereas administration of the anti-inflammatory and anti-oxidative tryptophan catabolite 3-hydroxy-anthranilic acid in these models facilitated a significant decrease in aortic lesions and overall plasma cholesterol and triglyceride levels [36]. However, IDO1-dependent interleukin (IL)-10 inhibition via KP exacerbates atherosclerosis in mice [37]. In addition to the demonstrated effects on atherosclerosis, kynurenine and KTR are related to vascular tone, as kynurenine is a known vasodilator [38]. Therefore, modulation of IDO1 activity and KP pathway directly affects the lipid profile and atherosclerotic lesions in animal models.
Hyperuricemia increases circulating tryptophan metabolites by hampering renal tubular transporters multidrug resistance protein-4, breast cancer resistance protein and organic anion transporter-1 [39, 40]. Kynurenine and KTR were all increased in CKD patients when compared with controls and also associate with CKD severity [17]. Dialysis does not remove these metabolites altogether and does not alter IDO1 activity [16]. However, plasma levels of tryptophan were lower in ESRD patients compared with healthy controls and inversely associated with worsening CKD stages, while the other KP metabolites increased with renal dysfunction [18, 41]. In uremic rats, tryptophan levels are decreased, and other KP metabolites were increased after nephrectomy [42], whereas IDO1 activity remains unchanged in the kidney [42, 43]. Worsening renal function is characterized by increased cytokines like IL-6, tumor necrosis factor-α (TNF-α), IL-1β and C-reactive protein. IDO1 activity correlates with markers of systemic inflammation—neopterin levels, TNF-α, TNF-α receptor-1, IL-6 and C-reactive protein—in CKD and dialysis patients [41, 44]. Similarly, fibrinogen and KP metabolites are associated with hypercoagulability in dialyzed patients [45].
Inflammatory markers—C-reactive protein, TNF-α, IL-6, serum albumin and soluble TNF-α receptor 1—and oxidative stress markers like copper/zinc superoxide dismutase, malondialdehyde and total peroxide were all positively associated with KP metabolites and CVD in CKD and ESRD [16, 18, 20, 46]. Furthermore, many markers of endothelial dysfunction such as von Willebrand factor, thrombomodulin and soluble adhesion molecules—soluble intercellular adhesion molecule-1, soluble vascular adhesion molecule-1, soluble E-selectin and soluble P-selectin—are similarly associated with the kynurenines and CVD in CKD patients [6, 21]. 3-Hydroxyanthranilic acid levels in CKD are associated with the CC-chemokine family, which are markers of macrophage inflammation in atherosclerotic lesions like monocyte chemoattractant protein 1 or Chemokine (C-C motif) ligand 2, macrophage inflammatory protein-1 α and beta (CCL3 and 4) [47]. More specifically, quinolinic acid and 3-hydroxykynurenine levels are both associated with increased CIMT in ESRD and CKD [6, 18, 20]. Our study confirms these findings by demonstrating evidence of KP activation in patients with no history of CVD who develop CVD shortly into follow-up. This KP flux is not present in established CVD or in perhaps patients with more quiescent disease.
Static metabolite pools are a combination of generation, downstream enzyme activity and excretion. KTR and kynurenine metabolites are elevated with increasing CKD stage in experimental CKD models as a result of both increased synthesis and impaired clearance [42]. Ninety percent of tryptophan intake not used in protein synthesis is metabolized by the KP, 1–2% is synthesized to serotonin, and only about 4–6% of tryptophan is consumed by microbiota to produce tryptamine and various indole derivatives like indoxyl sulfate [48]. Indoxyl sulfate and Indole-3-acetic acid are both independently linked to CVD in CKD patients, and multiple factors, including protein intake, tryptophan levels and inflammation, influence indoxyl sulfate levels [49]. We are limited by the lack of simultaneous measurement of indole derivatives, but increased microbial tryptophan consumption to produce indole metabolite could be one possible explanation for the association of decreased tryptophan levels to incident CVD in the CKD population. In our study, the low levels of tryptophan and kynurenine in the incident CVD group despite similar renal function compared to the other CVD groups could indicate altered downstream flux into the KP pathway. The real dynamic metabolite flux and source of these metabolites in plasma can only be delineated by labeled tracer in vivo flux in experimental models.
Our study has several limitations, including the small size and the absence of cytokine and indole derivative profiling. We also lack cardiovascular testing suggesting subclinical disease that could have confirmed the role of altered KP metabolism in early pathogenesis of atherosclerotic disease in CKD. All the CVD outcomes in our study are self-reported and confirmed with review of electronic records and ICD-9 codes. The three CVD groups differed in levels of serum albumin, C-reactive protein, baseline proteinuria and total cholesterol. However, these variables were adjusted for in the regression models. KP metabolites and CVD risk increase with worsening renal function, but in our study within CVD groups of comparable renal function, low tryptophan levels are associated with incident CVD in CKD patients. This could be explained by unaccounted for subclinical comorbidities in the regression models, increased tryptophan consumption either to create indole derivatives that are directly linked to CVD in CKD patients or increased flux into the downstream KP metabolites in the incident CVD group. Urine excretion of these metabolites and specific information about the extrahepatic KP flux in the atherosclerotic lesions would have added more information on the systemic flux of these products. Mechanistic evidence of the role of the KP in the development of atherosclerotic lesions, leading to coronary artery disease, needs to be tested in animal models. A more extensive follow-up study of CKD patients without CVD at baseline but that develop CVD during a more extended follow-up period accompanied by yearly sampling will shed light on the predictive ability of these biomarkers of early atherosclerotic disease.
In conclusion, this study is the first to systematically study the association of KP with cardiovascular outcomes in CKD, thus providing insight into the tryptophan catabolism preceding CVD in this high-risk population. Clinically, as evidenced by the regression models and the ROC curves in our study, altered tryptophan and kynurenine levels associate with incident CVD events. Larger cohorts will be able to confirm the biomarker potential of these metabolites to identify at-risk CKD patients with active CVD. Currently, these findings are associative, and we need to confirm the contribution of this pathway in CKD-associated CVD pathogenesis. Therefore, the KP metabolites have the potential to direct therapy to patients at risk for CVD, and if their causative role is confirmed, could open up therapeutic targets to modulate CVD in CKD patients.
SUPPLEMENTARY DATA
Supplementary data are available at ckj online.
Supplementary Material
ACKNOWLEDGEMENTS
The Michigan Kidney Translational Core CPROBE Investigator Group includes Zeenat Bhat (Wayne State University, Detroit, MI, USA), Matthias Kretzler (University of Michigan), Susan Massengill (Levine Children’s Hospital, Charlotte, NC, USA), Subramaniam Pennathur (University of Michigan) and Kalyani Perumal (JH Stroger Hospital, Chicago, IL, USA). V.C.K. performed the experiments, analyzed the data and revised the article; T.M.R. analyzed the data and revised the article; K.B., C.G. and D.G. designed the CPROBE cohort, recruited the patients and revised the manuscript; F.A. performed the analysis and revised the manuscript; A.V.M. designed and conducted the experiments, analyzed, provided funding, drafted and revised the manuscript. All authors contributed to the intellectual content of the work described in the manuscript and gave final approval of the manuscript.
FUNDING
This work is supported in part by grants from the National Institutes of Health- HL130944 (A.V.M), DK106523, DK121941 (F.A.), DK081943 (The Michigan Kidney Translational Core Center), DK020572 (Michigan Diabetes Research Center), and DK089503 (Michigan Nutrition Obesity Center).
CONFLICT OF INTEREST STATEMENT
None declared. Results presented in this article have not been published previously in whole or part, except in abstract format.
REFERENCES
- 1.USRDS. US Renal Data System 2018Annual data report: Epidemiology of kidney disease in the United States. Bethesda, MD: National Institutes of Health, National Institute of Diabetes and Digestive and Kidney Diseases [DOI] [PMC free article] [PubMed]
- 2. Go AS, Chertow GM, Fan D. et al. Chronic kidney disease and the risks of death, cardiovascular events, and hospitalization. N Engl J Med 2004; 351: 1296–1305 [DOI] [PubMed] [Google Scholar]
- 3. Manns B, Hemmelgarn B, Tonelli M. et al.; for Canadians Seeking Solutions and Innovations to Overcome Chronic Kidney Disease. The cost of care for people with chronic kidney disease. Can J Kidney Health Dis 2019; 6: 205435811983552 [Google Scholar]
- 4. Sarnak MJ, Coronado BE, Greene T. et al. Cardiovascular disease risk factors in chronic renal insufficiency. Clin Nephrol 2002; 57: 327–335 [DOI] [PubMed] [Google Scholar]
- 5. Cachofeiro V, Goicochea M, de Vinuesa SG. et al. Oxidative stress and inflammation, a link between chronic kidney disease and cardiovascular disease. Kidney Int Suppl 2008; 74: S4–S9 [DOI] [PubMed] [Google Scholar]
- 6. Pawlak K, Myśliwiec M, Pawlak D.. Kynurenine pathway—a new link between endothelial dysfunction and carotid atherosclerosis in chronic kidney disease patients. Adv Med Sci 2010; 55: 196–203 [DOI] [PubMed] [Google Scholar]
- 7. Badawy AA. Tryptophan metabolism, disposition and utilization in pregnancy. Biosci Rep 2015; 35: e00261 [DOI] [PMC free article] [PubMed] [Google Scholar]
- 8. Bender DA. Biochemistry of tryptophan in health and disease. Mol Aspects Med 1983; 6: 101–197 [DOI] [PubMed] [Google Scholar]
- 9. Mangge H, Summers KL, Meinitzer A. et al. Obesity-related dysregulation of the tryptophan-kynurenine metabolism: role of age and parameters of the metabolic syndrome. Obesity (Silver Spring) 2014; 22: 195–201 [DOI] [PubMed] [Google Scholar]
- 10. Pertovaara M, Raitala A, Juonala M. et al. Indoleamine 2,3-dioxygenase enzyme activity correlates with risk factors for atherosclerosis: the cardiovascular risk in young Finns study. Clin Exp Immunol 2007; 148: 106–111 [DOI] [PMC free article] [PubMed] [Google Scholar]
- 11. Niinisalo P, Oksala N, Levula M. et al. Activation of indoleamine 2,3-dioxygenase-induced tryptophan degradation in advanced atherosclerotic plaques: Tampere vascular study. Ann Med 2010; 42: 55–63 [DOI] [PubMed] [Google Scholar]
- 12. Niinisalo P, Raitala A, Pertovaara M. et al. Indoleamine 2,3-dioxygenase activity associates with cardiovascular risk factors: the health 2000 study. Scand J Clin Lab Invest 2008; 68: 767–770 [DOI] [PubMed] [Google Scholar]
- 13. Wirleitner B, Rudzite V, Neurauter G. et al. Immune activation and degradation of tryptophan in coronary heart disease. Eur J Clin Invest 2003; 33: 550–554 [DOI] [PubMed] [Google Scholar]
- 14. Sulo G, Vollset SE, Nygard O. et al. Neopterin and kynurenine-tryptophan ratio as predictors of coronary events in older adults, the Hordaland Health Study. Int J Cardiol 2013; 168: 1435–1440 [DOI] [PubMed] [Google Scholar]
- 15. Pedersen ER, Midttun O, Ueland PM. et al. Systemic markers of interferon-gamma-mediated immune activation and long-term prognosis in patients with stable coronary artery disease. Arterioscler Thromb Vasc Biol 2011; 31: 698–704 [DOI] [PubMed] [Google Scholar]
- 16. Schefold JC, Zeden JP, Fotopoulou C. et al. Increased indoleamine 2,3-dioxygenase (IDO) activity and elevated serum levels of tryptophan catabolites in patients with chronic kidney disease: a possible link between chronic inflammation and uraemic symptoms. Nephrol Dial Transplant 2009; 24: 1901–1908 [DOI] [PubMed] [Google Scholar]
- 17. Bao YS, Ji Y, Zhao SL. et al. Serum levels and activity of indoleamine2,3-dioxygenase and tryptophanyl-tRNA synthetase and their association with disease severity in patients with chronic kidney disease. Biomarkers 2013; 18: 379–385 [DOI] [PubMed] [Google Scholar]
- 18. Pawlak K, Domaniewski T, Mysliwiec M. et al. The kynurenines are associated with oxidative stress, inflammation and the prevalence of cardiovascular disease in patients with end-stage renal disease. Atherosclerosis 2009; 204: 309–314 [DOI] [PubMed] [Google Scholar]
- 19. Kato A, Suzuki Y, Suda T. et al. Relationship between an increased serum kynurenine/tryptophan ratio and atherosclerotic parameters in hemodialysis patients. Hemodial Int 2010; 14: 418–424 [DOI] [PubMed] [Google Scholar]
- 20. Pawlak K, Brzosko S, Mysliwiec M. et al. Kynurenine, quinolinic acid–the new factors linked to carotid atherosclerosis in patients with end-stage renal disease. Atherosclerosis 2009; 204: 561–566 [DOI] [PubMed] [Google Scholar]
- 21. Pawlak K, Kowalewska A, Pawlak D. et al. Kynurenine and its metabolites—kynurenic acid and anthranilic acid are associated with soluble endothelial adhesion molecules and oxidative status in patients with chronic kidney disease. Am J Med Sci 2009; 338: 293–300 [DOI] [PubMed] [Google Scholar]
- 22. Afshinnia F, Rajendiran TM, Soni T. et al.; the Michigan Kidney Translational Core CPROBE Investigator Group. Impaired beta-oxidation and altered complex lipid fatty acid partitioning with advancing CKD. J Am Soc Nephrol 2018; 29: 295–306 [DOI] [PMC free article] [PubMed] [Google Scholar]
- 23. Brown MT, Wicker LR.. Discriminant analysis. In Tinsley HEA, Brown SD (eds). Handbook of Applied Multivariate Statistics and Mathematical Modeling. San Diego, CA: Academic Press, 2000, 209–235 [Google Scholar]
- 24. DeLong ER, DeLong DM, Clarke-Pearson DL.. Comparing the areas under two or more correlated receiver operating characteristic curves: a nonparametric approach. Biometrics 1988; 44: 837–845 [PubMed] [Google Scholar]
- 25. Ridker PM, Everett BM, Thuren T. et al. Antiinflammatory therapy with canakinumab for atherosclerotic disease. N Engl J Med 2017; 377: 1119–1131 [DOI] [PubMed] [Google Scholar]
- 26. Zuo H, Ueland PM, Ulvik A. et al. Plasma biomarkers of inflammation, the kynurenine pathway, and risks of all-cause, cancer, and cardiovascular disease mortality: the Hordaland Health Study. Am J Epidemiol 2016; 183: 249–258 [DOI] [PMC free article] [PubMed] [Google Scholar]
- 27. Pedersen ER, Svingen GF, Schartum-Hansen H. et al. Urinary excretion of kynurenine and tryptophan, cardiovascular events, and mortality after elective coronary angiography. Eur Heart J 2013; 34: 2689–2696 [DOI] [PubMed] [Google Scholar]
- 28. Pedersen ER, Tuseth N, Eussen SJ. et al. Associations of plasma kynurenines with risk of acute myocardial infarction in patients with stable angina pectoris. Arterioscler Thromb Vasc Biol 2015; 35: 455–462 [DOI] [PubMed] [Google Scholar]
- 29. Brouns R, Verkerk R, Aerts T. et al. The role of tryptophan catabolism along the kynurenine pathway in acute ischemic stroke. Neurochem Res 2010; 35: 1315–1322 [DOI] [PubMed] [Google Scholar]
- 30. Chon SY, Hassanain HH, Gupta SL.. Cooperative role of interferon regulatory factor 1 and p91 (STAT1) response elements in interferon-gamma-inducible expression of human indoleamine 2,3-dioxygenase gene. J Biol Chem 1996; 271: 17247–17252 [DOI] [PubMed] [Google Scholar]
- 31. Fujigaki H, Saito K, Fujigaki S. et al. The signal transducer and activator of transcription 1alpha and interferon regulatory factor 1 are not essential for the induction of indoleamine 2,3-dioxygenase by lipopolysaccharide: involvement of p38 mitogen-activated protein kinase and nuclear factor-kappaB pathways, and synergistic effect of several proinflammatory cytokines. J Biochem 2006; 139: 655–662 [DOI] [PubMed] [Google Scholar]
- 32. Watanabe Y, Koyama S, Yamashita A. et al. Indoleamine 2,3-dioxygenase 1 in coronary atherosclerotic plaque enhances tissue factor expression in activated macrophages. Res Pract Thromb Haemost 2018; 2: 726–735 [DOI] [PMC free article] [PubMed] [Google Scholar]
- 33. Chang MY, Smith C, DuHadaway JB. et al. Cardiac and gastrointestinal liabilities caused by deficiency in the immune modulatory enzyme indoleamine 2,3-dioxygenase. Cancer Biol Ther 2011; 12: 1050–1058 [DOI] [PMC free article] [PubMed] [Google Scholar]
- 34. Cole JE, Astola N, Cribbs AP. et al. Indoleamine 2,3-dioxygenase-1 is protective in atherosclerosis and its metabolites provide new opportunities for drug development. Proc Natl Acad Sci USA 2015; 112: 13033–13038 [DOI] [PMC free article] [PubMed] [Google Scholar]
- 35. Polyzos KA, Ovchinnikova O, Berg M. et al. Inhibition of indoleamine 2,3-dioxygenase promotes vascular inflammation and increases atherosclerosis in Apoe-/- mice. Cardiovasc Res 2015; 106: 295–302 [DOI] [PubMed] [Google Scholar]
- 36. Zhang L, Ovchinnikova O, Jonsson A. et al. The tryptophan metabolite 3-hydroxyanthranilic acid lowers plasma lipids and decreases atherosclerosis in hypercholesterolaemic mice. Eur Heart J 2012; 33: 2025–2034 [DOI] [PubMed] [Google Scholar]
- 37. Metghalchi S, Ponnuswamy P, Simon T. et al. Indoleamine 2,3-dioxygenase fine-tunes immune homeostasis in atherosclerosis and colitis through repression of interleukin-10 production. Cell Metab 2015; 22: 460–471 [DOI] [PubMed] [Google Scholar]
- 38. Wang Y, Liu H, McKenzie G. et al. Kynurenine is an endothelium-derived relaxing factor produced during inflammation. Nat Med 2010; 16: 279–285 [DOI] [PMC free article] [PubMed] [Google Scholar]
- 39. Dankers AC, Mutsaers HA, Dijkman HB. et al. Hyperuricemia influences tryptophan metabolism via inhibition of multidrug resistance protein 4 (MRP4) and breast cancer resistance protein (BCRP). Biochimica et Biophysica Acta 2013; 1832: 1715–1722 [DOI] [PubMed] [Google Scholar]
- 40. Wikoff WR, Nagle MA, Kouznetsova VL. et al. Untargeted metabolomics identifies enterobiome metabolites and putative uremic toxins as substrates of organic anion transporter 1 (Oat1). J Proteome Res 2011; 10: 2842–2851 [DOI] [PMC free article] [PubMed] [Google Scholar]
- 41. Debnath S, Velagapudi C, Redus L. et al. Tryptophan metabolism in patients with chronic kidney disease secondary to type 2 diabetes: relationship to inflammatory markers. Int J Tryptophan Res 2017; 10: 1178646917694600 [DOI] [PMC free article] [PubMed] [Google Scholar]
- 42. Pawlak D, Tankiewicz A, Mysliwiec P. et al. Tryptophan metabolism via the kynurenine pathway in experimental chronic renal failure. Nephron 2002; 90: 328–335 [DOI] [PubMed] [Google Scholar]
- 43. Tankiewicz A, Pawlak D, Topczewska-Bruns J. et al. Kidney and liver kynurenine pathway enzymes in chronic renal failure. Adv Exp Med Biol 2003; 527: 409–414 [DOI] [PubMed] [Google Scholar]
- 44. Haverkamp GL, Loosman WL, Franssen CF. et al. The role of tryptophan degradation in the association between inflammatory markers and depressive symptoms in chronic dialysis patients. Nephrol Dial Transplant 2016; 32: 1040–1047 [DOI] [PubMed] [Google Scholar]
- 45. Pawlak K, Mysliwiec M, Pawlak D.. Hypercoagulability is independently associated with kynurenine pathway activation in dialysed uraemic patients. Thromb Haemost 2009; 102: 49–55 [DOI] [PubMed] [Google Scholar]
- 46. Amdur RL, Feldman HI, Dominic EA. et al. Use of measures of inflammation and kidney function for prediction of atherosclerotic vascular disease events and death in patients with CKD: findings from the CRIC study. Am J Kidney Dis 2019; 73: 344–353 [DOI] [PMC free article] [PubMed] [Google Scholar]
- 47. Pawlak K, Kowalewska A, Mysliwiec M. et al. 3-hydroxyanthranilic acid is independently associated with monocyte chemoattractant protein-1 (CCL2) and macrophage inflammatory protein-1beta (CCL4) in patients with chronic kidney disease. Clin Biochem 2010; 43: 1101–1106 [DOI] [PubMed] [Google Scholar]
- 48. Gao J, Xu K, Liu H. et al. Impact of the gut microbiota on intestinal immunity mediated by tryptophan metabolism. Front Cell Infect Microbiol 2018; 8: 13. [DOI] [PMC free article] [PubMed] [Google Scholar]
- 49. Leong SC, Sirich TL.. Indoxyl sulfate-review of toxicity and therapeutic strategies. Toxins (Basel) 2016; 8: 358. [DOI] [PMC free article] [PubMed] [Google Scholar]
Associated Data
This section collects any data citations, data availability statements, or supplementary materials included in this article.