

Abstract
Background
Chronic kidney disease is associated with a high cardiovascular risk. Compared with glomerular filtration rate–matched CKD patients (CKDps), we previously reported a 2.7-fold greater risk of global mortality among kidney transplant recipients (KTRs). We then examined aortic stiffness [evaluated by carotid–femoral pulse wave velocity (CF-PWV)] and cardiovascular risk in KTRs compared with CKDps with comparable measured glomerular filtration rate (mGFR).
Methods
We analysed CF-PWV in two cohorts: TransplanTest (KTRs) and NephroTest (CKDps). Propensity scores were calculated including six variables: mGFR, age, sex, mean blood pressure (MBP), body mass index (BMI) and heart rate. After propensity score matching, we included 137 KTRs and 226 CKDps. Descriptive data were completed by logistic regression for CF-PWV values higher than the median (>10.6 m/s).
Results
At 12 months post-transplant, KTRs had significantly lower CF-PWV than CKDps (10.1 versus 11.0 m/s, P = 0.008) despite no difference at 3 months post-transplant (10.5 versus 11.0 m/s, P = 0.242). A lower occurrence of high arterial stiffness was noted among KTRs compared with CKDps (38.0% versus 57.1%, P < 0.001). It was especially associated with lower mGFR, older age, higher BMI, higher MBP, diabetes and higher serum parathyroid hormone levels. After adjustment, the odds ratio for the risk of high arterial stiffness in KTRs was 0.40 (95% confidence interval 0.23–0.68, P < 0.001).
Conclusions
Aortic stiffness was significantly less marked in KTRs 1 year post-transplant than in CKDps matched for GFR and other variables. This observation is compatible with the view that the pathogenesis of post-transplant cardiovascular disease differs, at least in part, from that of CKD per se.
Keywords: cardiovascular risk, carotid-femoral pulse wave velocity (CF-PWV), chronic kidney disease, kidney transplantation
INTRODUCTION
Patients with chronic kidney disease (CKD) are at high risk of developing cardiovascular disease. Many studies reported an early, marked increase in arterial stiffness among CKD patients (CKDps), characterized by alterations in the viscoelastic properties of large arteries [1–4]. Carotid–femoral pulse wave velocity (CF-PWV) is the gold standard for the evaluation of aortic stiffness [5]. As a non-invasive and reproducible method, CF-PWV is considered as a marker of target organ damage in the guidelines of the European Society of Hypertension–European Society of Cardiology [6]. It has been shown to be an independent predictive factor for all-cause and cardiovascular mortality, coronary heart disease and fatal stroke in patients with diabetes [7], essential hypertension [8–10] and end-stage kidney disease (ESKD) [2, 11, 12] and kidney transplant recipients (KTRs) [13–16].
Kidney transplantation reduces the risk of lethal and non-lethal cardiovascular complications in selected patients relative to patients remaining on dialysis treatment [17–21]. The lower risk of mortality in KTRs than in chronic dialysis (ESKD) patients is partly due to the lower frequency of cardiovascular events [22]. However, even though kidney transplantation prolongs survival relative to chronic dialysis therapy, KTRs present a much higher mortality risk than healthy people. A European study reported a 14-fold higher risk of global mortality among KTRs than in an age-matched population with normal renal function during the first year post-transplantation and a 4-fold higher risk thereafter [23]. Recently we reported that beyond 1 year after transplantation, KTRs had a 2.7-fold greater risk of global mortality than non-transplant CKDps and a similar level of renal function. However, KTRs appeared to have more severe infections and there was no difference between the two groups in the incidence of cardiovascular events [24].
Data for a direct comparison of cardiovascular risk between KTRs and non-transplanted CKDp are lacking. We therefore decided to compare aortic stiffness and cardiovascular risk between KTRs and CKDps with similar renal function. To this end, we measured CF-PWV, a recognized intermediate endpoint, in KTRs and CKDps in a propensity score matching analysis including measured glomerular filtration rate (mGFR).
MATERIALS AND METHODS
Study design and participants
CKDps were recruited from two previously described observational cohort studies: the TransplanTest and the NephroTest [15, 25].
The TransplanTest cohort is a monocentric hospital-based cohort that included consecutive adult kidney graft recipients who attended the Division of Renal Physiology (Tenon Hospital, Paris, France) between June 2008 and January 2017 and were able and willing to be evaluated at 3 months and/or 1 year after transplantation. Eligible patients were 18–70 years of age and were recipients of a first living or cadaveric single kidney transplant. Non-inclusion criteria were cardiac arrhythmia, symptomatic lower limb arteriopathy and dual‐kidney or combined organ transplantation. All participants signed a written informed consent and data collection was approved by the Commission nationale de l'informatique et des libertés according to French legislation (n°2065902v0). All kidney recipients received a standard immunosuppressive regimen including an induction therapy (methylprednisolone associated with basiliximab or anti-thymocyte globulin) followed by a triple therapy regimen with calcineurin inhibitors (CNIs) (mainly tacrolimus or ciclosporin), corticosteroids (tapered to 5 mg/day after 1 month) and mycophenolate mofetil. The primary study outcome of the cohort was the change in CF-PWV and its determinants after kidney transplantation.
The NephroTest study is a prospective hospital-based tricentric cohort (Physiology Departments of Tenon, Georges Pompidou and Bichat Hospitals, Paris, France) that enrolled 2084 consecutive adult CKDps of all stages from January 2000 to December 2012 [25]. Patients were referred by their nephrologists for an extensive workup in the Physiology Department, enrolling patients after a diagnosis of Stages 2–5 CKD. To be eligible, patients had to be >18 years old and neither on dialysis nor have received previously a kidney transplant. Pregnant women were excluded. All participants signed a written informed consent and a local ethics review board approved the study. The NephroTest study design was approved by an ethics committee (CCTIRS MG/CP09.503). The primary study outcomes of the cohort were measured showing a GFR decline, ESRD incidence and mortality. For the present study, we restricted the inclusion to patients evaluated for the first time at Tenon Hospital (609 patients), where CF-PWV was measured during the visit.
Data and measures
The NephroTest cohort CKDps were referred in a 1-day visit at the Renal Physiology Division of Tenon Hospital. The TransplanTest cohort patients (KTRs) were referred at 3 and 12 months after kidney transplantation for clinical and laboratory examinations to the same Renal Physiology Division. Data were retrospectively collected for KTRs and prospectively collected for CKDps. They included demographics, medical history, diagnosis of primary renal disease, body height and weight, resting blood pressure (BP) and medications. In the two cohorts and at each visit, mGFR was measured by chromium-51 ethylenediaminetetraacetic acid (51Cr-EDTA) renal clearance, as reported previously [26]. In brief, 1.8–3.0 MBq of 51Cr-EDTA (GE Healthcare, Velizy, France) were injected intravenously as a single bolus. The average renal 51Cr-EDTA clearance was determined over five to six consecutive 30-min clearance periods. Blood samples for creatinine measurements were obtained simultaneously. Serum creatinine was measured with an isotope dilution mass spectromtry–traceable enzymatic assay.
Biochemistry measurements were performed in the Physiology Department for both cohorts. Serum parathyroid hormone (PTH) was measured using second-generation two-site radio-immunometric assays [initially Allegro Intact PTH assay, then Allegro Calibrated Intact PTH Advantage assay (Nichols Institute Diagnostics, San Clemente, CA, USA) (normal range 10–58 pg/mL) and, since January 2004, Elecsys chemoluminescent assay from Roche (Indianapolis, IN, USA) (normal range 10–65 pg/mL)] that yielded quite similar results [27]. Plasma phosphate was measured by the colorimetric method (phosphomolybdate assay); blood ionized calcium, potassium and venous blood total carbon dioxideby specific electrodes (Beckman SX9; Beckman Coulter, Brea, CA, USA); plasma 25-hydroxyvitamin D [25(OH)D] by the radioimmunologic method (DiaSorin, Saluggia, Italy) recognizing both 25(OH)D2 and 25(OH)D3 with similar affinity (normal range 10–40 ng/mL) and plasma 1,25-dihydroxyvitamin D [1,25(OH)2D] by the radioimmunologic method (DiaSorin) (normal range 17–67 pg/mL).
BP and CF-PWV measurements
In the two cohorts, the same devices and methods were used to evaluate arterial stiffness. Patients were examined in a quiet, temperature-controlled room and measurements were performed by experienced operators. BP was measured after 15 min of rest in a supine position using a sphygmomanometer and a cuff of appropriate size. The average of five consecutive measurements was calculated. CF-PWV was measured along the descending thoraco-abdominal aorta with an automatic device (Complior, Artech Medical, Pantin, France). This method enables online pulse wave recording and automatic calculation of CF-PWV by dividing the distance between the carotid and femoral measurement sites by the transit time of the wave. Validation of this method and reproducibility have been previously reported, with intra- and interobserver repeatability coefficients of 0.94 and 0.89, respectively [28]. CF-PWV was defined as the mean of five determinations.
Study outcomes
The main study outcome was CF-PWV, the gold standard for large artery stiffness determinations. Aortic stiffness was compared between KTRs (at 3 months and 12 months post-transplant) and CKDps in a propensity score–matching analysis based on known determinants of CF-PWV, including age, sex, mean blood pressure (MBP), body mass index (BMI), heart rate and mGFR [28]. In addition, arterial stiffness determinants were sought by the evaluation of factors associated with the occurrence of high CF-PWV, defined as CF-PWV higher than the median.
Statistical analysis
We first created a study database by pooling the TransplanTest and NephroTest (Tenon Hospital) data. We then calculated propensity scores including the following variables: mGFR, age, sex, MBP, BMI and heart rate [28]. For KTRs, these variables were evaluated 12 months after transplantation.
The 168 KTRs were matched at a 2:1 ratio with the 609 CKDps and the closest propensity score. This provided propensity score-matched sets of 137 KTRs and 226 non-transplant CKDps (Figure 1). Propensity score matching was performed with a caliper, which enabled us to have no residual differences between the two groups for the variables used.
FIGURE 1:
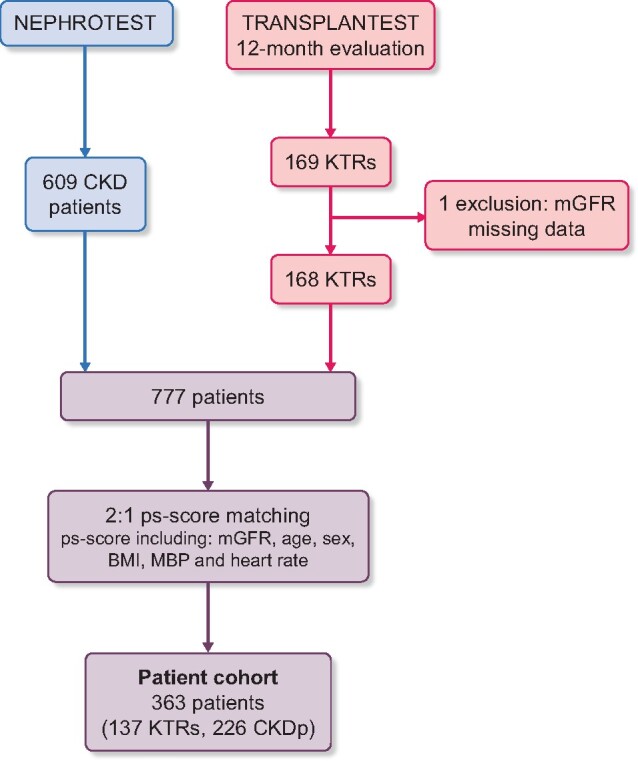
Flow chart.
Patient characteristics were summarized as medians (interquartile ranges) or numbers (%) and the two groups were compared using Student’s t test or Wilcoxon test for quantitative data and a chi-squared test or Mann–Whitney test for qualitative data, as appropriate.
Logistic regression models were used to estimate crude and adjusted odds ratios (ORs) and the corresponding 95% confidence intervals (CIs) for CF-PWV higher than the median. For multivariable analysis, we included in the models all clinically relevant vascular stiffness–associated factors selected based on literature and identified in univariate analysis (P < 0.05). Concerning covariates already used for propensity score matching, we included only those with standardized mean differences (SMDs) <0.10 [29]. Models were compared using log-likelihood statistics.
For sensitivity analyses, we repeated the matching, limited to only one mGFR matching, and repeated the analyses.
Missing data were managed by applying multivariate imputation with chained equations (MICE) before matching. The percentage of missing data among the patients before matching (n = 777) is given in Supplementary data, Table S1. We used the ‘mice’ package in R software (R Foundation, Vienna, Austria) [18] and the predictive mean matching method with five iterations. All statistical and graphic analyses were performed with R software and the R-Studio interface (version 3.3.2) [30].
RESULTS
Study population
Table 1 shows that there were no differences between the 137 KTRs and the 226 CKDps as regards mean mGFR and the majority of the other variables included in the propensity score.
Table 1.
Characteristics of CKDp, quoted as the median (interquartile range) and the number (%)
| Characteristics | Overall study population | Non-transplant CKDps | KTRs | P-value |
|---|---|---|---|---|
| N | 363 | 226 | 137 | |
| CF-PWV (KTRs, mo. 12) | 10.59 (9.00–12.65) | 11.00 (9.00–13.00) | 10.09 (9.00–11.49) | 0.008 |
| CF-PWV (KTRs, mo. 3) | 11.00 (9.00–13.00) | 11.00 (9.00–13.00) | 10.50 (9.23–12.14) | 0.242 |
| Quantitative data | ||||
| Age (years) | 54.90 (44.10–63.15) | 56.80 (42.60–65.12) | 54.00 (45.00–61.00) | 0.228 |
| mGFR at inclusion (mL/min/1.73 m2) | 52.10 (36.60–66.18) | 47.75 (33.82–68.80) | 54.55 (44.37–64.24) | 0.067 |
| BMI (kg/m2) | 25.22 (22.22–29.11) | 25.22 (21.88–29.31) | 25.40 (22.72–28.68) | 0.678 |
| Systolic BP (mmHg) | 130 (118–141) | 130 (118–143) | 130 (120–140) | 0.936 |
| Diastolic BP (mmHg) | 73 (65–80) | 72 (64–80) | 73 (66–80) | 0.541 |
| MBP (mmHg) | 92 (83–100) | 90 (83–100) | 93 (84–100) | 0.682 |
| Renal parameters | ||||
| Aetiology of kidney disease, n (%) | 0.264 | |||
| Diabetic | 36 (9.9) | 26 (11.5) | 10 (7.3) | |
| Other | 327 (90.1) | 200 (88.5) | 127 (92.7) | |
| Urinary protein:creatinine ratio (mg/mmol) | 24 (11–69) | 29 (14–79) | 18 (9–53) | 0.001 |
| Urinary albumin:creatinine ratio (mg/mmol) | 6 (2–32) | 7 (2–37) | 4 (2–19) | 0.030 |
| Conventional cardiovascular risk factors, n (%) | ||||
| Sex (male) | 216 (59.5) | 130 (57.5) | 86 (62.8) | 0.380 |
| Diabetes | 108 (29.8) | 73 (32.3) | 35 (25.5) | 0.213 |
| Hypertension | 331 (91.2) | 204 (90.3) | 127 (92.7) | 0.547 |
| Current smoking | 45 (12.4) | 31 (13.7) | 14 (10.2) | 0.327 |
| Medications, n (%) | ||||
| Diuretics | 113 (31.1) | 95 (42.0) | 18 (13.1) | <0.001 |
| Beta-adrenergic blockers | 108 (29.8) | 51 (22.6) | 57 (41.6) | <0.001 |
| Calcium channel blockers | 158 (43.5) | 76 (33.6) | 82 (59.9) | <0.001 |
| ACE inhibitors and/or ARBs | 250 (68.9) | 179 (79.2) | 71 (51.8) | <0.001 |
| Statins | 138 (38.0) | 87 (38.5) | 51 (37.2) | 0.897 |
| Biochemical CKD-MBD parameters | ||||
| Serum calcium (mmol/L) | 2.31 (2.23–2.41) | 2.28 (2.20–2.36) | 2.40 (2.29–2.48) | <0.001 |
| Blood ionized serum calcium (mmol/L) | 1.21 (1.17–1.25) | 1.20 (1.17–1.23) | 1.24 (1.20–1.27) | <0.001 |
| Serum magnesium (mmol/L) | 0.78 (0.71–0.85) | 0.81 (0.75–0.87) | 0.73 (0.65–0.79) | <0.001 |
| Serum phosphate (mmol/L) | 1.02 (0.20) | 1.03 (0.92–1.19) | 0.98 (0.85–1.09) | 0.001 |
| Serum PTH (pg/mL) | 52.00 (34.00–90.00) | 48.50 (29.00–91.50) | 57.00 (39.00–89.00) | 0.031 |
| Serum 25(OH)D (ng/mL) | 19.00 (13.00–27.50) | 18.00 (12.00–28.00) | 19.00 (14.00–26.30) | 0.334 |
| Serum 1,25(OH)2D (pg/mL) | 34.00 (24.00–49.00) | 29.00 (20.25–41.00) | 46.00 (33.00–63.00) | <0.001 |
| Urinary calcium/creatinine (mM/mM) | 0.06 (0.02–0.15) | 0.04 (0.01–0.11) | 0.10 (0.04–0.17) | <0.001 |
| Serum bone alkaline phosphatase (µg/L) | 12.10 (8.80–17.98) | 11.60 (8.80–16.60) | 13.60 (9.05–19.85) | 0.031 |
Data include non-transplant CKDps from the NephroTest cohort and KTRs from the TransplanTest cohort. Values are presented as median (IQR) unless stated otherwise.
ACE, angiotensin-converting enzyme; ARB, angiotensin II receptor blocker; BMI, body mass index; CKD-MBD, CKD-associated mineral and bone disorder; mo., months.
Within the subgroup of KTRs, ‘diabetes’ included diabetic status prior to renal transplantation and not new-onset diabetes after transplantation. There were no differences between KTRs and CKDps as regards diabetes frequency (25.5% versus 32.3%, P = 0.213).
Regarding KTRs, 10.5% of them benefited from pre-emptive kidney transplantation. All the others were on dialysis an average of 3.7 years before kidney transplantation [median 2.8 years (IQR 1.6–4.7)].
There were no differences in hypertension frequency (P = 0.547), but treatments were different. KTRs more frequently received beta-adrenergic blockers (41.6% versus 22.6%, P < 0.001) or calcium channel blockers (59.9% versus 33.6%, P < 0.001), whereas angiotensin-converting enzyme inhibitors and angiotensin II receptor blockers were less frequently prescribed to KTRs (51.8% versus 79.2%, P < 0.001). Proteinuria (and albuminuria) was significantly lower among KTRs than CKDps. Prescription of diuretics was also less frequent among KTRs (13.1% versus 42.0%, P < 0.001).
As regards biochemistry parameters, there were several slight, although significant differences between groups. Blood ionized calcium concentration was higher among KTRs than CKDps, in association with higher serum PTH levels (57.0 versus 48.5 pg/mL, P = 0.031), despite significantly higher serum 1,25(OH)2D levels and lower serum phosphate levels (0.98 versus 1.03 mmol/L, P = 0.001). Bone alkaline phosphatase serum levels (normal <25 and <22 µg/L for males and females, respectively) were significantly higher among KTRs than CKDps (13.6 versus 11.6 µg/L, P = 0.031).
CF-PWV
Distribution and associated factors
KTRs had significantly lower median CF-PWV values than CKDps (10.1 versus 11.0 m/s, P = 0.008) at 12 months post-transplant, as shown in Figure 2 and Table 1. No such between-group difference was apparent at the 3-month time point post-transplant (Table 1). Figure 3 represents the CF-PWV distribution of CKDps compared with the distribution in KTRs at 12 months post-transplant. There was no association between CF-PWV and mGFR, even when analysing the two patient subgroups separately (Figure 4, R2 = −0.08, P = 0.120 among all cohorts, R2 = −0.005, P = 0.947 among KTRs and R2 = −0.10, P = 0.125 among CKDps).
FIGURE 2:

CF-PWV box plot in non-transplant CKDps and KTRs measured at 12 months post-transplant.
FIGURE 3:
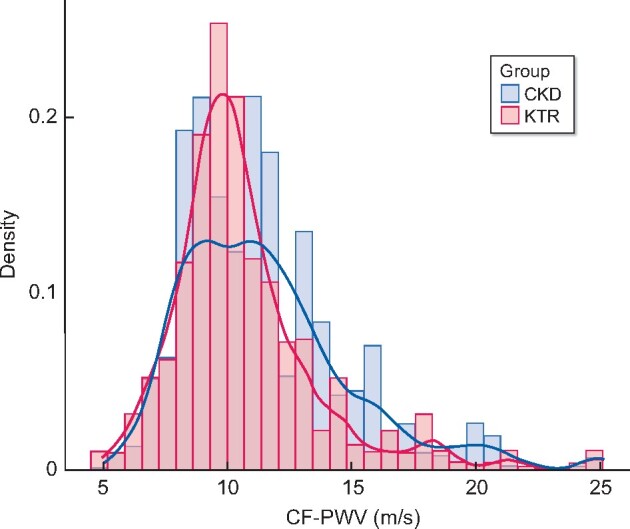
CF-PWV histogram plot in non-transplant CKDps and KTRs measured at 12 months post-transplant.
FIGURE 4:
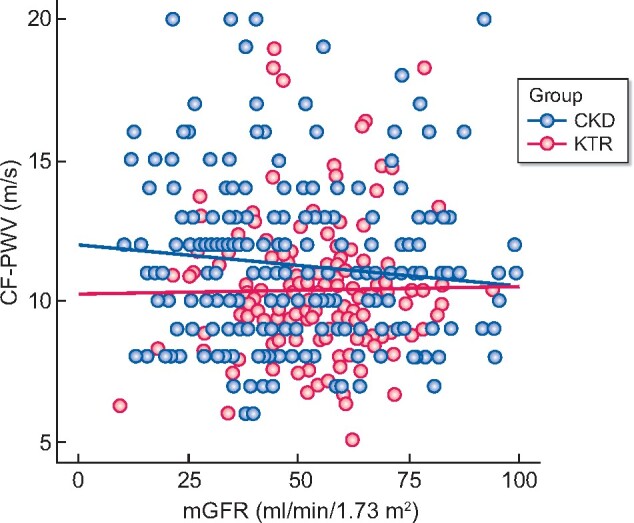
CF-PWV plot by mGFR according to renal transplantation (KTRs measured at 12 months post-transplant).
Interestingly, the KTR subgroup experienced a significant improvement in CF-PWV between Months 3 and 12 post-transplant (10.8 versus 10.6 m/s, P = 0.020).
Arterial stiffness
When defining high arterial stiffness as CF-PWV values higher than the median CF-PWV value of the whole cohort (10.6 m/s), we found a significantly lower occurrence of arterial stiffness among KTRs as compared with CKDps [52 (38.0%) versus 129 (57.1%), P < 0.001].
Univariate logistic regression analysis (Table 2) showed that high aortic stiffness was associated with lower mGFR, older age, diabetic status (and diabetic nephropathy), current smoking and hypertension (and higher systolic BP, diastolic BP and MBP). All anti-hypertensive drug classes were significantly associated with greater arterial stiffness, with a greater number of anti-hypertensive medications.
Table 2.
Univariate analysis with ORs for CF-PWV greater than the median among KTRs versus non-transplant CKDps
| Overall study population (N = 363) |
KTRs (n = 137) |
Non-transplant CKDps (n = 226) |
||||
|---|---|---|---|---|---|---|
|
|
|
|
||||
| Characteristics | OR (95% CI) | P-value | OR (95% CI) | P-value | OR (95% CI) | P-value |
| KTRs versus CKDp | 0.46 (0.3–0.71) | <0.001 | ||||
| Quantitative data | ||||||
| Age (years) | 1.1 (1.08–1.13) | <0.001 | 1.08 (1.04–1.12) | <0.001 | 1.11 (1.08–1.15) | <0.001 |
| mGFR (mL/min/1.73 m2) | 0.99 (0.98–1) | 0.023 | 0.98 (0.96–1) | 0.061 | 0.99 (0.98–1.00) | 0.134 |
| BMI (kg/m2) | 1.09 (1.04–1.14) | <0.001 | 1.08 (1–1.18) | 0.064 | 1.1 (1.04–1.16) | <0.001 |
| Systolic BP (mmHg) | 1.04 (1.02–1.05) | <0.001 | 1.01 (0.99–1.03) | 0.312 | 1.06 (1.04–1.08) | <0.001 |
| Diastolic BP (mmHg) | 1.03 (1.01–1.05) | 0.010 | 0.99 (0.96–1.02) | 0.521 | 1.06 (1.03–1.09) | <0.001 |
| MBP (mmHg) | 1.04 (1.02–1.06) | <0.001 | 1.00 (0.97–1.03) | 0.924 | 1.07 (1.05–1.1) | <0.001 |
| Heart rate (bpm) | 1.01 (1–1.03) | 0.156 | 1.01 (0.98–1.03) | 0.676 | 1.02 (1–1.05) | 0.050 |
| Extracellular fluid volume (L) | 1.1 (1.04–1.17) | <0.001 | 1.1 (0.99–1.22) | 0.071 | 1.13 (1.04–1.21) | 0.002 |
| Extracellular fluid volume (% body weight) | 1.02 (0.98–1.07) | 0.318 | 1.04 (0.96–1.12) | 0.322 | 1.01 (0.95–1.08) | 0.689 |
| Diuresis | 1.00 (0.99–1.01) | 0.895 | 1.00 (0.99–1.01) | 0.651 | 1 (0.99–1.01) | 0.864 |
| Renal parameters | ||||||
| Aetiology of kidney disease (%) | <0.001 | 0.033 | <0.001 | |||
| Diabetes | 7.32 (2.78–19.29) | <0.001 | 4.25 (1.05–17.25) | 0.043 | 10.86 (2.5–47.17) | 0.001 |
| Other (reference) | – | – | – | – | – | – |
| Urinary protein:creatinine ratio (mg/mmol) | 1.01 (0.99–1.00) | 0.607 | 1.00 (0.99–1.01) | 0.658 | 0.99 (0.99–1.00) | 0.879 |
| Urinary albumin:creatinine ratio (mg/mmol) | 0.99 (0.99–1.00) | 0.851 | 1.00 (0.99–1.01) | 0.680 | 0.99 (0.99–1.00) | 0.353 |
| Conventional cardiovascular risk factors | ||||||
| Sex (male) | 1.11 (0.73–1.69) | 0.623 | 0.81 (0.4–1.64) | 0.550 | 1.43 (0.84–2.43) | 0.193 |
| Diabetes | 4.65 (2.81–7.69) | <0.001 | 2.48 (1.13–5.44) | 0.023 | 7.23 (3.53–14.81) | <0.001 |
| Hypertension | 6.13 (2.31–16.31) | <0.001 | 6.04 (0.74–49.13) | 0.093 | 7.12 (2.32–21.81) | <0.001 |
| Current smoking | 0.46 (0.24–0.88) | 0.020 | 0.24 (0.05–1.13) | 0.072 | 0.49 (0.23–1.06) | 0.070 |
| Medications | ||||||
| Diuretics | 2.68 (1.69–4.26) | <0.001 | 2.29 (0.84–6.25) | 0.105 | 2.27 (1.31–3.94) | 0.004 |
| Beta-adrenergic blockers | 1.46 (0.93–2.3) | 0.101 | 2.25 (1.11–4.56) | 0.024 | 1.51 (0.79–2.88) | 0.213 |
| Calcium channel blockers | 1.51 (1–2.3) | 0.051 | 1.12 (0.55–2.27) | 0.753 | 2.95 (1.62–5.4) | <0.001 |
| ACE inhibitors and/or ARBs | 2.24 (1.41–3.53) | <0.001 | 1.89 (0.93–3.81) | 0.077 | 1.88 (0.98–3.6) | 0.056 |
| Anti-hypertensive medications | 0.002 | 0.116 | 0.011 | |||
| ≤2 medications (reference) | – | – | – | – | – | – |
| >2 medications | 1.94 (1.26–2.96) | 0.002 | 1.76 (0.86–3.59) | 0.120 | 2.02 (1.17–3.48) | 0.011 |
| CKD-MBD biochemistry parameters | ||||||
| Serum total calcium (mmol/L) | 0.38 (0.09–1.65) | 0.197 | 0.96 (0.09–10.24) | 0.975 | 0.95 (0.11–7.9) | 0.961 |
| Blood ionized calcium (mmol/L) | 0.03 (0–0.62) | 0.024 | 0.49 (0–58.11) | 0.768 | 0.04 (0–3.03) | 0.144 |
| Serum magnesium (mmol/L) | 1.46 (0.25–8.37) | 0.673 | 0.27 (0.01–6.06) | 0.408 | 0.56 (0.05–6.21) | 0.636 |
| Serum phosphate (mmol/L) | 0.7 (0.25–1.96) | 0.491 | 0.08 (0.01–0.66) | 0.019 | 0.94 (0.26–3.41) | 0.930 |
| Serum PTH (pg/mL) | 1.006 (1.00–1.01) | 0.004 | 1.00 (0.99–1.01) | 0.235 | 1.01 (1.00–1.02) | 0.002 |
| Serum 25(OH)D (ng/mL) | 0.98 (0.97–1) | 0.021 | 0.98 (0.95–1.01) | 0.136 | 0.98 (0.97–1) | 0.067 |
| Serum 1,25(OH)2D (pg/mL) | 0.99 (0.98–1) | 0.034 | 0.99 (0.97–1.01) | 0.220 | 0.99 (0.98–1.02) | 0.987 |
| Urinary calcium/creatinine (mM/mM) | 0.27 (0.08–0.94) | 0.039 | 0.24 (0.04–1.61) | 0.142 | 0.59 (0.11–3.27) | 0.543 |
| Serum bone alkaline phosphatase (µg/L) | 1.00 (0.99–1.03) | 0.426 | 1.02 (0.98–1.05) | 0.324 | 1.01 (0.98–1.04) | 0.420 |
ACE, angiotensin-converting enzyme; ARB, angiotensin II receptor blocker; CKD-MBD: CKD-associated mineral and bone disorder.
As to CKD-associated mineral and bone disorder biochemistry parameters, lower blood ionized calcium, PTH, 25(OH)D, 1,.25(OH)2D and urinary calcium/creatinine levels were associated with a higher incidence of arterial stiffness in univariate analysis.
The KTR group had a lower risk of high arterial stiffness than the CKDp group [OR 0.46 (95% CI 0.30–0.71), P < 0.001]. This difference remained statistically significant after various adjustments (Table 3). In an analysis adjusted on mGFR, age, BMI, MBP, diabetes and serum PTH, the arterial stiffness risk OR for KTRs was 0.40 (95% CI 0.23–0.68, P < 0.001). Model 11 appeared to be the best statistical model.
Table 3.
Multivariable models with ORs for CF-PWV greater than the median among KTRs at 1 year of follow-up versus non-transplant CKDps adjusted for other risk factors
| Model | OR (95% CI) | P-value | LLH | LLH ratio test |
|---|---|---|---|---|
| Model 1: KTRs versus non-transplant CKDp | 0.46 (0.3–0.71) | <0.001 | −245 | |
| Multivariate analysis | ||||
Model 2: KTRs versus non-transplant CKDps
|
0.42 (0.25–0.71) | <0.001 | −177 |
|
Model 3: KTRs versus non-transplant CKDps
|
0.43 (0.25–0.72) | 0.001 | −175 |
|
Model 4: KTRs versus non-transplant CKDps
|
0.43 (0.25–0.73) | 0.002 | −173 |
|
Model 5: KTRs versus non-transplant CKDps
|
0.42 (0.25–0.72) | 0.001 | −175 |
|
Model 6: KTRs versus non-transplant CKDps
|
0.47 (0.27–0.81) | 0.006 | −174 |
|
Model 7: KTRs versus non-transplant CKDps
|
0.45 (0.26–0.78) | 0.004 | −175 |
|
Model 8: KTRs versus non-transplant CKDps
|
0.41 (0.24–0.71) | 0.001 | −175 |
|
Model 9: KTRs versus non-transplant CKDps
|
0.42 (0.25–0.72) | 0.001 | −175 |
|
Model 10: KTRs versus non-transplant CKDps
|
0.48 (0.28–0.83) | 0.008 | −174 |
|
Model 11: KTRs versus non-transplant CKDps
|
0.4 (0.23–0.68) | <0.001 | −172 |
|
Model 12: KTRs versus non-transplant CKDps
|
0.4 (0.23–0.68) | <0.001 | −171 |
|
Model 13: KTRs versus non-transplant CKDps
|
0.4 (0.22–0.71) | 0.001 | −172 |
|
Model 14: KTRs versus non-transplant CKDps
|
0.42 (0.24–0.72) | 0.001 | −172 |
|
Data are presented as OR (95% CI) for KTRs versus non-transplant CKDps.
LLH, likelihood.
Sensitivity analyses
Matching limited to mGFR alone
We found results similar to those obtained with propensity score analysis when matching by mGFR alone: KTRs had a 58% [OR 0.42 (95% CI 0.29–0.63), P < 0.001] reduced risk of having a CF-PWV greater than the median at 12 months post-transplant, as compared with the matched CKDps. This difference remained significant after various adjustments {for mGFR, age, BMI, MBP, diabetes and serum PTH [OR 0.58 (95% CI 0.36–0.94), P = 0.029], Model 6, Supplementary data, Table S4}.
DISCUSSION
Since CF-PWV is a well-recognized intermediate endpoint of cardiovascular events and cardiovascular mortality in the general population, as well as in CKDps [2, 11, 12], including KTRs [31], we hypothesized that there might be a difference in the degree of severity of CF-PWV between these two patient groups at comparable ages and GFRs. This was indeed the case. Relative to CKDps matched for age and mGFR, KTRs had a significantly lower CF-PWV and lower frequency of arterial stiffness at 1 year post-transplant. Interestingly, such a difference was not observed at 3 months post-transplant. This is compatible with a comparable cardiovascular status at baseline as regards CF-PWV and in favour of a slow improvement of CF-PWV post-transplant, which was the case between Months 3 and 12 post-transplant.
Compared with patients undergoing long-term dialysis therapy, KTRs present a lower global mortality risk [17–21], partly due to the lower frequency of cardiovascular events [22, 32]. In a recent personal study, KTRs had a higher global mortality risk than estimated glomerular filtration rate (eGFR)-matched CKDps [24], probably favoured by more severe infections, although there was no significant difference in the incidence of cardiovascular events, possibly due to a relatively small sample size [24].
Smulyan et al. [33] previously reviewed the impact of diabetes and hypertension on PWV in 329 patients. They found that in contrast to non-diabetic subjects, mean arterial pressure was not significantly associated with PWV among diabetic subjects. However, at comparable mean arterial pressures, arterial stiffness was significantly higher in diabetic than in non-diabetic patients (median 13.9 versus 11.5 m/s, respectively; P < 0.0001) and PWV was associated with diabetes duration and insulin resistance. It should be noted that diabetes duration was repeatedly found to be independently associated with aortic stiffness (R2 = 0.39, P < 0.0001) after adjustment for age, heart rate, BP and metabolic syndrome [33–36].
Kidney transplantation was an independent determinant of arterial stiffness in the present study. An improvement of PWV was observed in KTRs, although most of them had experienced long-term dialysis and had a longer CKD history compared with CKDps. Therefore the latter would be predicted to have lower CF-PWV and lower cardiovascular risk than those on longer-lasting dialysis treatment. Better PWV values were observed in the KTR group despite the use of immunosuppressive drugs, such as calcineurin inhibitors (for almost all KTRs), which could theoretically interfere with beneficial post-transplant vascular effects [37]. This suggests the role of alternative mechanisms.
Several previous studies examined the impact of renal transplantation on vascular outcomes in KTRs. Delahousse et al. [38] reported in a prospective study on 74 KTRs from deceased donors a correlation between improved post-transplant aortic stiffness and donor age. In that study, CF-PWV (adjusted on MBP) decreased by 0.43 m/s (from 9.43 ± 1.48 to 9.00 ± 1.62 m/s) between 3 and 12 months post-transplant in recipients of young donors (17–41 years) (P = 0.028), while it increased by 0.28 m/s (from 9.97 ± 1.70 to 10.25 ± 1.98 m/s) in recipients of older donors (53–70 years) (P = 0.022). In another study, Karras et al. [39] evaluated arterial stiffness by CF-PWV and vascular remodelling in 161 KTRs 3 and 12 months after transplantation. Three different groups were considered based on donor characteristics, namely recipients from living donors, recipients from standard criteria donors (SCDs) and recipients from extended criteria donors (ECDs). First, the maladaptive vascular remodelling observed in CKDps improved within 12 months post-transplant, independent of BP and renal function [39]. Second, mean PWV decreased from 10.8 m/s (95% CI 10.5–11.2) at Month 3 to 10.1 m/s (95% CI 9.8–10.5) at Month 12 (P < 0.001). The reduction of CF-PWV was more marked in patients with living donor allografts compared with those with deceased donor allografts (P < 0.001) after multivariable adjustment. Moreover, the change in CF-PWV differed significantly when comparing the SCD group [+0.1 m/s (95% CI −0.4–0.4)] to the extended criteria donor group [−0.7 m/s (95% CI −1 to −0.4), P < 0.01]. Thus improved PWV was independently associated with live organ donation and kidney graft characteristics. These findings suggest that graft quality, particularly renal donor characteristics, influence post-transplant vascular recovery [39]. In the present study, we did not focus on this specific issue.
It is well known that the high cardiovascular risk of CKDps results not only from traditional cardiovascular risk factors, but also from more CKD-specific factors such as abnormalities linked to the CKD-associated mineral and bone disorder [31, 40, 41]. In this study, serum PTH remained independently associated with the occurrence of high arterial stiffness. Even after a more or less successful correction of many CKD-related factors by renal transplantation, other non-traditional risk factors may favour cardiovascular morbidity and mortality, such as the effects of immunosuppressive drugs, antibiotics, the transplantation procedure itself and the persistent formation and retention of uraemic toxins [42, 43]. A variety of studies have linked cardiovascular morbidity to increased concentrations of uraemic solutes [44–48]. Barreto et al. [49] demonstrated positive associations of indoxyl-sulfate serum levels with vascular calcification, cardiovascular mortality and global mortality in a cohort of patients at different stages of CKD. The impact of an effective lowering of uraemic toxins post-transplant could explain the lower CF-PWV observed among KTRs compared with matched CKDps. Liabeuf et al. [43, 50] showed that serum-free and total indoxyl sulfate levels, measured at 12 months post-transplant, were significantly lower in KTRs than in CKDps matched for age, sex and eGFR, suggesting that kidney transplantation can be protective against the increase in indoxyl sulfate levels for a given degree of CKD. Other studies confirmed the normalization of this as well as other protein-bound uraemic toxins after kidney transplantation. Moreover, in contrast to observations in dialysis and pre-dialysis patients, indoxyl sulfate levels were not associated with cardiovascular disease, CKD progression and mortality among KTRs [49]. Determinations of uraemic toxin levels were not available among the two patient cohorts of the present study, preventing any conclusion regarding this issue.
Our study has several strengths. Based on two large cohorts of CKDps and KTRs, who were evaluated in a similar way, it combined two gold standard methods: aortic stiffness assessment by CF-PWV and mGFR measurement by 51Cr-EDTA urinary clearance. Another strength of the study was the propensity score–based matching of KTRs with CKDps, including mGFR and BP, allowing us to better analyse the impact of renal transplantation per se, independent of CKD status. Limitations of the present study include a relatively limited sample size. However, if we estimated a difference between KTRs and CKDps of 0.2%, with a rate of CF-PWV higher than the median for KTRs at 40% and that of CKDpa at 60%, we would find that a study with 130 evaluable patients per group would have 90% power, with a one-sided type I error of 0.025. It appears that we had enough patients in the two groups to highlight such a difference. Limitations also include different time windows for the two cohorts (2000–12 and 2008–17) and also a lack of data on CF-PWV at baseline for KTRs and uraemic toxin concentrations.
CONCLUSION
KTRs had significantly lower CF-PWV 1 year after transplantation than mGFR-matched non-transplant CKDps of the same age and other comparable clinical characteristics, pointing to an improvement in arterial stiffness after kidney transplantation. The reason for this improvement remains unknown. Whether differences in the generation or elimination of uraemic toxins play a role remains to be seen. Our results are compatible with the hypothesis that the cardiovascular disease of KTRs may be partially due to different causes than that of non-transplant patients with a comparable degree of CKD.
SUPPLEMENTARY DATA
Supplementary data are available at ckj online.
Supplementary Material
ACKNOWLEDGEMENTS
The NephroTest study group: Bichat University Hospital (Paris): Francois Vrtovsnik, Eric Daugas (Nephrology) and Martin Flamant and Emmanuelle Vidal-Petiot (Physiology); European Georges Pompidou University Hospital (Paris): Christian Jacquot, Alexandre Karras, Eric Thervet, Christian d’Auzac (Nephrology) and P. Houillier, M. Courbebaisse, D. Eladari and G. Maruani (Physiology); Tenon University Hospital (Paris): Jean-Jacques Boffa, Pierre Ronco, H. Fessi and Eric Rondeau (Nephrology) and Emmanuel Letavernier, Nahid Tabibzadeh, Marine Livrozet, Camille Saint-Jacques and Jean Philippe Haymann (Physiology); and INSERM (Villejuif): M. Metzger and B. Stengel. We thank nurses Martine Dapiedade, Catherine Fremy and Nathalie Dieu for their expert technical assistance.
CONFLICT OF INTEREST STATEMENT
Z.A.M. has received grants for the Chronic Kidney Disease–Renal Epidemiology and Information Network and other research projects from Amgen, Baxter, Fresenius Medical Care, GlaxoSmithKline, Merck Sharp & Dohme-Chibret, Sanofi-Genzyme, Lilly, Otsuka and the French government, as well as fees and grants to charities from Amgen, Astellas, Daichii and Sanofi-Genzyme. T.B.D. has received personal fees from Akebia, Amgen, Astellas, Chugai, F. Hoffman-La Roche, Fresenius Medical Care, GlaxoSmithKline, Kyowa Hakko Kirin and Vifor. L.C., J.P.H., S.L., N.T., E.L., J.-J.B., M.E. and M.D. have no competing financial, professional or personal interests that might have influenced the performance or presentation of the work described in this article. The results presented in this article have not been published previously in whole or part.
Contributor Information
the NephroTest Study Group:
Francois Vrtovsnik, Eric Daugas, Martin Flamant, Emmanuelle Vidal-Petiot, Christian Jacquot, Alexandre Karras, Eric Thervet, Christian d’Auzac, P Houillier, M Courbebaisse, D Eladari, G Maruani, Pierre Ronco, H Fessi, Eric Rondeau, Nahid Tabibzadeh, Marine Livrozet, Camille Saint-Jacques, Jean Philippe Haymann, M Metzger, and B Stengel
REFERENCES
- 1. London GM. Arterial structure and function in end-stage renal disease. Nephrol Dial Transplant 2002; 17: 1713–1724 [DOI] [PubMed] [Google Scholar]
- 2. Blacher J, Guerin AP, Pannier B. et al. Impact of aortic stiffness on survival in end-stage renal disease. Circulation 1999; 99: 2434–2439 [DOI] [PubMed] [Google Scholar]
- 3. Guérin AP, Pannier B, Métivier F. et al. Assessment and significance of arterial stiffness in patients with chronic kidney disease. Curr Opin Nephrol Hypertens 2008; 17: 635–641 [DOI] [PubMed] [Google Scholar]
- 4. Temmar M, Liabeuf S, Renard C. et al. Pulse wave velocity and vascular calcification at different stages of chronic kidney disease. J Hypertens 2010; 28: 163–169 [DOI] [PubMed] [Google Scholar]
- 5. Van Bortel LM, Laurent S, Boutouyrie P. et al. Expert consensus document on the measurement of aortic stiffness in daily practice using carotid-femoral pulse wave velocity. J Hypertens 2012; 30: 445–448 [DOI] [PubMed] [Google Scholar]
- 6. Williams B, Mancia G, Spiering W. et al. ESC/ESH Guidelines for the management of arterial hypertension. Eur Heart J 2018; 39: 3021–3104 [DOI] [PubMed] [Google Scholar]
- 7. Cruickshank K, Riste L, Anderson SG. et al. Aortic pulse-wave velocity and its relationship to mortality in diabetes and glucose intolerance: an integrated index of vascular function? Circulation 2002; 106: 2085–2090 [DOI] [PubMed] [Google Scholar]
- 8. Boutouyrie P, Tropeano AI, Asmar R. et al. Aortic stiffness is an independent predictor of primary coronary events in hypertensive patients: a longitudinal study. Hypertension 2002; 39: 10–15 [DOI] [PubMed] [Google Scholar]
- 9. Laurent S, Boutouyrie P, Asmar R. et al. Aortic stiffness is an independent predictor of all-cause and cardiovascular mortality in hypertensive patients. Hypertension 2001; 37: 1236–1241 [DOI] [PubMed] [Google Scholar]
- 10. Laurent S, Katsahian S, Fassot C. et al. Aortic stiffness is an independent predictor of fatal stroke in essential hypertension. Stroke 2003; 34: 1203–1206 [DOI] [PubMed] [Google Scholar]
- 11. Blacher J, Pannier B, Guerin AP. et al. Carotid arterial stiffness as a predictor of cardiovascular and all-cause mortality in end-stage renal disease. Hypertension 1998; 32: 570–574 [DOI] [PubMed] [Google Scholar]
- 12. Briet M, Bozec E, Laurent S. et al. Arterial stiffness and enlargement in mild-to-moderate chronic kidney disease. Kidney Int 2006; 69: 350–357 [DOI] [PubMed] [Google Scholar]
- 13. Verbeke F, Maréchal C, Van Laecke S. et al. Aortic stiffness and central wave reflections predict outcome in renal transplant recipients. Hypertension 2011; 58: 833–838 [DOI] [PubMed] [Google Scholar]
- 14. Dahle DO, Eide IA, Åsberg A. et al. Aortic stiffness in a mortality risk calculator for kidney transplant recipients. Transplantation 2015; 99: 1730–1737 [DOI] [PubMed] [Google Scholar]
- 15. Cheddani L, Radulescu C, Chaignon M. et al. From arterial stiffness to kidney graft microvasculature: mortality and graft survival within a cohort of 220 kidney transplant recipients. PLoS One 2018; 13: e0195928. [DOI] [PMC free article] [PubMed] [Google Scholar]
- 16. Mitchell A, Saez A, Kos M. et al. Pulse wave velocity predicts mortality in renal transplant patients. Eur J Med Res 2010; 15: 452. [DOI] [PMC free article] [PubMed] [Google Scholar]
- 17. Cosio FG, Hickson LJ, Griffin MD. et al. Patient survival and cardiovascular risk after kidney transplantation: the challenge of diabetes. Am J Transplant 2008; 8: 593–599 [DOI] [PubMed] [Google Scholar]
- 18. Port FK, Wolfe RA, Mauger EA. et al. Comparison of survival probabilities for dialysis patients vs cadaveric renal transplant recipients. JAMA 1993; 270: 1339–1343 [PubMed] [Google Scholar]
- 19. Ojo AO, Port FK, Wolfe RA. et al. Comparative mortality risks of chronic dialysis and cadaveric transplantation in black end-stage renal disease patients. Am J Kidney Dis 1994; 24: 59–64 [DOI] [PubMed] [Google Scholar]
- 20. Schnuelle P, Lorenz D, Trede M. et al. Impact of renal cadaveric transplantation on survival in end-stage renal failure: evidence for reduced mortality risk compared with hemodialysis during long-term follow-up. J Am Soc Nephrol 1998; 9: 2135–2141 [DOI] [PubMed] [Google Scholar]
- 21. Fabrizii V, Winkelmayer WC, Klauser R. et al. Patient and graft survival in older kidney transplant recipients: does age matter? J Am Soc Nephrol 2004; 15: 1052–1060 [DOI] [PubMed] [Google Scholar]
- 22. Matas AJ, Humar A, Gillingham KJ. et al. Five preventable causes of kidney graft loss in the 1990s: a single-center analysis. Kidney Int 2002; 62: 704–714 [DOI] [PubMed] [Google Scholar]
- 23. Arent S, Mallat M, Westendorp R. et al. Patient survival after renal transplantation; more than 25 years follow-up. Nephrol Dial Transplant 1997; 12: 1672–1679 [DOI] [PubMed] [Google Scholar]
- 24. Cheddani L, Liabeuf S, Essig M. et al. Higher mortality risk among kidney transplant recipients than among estimated glomerular filtration rate-matched patients with CKD-preliminary results. Nephrol Dial Transplant 2020; doi: 10.1093/ndt/gfaa026 [DOI] [PubMed] [Google Scholar]
- 25. Moranne O, Froissart M, Rossert J. et al. Timing of onset of CKD-related metabolic complications. J Am Soc Nephrol 2009; 20: 164–171 [DOI] [PMC free article] [PubMed] [Google Scholar]
- 26. Froissart M, Rossert J, Jacquot C. et al. Predictive performance of the modification of diet in renal disease and Cockcroft-Gault equations for estimating renal function. J Am Soc Nephrol 2005; 16: 763–773 [DOI] [PubMed] [Google Scholar]
- 27. Souberbielle J-C, Boutten A, Carlier M-C. et al. Inter-method variability in PTH measurement: implication for the care of CKD patients. Kidney Int 2006; 70: 345–350 [DOI] [PubMed] [Google Scholar]
- 28. Asmar R, Benetos A, Topouchian J. et al. Assessment of arterial distensibility by automatic pulse wave velocity measurement: validation and clinical application studies. Hypertension 1995; 26: 485–490 [DOI] [PubMed] [Google Scholar]
- 29. Nguyen T-L, Collins GS, Spence J. et al. Double-adjustment in propensity score matching analysis: choosing a threshold for considering residual imbalance. BMC Med Res Methodol 2017; 17: 78. [DOI] [PMC free article] [PubMed] [Google Scholar]
- 30.R Core Team. R: A Language and Environment for Statistical Computing. Vienna: R Foundation for Statistical Computing, 2018. https://www.R-project.org [Google Scholar]
- 31. Lioufas N, Hawley CM, Cameron JD. et al. Chronic kidney disease and pulse wave velocity: a narrative review. Int J Hypertens 2019; 2019: 1–11 [DOI] [PMC free article] [PubMed] [Google Scholar]
- 32. Halloran PF, Melk A, Barth C.. Rethinking chronic allograft nephropathy: the concept of accelerated senescence. J Am Soc Nephrol 1999; 10: 167–181 [DOI] [PubMed] [Google Scholar]
- 33. Smulyan H, Lieber A, Safar ME.. Hypertension, diabetes type II, and their association: role of arterial stiffness. Am J Hypertens 2016; 29: 5–13 [DOI] [PubMed] [Google Scholar]
- 34.Expert Panel on Detection, Evaluation, and Treatment of High Blood Cholesterol in Adults. Executive Summary of the Third Report of the National Cholesterol Education Program (NCEP) Expert Panel on Detection, Evaluation, and Treatment of High Blood Cholesterol in Adults (Adult Treatment Panel III). JAMA 2001; 285: 2486–2497 [DOI] [PubMed] [Google Scholar]
- 35. Mansour AS, Yannoutsos A, Majahalme N. et al. Aortic stiffness and cardiovascular risk in type 2 diabetes. J Hypertens 2013; 31: 1584–1592 [DOI] [PubMed] [Google Scholar]
- 36. Agnoletti D, Millasseau SC, Topouchian J. et al. Pulse wave analysis with two tonometric devices: a comparison study. Physiol Meas 2014; 35: 1837–1848 [DOI] [PubMed] [Google Scholar]
- 37. Melilli E, Manonelles A, Montero N. et al. Impact of immunosuppressive therapy on arterial stiffness in kidney transplantation: are all treatments the same? Clin Kidney J 2018; 11: 413–421 [DOI] [PMC free article] [PubMed] [Google Scholar]
- 38. Delahousse M, Chaignon M, Mesnard L. et al. Aortic stiffness of kidney transplant recipients correlates with donor age. J Am Soc Nephrol 2008; 19: 798–805 [DOI] [PMC free article] [PubMed] [Google Scholar]
- 39. Karras A, Boutouyrie P, Briet M. et al. Reversal of arterial stiffness and maladaptative arterial remodeling after kidney transplantation. J Am Heart Assoc 2017; 6: [DOI] [PMC free article] [PubMed] [Google Scholar]
- 40. Salgueira M, Del Toro N, Moreno-Alba R. et al. Vascular calcification in the uremic patient: a cardiovascular risk? Kidney Int 2003; 63: S119–21 [DOI] [PubMed] [Google Scholar]
- 41. McGovern AP, de Lusignan S, van Vlymen J. et al. Serum phosphate as a risk factor for cardiovascular events in people with and without chronic kidney disease: a large community based cohort study. PLoS One 2013; 8: e74996. [DOI] [PMC free article] [PubMed] [Google Scholar]
- 42. Vanholder R, Glorieux G, Massy ZA.. Intestinal metabolites, chronic kidney disease and renal transplantation: enigma variations? Nephrol Dial Transplant 2016; 31: 1547–1551 [DOI] [PubMed] [Google Scholar]
- 43. Liabeuf S, Cheddani L, Massy Z.. Uremic toxins and clinical outcomes: the impact of kidney transplantation. Toxins 2018; 10: 229. [DOI] [PMC free article] [PubMed] [Google Scholar]
- 44. Lekawanvijit S. Role of gut-derived protein-bound uremic toxins in cardiorenal syndrome and potential treatment modalities. Circ J 2015; 79: 2088–2097 [DOI] [PubMed] [Google Scholar]
- 45. Yamazaki H, Yamaguchi K, Soeki T. et al. Impact of indoxyl sulfate, a uremic toxin, on non-culprit coronary plaque composition assessed on integrated backscatter intravascular ultrasound. Circ J 2015; 79: 1773–1779 [DOI] [PubMed] [Google Scholar]
- 46. Yoshikawa D, Ishii H, Suzuki S. et al. Plasma indoxyl sulfate and estimated glomerular filtration rate. Circ J 2014; 78: 2477–2482 [DOI] [PubMed] [Google Scholar]
- 47. Liabeuf S, Neirynck N, Drüeke TB. et al. Clinical studies and chronic kidney disease: what did we learn recently? Semin Nephrol 2014; 34: 164–179 [DOI] [PubMed] [Google Scholar]
- 48. Liabeuf S, Desjardins L, Massy ZA. et al. Levels of indoxyl sulfate in kidney transplant patients, and the relationship with hard outcomes. Circ J 2016; 80: 722–730 [DOI] [PubMed] [Google Scholar]
- 49. Barreto FC, Barreto DV, Liabeuf S. et al. Serum indoxyl sulfate is associated with vascular disease and mortality in chronic kidney disease patients. Clin J Am Soc Nephrol 2009; 4: 1551–1558 [DOI] [PMC free article] [PubMed] [Google Scholar]
- 50. Liabeuf S, Laville SM, Glorieux G. et al. Difference in profiles of the gut-derived tryptophan metabolite indole acetic acid between transplanted and non-transplanted patients with chronic kidney disease. Int J Mol Sci 2020; 21: 2031. [DOI] [PMC free article] [PubMed] [Google Scholar]
Associated Data
This section collects any data citations, data availability statements, or supplementary materials included in this article.