Abstract
Currently, the majority of microscopic and endoscopic technologies utilize white light illumination. For a number of applications, hyper-spectral imaging can be shown to have significant improvements over standard white-light imaging techniques. This is true for both microscopy and in vivo imaging. However, hyperspectral imaging methods have suffered from slow application times. Often, minutes are required to gather a full imaging stack. Here we will describe the system and evaluate optimizations and applications of a novel excitation-scanning hyperspectral imaging system. We have developed and are optimizing a novel approach called excitation-scanning hyperspectral imaging that provides an order of magnitude increased signal strength. Optimization of the light path, optical components and illumination sources have allowed us to achieve high speed image acquisition. This high speed allows for potential live video acquisition.
This excitation-scanning hyperspectral imaging technology has potential to impact a range of applications. The current system allows triggering of up to 16 wavelengths at less than 1 millisecond per image using digital strobing. Analog intensity control is also provided for a fully customizable excitation profile. A significant advantage of excitation-scanning hyperspectral imaging is can identify multiple targets simultaneously in real time. We are optimizing the system to compare sensitivity and specificity of excitation-scanning hyperspectral imaging with pathology techniques. Finally, we are exploring utilizing this technology to measure cAMP distribution in three dimensions within a cell.
Keywords: Spectroscopy, excitation, hyperspectral, design, tissue imaging, microscopy, endoscopy, LED
1.0. INTRODUCTION
Successful cancer treatment and rehabilitation relies on early detection.1 White-light endoscopy techniques have been shown to miss up to 27% of small, flat adenomas.2 Hyperspectral imaging acquires spectral information for each point in the image and has been indicated as a potential improvement technology for in vivo and ex vivo microscopy and endoscopy, including lesion detection.3-8 The goal of this work was to optimize our alpha-prototype hyperspectral imaging system for microscopy and acquire preliminary biological fluorescent microscopy data for system testing and evaluation. Hyperspectral imaging has been shown to provide increased sensitivity over white-light imaging for cancer detection.9,10 In order to increase the speed of our hyperspectral imaging system, we have developed an excitation-scanning technology that allows the potential for real-time hyperspectral imaging.6 The hyperspectral illumination system can provide up to 16 wavelengths of light and can be cycled at speeds exceeding 1 ms. These results indicate a potential for hyperspectral image acquisition at over 20 frame per second (e.g., 320 bands imaged per second).
2.0. METHODS
2.1. Excitation-Scanning Hyperspectral Microscope Setup
Excitation-scanning hyperspectral imaging overcomes some limitations of traditional fluorescence emission-scanning hyperspectral imaging approaches. Signal-to-noise (SNR) is significantly increased by filtering the excitation light instead of the emission.6,11 This allows us to collect all emitted fluorescence at each wavelength. The system is comprised of off-the-shelf and in-house fabricated components. The setup of the excitation-scanning hyperspectral microcopy system is similar to a previous version.12 The detector used is a sCMOS scientific camera (Zyla 5.5, Andor). This camera was chosen due being capable of 40 frames per second over USB. The camera was connected to an inverted fluorescence microscope (Nikon Eclipse Ti), which was equipped with custom long-pass dichroic beamsplitters (Semrock). A spectral light source was connected to the illumination input of the microscope via liquid light guide. A custom illumination device was designed and built in-house and delivers up to 16 wavelengths of light into a single liquid light guide. Our current spectral excitation range is from 365 nm to 525 nm with roughly 20 nm bands. Rapid imaging is accomplished using triggered acquisition of the camera and custom control electronics within the light source that deliver digital and analog inputs to each illumination channel. Digital triggering was done via TTL signal and National Instruments control cards linked with the camera shutter’s firing signal, which allows us to switch the wavelength synchronously with the camera’s capture rate. Nikon Instruments (NIS) Elements software was used to control all aspects of the system and conduct preliminary imaging.
3.0. OPTIMIZATION AND APPLICATIONS
3.1. Optimization Methodologies
The excitation-scanning hyperspectral microscopy system has multiple potential subsystem interfaces: electronic, optical, software, and imaging. Each of these interfaces has number of variables that could be optimized. By developing the concept of operations and system architecture, we identified that portions of the light path had critical interfaces that would have significant effects on system performance. Initial optical optimization was performed using TracePro optical ray trace software (Lambda Research). The independent variable in these simulations was intensity on an integration plane representing the liquid light guide input. The optimized dependent variables included: lens focal length, lens location, LED location, and light guide location. Static sensitivity analyses were conducted using these dependent variables as parameters. Further alterations were made to the support, alignment and adjustment mechanisms used for integrating the components of hyperspectral illumination source. This allowed for more precise control of component locations, better alignment, and greater light delivery to the stage. After making these alterations, device calibration and characterization was undertaken.
3.2. Applications
Excitation-scanning hyperspectral imaging may be an effective technology for identifying multiple fluorescent molecules at high speeds. Our long-term goals are to develop a system that can be used for both microscopic and endoscopic applications. After performing the optimizations above, we evaluated the ability of the system to acquire biological fluorescence data by coupling the high-speed illuminator to a microscope via a liquid light guide. In this optical configuration, excitation light from the high-speed hyperspectral illuminator is reflected off a long-pass dichroic beam splitter to the sample through a 60x oil immersion objective, fluorescence signal is collected by the objective, passes through the long-pass dichroic beamsplitter, refined using a long-pass emission filter, and then detected by the Zyla 5.5 sCMOS camera. The camera integrates all the fluorescence as a function of each excitation wavelength and allows the acquisition of excitation-scanning spectral image data. The system is optimized to have a range of potential imaging modalities. We are able collect 1280x1080 resolution images at exposure ranging from 70 ms to 1 second depending on the sample. At higher speeds, an image resolution of 976x976 is achieved with exposure times of 10-50 ms. These modalities for imaging translate directly to video collection speeds. At these resolution, we achieved video with speeds between 3.5 and 11 spectral frames per second.
Images were collected using samples prepared for ongoing studies in or laboratory. For these proof-of-principle images, samples of cell monolayers of either pulmonary microvascular endothelial cells (PMVECs) or HEK293 cells were used. The microvascular endothelial cells were labeled with H188 FRET probe containing Turquoise donor and Venus acceptor fluorescent proteins, hydroxyphenyl fluorescein with adenylyl cyclase (HFP-AC10), and DRAQ5 (Nuclear Label, BioStatus). The HEK293 cells were labeled with the Turquoise donor fluorescent protein from the H188 FRET probe. All imaging was done using a 60x oil immersion objective to collect fluorescence emission. Each image stack was collected from 365 nm to 525 nm. Exposure times varied between 70 ms to 1 second per wavelength band depending on the sample. We have previously shown that automated subcellular analysis of second messenger signals for multilabel FRET studies can be performed using hyperspectral microscopic.13-15
4.0. RESULTS AND CONCLUSIONS
The system was tested and calibrated via an integration sphere (FIOS, Ocean Optics) calibrated using a National Institute of Standards and Technology (NIST)-traceable light source (LS-1-CAL-INT, Ocean Optics). The integrating sphere was fiber-coupled to a spectrometer (QE6500, Ocean Optics). Spectroradiometric measurements were made before the light path, at each illumination point; and after the light path, at the microscope stage. Using the measured intensities as an optimization parameter, we evaluated and adjusted our relative wavelength power delivery. Wavelength switches was synchronized with camera acquisition through NIS elements software and TTL triggering. Operational speeds were tested and we collected video and images at the following resolutions: 596x596, 976x976, and 1280x1080. Video frame rates ranged from 3.5 to 11 frames per second for the samples herein.
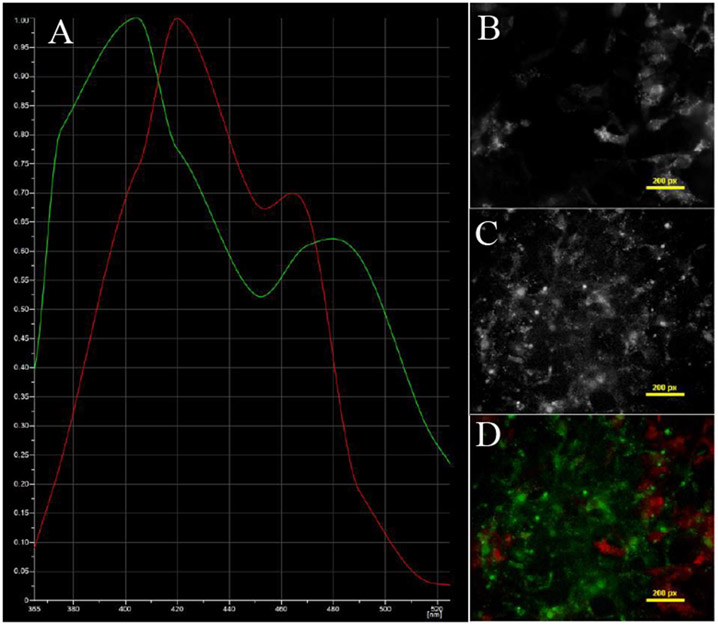
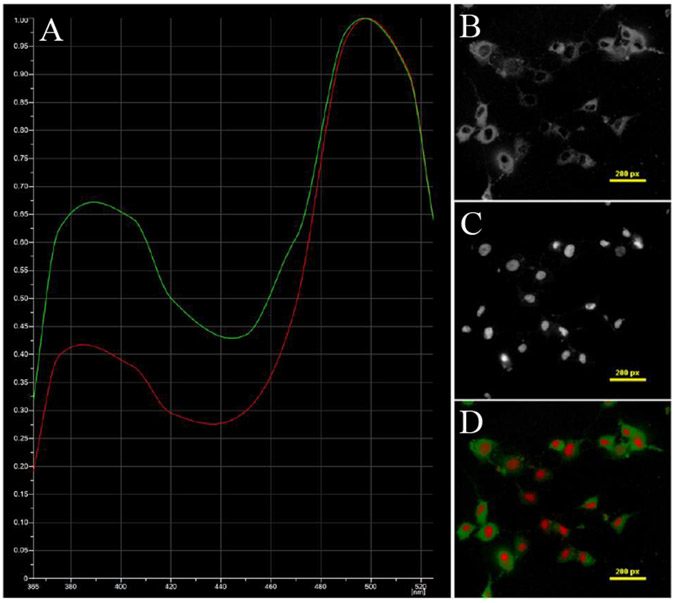
NIS Elements was used to identify regions of interest (RoI) corresponding to individual spectral signatures. The average spectrum from each region of interest was extracted and used for linear unmixing. HEK293 Turquoise sample was imaged at 70 ms exposure time with a resolution of 1280x1080. The pulmonary microvascular endothelial cells (PMVECs) were imaged with a 100 ms exposure time with a resolution of 1280x1080.
We acquired spectral image data at 1280x1080 pixel fields-of-view at speeds ranging from 3 to 11 ms. We believe this indicates that hyperspectral excitation-scanning imaging techniques show promise for improving specificity.
Additionally, we identified multiple fluorescent signatures in a single image stack. This indicates that hyperspectral excitation-scanning provides improved capability in terms of multiplexing. Further, we have shown real-time, high speed, high quality imaging and video with multi and hyperspectral systems. These improvements can translate to improved detection specificity and sensitivity in clinical imaging devices. Our work indicates that fluorescence excitation-scanning hyperspectral imaging shows promise as hyperspectral imaging modality for very high-speed imaging.
5.0. FUTURE WORK
Future work will focus on optimizing the light path further to increase our illumination delivery. Additionally, we are identifying more powerful diodes and further software development. Many of the diodes available do not overlap our operational ranges. Additional optical equipment may be needed to collect more of the power output from each diode. We are also developing a fluorescence excitation library of commonly used fluorescent labels. This will be necessary to use the image data for diagnosis and interpretation. Finally, we are looking to develop analysis tools based on collected spectral information to automate detection of regions of interest.
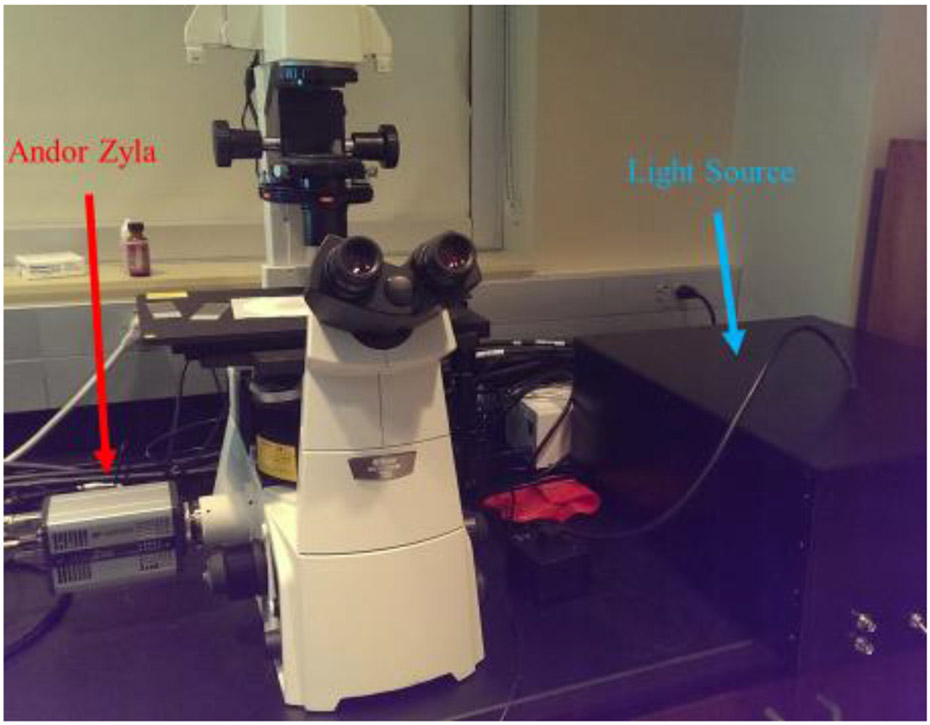
Figure 1 –
A photograph of the beta prototype system is shown above. The custom high-speed hyperspectral illumination source produces illumination that is passed through a liquid light guide into a Nikon Eclipse Ti microscope. The illumination reflects off a dichroic filter up through a 60x objective to the stage. An Andor Zyla sCMOS camera is connected to the left port on the microscope to acquire images.
Figure 2 –
HEK293 cells labeled with the Turquoise donor fluorescent protein from H188 FRET probe. The A) spectra of B) the Turquoise label and C) autofluorescence were unmixed. D) The false-colored unmixed image stack is shown.
Figure 3 –
PMVECs labeled with HFP-AC10 and DRAQ5. The A) spectra of B) adenylyl cyclase and C) DRAQ5 were identified and unmixed. D) The false-colored unmixed image stack is shown.
6.0. ACKNOWLEDGEMENTS
The authors give thanks to the Alabama Space Grant Consortium, NIH grants P01 HL066299, UL1 TR001417, and the Abraham Mitchell Cancer Research Fund for their support.
REFERENCES
- [1].Kester RT, Bedard N, Gao L, and Tkaczyk TS, “Real-time snapshot hyperspectral imaging endoscope,” Journal of Biomedical Optics 16(5), 056005–056005 (2011). [DOI] [PMC free article] [PubMed] [Google Scholar]
- [2].Dekker E, and Fockens P, “Advances in colonic imaging: new endoscopic imaging methods,” Journal of Gastroenterology 17(8), 803–808 (2005). [DOI] [PubMed] [Google Scholar]
- [3].Vo-Dinh T, “A hyperspectral imaging system for in vivo optical diagnostics,” IEEE Engineering in Medicine and Biology Magazine 23(5), 40–49 (2004). [DOI] [PubMed] [Google Scholar]
- [4].Leavesley S, Jiang Y, Patsekin V, Rajwa B, and Robinson JP, “An excitation wavelength scanning spectral imaging system for preclinical imaging,” Review of Scientific Instruments 79(2), 23707–23707–10 (2008). [DOI] [PubMed] [Google Scholar]
- [5].Leavesley SJ, Annamdevula N, Boni J, Stocker S, Grant K, Troyanovsky B, Rich TC, and Alvarez DF, “Hyperspectral imaging microscopy for identification and quantitative analysis of fluorescently-labeled cells in highly autofluorescent tissue,” Journal of Biophotonics 5(1), 67–84 (2012). [DOI] [PMC free article] [PubMed] [Google Scholar]
- [6].Favreau PF, Hernandez C, Heaster T, Alvarez DF, Rich TC, Prabhat P, and Leavesley SJ, “Excitation-scanning hyperspectral imaging microscope,” Journal of Biomedical Optics 19(4), 046010–046010 (2014). [DOI] [PMC free article] [PubMed] [Google Scholar]
- [7].Favreau P, Hernandez C, Lindsey AS, Alvarez DF, Rich T, Prabhat P, and Leavesley SJ, “Thin-film tunable filters for hyperspectral fluorescence microscopy,” Journal of Biomedical Optics 19(1), 011017–011017 (2013). [DOI] [PMC free article] [PubMed] [Google Scholar]
- [8].Schultz RA, Nielsen T, Zavaleta JR, Ruch R, Wyatt R, and Garner HR, “Hyperspectral imaging: A novel approach for microscopic analysis,” Cytometry 43(4), 239–247 (2001). [DOI] [PubMed] [Google Scholar]
- [9].Hirsch FR, Prindiville SA, Miller YE, Franklin WA, Dempsey EC, Murphy JR, Bunn PA, and Kennedy TC, “Fluorescence Versus White-Light Bronchoscopy for Detection of Preneoplastic Lesions: a Randomized Study,” Journal of the National Cancer Institute 93(18), 1385–1391 (2001). [DOI] [PubMed] [Google Scholar]
- [10].Haringsma J, Tytgat GNJ, Yano H, Iishi H, Tatsuta M, Ogihara T, Watanabe H, Sato N, Marcon N, et al. , “Autofluorescence endoscopy: Feasibility of detection of GI neoplasms unapparent to white light endoscopy with an evolving technology,” Gastrointestinal Endoscopy 53(6), 642–650 (2001). [DOI] [PubMed] [Google Scholar]
- [11].Annamdevula NS, Sweat B, Favreau P, Lindsey AS, Alvarez DF, Rich TC, and Leavesley SJ, “An Approach for Characterizing and Comparing Hyperspectral Microscopy Systems,” Sensors 13(7), 9267–9293 (2013). [DOI] [PMC free article] [PubMed] [Google Scholar]
- [12].Mayes SA, Leavesley SJ, and Rich TC, “Excitation-scanning hyperspectral imaging system for microscopic and endoscopic applications,” 2016, 97110Z–97110Z–5. [DOI] [PMC free article] [PubMed] [Google Scholar]
- [13].Leavesley SJ, Britain AL, Cichon LK, Nikolaev VO, and Rich TC, “Assessing FRET using spectral techniques,” Cytometry. Part A: The Journal of the International Society for Analytical Cytology 83(10), 898–912 (2013). [DOI] [PMC free article] [PubMed] [Google Scholar]
- [14].Leavesley SJ, Nakhmani A, Gao Y, and Rich TC, “Automated image analysis of FRET signals for subcellular cAMP quantification,” Methods in Molecular Biology (Clifton, N.J.) 1294, 59–70 (2015). [DOI] [PubMed] [Google Scholar]
- [15].Rich TC, Britain AL, Stedman T, and Leavesley SJ, “Hyperspectral imaging of FRET-based cGMP probes,” Methods in Molecular Biology (Clifton, N.J.) 1020, 73–88 (2013). [DOI] [PubMed] [Google Scholar]


