

Abstract
The temporal order of DNA replication (replication timing; RT) is correlated with chromatin modifications and 3D genome architecture, however causal links have not been established, largely due to an inability to manipulate the global RT program. We show that loss of RIF1 causes near complete elimination of the RT program by increasing heterogeneity between individual cells. RT changes are coupled with widespread alterations in chromatin modifications and genome compartmentalization. Conditional depletion of RIF1 causes replication-dependent disruption of histone modifications and alterations in genome architecture. These effects were magnified with successive cycles of altered RT. These results support models in which the timing of chromatin replication and thus assembly plays a key role in maintaining the global epigenetic state.
One Sentence Summary:
Replication timing controlled by RIF1 helps to dictate chromatin state and 3D genome organization.
DNA is replicated during S phase of the cell cycle in a temporal order known as the replication timing (RT) program. RT is conserved among eukaryotes, developmentally controlled, and correlates with many important epigenomic features (1). Early replicating chromatin generally contains active histone modifications, is located in the nuclear interior and correlates with the A compartment defined by Hi-C (2) while late replicating chromatin is associated with transcriptionally repressive histone modifications, localization at the nuclear periphery, and the B-compartment. Histone modifications are both recycled from parental chromatin and added de novo after passage of the replication fork with different chromatin states showing differing dynamics of reassembly (2, 3). Despite these close correlations, the mechanistic link between RT and the accurate maintenance of chromatin through cell cycles remains elusive. It has long been hypothesized that RT influences chromatin maintenance. Indeed, microinjection of plasmids into mammalian nuclei revealed that plasmids replicated in early S phase were decorated with acetylated histones, while those replicated later in S phase were devoid of acetylated histones (4, 5). However, there is no direct evidence implicating RT in epigenetic state maintenance, largely due to the inability to manipulate genome wide RT. The conserved protein RIF1 has been shown to affect RT in many eukaryotes, however, because the effects have been partial or localized, RIF1 disruption has not been exploited to study the effects of RT abrogation (6, 7).
RIF1 KO causes heterogenous RT
To gain insight into the role of genome-wide RT in shaping the epigenome we knocked out (KO) RIF1 in H9 hESC, HCT116, and HAP1 cell lines (Fig. S1, A to C). As previously reported (8), all three RIF1 KO cell lines proceeded through the cell cycle with nearly WT kinetics (Fig. S1, D and E) and exhibited genome wide aberrations in RT albeit with varying degrees of severity (Fig. 1A). Similar to prior reports in mammalian cells (6), domains changed RT either from early to late (EtL) or late to early (LtE) in log2(E/L) RT profiles of HCT116 and HAP1 cells. RIF1 KO caused 43% of the genome to change RT in HCT116 (23% EtL and 20% LtE) and 39% to change in HAP1 cells (20% EtL and 19% LtE) (Fig S1F). However, in H9 hESCs (Fig. 1A), nearly the entire genome acquired a log2(E/L) close to zero (Fig S1F). RIF1 control of RT in hESCs was dosage dependent as partial knockdown (KD) of RIF1 in H9 hESCs (Fig S2A) resulted in a partial effect on the RT program (Fig S2B and C). Replication foci (9) in RIF1 KO cells showed a ‘blending’ of early and middle spatial patterns (Fig S3). These results demonstrate a considerably more extensive role for RIF1 in RT control in hESCs versus other cell types.
Fig. 1. RIF1 controls RT by reducing cell to cell variation in replication timing.
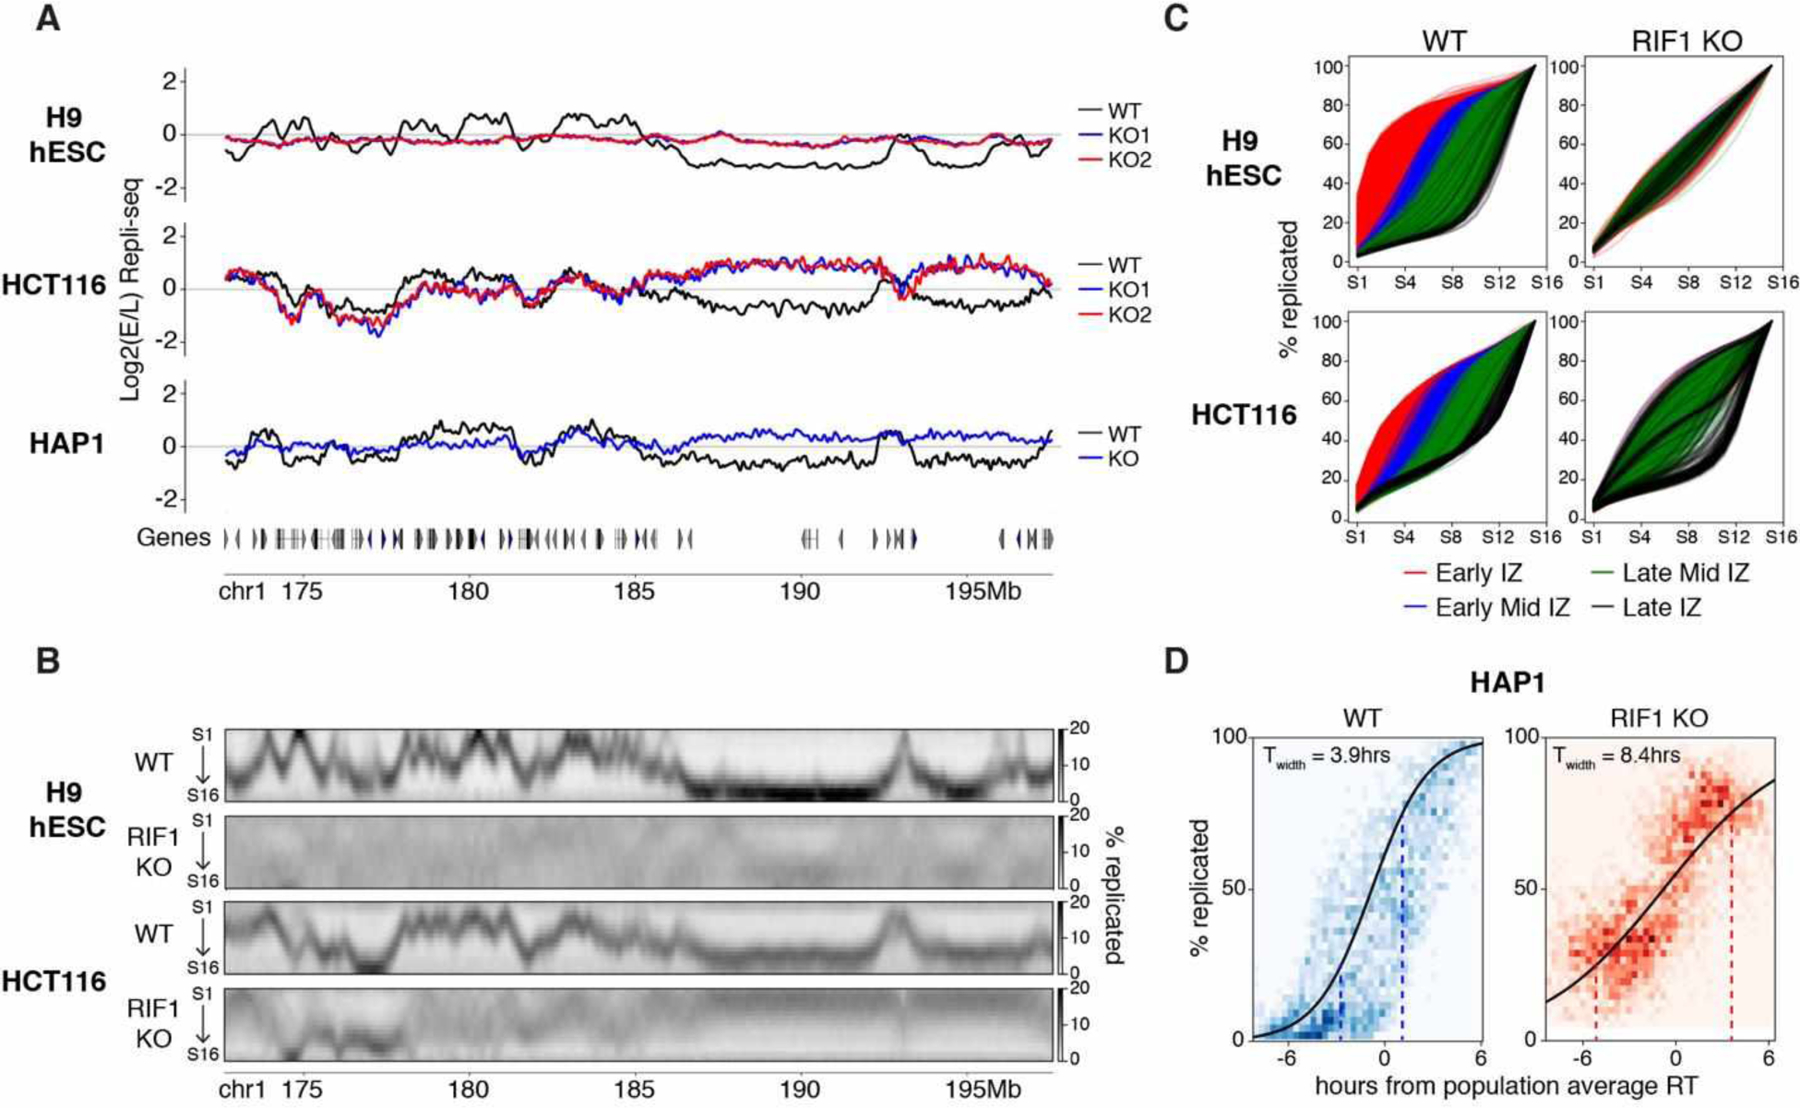
(A) Log2(E/L) Repli-seq plots of Chr1 172.6–197.6 Mb in WT (black) and two RIF1 KO clones (blue and red) in H9 hESCs (top) and HCT116 (middle) and HAP1 (bottom) cell lines. (B) High resolution Repli-seq plots of Chr1 172.6–197.6 Mb in WT and RIF1 KO in H9 hESCs (top two) and HCT116 (bottom two); same locus as (A). (C) Cumulative percent-replicated plots for each IZ called in WT cells versus S phase fraction of 16 fraction Repli-seq color coded by their timing (red: early, blue: early mid, green: late mid, black: late). (D) Sigmoidal fitting of the percentage replicated (y-axis) against time in hours from population average RT (x-axis) for HAP1 WT (left) and RIF1 KO (right). The heatmaps (blue: WT and red: KO) represent the data spread for all 50kb bins genome wide in all cells. Dotted lines at 25% of cells replicated and 75% of cells replicated indicate the span of Twidth.
Previous reports have interpreted RT changes in RIF1 KO cells as distinct RT switches (6) but the severity of the RT phenotype in RIF1 KO hESCs suggested an alternative mechanism. To address this, we performed high resolution Repli-seq (10) (Fig S4A) in RIF1 KO cells, which identifies peaks of replication initiation termed initiation zones (IZs) and valleys of late replication containing broadly distributed, low efficiency initiation events (10). We detected dramatic diffusion of RT patterns and loss of defined IZs in both HCT116 and H9 hESCs (Fig 1B, S4B) indicating major RT variation within the cell population (Fig S4C and D). Most remarkably, there was a nearly complete genome-wide abrogation of the RT program in RIF1 KO H9 hESCs (Fig 1B and S4B). In RIF1 KO HCT116 cells, EtL and LtE regions called using E/L Repli-seq showed substantial loss of temporal control (Fig S4E and F). Even early regions that were not called as EtL switches in E/L Repli-seq also lost defined patterns (Compare Figs. 1A and B, S4E and F) indicating that the entirety of the early replicating genome lost RT specificity upon RIF1 KO in both cell lines. By contrast, many late replicating regions in HCT116 retained late replication (Fig S4E and F) indicating a RIF1-independent mechanism controlling RT for these regions. We next divided each IZ called in WT high resolution Repli-seq into four S phase timing classes (10) and plotted the cumulative percentage of DNA replicated through S phase (Fig 1C). WT cells showed typical segregation of IZs according to the temporal order (10) while RIF1 KO cells showed major overlap of IZ classes and flatter sigmoidal-like curves (Fig 1G). We subsequently calculated the genome wide heterogeneity parameter Twidth which is positively correlated with heterogeneity (Methods). We found that genome wide Twidth was greatly increased in both cell types upon RIF1 KO (Fig S4G) indicating a significant increase in RT heterogeneity.
To directly validate increased cell to cell RT heterogeneity in RIF1 KO we performed single-cell Repli-seq (11) on HAP1 WT and RIF1 KO cells. RIF1 KO cells showed co-replication of early and late domains within the same cell (Fig S5) and significantly larger Twidth compared to WT (Fig 1D) directly confirming that RIF1 KO disrupts RT by substantially increasing RT heterogeneity rather than causing discrete RT shifts in all cells.
RIF1 KO alters distribution of heterochromatic histone modifications
To map RIF1 binding, we performed Cut&Run against GFP on GFP tagged RIF1 in HCT116 and H9 hESCs (Fig S6A). RIF1 was enriched in the late replicating portion of the genome in both cell lines (Fig S6B and C) and bound chromatin in broad domains (Fig 2A). In both cell lines, RIF1 binding was enriched at regions that lost RT control upon RIF1 KO (affected regions) (Fig 2, A, B, and E, S6D to F) while those regions that maintained their late RT (unaffected regions) had low RIF1 enrichment (Fig 2, C, D, and E, S6D and E). However, in RIF1 KO H9 hESCs, the regions defined as ‘unaffected regions’ are rare and still display RT dysregulation, but significantly less than ‘affected regions’ (compare Fig 2D to Fig 2B, Methods).
Fig. 2. RT affected and unaffected late regions are distinct classes of chromatin.
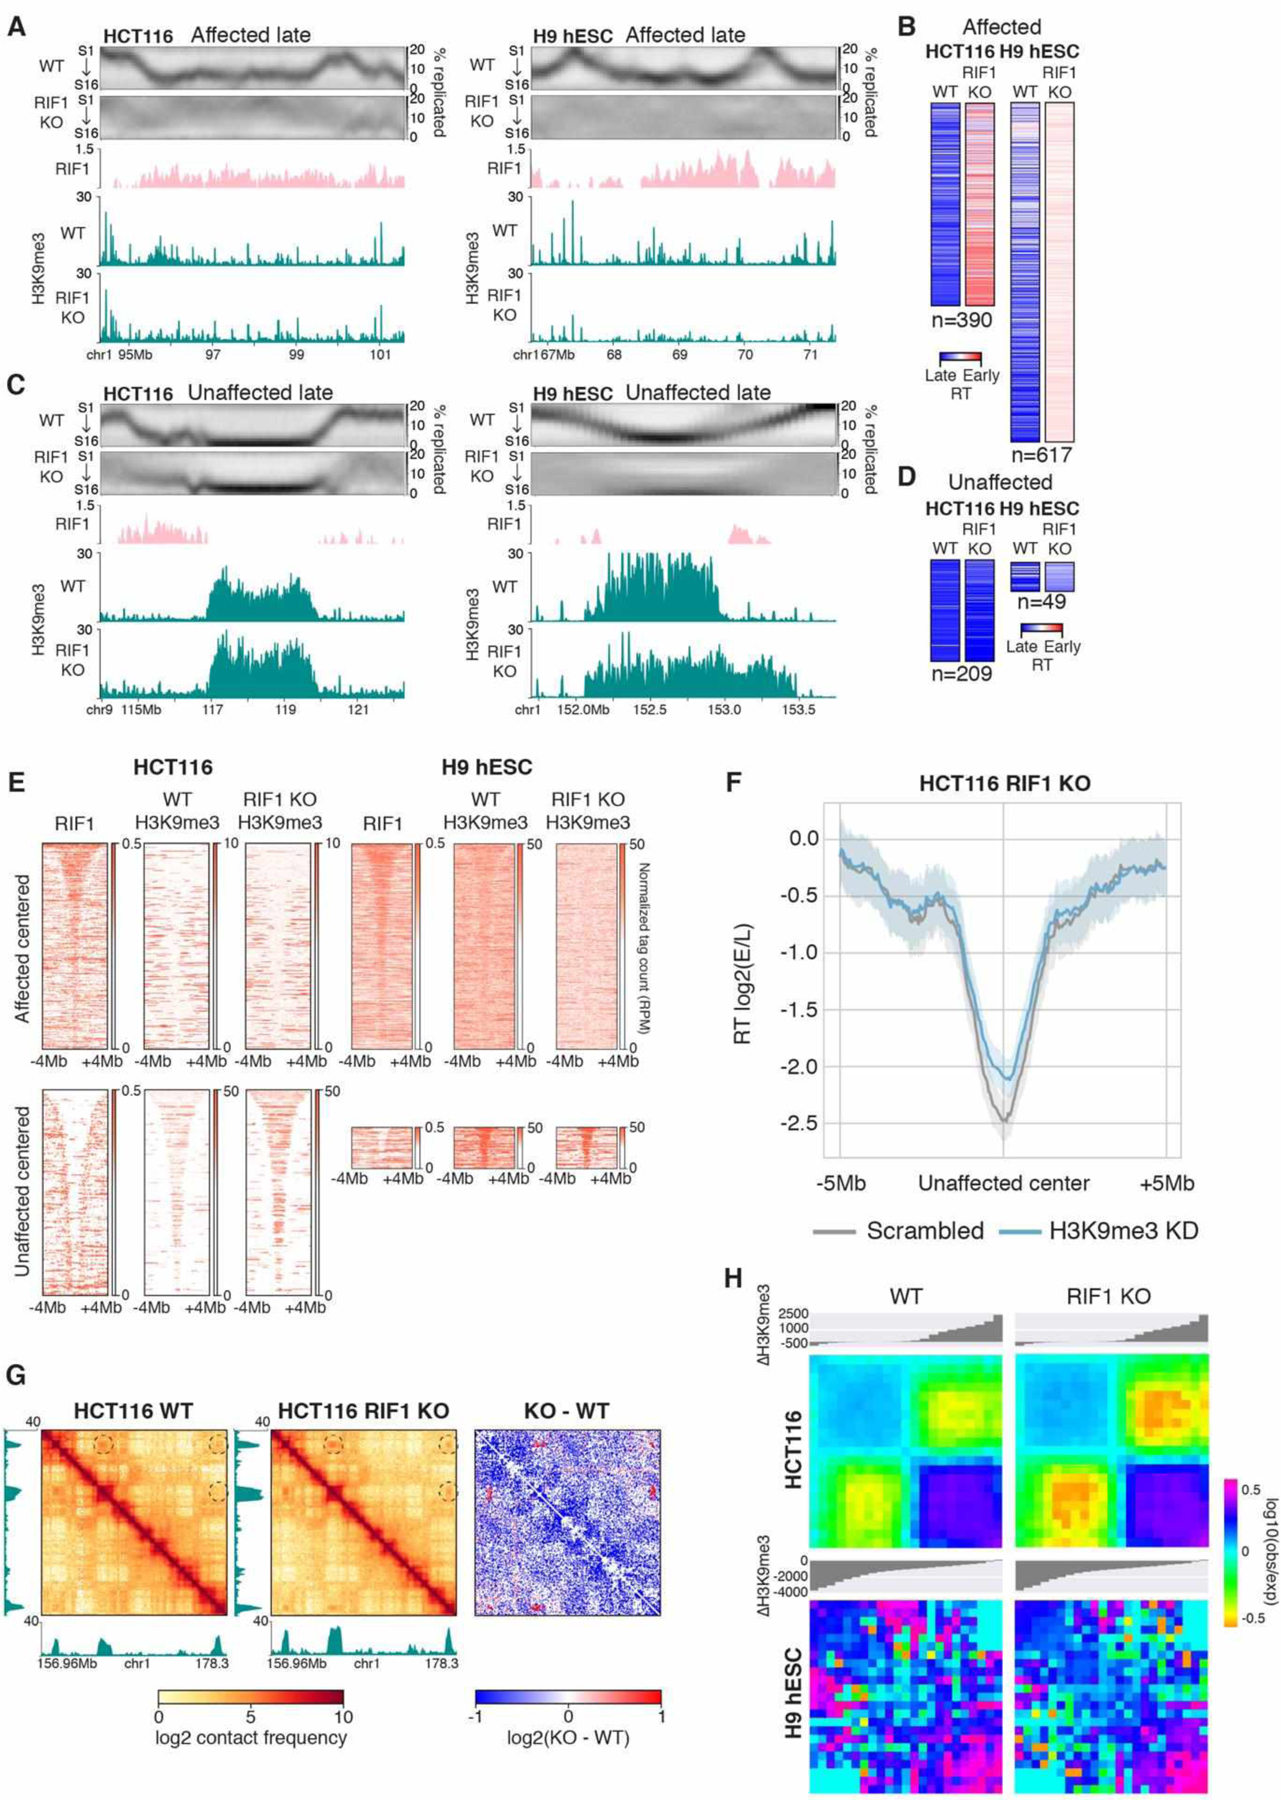
(A) Affected late region at Chr1 94.3–101.6 Mb in HCT116 (left) and Chr1 66.75–71.4 Mb in H9 hESCs (right) showing from top to bottom: high resolution Repli-seq in WT and RIF1 KO cells, RIF1 fold enrichment in WT cells, and H3K9me3 ChIP-seq tag counts in WT and RIF1 KO cells. (B) Heat maps of RT indices for affected late regions in WT and RIF1 KO of HCT116 and H9 hESCs. (C) Unaffected late region at Chr9 113.95–122.3 Mb in HCT116 (left) and Chr1 151.7–153.75 Mb in H9 hESCs (right) showing the same panels as (A). (D) Heat maps of RT indices for unaffected late regions in WT and RIF1 KO of HCT116 and H9 hESCs. (E) RIF1 and H3K9me3 in HCT116 (left) and H9 hESC (right) WT or RIF1 KO cells centered on affected late regions (top) or unaffected late regions (bottom) ±4 Mb and sorted by size. (F) Mean log2(E/L) Repli-seq scores centered at all unaffected late regions ±5 Mb in HCT116 RIF1 KO scrambled control (grey) or H3K9me3 KD (blue) cells. Shadow represents 95% confidence interval. (G) H3K9me3 tag count tracks beside ICE normalized Hi-C and subtraction contact maps of HCT116 WT and RIF1 KO at Chr1 156.95–178.3Mb. Dotted circles denote regions of increased interaction. (H) Log10(obs/exp) aggregate interactions between late regions in WT and RIF1 KO HCT116 (top) and H9 hESCs (bottom). The interactions were binned into 11 equal segments, which were ranked by increasing ΔH3K9me3 where negative and positive values respectively indicate decrease and increase in H3K9me3 in RIF1 KO compared to WT.
We next performed ChIP-seq (spike-in) on the late replication associated histone mark H3K9me3 in RIF1 KO cells (Fig S7). In WT cells, affected regions were enriched for smaller H3K9me3 peaks while unaffected regions contained large H3K9me3 domains (Fig 2, A, C, and E, S8A and B). In HCT116, small H3K9me3 peaks at affected regions (n=390) were lost (Fig 2, A and E), while the large H3K9me3 domains at unaffected regions (n=209) were strengthened (Fig 2, C and E). H3K9me3 was globally depleted in H9 hESCs (Fig S8C, D). The rare unaffected domains in RIF1 KO H9 hESCs (n=49) were large H3K9me3 domains that were only slightly diminished for H3K9me3 compared to affected domains (Fig 2E). H3K9me3 depletion in HCT116 RIF1 KO cells (Fig S8F, Methods) caused partial earlier replication of unaffected regions (Fig 2F, Fig S8G, H) indicating a role for H3K9me3 in their late replication but implicating additional unknown mechanisms (possibly association with the nuclear lamina) in maintaining late RT at unaffected regions. By contrast, RIF1 KO caused cell type specific changes to H3K27me3 with H9 hESCs primarily exhibiting downregulation and overall upregulation in HCT116 (Fig S9). These results reveal that multiple mechanisms, including RIF1 and large H3K9me3 domains, orchestrate late RT to different extents in different cell types.
Affected and unaffected late replicating regions form separate interaction hubs
The strong association between late replication and B compartmentalization (12) compelled us to investigate the genomic compartmentalization of RIF1 KO cells by Hi-C. Surprisingly, we found that affected and unaffected regions had distinct PC1 eigenvector associations despite being similarly late replicating in WT cells and this distinction was furthered upon RIF1 KO (Fig S10A). WT interactions between unaffected regions were significantly stronger than interactions between affected regions or those between unaffected regions and affected regions (Fig S10B). Upon RIF1 KO, unaffected regions formed new interactions and strengthened existing interactions (Fig 2G, S10C). Strengthened interactions were correlated with upregulated H3K9me3 domains (Fig S10D). We then sorted affected and unaffected regions according to the extent of H3K9me3 changes (negative: downregulated, positive: upregulated) and calculated their interaction frequencies. In WT cells upregulated and downregulated H3K9me3 peaks form separate interaction hubs (Fig 2H left column) that were strengthened and weakened respectively upon RIF1 KO (Fig 2H right column), accentuating the separation between the two. In individual cases, the juxtaposition of affected/unaffected domains created new compartment and TAD boundaries (Fig S10 E and F). These results demonstrate that affected and unaffected H3K9me3 regions are two intrinsically different classes of late replicating chromatin with distinct interaction preferences; unaffected domains form strong interactions with one another to form a compartment that maintains late RT without RIF1 while affected domains form a separate hub of interactions and require RIF1 to enforce late replication.
RIF1 KO causes depleted active histone modifications and attenuated A compartment interactions
ChIP-seq of H3K27ac (spike-in) and H3K4me3 revealed that both marks became depleted in both RIF1 KO cells (Fig S7, S11A to C). Loss of active marks from the A compartment was concurrent with changes in compartmentalization and Hi-C interactions in both cell lines. In H9 hESCs, the majority of compartment changes involved the disappearance of A compartment chromatin into neighboring B compartments (Fig 3A and B; Fig S11D), while HCT116 exhibited discrete shifts in compartmentalization in both directions (Fig 3A, Fig S11D and E). Loss of A compartment interactions in Hi-C contact maps corresponded to reduced H3K27ac peaks in both cell lines [Fig 3C (inset arrows), Fig S11F (arrows)]. Within A to B compartment switches, the levels of H3K27ac and H3K4me3 were significantly depleted (Fig 3D) and the interactions between H3K27ac peaks were reduced (Fig 3E). These data show that depletion of active histone modifications, particularly H3K27ac, strongly correlates with loss of A compartment interactions in RIF1 KO cells.
Fig. 3. RIF1 KO causes global alterations of compartments and epigenetic state.
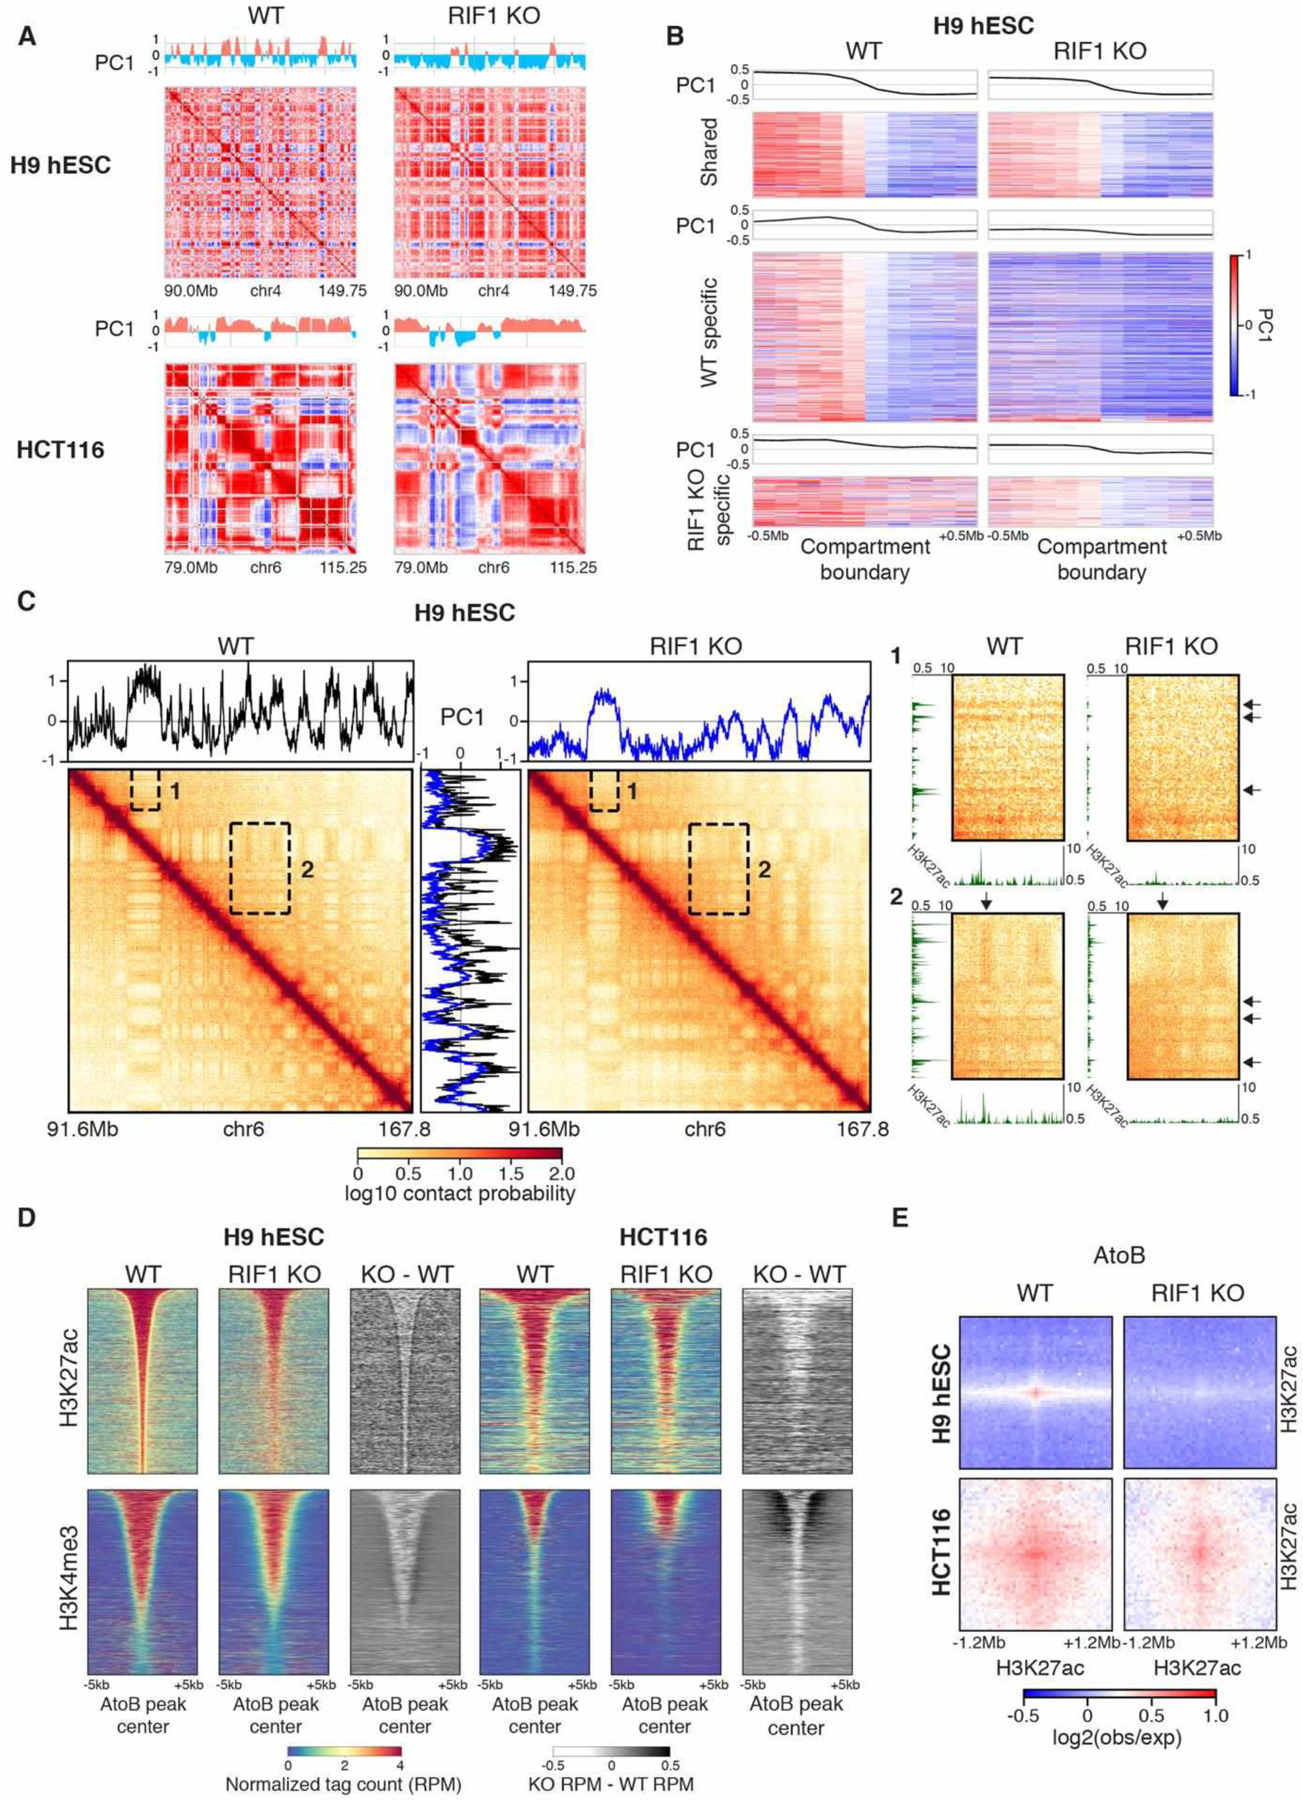
(A) Correlation matrices and PC1 Eigenvector of Chr4 90.0–149.75Mb in WT and RIF1 KO H9 hESCs (top) and Chr6 79.0–115.25Mb in WT and RIF1 KO HCT116 (bottom). (B) Heatmaps of PC1 values centered on shared (top), WT specific (middle), and RIF1 KO specific (bottom) compartment boundaries ±0.5 Mb in WT and RIF1 KO H9 hESCs. (C) ICE normalized Hi-C contact map of Chr6 91.6–167.8 Mb in H9 hESC WT and RIF1 KO cells with accompanying PC1 Eigenvector plots (black: WT, blue: KO). To the right are expanded views of insets 1 and 2 with accompanying H3K27ac ChIP-seq plots. Arrows indicate compartments and ChIP-seq peaks that are lost upon RIF1 KO. (D) Normalized tag counts (RPM) signal and subtraction plots for H3K27ac and H3K4me3 centered on peaks within AtoB compartment switching regions ± 5kb in WT and RIF1 KO cells sorted by peak size. (E) Aggregate Hi-C log2(obs/exp) interactions between H3K27ac peaks within AtoB compartment switching regions ±1.2 Mb in WT and RIF1 KO cells.
Both cell lines exhibited genome wide weakening of A/A compartment interactions accompanied by strengthening of B/B compartment interactions (Fig S12A). This was further confirmed when we called statistically significant differential interactions using diffHiC. Strengthened interactions were seen predominantly within the B compartment and weakened interactions were concentrated in the A compartment in both cell lines (Fig S12B and C). This is likely the combined effect of strengthened interactions between upregulated H3K9me3 domains within the B compartment (Fig S12D) and weakened interactions between downregulated H3K27ac peaks in the A compartment (Fig S12E) and suggests a redefining of compartment identities in RIF1 KO cells. EtL and LtE regions showed occasional loss and gain of TAD boundaries respectively (Fig S13A) but globally, the positioning and number of TAD boundaries was not significantly affected by RIF1 KO in either cell line (Fig S13B), while the strength of TAD boundaries was increased (Fig S13 C and D) independent of RAD21 binding (Fig S14). Together these data indicate a substantial reorganization of genomic compartments correlating with epigenome changes in RIF1 KO cells.
DNA replication is required for epigenomic changes
To directly address RIF1’s primary role, we used an auxin inducible degron system (13) in HCT116 cells to rapidly degrade RIF1 (Fig S15A). We first confirmed that RT defects observed in RIF1 KO occur during the first S phase after RIF1 loss (Fig S15B and C) by degrading RIF1 in G1-synchronized cells and performing E/L Repli-seq (Methods) upon release into S phase. We next synchronized cells in G1, degraded RIF1, and either held them in G1 or released them into early, middle, or late S phase/G2 (Fig S15D and E), and performed Hi-C and ChIP-seq. We found no significant difference in genome organization between RIF1 degraded and control cells held in G1 (Fig 4A, S16A to F). We observed extensive architectural changes at both A and B compartment chromatin as control cells transition from G1 into and through S phase (Fig 4A, S16A to F), controlled for copy number (Fig S16G), characterized by initial increase and subsequent decrease in interaction frequencies within A compartment and the converse within B compartment regions (Fig 4A, control lines). RIF1 KD cells showed diminished dynamics with decreased intra-A interactions and increased intra-B interactions during early S phase and the reverse during mid and late S phase compared to control cells (Fig 4A KD lines, S16C to F). These changes are coincidental with RT disruptions at corresponding loci (Fig 4B, S16H). These results demonstrate that RIF1 is required for extensive architectural changes during S phase, suggesting that these changes are linked to the normal temporal order of replication.
Fig. 4. Epigenome affects require DNA replication and occur during the first S phase after RIF1 degradation.

(A) Average log2(observed/expected) within top 10% A- (top panel) and B- (bottom panel) compartment in control (black line) and RIF1 KD (gray line) cells at G1, early S, middle S, and late S/G2 time points. (B) Interaction frequency differences between control and RIF1 KD at top 10% EtL and LtE regions at G1, early S, middle S and late S/G2 timepoints whose RT is indicated by average high resolution Repli-Seq heatmaps. (C) H3K27ac ChIP-seq of Chr7 128–131.9 Mb in control (top), RIF1 KD (middle), and domainogram (bottom) indicating -log2 (Benjamini-Hochberg adjusted p-values) calculated for the differences of control subtracted from KD tracks (Methods) at G1, early S, middle S, and late S/G2 time points. (D) Heatmap showing log2(KD/control) of H3K27ac peaks at G1, early S, middle S, and late S/G2 time points. (E) H3K9me3 ChIP-seq of Chr10 64.05–67.6Mb in control (top), RIF1 KD (middle), and domainogram (bottom) at G1, early S, middle S, and late S/G2 time points. (F) Heatmap showing log2(KD/control) of H3K9me3 peaks at affected regions at G1, early S, middle S, and late S/G2 time points. (G) H3K9me3 ChIP-seq of Chr1 4.05–5.0 Mb in control (top), RIF1 KD (middle), and domainogram (bottom) at G1, early S, middle S, and late S/G2 time points. (H) Heatmap showing log2(KD/control) of H3K9me3 domains at unaffected regions at G1, early S, middle S, and late S/G2 time points.
H3K27ac and H3K9me3 ChIP-seq (spike-in) also revealed no significant difference between RIF1 degraded and control cells held in G1 (Fig 4C to H, S17A and B, G1 data), indicating that histone mark changes are also not a direct result of RIF1 loss. H3K27ac peaks were not depleted until cells reached middle S phase with the extent of depletion greatest at late S phase [Fig 4C, D, S17A (blue dots) and C] suggesting that disruption of early-enriched histone marks takes place only when they are replicated late. H3K9me3 peaks at affected regions became depleted in late S/G2 [Fig 4E, F, S17B (blue dots) and D] while H3K9me3 domains at unaffected regions became more enriched for H3K9me3 at late S phase/G2 [Fig 4G, H, S17B (red dots) and E]. Together these results indicate that disruption of genomic structure and chromatin identity in RIF1 degraded cells is a result of a dysregulated DNA replication program.
Epigenomic changes are quantitatively correlated with lengths of RT dysregulation
We further hypothesized that extended degradation of RIF1 and RT disruption through multiple rounds of DNA replication would exacerbate the observed epigenomic phenotypes. To test this, we degraded RIF1 for 24, 48, and 96 hours (Fig S18A) constituting ~1, 2, and 4 cell cycles respectively. After 24 hours of RIF1 degradation the RIF1 KO RT phenotype was fully recapitulated and remained so throughout the time course (Fig S17B and C). H3K27ac peaks that were depleted in RIF1 KO cells, and the interactions between them, progressively diminished toward RIF1 KO levels with time (Fig 5A and B, S18D to F). H3K9me3 peaks at affected late replicating regions became significantly depleted after 24 hours of RIF1 degradation and remained depleted throughout the time course (Fig 5C and D, S18G and H). Unaffected regions progressively accumulated H3K9me3 throughout the time course (Fig 5E and F, S18H and I), however the strengthening of interactions between H3K9me3 domains seen in RIF1 KO was not observed even after 96 hours of RIF1 degradation (Fig S18J). Sorting chromatin interactions by ΔRT revealed that regions that changed RT (both EtL and LtE) gradually lost interactions with regions of normally similar RT (Fig 5G, upper left and lower right corners) and gained interactions with regions of normally different RT (Fig 5G, upper right and lower left corners), indicating a strong correlation between RT loss and disruption of chromatin contacts. Together these data show that as cells progress through multiple rounds of DNA replication with dysregulated RT, they gradually accumulate aberrant epigenomic and structural signatures, supporting the model that stochastic RT gradually affects newly synthesized chromatin with each round of mis-timed chromatin assembly.
Fig. 5. Epigenome affects are exacerbated as cell cycle without RT control.

(A) H3K27ac ChIP-seq of Chr7 128–131.9 Mb in control (top), RIF1 KD (middle), and domainograms (bottom) in control, 24hr, 48hr, 96hr degradation, and RIF1 KO. (B) Heatmap showing log2(KD/control) of H3K27ac tags at 24hr, 48hr, 96hr degradation, and RIF1 KO. (C) H3K9me3 ChIP-seq of Chr10 64.05–67.6Mb in control (top), RIF1 KD (middle), and domainograms (bottom) in control, 24hr, 48hr, 96hr degradation, and RIF1 KO. (D) Heatmap showing log2(KD/control) of H3K9me3 tags at affected regions in 24hr, 48hr, 96hr degradation, and RIF1 KO. (E) H3K9me3 ChIP-seq of Chr1 4.05–5.0 Mb in control (top), RIF1 KD (middle), and domainograms (bottom) in control, 24hr, 48hr, 96hr degradation, and RIF1 KO. (F) Heatmap showing log2(KD/control) of H3K9me3 tags at unaffected regions in 24hr, 48hr, 96hr degradation, and RIF1 KO. (G) Subtraction saddle plots of cis log2(observed/expected) contacts of control sample from 24hr, 48hr, 96hr degradation, and RIF1 KO sorted by ΔRT (KD RT - Control RT). (H) Model figure illustrating the role of RT in epigenome maintenance. In WT cells RIF1 prevents replication initiation factors from activating replication within repressive chromatin, allowing early replication of active chromatin which is then assembled with active histone marks (red flags) which self-interact to form the A compartment. Repressive chromatin is replicated in late S phase and is assembled with repressive histone marks (blue balls) which self-interact to form the B compartment. The B compartment is divided into regions that depend on RIF1 for late replication (affected) and those that do not (unaffected). RIF1 KO allows limiting replication initiation factors to associate heterogeneously with both active and repressive chromatin, delaying replication of the former and advancing replication of the latter. Delayed replication of active chromatin causes depletion of active histone marks and weakens interactions within the A compartment. Advanced replication of affected repressive chromatin causes depletion of repressive histone marks and weakens interactions within the affected B compartment hub. Unaffected B compartment hubs associated with repressive domains maintain their late replication in RIF1 KO and become enriched for repressive histone marks.
RIF1 KO causes limited gene expression changes
RIF1 KO caused expression changes to 2284 genes in H9 hESCs and 1737 genes in HCT116 (Fig S19A and B) as well as to some ERV elements (Fig S19C). Expression of pluripotency factors or histone modification writers were not affected (Fig S19D). Genes affected in HCT116 RIF1 KO gradually changed their expression during the RIF1-AID degradation time course toward RIF1 KO levels (Fig S19E), however only 6 significantly changed genes were shared between all RNA-seq samples (Fig S19F and Table S1). Single cell RNA-seq revealed an increase in global cell-to-cell heterogeneity in gene expression in RIF1 KO H9 hESCs and HAP1 cells, but not HCT116 (Fig S19G to I).
RT and chromatin compartmentalization are correlated with gene expression (1), however neither changes in RT nor compartment switches were able to predict gene expression changes in RIF1 KO cells (Fig S20A to D). Differentially expressed genes showed cell type specific changes in the distribution of specific histone modifications around their transcription start sites that correlated with expression changes (Fig S20E and F). Altogether, these results suggest that gene expression changes are indirect effects of RIF1 depletion.
Discussion
We show that deletion of RIF1 results in a dramatic increase in cell-to-cell RT heterogeneity rather than discrete population level RT switches. Although RIF1 is bound to late replicating chromatin, the entire early replicating genome as well as most of the late replicating genome becomes disrupted for RT control without RIF1 (Fig 1). This is reminiscent of observations in budding yeast where de-repression of late replicating origins increased competition for limiting replication initiation factors and delayed the RT of early origins (14) and suggests a similar mechanism of RT disruption in RIF1 KO cells. The late replicating genome is composed of two types of domains whose delayed replication is enforced by different mechanisms and that form separate chromatin hubs. In both hESCs and HCT116 cells, RIF1 KO leads to widespread aberrant histone modification patterns that correlate with distinct genome-wide changes in 3D genome architecture. We further show that disruptions to epigenome and chromatin structure require DNA replication and that continuous rounds of replication with heterogeneous RT quantitatively exacerbate these changes. We propose that RT changes due to RIF1 KO result in aberrant re-establishment of epigenetic marks that cause profound changes in the epigenetic landscape that then alter genome architecture (Fig 5H). While Rif1 has been shown to interact with histone methytransferases (15) our cell cycle synchronized data (Fig 4) do not support a direct role for RIF1 in heterochromatin maintenance. This work provides the first mechanistic evidence linking the RT program with maintenance of the global epigenetic state and genome compartmentalization and establishes RIF1 as a key regulator of epigenome maintenance through its role in RT control.
Supplementary Material
Acknowledgments:
We would like to thank Ruth Didier and Beth Alexander of the FSU Flow Cytometry and Confocal Microscopy Facilities for their excellent help with flow cytometry and FACS for this project. Thanks to Amber Brown of the FSU Biological Science Core Labs and to Yangming Yang and Cindy Vied of the FSU Translational Labs. Thanks to Sandy R. Westermann of SCIGRAPHIX for generating the model figure. Thanks to Bas van Steensel, Jennifer Phillips-Cremins, and Peter Fraser for critical reading of the manuscript.
Funding:
This work was supported by NIH grant GM083337 to D.M.G., GM035463 to V.G.C., and GM085354 to D.M.G., S.D., and V.G.C.; T.B. is supported by the William C. and Joyce C. O’Neil Charitable Trust, Memorial Sloan Kettering Single Cell Sequencing Initiative.
Footnotes
Competing interests: Authors declare no competing interests.
Data and materials availability: All data is available on the Gene Expression Omnibus (GEO) #GSE160563. Code for data analysis is available at https://github.com/oliviacamel/RIF1_KO_analysis.
References:
- 1.Rhind N, Gilbert DM, DNA Replication Timing. Cold Spring Harb. Perspect. Biol 5, a010132 (2013). [DOI] [PMC free article] [PubMed] [Google Scholar]
- 2.Reverón-Gómez N, González-Aguilera C, Stewart-Morgan KR, Petryk N, Flury V, Graziano S, Johansen JV, Jakobsen JS, Alabert C, Groth A, Accurate Recycling of Parental Histones Reproduces the Histone Modification Landscape during DNA Replication. Mol. Cell (2018), doi: 10.1016/j.molcel.2018.08.010. [DOI] [PMC free article] [PubMed] [Google Scholar]
- 3.Escobar TM, Oksuz O, Saldaña-Meyer R, Descostes N, Bonasio R, Reinberg D, Active and Repressed Chromatin Domains Exhibit Distinct Nucleosome Segregation during DNA Replication. Cell (2019), doi: 10.1016/j.cell.2019.10.009. [DOI] [PMC free article] [PubMed] [Google Scholar]
- 4.Zhang J, Xu F, Hashimshony T, Keshet I, Cedar H, Establishment of transcriptional competence in early and late S phase. Nature (2002), doi: 10.1038/nature01150. [DOI] [PubMed] [Google Scholar]
- 5.Lande-Diner L, Zhang J, Cedar H, Shifts in Replication Timing Actively Affect Histone Acetylation during Nucleosome Reassembly. Mol. Cell 34, 767–74 (2009). [DOI] [PMC free article] [PubMed] [Google Scholar]
- 6.S. B. C. Buonomo, in Advances in experimental medicine and biology (2017; http://www.ncbi.nlm.nih.gov/pubmed/29357062), vol. 1042, pp. 259–272. [DOI] [PubMed] [Google Scholar]
- 7.Seller CA, O’Farrell PH, Rif1 prolongs the embryonic S phase at the Drosophila mid-blastula transition. PLoS Biol. 16, e2005687 (2018). [DOI] [PMC free article] [PubMed] [Google Scholar]
- 8.Foti R, Gnan S, Cornacchia D, Dileep V, Bulut-Karslioglu A, Diehl S, Buness A, Klein FAA, Huber W, Johnstone E, Loos R, Bertone P, Gilbert DMM, Manke T, Jenuwein T, Buonomo SCBCBB, Nuclear Architecture Organized by Rif1 Underpins the Replication-Timing Program. Mol. Cell 61, 260–273 (2016). [DOI] [PMC free article] [PubMed] [Google Scholar]
- 9.O’Keefe RT, Henderson SC, Spector DL, Dynamic organization of DNA replication in mammalian cell nuclei: spatially and temporally defined replication of chromosome-specific alpha-satellite DNA sequences. J. Cell Biol 116, 1095–1110 (1992). [DOI] [PMC free article] [PubMed] [Google Scholar]
- 10.Zhao PA, Sasaki T, Gilbert DM, High-resolution Repli-Seq defines the temporal choreography of initiation, elongation and termination of replication in mammalian cells. Genome Biol. (2020), doi: 10.1186/s13059-020-01983-8. [DOI] [PMC free article] [PubMed] [Google Scholar]
- 11.Dileep V, Gilbert DM, Single-cell replication profiling to measure stochastic variation in mammalian replication timing. Nat. Commun 9, 427 (2018). [DOI] [PMC free article] [PubMed] [Google Scholar]
- 12.Ryba T, Hiratani I, Lu J, Itoh M, Kulik M, Zhang J, Schulz TC, Robins AJ, Dalton S, Gilbert DM, Evolutionarily conserved replication timing profiles predict long-range chromatin interactions and distinguish closely related cell types. Genome Res. 20, 761–770 (2010). [DOI] [PMC free article] [PubMed] [Google Scholar]
- 13.Nishimura K, Fukagawa T, Takisawa H, Kakimoto T, Kanemaki M, An auxin-based degron system for the rapid depletion of proteins in nonplant cells. Nat. Methods 6, 917–922 (2009). [DOI] [PubMed] [Google Scholar]
- 14.Yoshida K, Bacal J, Desmarais D, Padioleau I, Tsaponina O, Chabes A, Pantesco V, Dubois E, Parrinello H, Skrzypczak M, Ginalski K, Lengronne A, Pasero P, The Histone Deacetylases Sir2 and Rpd3 Act on Ribosomal DNA to Control the Replication Program in Budding Yeast. Mol. Cell 54, 691–697 (2014). [DOI] [PubMed] [Google Scholar]
- 15.Li P, Wang L, Bennett BD, Wang J, Li J, Qin Y, Takaku M, Wade PA, Wong J, Hu G, Rif1 promotes a repressive chromatin state to safeguard against endogenous retrovirus activation. Nucleic Acids Res. 45, 12723–12738 (2017). [DOI] [PMC free article] [PubMed] [Google Scholar]
- 16.Marchal C, Sasaki T, Vera D, Wilson K, Sima J, Rivera-Mulia JC, Trevilla-García C, Nogues C, Nafie E, Gilbert DM, Genome-wide analysis of replication timing by next-generation sequencing with E/L Repli-seq. Nat. Protoc 13, 819–839 (2018). [DOI] [PMC free article] [PubMed] [Google Scholar]
- 17.Baslan T, Kendall J, Rodgers L, Cox H, Riggs M, Stepansky A, Troge J, Ravi K, Esposito D, Lakshmi B, Wigler M, Navin N, Hicks J, Genome-wide copy number analysis of single cells. Nat. Protoc 7, 1024–1041 (2012). [DOI] [PMC free article] [PubMed] [Google Scholar]
- 18.Lyu X, Rowley MJ, Corces VG, Architectural Proteins and Pluripotency Factors Cooperate to Orchestrate the Transcriptional Response of hESCs to Temperature Stress. Mol. Cell 71, 940–955.e7 (2018). [DOI] [PMC free article] [PubMed] [Google Scholar]
- 19.Orlando DA, Chen MW, Brown VE, Solanki S, Choi YJ, Olson ER, Fritz CC, Bradner JE, Guenther MG, Quantitative ChIP-Seq normalization reveals global modulation of the epigenome. Cell Rep. (2014), doi: 10.1016/j.celrep.2014.10.018. [DOI] [PubMed] [Google Scholar]
- 20.Skene PJ, Henikoff S, An efficient targeted nuclease strategy for high-resolution mapping of DNA binding sites. Elife (2017), doi: 10.7554/elife.21856. [DOI] [PMC free article] [PubMed] [Google Scholar]
- 21.Zhang Y, Liu T, Meyer CA, Eeckhoute J, Johnson DS, Bernstein BE, Nussbaum C, Myers RM, Brown M, Li W, Shirley XS, Model-based analysis of ChIP-Seq (MACS). Genome Biol. (2008), doi: 10.1186/gb-2008-9-9-r137. [DOI] [PMC free article] [PubMed] [Google Scholar]
- 22.Stovner EB, Sætrom P, epic2 efficiently finds diffuse domains in ChIP-seq data. Bioinformatics (2019), doi: 10.1093/bioinformatics/btz232. [DOI] [PubMed] [Google Scholar]
- 23.Soufi A, Donahue G, Zaret KS, Facilitators and impediments of the pluripotency reprogramming factors’ initial engagement with the genome. Cell (2012), doi: 10.1016/j.cell.2012.09.045. [DOI] [PMC free article] [PubMed] [Google Scholar]
- 24.Lieberman-Aiden E, van Berkum NL, Williams L, Imakaev M, Ragoczy T, Telling A, Amit I, Lajoie BR, Sabo PJ, Dorschner MO, Sandstrom R, Bernstein B, Bender MA, Groudine M, Gnirke A, Stamatoyannopoulos J, Mirny LA, Lander ES, Dekker J, Comprehensive mapping of long-range interactions reveals folding principles of the human genome. Science (80-. ) 326, 289–293 (2009). [DOI] [PMC free article] [PubMed] [Google Scholar]
- 25.Imakaev M, Fudenberg G, McCord RP, Naumova N, Goloborodko A, Lajoie BR, Dekker J, Mirny LA, Iterative correction of Hi-C data reveals hallmarks of chromosome organization. Nat. Methods (2012), doi: 10.1038/nmeth.2148. [DOI] [PMC free article] [PubMed] [Google Scholar]
- 26.Dixon JR, Selvaraj S, Yue F, Kim A, Li Y, Shen Y, Hu M, Liu JS, Ren B, Topological domains in mammalian genomes identified by analysis of chromatin interactions. Nature. 485, 376–380 (2012). [DOI] [PMC free article] [PubMed] [Google Scholar]
- 27.Lajoie BR, Dekker J, Kaplan N, The Hitchhiker’s guide to Hi-C analysis: Practical guidelines. Methods (2015), doi: 10.1016/j.ymeth.2014.10.031. [DOI] [PMC free article] [PubMed] [Google Scholar]
- 28.Lun ATL, Smyth GK, diffHic: A Bioconductor package to detect differential genomic interactions in Hi-C data. BMC Bioinformatics (2015), doi: 10.1186/s12859-015-0683-0. [DOI] [PMC free article] [PubMed] [Google Scholar]
- 29.Robinson MD, McCarthy DJ, Smyth GK, edgeR: A Bioconductor package for differential expression analysis of digital gene expression data. Bioinformatics (2009), doi: 10.1093/bioinformatics/btp616. [DOI] [PMC free article] [PubMed] [Google Scholar]
- 30.Jiang Q, Ang JYJ, Lee AY, Cao Q, Li KY, Yip KY, Leung DCY, G9a Plays Distinct Roles in Maintaining DNA Methylation, Retrotransposon Silencing, and Chromatin Looping. Cell Rep. (2020), doi: 10.1016/j.celrep.2020.108315. [DOI] [PubMed] [Google Scholar]
- 31.Dobin A, Davis CA, Schlesinger F, Drenkow J, Zaleski C, Jha S, Batut P, Chaisson M, Gingeras TR, STAR: Ultrafast universal RNA-seq aligner. Bioinformatics (2013), doi: 10.1093/bioinformatics/bts635. [DOI] [PMC free article] [PubMed] [Google Scholar]
- 32.Li H, Handsaker B, Wysoker A, Fennell T, Ruan J, Homer N, Marth G, Abecasis G, Durbin R, The Sequence Alignment/Map format and SAMtools. Bioinformatics (2009), doi: 10.1093/bioinformatics/btp352. [DOI] [PMC free article] [PubMed] [Google Scholar]
- 33.Quinlan AR, Hall IM, BEDTools: A flexible suite of utilities for comparing genomic features. Bioinformatics (2010), doi: 10.1093/bioinformatics/btq033. [DOI] [PMC free article] [PubMed] [Google Scholar]
- 34.Breiman L, Random forests. Mach. Learn 45, 5–32 (2001). [Google Scholar]
Associated Data
This section collects any data citations, data availability statements, or supplementary materials included in this article.