

Abstract
Purpose:
Diffusion-weighted magnetic resonance imaging (DW-MRI) is a contrast-free modality that has demonstrated ability to discriminate between pre-defined benign and malignant breast lesions. However, how well DW-MRI discriminates cancer from all other breast tissue voxels in a clinical setting is unknown. Here we explore the voxel-wise ability to distinguish cancer from healthy breast tissue using signal contributions from the newly developed three-component multi-b-value DW-MRI model.
Experimental design:
Pathology-proven breast cancer patients from two datasets (n=81 and n=25) underwent multi-b-value DW-MRI. The three-component signal contributions C1 and C2 and their product, C1C2, and signal fractions F1, F2 and F1F2 were compared to the image defined on maximum b-value (DWImax), conventional apparent diffusion coefficient (ADC), and apparent diffusion kurtosis (Kapp). The ability to discriminate between cancer and healthy breast tissue was assessed by the false positive rate given a sensitivity of 80% (FPR80) and receiver operating characteristic (ROC) area under the curve (AUC).
Results:
Mean FPR80 for both datasets was 0.016 (95%CI=0.008-0.024) for C1C2, 0.136 (95%CI=0.092-0.180) for C1, 0.068 (95%CI=0.049-0.087) for C2, 0.462 (95%CI=0.425-0.499) for F1F2, 0.832 (95%CI=0.797-0.868) for F1, 0.176 (95%CI=0.150-0.203) for F2, 0.159 (95%CI=0.114-0.204) for DWImax, 0.731 (95%CI=0.692-0.770) for ADC and 0.684 (95%CI=0.660-0.709) for Kapp. Mean ROC AUC for C1C2 was 0.984 (95%CI=0.977-0.991).
Conclusions:
The C1C2 parameter of the three-component model yields a clinically useful discrimination between cancer and healthy breast tissue, superior to other DW-MRI methods and obliviating pre-defining lesions. This novel DW-MRI method may serve as non-contrast alternative to standard-of-care dynamic contrast-enhanced MRI (DCE-MRI).
INTRODUCTION
Numerous studies have indicated that early breast cancer detection, with dynamic contrast-enhanced magnetic resonance imaging (DCE-MRI), has higher sensitivity than current screening programs (ultrasound and mammography) 1–5. However, DCE-MRI has a number of limitations such as conflicting results regarding specificity 2–6, dependency on expert radiologist readers, additional scan time and additional costs, and the use of Gadolinium-based contrast agents that are linked to deposition in the brain 7. In contrast, diffusion-weighted MRI (DW-MRI) does not require exogenous contrast and yields quantitative information of tissue microstructure by detecting diffusion of water molecules through application of varying degree of diffusion weighting.
Various diffusion models have demonstrated comparable ability to DCE-MRI in discriminating between pre-defined benign and malignant lesions in small regions of interest (ROIs) in the breast 8–14. However, DW-MRI would increase its clinical utility and practicality in breast cancer screening, treatment evaluation, surgical planning, and surveillance if it could also discriminate cancer from all healthy breast tissue, not relying on lesions being pre-defined by radiologists. DW-MRI of healthy breast tissue is problematic because it consists of varying degree of admixtures of fatty and fibroglandular tissue 15 which creates an intravoxel fatty component on DW-MRI 16. Fatty tissue is primarily made up of adipocytes which contain a large lipid droplet that occupies > 90% of the cell volume, leaving only a small rim of water-containing cytoplasm. Common fat suppression techniques are designed to suppress the lipid component 17, while studies have reported very restricted diffusion in fat-suppressed healthy breast tissue 18,19 which suggests that the water component in fatty tissue remains on conventional DW-MRI. The restricted water component in fatty tissue is especially problematic since it confounds the slow diffusion signal from intracellular cancer tissue. Thus, advanced imaging techniques are needed to discriminate cancer from all healthy breast tissue on a voxel-wise level including the restricted water component in the intravoxel fatty tissue.
Advanced, multi-component partial volume models that use extended ranges of b-values (typically up to 2000-3000 s/mm2) may theoretically isolate the slowly diffusing water pool present in cancer tissue and have become an emerging standard in several imaging domains 20–26. Here, the DW-MRI signal is modeled as a combination of exponential decays with corresponding component apparent diffusion coefficients (ADCs), where the weighting of each component represents the attribution from a distinct pool of water from the total diffusion signal. Furthermore, selected multi-component partial volume models, such as restriction spectrum imaging (RSI) 24–26, uses tissue-specific, pre-determined component ADCs which ensures linearization of the model, comparability across patients and rapid fitting of diffusion signal which is essential for clinical application. This is fundamentally different from conventional approaches where ADCs are not fixed but are left free and determined for each voxel independently. However, these methods are not yet well-investigated in the breast.
Initial results of multi-component partial volume models in the breast have been demonstrated by Vidić et al. 12, showing that the normalized magnitude of the slowest component in a two-component model was excellent (AUC = 0.99) in discriminating between pre-defined benign and malignant breast lesions. Building on these findings, the multi-component model was optimized to fit the DW-MRI signal across all voxels in all breast tissue, including cancer and healthy breast tissue, resulting in a three-component model with empirical ADCs globally-determined across patients, scanners and sites 19. The three-component model was able to explain all voxels in all breast tissue, including the restricted water component in fatty tissue, rather than the averaged signal of an ROI 27–29.
The main objective of the current study is to explore the ability of estimates derived from a three-component model to discriminate breast cancer from healthy breast tissue and to compare it to other DW-MRI methods.
MATERIALS AND METHODS
Patients
In order to validate the discriminatory power of the three-component model across scanners and sites, two datasets of pathology-proven breast cancer patients from a United States (US) site (n = 81) and a European site (n = 25) were included (Table 1). Note that 49 cases from the US site and all cases from the European site were also used to determine the three-component model with fixed ADCs for breast tissue 19. In addition, cases from the European site have been previously used for DW-MRI modeling of previously defined benign and malignant lesions 12,30–33, linking DW-MRI signal to histological specimen 34 and distortion correction techniques 35. Written informed consent was obtained from patients at both sites and the studies were conducted in accordance with the Declaration of Helsinki.
Table 1.
Table of patient characteristics. ER (estrogen receptor) and PR (progesterone receptor) status were assessed by immunohistochemistry (IHC) and was considered positive if ≥1% stained nuclei was present in 10 high-power fields 50. Human epidermal growth factor receptor 2 (HER2) status was assessed by ICH and fluorescence in situ hybridization (FISH) according to ASCO/CAP guidelines 2013 51 or 2018 52 (depending on time of recruitment); positivity was defined as an IHC score of 3+, or 2+ with a gene to chromosome ratio ≥ 2.0 by FISH. NME, non-mass enhancement.
| US dataset | European dataset | |
|---|---|---|
| No. of patients | 81 | 25 |
| Median patient age, years (range) | 51 (20 - 84) | 53 (29 – 75) |
| Mean tumor volume, cm3 (range) | 13.1 (0.2 - 105.9) | 2.5 (0.5 – 5.8) |
| Histological type | ||
| Invasive carcinoma of no special type | 64 | 17 |
| Invasive lobular carcinoma | 6 | 1 |
| Tubular carcinoma | 0 | 1 |
| Mucinous carcinoma | 0 | 1 |
| Carcinoma with medullary features | 0 | 3 |
| Metaplastic carcinoma of no special type | 4 | 0 |
| Invasive papillary carcinoma | 0 | 1 |
| Mixed Invasive carcinoma of no special type and Invasive lobular carcinoma | 3 | 0 |
| Mixed Invasive carcinoma of no special type and mucinous carcinoma | 1 | 0 |
| Ductal carcinoma in situ | 3 | 1 |
| Histological grade | ||
| 1 | 3 | 5 |
| 2 | 28 | 9 |
| 2/3 | 0 | 1 |
| 3 | 47 | 8 |
| Not analyzed | 3 | 2 |
| ER status | ||
| Positive | 53 | 23 |
| Negative | 27 | 1 |
| Not analyzed | 1 | 1 |
| PR status | ||
| Positive | 50 | 20 |
| Negative | 30 | 4 |
| Not analyzed | 1 | 1 |
| HER2 status | ||
| Positive | 14 | 7 |
| Negative | 64 | 17 |
| Not analyzed | 3 | 1 |
| Lesion type mass (mass vs. NME) | ||
| Mass | 67 | 25 |
| NME | 13 | 0 |
| Mass and NME | 1 | 0 |
US dataset
Ninety-five patients with pathology-proven breast cancer with no cytotoxic regimens, chemotherapy, or ipsilateral radiation therapy for this malignancy prior to MRI scanning were eligible for this prospective study. The study was approved by the Institutional Review Board of the US site. The recruitment of patients began in December 2015 and ended in June 2019. Tumor categorization was done by histopathologic analysis of core needle and open incisional biopsies. In total, 14 patients were excluded from the study; nine patients had contralateral cancer or mastectomy, one patient had no visible cancer tissue on DW-MRI, and in four patients image quality was low (low signal-to-noise ratio (n = 2), poor fat saturation (n = 1), and severe image distortion (n = 1)), resulting in 81 patients.
European dataset
This prospective study was approved by the Regional Committees for Medical and Health Research Ethics (REC Central Norway, 2011/568). The recruitment of patients began in August 2014 and ended in August 2016. Twenty-five pathology-proven breast cancer patients with inclusion criteria and tumor categorization similar to that of the US site were included; for more details, see inclusion of malignant lesions from Vidić et al. 12.
MRI acquisition
MRI data were acquired on a 3T GE scanner (MR750, DV25-26, GE Healthcare, Milwaukee, US) and an 8-channel breast array coil with a bilateral axial imaging plane for the US dataset, while patients from the European dataset were imaged with a 3T Siemens scanner (Skyra, VD13-E11, Siemens Healthcare, Erlangen, Germany) and a 16-channel breast array coil with a unilateral sagittal imaging plane. Differences in scanner and pulse sequence parameters across sites were used to determine that the discriminatory potential of the three-component model is robust for data collected in different scanners and pulse sequence parameters. In addition to Gadolinium DCE-MRI and T2 images, both datasets included high b-value DW-MRI acquisition:
US dataset protocol:
Bilateral axial DW-MRI was performed using reduced field of view (FOV) echo-planar imaging (EPI) including the following parameters: spectral attenuated inversion recovery (SPAIR) fat suppression, TE = 82 ms, TR = 9000 ms, b-values (number of diffusion directions) = 0, 500 (6), 1500 (6), and 4000 (15) s/mm2, FOV = 160 x 320 mm2, acquisition matrix = 48 × 96, reconstruction matrix = 128 × 128, voxel size = 2.5 × 2.5 × 5.0 mm3, phase-encoding (PE) direction A/P, and no parallel imaging.
European dataset protocol:
Unilateral sagittal DW-MRI was performed using Stejskal-Tanner spin-echo EPI including the following parameters: FatSat (n = 15) and SPAIR (n = 10) fat suppression, TE = 88 ms, TR = 10,600 ms (n = 15) and 11,800 ms (n = 10), b-values (number of diffusion directions) = 0, 200 (6), 600 (6), 1200 (6), 1800 (6), 2400 (6), and 3000 (6) s/mm2, FOV = 180 × 180 mm2, acquisition matrix = 90 × 90, reconstruction matrix = 90 × 90, voxel size = 2.0 × 2.0 × 2.5 mm3, PE direction A/P, generalized auto-calibrating partially parallel acquisition (GRAPPA) with acceleration factor of 2 and 24 reference lines.
Image processing and analysis
Noise correction 36 was performed to account for decreasing signal to noise ratio with increasing b-value. The observed signal (Sobs) is the mean signal across diffusion directions from one individual b-value image. Background voxels were selected by manually placing an ROI in an area in the air outside the breast on the highest b-value image, yielding the mean background intensity (Sbkg). The corrected signal intensity (Scorr) calculated from Sobs and Sbkg is given as:
| (1) |
Furthermore, corrections for eddy current artifacts, motion 24 and geometric distortion 36 were applied for the European dataset.
Full-volume cancer and control ROIs were manually defined on DW-MRI images, guided by all available data in the exam protocol (including DCE-MRI and anatomical T2 images, Figure 1), under supervision of and validation by two breast radiologists: RRP (US dataset) and AØ (European dataset). Cancer ROIs were drawn for the lesions corresponding to pathology-proven cancer. Control ROIs were drawn for the entire contralateral breast (US dataset) and in a cancer-free region in the ipsilateral breast at least 10 mm away from the cancer ROI (European dataset), with the aim to include all representative healthy breast tissue, excluding the axillary region, large cysts (> 2.5 cm), and susceptibility artifacts. Cancer and control ROIs were used to determine discriminatory performance between cancer and healthy breast tissue, respectively.
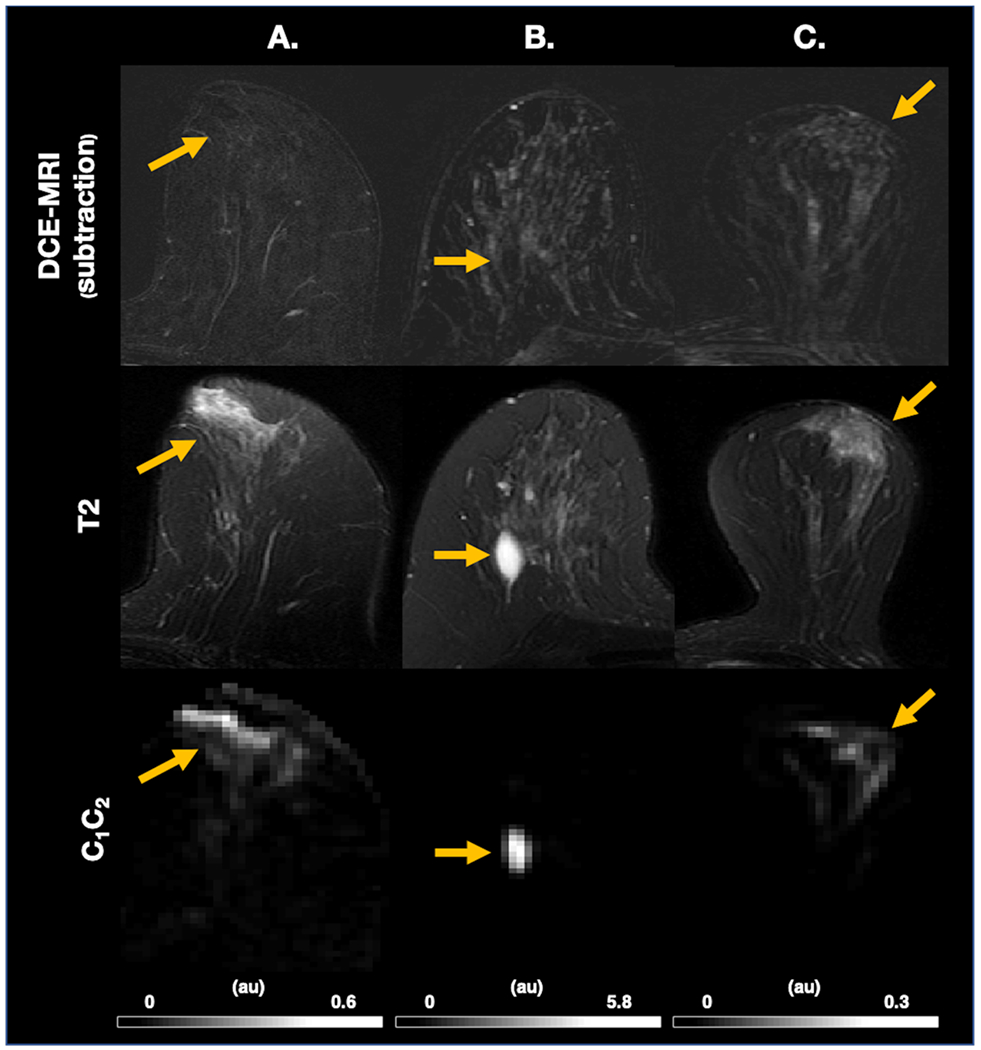
Figure 1.

Parameter maps for DWImax, C1, C2, C1C2 with FPR80, T2 images with cancer (red) and control (green) ROI overlay and probability density colormaps for cancer and control given C1 and C2 for three representative cases from the US dataset. ROIs are here only displayed for one slice but are delineated for the full volume. FPR80 vary depending on the composition of healthy breast tissue in relation to the magnitude of C1 and C2 in cancer. (A.) Mixed tissue composition with cancer high on both dimensions. (B.) Abundant fibroglandular tissue and high C1-magnitude of cancer. (C.) Abundant fatty tissue and high C2-magnitude of cancer. DWImax and C1 performance is poorest in (C.), C2 in (B.) while C1C2 has perfect performance across cases. Colormaps are given on a logarithmic scale normalized to the maximum probability density value. Y- and x-axis are defined by the maximum value for each case. Grey level windows for all images are scaled to the maximum and minimum signal intensity of each case and given in arbitrary unites. Au, arbitrary unit; C, signal contribution; DWImax, image defined on maximum b-value; FPR80, false positive rate given sensitivity of 80%; ROI, region-of-interest.
For comparison with other DW-MRI methods, the non-noise-corrected image defined on maximum b-value (DWImax), conventional apparent diffusion coefficient (ADC), and apparent diffusion kurtosis (Kapp) were estimated. DWImax was acquired at b = 4000 s/mm2 for the US dataset and b = 3000 s/mm2 for the European dataset. The exponential decay formulas described by Jensen et al. 38 and the corresponding b-value limits, < 1000 s/mm2 and < 2000 s/mm2, were used for computation of ADC and Kapp maps, respectively. Note that ADC and Kapp are calculated diffusion parameters where T2 and proton density dependence are eliminated 38.
To ensure that regions outside of the breast were not included in analysis, control ROIs were masked using intensity thresholding and 3D connected components (US dataset) or manually delineated within the breast boundary (European dataset) and reviewed by RRP (US dataset) and AØ (European dataset) (Figure 1 and Figure 4). Additionally, all undefined values (zero and infinite) on the image defined on b = 0 s/mm2, ADC and Kapp were excluded.
Figure 4.

C1C2, DWImax, ADC and Kapp with FPR80 for discrimination between cancer (red arrowhead) and healthy breast tissue (entire cancer-free contralateral breast for the US dataset, cancer-free ipsilateral breast for the European dataset) for representative cases from the US (A.-E.) and European (F.) dataset. All cases demonstrate visual similarity between DCE-MRI and C1C2 maps with excellent performance compared to ADC and Kapp. (A.) Excellent performance by C1C2 and DWImax (B.) Excellent performance by C1C2 and DWImax displaying full extent of cancer involving skin. (C.) Excellent performance by C1C2 and poor performance by DWImax, ADC and Kapp in a case with abundant fatty tissue. (D.) C1C2 improves poor DCE-MRI specificity in a case with marked background parenchymal enhancement, but partial volume artifact from the interface of fibroglandular and fatty tissue in the contralateral breast results in a low discriminatory performance. (E.) A case with NME DCIS where all diffusion maps fail; C1C2 has reduced cancer signal relative to the high signal from ipsilateral subarealor ducts. (F.) Sagittal image plane illustrating same trends in the European dataset. The worst FPR80 for all maps is 0.9934, which would be 9,934 false positive voxels of one breast (one control ROI) approximated to contain 10,000 voxels (~30 cL). Grey level windows for all images are scaled to the maximum and minimum signal intensity of each case. ADC; conventional apparent diffusion coefficient; Au, arbitrary unit; DCE-MRI, dynamic-contrast enhanced magnetic resonance imaging; DCIS; ductal carcinoma in situ; DWImax, image defined on maximum b-value; FPR80, false positive rate given sensitivity of 80%; Kapp, apparent diffusion kurtosis; NME; non-mass enhancement.
Three-component modeling of diffusion signal
The corrected diffusion signal across all available b-values was fitted with a tri-exponential model, expressed as:
| (2) |
where Scorr is the corrected diffusion signal in arbitrary units, b is the b-value in s/mm2, and Ci denotes the voxel-wise unit-less signal contribution of each component. Note that [C1+C2+C3] ∝ ρ⋅exp(−TE/T2eff), where ρ represents the proton density and T2eff the effective T2 relaxation time in a given voxel. This model has been shown to represent the best fit across all voxels from both cancer and healthy breast tissue determined across patients, scanners and sites 19, and yielded the fixed component ADC values used in this analysis: ADC1 = 0 mm2/s, ADC2 = 1.4 × 10⁻³ mm2/s, and ADC3 = 10.2 × 10⁻³ mm2/s. Fixing ADCs ensures linearization of the model and comparability of signal contributions across voxels and patients and avoids overfitting; the use of ADC1 = 0 mm2/s means this component behaves not as a distinct exponential as in other tissue 20,21,24,39 but as a constant offset. Hence, we use the term “three-component” for the fitted model instead of “tri-exponential”. All voxels were normalized to the 98th percentile of intensity within the b = 0 s/mm2 image, indicated by the normalization factor (N). This was done to address different image intensity scaling while simultaneously preserving contribution of proton density and T2 to the DW-MRI signal.
Alternatively, the equation can be written by normalizing to the signal at b = 0 s/mm2 per voxel (S(0)), yielding signal fractions (F) rather than signal contributions (C). Thus, F is related directly to diffusion and more clearly separated from proton density and T2 properties, given as;
| (3) |
where F1 + F2 + F3 = 1 and S(0) ∝ ρ⋅exp(−TE/T2eff). This means that the signal contributions include voxel-wise T2-weighting and proton density effects, while the signal fractions are only sensitive to diffusion component effects. For the remainder of this paper, the signal at b = 0 s/mm2 will be denoted S0.
The following parametric maps were estimated from Equation 2: C1C2, C1 and C2. The parameters C1 and C2 were estimated directly from the model, while C1C2 is the corresponding product. Similarly, F1F2, F1 and F2 were estimated from Equation 3. The parametric maps C3 and F3 were not included due to the low cancer conspicuity of the third component 19. For completeness, the product of S0 and signal fractions, S0F1F2, S0F1 and S0F2, were estimated to investigate the relative importance of T2 and proton density effects.
Discriminating performance between cancer and healthy breast tissue
Clinical utility of the three-component derived parametric maps was assessed by comparing the voxel-wise discriminatory performance between cancer (cancer ROIs) and healthy breast tissue (control ROIs) of C1C2, C1, C2, F1F2, F1, F2, S0F1F2, S0F1 and S0F2 to DWImax, ADC, and Kapp. Because there were ~52 times more healthy breast tissue voxels than cancer voxels, performance in discriminating between cancer and healthy breast tissue was examined for all voxels by the expected false positive rate given a sensitivity of 80% (FPR80). In addition, the conventional performance measures receiver operating characteristic (ROC) area under the curve (AUC), sensitivity, specificity, and accuracy were estimated. Sensitivity, specificity, and accuracy were calculated for the threshold value providing optimal accuracy, defined as the mean sensitivity and specificity, assuming equal prevalence of cancer and healthy breast tissue voxels. All three-component derived parametric maps, DWImax, and Kapp 29 were assumed to have higher intensity for cancer compared to healthy breast tissue, while the opposite was assumed for ADC 27,28. Average signal of the cancer and control ROIs were calculated, and differences were compared using a Mann-Whitney U test with a threshold significance level of 0.05.
RESULTS
Sample
The total number of voxels from cancer and healthy breast tissue from both datasets was 37,659 and 1,946,186, respectively.
Optimized three-component model parameters for discrimination
Probability density colormaps for the three-component model given C1 and C2 including all voxels across patients and datasets are plotted for cancer (cancer ROIs, Figure 2A) and healthy breast tissue (control ROIs, Figure 2B). These maps display two distinct probability density distributions for cancer and healthy breast tissue. The product C1C2 discriminates cancer from healthy breast tissue voxels, where voxels low on one or two dimensions corresponds to healthy breast tissue voxels, while cancer probability increases with increased magnitude on C1 and C2.
Figure 2.

Probability density colormaps for the three-component model given C1 and C2 including all voxels across patients and datasets are given for (A.) cancer (cancer ROIs) and (B.) healthy breast tissue (control ROIs). These maps display two distinct probability density distributions for cancer and healthy breast tissue. Cancer probability increases with increased magnitude on C1 and C2. Colormaps are given on a logarithmic scale normalized to the maximum probability density value. Au, arbitrary unit; C, signal contribution.
The relationship between C1 and C2 demonstrates that voxels with high magnitude on both dimensions had the highest probability of cancer (Figure 1A); representative cases are given in Figure 1, and all cases are given in Supplementary Figure 1–106. Discrimination performance varied depending on composition of healthy breast tissue in relation to the magnitude of C1 and C2 in cancer. FPR80 was higher (indicating more false positive voxels) for C1 and DWImax in a case with abundant fat-suppressed fatty tissue and high C2-magnitude of corresponding cancer (Figure 1C), compared to abundant fibroglandular tissue and high C1-magnitude of corresponding cancer (Figure 1B). The opposite was seen for C2, while C1C2 suppressed both fibroglandular and fatty tissue. This shows that the C1C2 parameter derived from the three-component model provided the optimal discrimination performance between cancer and healthy breast tissue.
All signal contributions (C1C2, C1, C2) performed better than signal fractions (F1F2, F1 and F2), given in Figure 3. Signal fractions where S0 was included (S0F1F2, S0F1 and S0F2) performed nearly equal to corresponding signal contributions (C1C2, C1, C2), see Supplementary Table 1–2.
Figure 3.

The FPR80 is the false positive rate given a sensitivity of 80% for discriminating cancer and healthy breast tissue for three-component model signal contributions (C1C2, C1, C2) and signal fractions (F1F2, F1, F2), DWImax, ADC and Kapp, given per patient across the US and European dataset. Median values indicated by lines; boxes show interquartile range, block bars show data range and red crosses show outliers. The worst FPR80 for all maps is 0.9934, which would be 9,934 false positive voxels of one breast (one control ROI) approximated to contain 10,000 voxels (~30 cL). ADC; conventional apparent diffusion coefficient; C, signal contribution; DWImax, image defined on maximum b-value; F, signal fraction; Kapp, apparent diffusion kurtosis.
Discriminatory performance of C1C2 compared to other DW-MRI methods
Mean FPR80 for both datasets was 0.016 (95% CI = 0.008-0.024) for C1C2, 0.136 (95% CI = 0.092-0.180) for C1, 0.068 (95 % CI = 0.049-0.087) for C2, 0.462 (95 % CI = 0.425-0.499) for F1F2, 0.832 (95 % CI = 0.797-0.868) for F1, 0.176 (95 % CI = 0.150-0.203) for F2, 0.159 (95 % CI = 0.114-0.204) for DWImax, 0.731 (95 % CI = 0.692-0.770) for ADC and 0.684 (95 % CI = 0.660-0.709) for Kapp (Figure 3). C1C2 achieved the lowest FPR80 with a mean ROC AUC of 0.984 (95 % CI = 0.977-0.991) when compared to other DW-MRI methods. Discriminatory performance was similar across datasets; see Supplementary Table 1–2 for all conventional performance measures and FPR80 given for the two datasets separately. Average signal of the cancer and control ROIs are shown in Supplementary Table 3. All cancer and control ROIs were significantly different (p < 1 × 10⁻⁹).
C1C2 had excellent performance compared to ADC and Kapp in a wide range of representative cases (Figure 4). DWImax performs well in several cases (Figure 4A–B) but underperforms compared to C1C2, overall (Figure 3) and particularly in a case with abundant fatty tissue (Figure 4C). In addition, C1C2 visually improves poor DCE-MRI specificity in a case with marked background parenchymal enhancement (Figure 4D). However, C1C2 underperforms in cases with sparse signal from cancer, such as case of non-mass enhancement (NME) ductal carcinoma in situ (DCIS) (Figure 4E). In this case, all DW-MRI derived maps failed to identify cancer compared to healthy breast tissue. Furthermore, there was high diffusion signal from some healthy breast tissue components such as proteinaceous cysts (Figure 5B), subareolar ducts (Figure 5A), and partial volume artifact from the interface of fibroglandular and fatty tissue (Figure 4D, Figure 5C). High diffusion signal from proteinaceous cysts and subareolar ducts may be defined as nonsuspicious with the assistance of T2 images (Figure 5A–B).
Figure 5.
DCE-MRI and T2 images with corresponding C1C2 images illustrating false positives on C1C2 (yellow arrow). (A.-B.) show that false positive lesions on C1C2 can be defined as non-suspicious with the assistance of T2 images by a hyperintense signal on the T2 image correlated with clearly benign morphology. (A.) High signal involving subareolar ducts on T2 image and C1C2, not visible on DCE-MRI. (B.) Cyst visible on T2 image and C1C2, not visible on DCE-MRI (C.) Demonstration of limitation of C1C2 where background parenchymal enhancement visible on DCE-MRI and T2 image creates a partial volume artifact corresponding to the interface between fatty and fibroglandular tissue on C1C2. Au, arbitrary unit; C, signal contribution; DCE-MRI, dynamic-contrast enhanced magnetic resonance imaging
DISCUSSION
Our study shows that cancer can be noninvasively discriminated from healthy breast tissue using the derived parameter C1C2 based on a three-component DW-MRI model, with results comparable to cancer detection using DCE-MRI 2–6 (FPR80 mean = 0.016, 95 % CI = 0.008-0.024 and ROC AUC mean = 0.984, 95 % CI = 0.977-0.991). This means that C1C2 achieved very low false positive rates while detecting 80% or more of the defined cancer voxels. The discriminatory power of C1C2 was superior to that of independent signal contributions and signal fractions, conventional DW-MRI-estimates (ADC) and other methods, including diffusion kurtosis imaging (Kapp) and DWImax. The three-component model was performed across two different sites, scanners, and acquisition protocols, suggesting potential for real-world applications. The development of this advanced DW-MRI method allows for improved conspicuity of cancer relative to background breast tissue. This lays the foundation for a quantitative framework specific to pathology which may serve as an alternative to DCE-MRI.
The high discriminatory performance is due to the characteristics of the novel C1C2 parameter. In addition to malignancy, individual signal contributions from the three-component model were sensitive to the two primary components of healthy breast tissue: fatty (C1) and fibroglandular (C2) tissue. As the lipid component of fatty tissue signal is suppressed by application of fat suppression in this study (SPAIR and FatSat), we hypothesise that signal on C1 comes from the restricted water component within adipocytes in fatty tissue 18,19. Furthermore, neither component was sensitive to tissue with very fast diffusion properties, such as vessels, necrosis, or edema. By combining the signal contributions of the two slowest components C1 and C2, the majority of signal from fatty and fibroglandular tissue was suppressed so that the output image was predominantly sensitive to cancer compared to healthy breast tissue. This is particularly useful because of the varying degree of admixture of fatty and fibroglandular tissue in the breast. In fact, histological evaluation of healthy breast tissue specimen demonstrated on average 29.7 % fatty tissue component in dense breasts and 80.6 % in non-dense breasts 15. Thus, C1C2 may account for women with varying degree of admixed fatty tissue which is known to be an issue on conventional DW-MRI 16. While optimized for cancer discrimination, the detailed relationship between the three-component model and breast microstructure remains to be studied, as it has been for the two-component model 34,40.
Another important aspect attributing to the high discriminatory performance is the retainment of T2 and proton density contribution to the DW-MRI signal. On conventional DW-MRI, T2 effects on DW-MRI signal is considered an inconvenience and is therefore eliminated 41. In this study we present signal contributions that include contribution from voxel-wise proton density and T2, while the signal fractions are defined to only be sensitive to diffusion effects. Thus, the importance of T2 and proton density is clearly demonstrated by the signal contributions C1C2, C1 and C2 performing far better than their signal fraction counterparts F1F2, F1 and F2. We further see these effects by signal fractions performing nearly equal to corresponding signal contributions once the signal at b = 0 s/mm2, So, was included, which demonstrates that Ci ≈ S0Fi. This has also been shown in separating benign and malignant breast lesions, where So (which has no diffusion weighting), yielded a relatively high AUC of 0.85 12.
We hypothesize that contributing factors to the poor performance of ADC and Kapp include the restricted water component within adipocytes in fatty tissue not accounted for by fat suppression techniques and elimination of proton density and T2 effects that add to cancer discrimination. The FPR80 discriminatory performance of ADC and Kapp varied greatly across subjects; at best, performing around 0.2 in selected cases (Figure 4A), but overall do no better than chance. Previous studies have demonstrated significant differences between cancer and healthy breast tissue by ADC 27,28 and Kapp 29. However, these studies have been performed by signal averaged across ROIs and not voxel-wise, which does not reflect the heterogeneity of healthy breast tissue including admixture of fatty and fibroglandular tissue. Conversely, DWImax shares the same basic properties as C1C2 (diffusion-, T2-, and proton density-weighting) and performs noticeably better than ADC and Kapp and have several cases with perfect performance (Figure 1A–B, Figure 4A–B). However, DWImax is also prone to influence from restricted water from fatty tissue and performs worse than C1C2 on average. C1C2 better accounts for all healthy breast tissue including the restricted water component from fatty tissue, conferring a major advantage over DWImax and the other DWI-estimates (Figure 4C), as fibroglandular tissue is admixed with fatty tissue, and approximately 50% of women have almost entirely fatty breast tissue or scattered fibroglandular tissue 42.
In order for C1C2 to be a noninvasive alternative to DCE-MRI for breast cancer detection, it must have comparable or better sensitivity and specificity. DW-MRI is known to improve detection specificity 8,43, which is beneficial as lesion-level DCE-MRI specificity have been reported to range from 72-97% 2–6. In our study, performance was assessed per voxel, and the patient cohort was heterogenous, consisting of a large range of tumor volumes (mean = 10.6 cm3, range = 0.2-105.9 cm3), not reflecting the typical patient pool in the screening or surveillance setting which typically have smaller lesions. However, the high performance of discriminating cancer from all other breast tissue in comparison to other DW-MRI-based methods is highly promising and suggests clinical utility comparable to DCE-MRI. C1C2 may be particularly useful when DCE-MRI demonstrates false positive 44 (Figure 4D) and false negative 45 interpretations in patients with moderate and marked background parenchymal enhancement. Furthermore, false positive findings on C1C2 can be defined as nonsuspicious by a hyperintense signal on the T2 image correlated with clearly benign morphology (Figure 5A–B). While proteinaceous cysts (Figure 5B) are well known false positives on DW-MRI 46, subareolar ducts (Figure 5A) are not commonly reported and may be due to T2 influence on C1C2. This indicates that C1C2 may assist in a non-contrast workflow with anatomical T1 and/or T2 sequences which can remove the need to administer Gadolinium contrast and any accumulation of Gadolinium in the brain 7.
The three-component model lays the foundation for a computationally efficient and standardized framework for breast cancer detection generalizable across sites, scanners, and acquisition protocols. By using globally-determined, fixed component ADCs, the three-component model allows for rapid fitting of diffusion signal suitable for application as a turnkey processing stream on both GE and Siemens platforms. These factors are vital for implementation in standard-of care breast MRI. Furthermore, the three-component model is performed on data acquired on extended imaging protocols (b-values up to 3000-4000 s/mm2) and requires at least three separate non-zero b-values. Inclusion of higher b-values improves discrimination by allowing better estimates of very slow diffusion characteristics of intracellular fluid within hypercellular tumors 9–12,20–26. However, high b-value acquisition also results in an increased scan time, where the protocol used for the European dataset in this study for (including seven b-values up to 3000 s/mm2) had a scan time of ~8 minutes compared to a standard DW-MRI protocol (including 2 b-values) which are typically performed in 1-3 minutes. We argue that the substantially increased discriminatory performance of the derived C1C2 parameter compared to conventional DW-MRI justifies the increase in scan time, which is also the same scan time as conventional DCE-MRI. This does, however, illustrate the need for optimized b-value protocols for improved scan time efficiency, which is an area of interest for future development.
Several diffusion methods aim to isolate the signal from the slowly diffusing water component from cancer tissue by utilizing broad b-value ranges 9–12,20–26. Diffusion kurtosis imaging is based on a simple mathematical representation of diffusion data where the derived parameter Kapp has proven potential utility in the breast 9–11,29. More advanced, multi-component partial volume models with fixed ADCs have been developed to further probe the microstructure in the brain and prostate: RSI 24–26 (on which the three-component model is based), the vascular, extracellular, and restricted diffusion for cytometry in tumors (VERDICT) model 21, and the hybrid multidimensional MRI model 22. A key difference between RSI/three-component model and the hybrid multidimensional MRI model is that the hybrid model does not use pre-determined, fixed component ADCs, making comparison of corresponding signal contributions across patients and voxels difficult. Nevertheless, the hybrid model does incorporate multi-echo information not available in our study. Moreover, the T2 and proton density effects seen in RSI/three-component model are removed from the two other models, potentially reducing cancer conspicuity. Although the other multi-component partial volume models have shown promising results as cancer biomarkers in the prostate, for example, these results may be limited in breast, where fatty tissue is an important component of healthy breast tissue.
The three-component model may share biophysical similarities with the two-component intra-voxel incoherent motion (IVIM) model 47. The two fastest component ADCs from the three-component model, ADC2 = 1.4 × 10⁻³ mm2/s and ADC3 = 10.2 × 10⁻³ mm2/s, are an order of magnitude apart and in the range of diffusion coefficients typically fitted for an IVIM model in breast tissue (“pure tissue diffusion coefficient” and “pseudodiffusion coefficient”) 48,49. Therefore, we interpret that ADC2 and the “pure tissue diffusion coefficient” from IVIM represent hindered diffusion of fibroglandular tissue, while ADC3 and the “pseudodiffusion coefficient” from IVIM represent the very fast diffusion properties from pseudodiffusion/perfusion. This means that the optimized three-component model by Rodríguez-Soto et al. 19 is similar to an IVIM model with an additional offset C1 with ADC1 = 0 mm2/s which manifests in the high b-value range and accounts for the restricted water component in fatty tissue. The IVIM model focuses on perfusion properties fit to mid b-value data (typically up to 800-1000 s/mm2) and are therefore not sensitized to these very restricted diffusion properties. Moreover, as previously discussed, signal contributions include voxel-wise T2-weighting and proton density effects which is very important for discriminatory performance, while the signal fractions were only sensitive to diffusion component effects, and as such are more directly comparable to the signal fractions in an IVIM model.
There were some limitations to our study. First, the three-component methodology did not correct for partial volume artifacts which occurred at the interface between fatty and fibroglandular tissue on C1C2 (Figure 4D, Figure 5C). Such artifacts have the potential to be corrected, which was not investigated in this study but is an area of interest for future improvement. Another limitation concerned the definition of control ROIs; although we ensured that all control ROIs were verified as cancer-free, based on MRI review by an expert breast radiologist (both datasets) and exclusion of cases with pathology-proven contralateral cancer in the US dataset, we cannot know if occult cancer may have been included in the control ROIs. The unilateral European dataset may have been particularly prone to this, as the control ROIs were defined in the same breast as the cancer (this also made the size of control ROIs dependent on the extent of cancer and thus variable from case to case in that dataset). Lastly, detection performance is commonly evaluated at the lesion level. This study used a voxel-wise false positive rate, FPR80, as its performance measure, which does not give an absolute measure comparable to other literature. However, we argue that such a measure is useful from a radiologist’s perspective, because it mimics a breast cancer examination where all voxels in the entire image are used.
In conclusion, our study is the first to demonstrate that the derived parameter C1C2, which is the product of the two slowest components of a three-component DW-MRI model, yields a clinically useful, noninvasive method for discrimination between cancer and healthy breast tissue. The model eliminates the need for pre-defined lesions that conventional quantitative DW-MRI metrics use and accounts for all healthy breast tissue, including the restricted water component from fatty tissue. Together with anatomical images, C1C2 has the potential to assist in a combined, non-contrast workflow which could serve as an alternative to DCE-MRI. The highly promising diagnostic properties were generalized across sites, scanners, and acquisition protocols, which is important for feasibility of large-scale studies for validation in routine breast cancer detection and follow-up in comparison to DCE-MRI.
Supplementary Material
TRANSLATIONAL RELEVANCE.
Here we present a novel methodology to detect cancer from surrounding healthy breast tissue. We employ an advanced diffusion-weighted magnetic resonance imaging (DW-MRI) model without the use of a contrast agent and find highly promising diagnostic properties of the derived parameter C1C2. The results indicate that C1C2 may serve as non-contrast alternative to standard-of-care dynamic contrast-enhanced MRI (DCE-MRI), which removes the need to administer Gadolinium contrast, decreasing costs and any accumulation of Gadolinium in the brain. Further clinical utility of C1C2 is reflected by accounting for admixed fatty tissue in healthy breast tissue and obliviation of pre-defined lesions that conventional quantitative DW-MRI metrics use. Thus, C1C2 may yield increased clinical utility and practicality in breast cancer evaluation, where lesions are not pre-defined. Furthermore, the diagnostic properties were generalized across sites, scanners, and acquisition protocols, which is important for feasibility of large-scale studies for validation in routine breast cancer detection.
Acknowledgements
We would like to acknowledge the financial support from the California Breast Cancer Research Program Early Career Award (Rakow-Penner R.), California Breast Cancer Screening Program grant no. 25IB-0056 (Rakow-Penner R.), GE Healthcare (Rakow-Penner R., Dale A.M.), NIH/NIBIB grant no. K08EB026503 (Seibert T.M.) and the Fulbright Scholarship Program (Andreassen M.M.S.).
Competing Interest Statement
Dr. Dale reports that he was a Founder of and holds equity in CorTechs Labs, Inc., and serves on its Scientific Advisory Board. He is a member of the Scientific Advisory Board of Human Longevity, Inc. He receives funding through research grants from GE Healthcare to UCSD. Dr. Rakow-Penner is a consultant for Human Longevity, Inc. and receives funding through research grants from GE Healthcare. The terms of these arrangements have been reviewed by and approved by UCSD in accordance with its conflict of interest policies. Dr. Igor Vidić is employed as a consultant for Cortechs Labs, Inc. Dr. Seibert reports personal honoraria in the past three years from Varian Medical Systems, Multimodal Imaging Services Corporation, and WebMD.
REFERENCES:
- 1.Lehman CD, Blume JD, Weatherall P, et al. Screening women at high risk for breast cancer with mammography and magnetic resonance imaging. Cancer 103:1898–905, 2005 [DOI] [PubMed] [Google Scholar]
- 2.Kuhl CK, Schrading S, Leutner CC, et al. Mammography, breast ultrasound, and magnetic resonance imaging for surveillance of women at high familial risk for breast cancer. J Clin Oncol 23:8469–76, 2005 [DOI] [PubMed] [Google Scholar]
- 3.Kriege M, Brekelmans CTM, Boetes C, et al. Efficacy of MRI and mammography for breast-cancer screening in women with a familial or genetic predisposition. The New England journal of medicine 351:427–437, 2004 [DOI] [PubMed] [Google Scholar]
- 4.Leach MO, Boggis CR, Dixon AK, et al. Screening with magnetic resonance imaging and mammography of a UK population at high familial risk of breast cancer: a prospective multicentre cohort study (MARIBS). Lancet 365:1769–78, 2005 [DOI] [PubMed] [Google Scholar]
- 5.Saadatmand S, Geuzinge HA, Rutgers EJT, et al. MRI versus mammography for breast cancer screening in women with familial risk (FaMRIsc): a multicentre, randomised, controlled trial. Lancet Oncol 20:1136–1147, 2019 [DOI] [PubMed] [Google Scholar]
- 6.Peters NH, Borel Rinkes IH, Zuithoff NP, et al. Meta-analysis of MR imaging in the diagnosis of breast lesions. Radiology 246:116–24, 2008 [DOI] [PubMed] [Google Scholar]
- 7.Gulani V, Calamante F, Shellock FG, et al. Gadolinium deposition in the brain: summary of evidence and recommendations. Lancet Neurol 16:564–570, 2017 [DOI] [PubMed] [Google Scholar]
- 8.Chen X, Li WL, Zhang YL, et al. Meta-analysis of quantitative diffusion-weighted MR imaging in the differential diagnosis of breast lesions. BMC Cancer 10:693, 2010 [DOI] [PMC free article] [PubMed] [Google Scholar]
- 9.Wu D, Li G, Zhang J, et al. Characterization of breast tumors using diffusion kurtosis imaging (DKI). PLoS One 9:e113240, 2014 [DOI] [PMC free article] [PubMed] [Google Scholar]
- 10.Christou A, Ghiatas A, Priovolos D, et al. Accuracy of diffusion kurtosis imaging in characterization of breast lesions. Br J Radiol 90:20160873, 2017 [DOI] [PMC free article] [PubMed] [Google Scholar]
- 11.Nogueira L, Brandao S, Matos E, et al. Application of the diffusion kurtosis model for the study of breast lesions. Eur Radiol 24:1197–203, 2014 [DOI] [PubMed] [Google Scholar]
- 12.Vidic I, Egnell L, Jerome NP, et al. Modeling the diffusion-weighted imaging signal for breast lesions in the b = 200 to 3000 s/mm(2) range: quality of fit and classification accuracy for different representations. Magn Reson Med, 2020 [DOI] [PubMed] [Google Scholar]
- 13.Luo J, Hippe DS, Rahbar H, et al. Diffusion tensor imaging for characterizing tumor microstructure and improving diagnostic performance on breast MRI: a prospective observational study. Breast Cancer Res 21:102, 2019 [DOI] [PMC free article] [PubMed] [Google Scholar]
- 14.lima M, Kataoka M, Kanao S, et al. Intravoxel Incoherent Motion and Quantitative Non-Gaussian Diffusion MR Imaging: Evaluation of the Diagnostic and Prognostic Value of Several Markers of Malignant and Benign Breast Lesions. Radiology 287:432–441, 2018 [DOI] [PubMed] [Google Scholar]
- 15.Ghosh K, Brandt KR, Reynolds C, et al. Tissue composition of mammographically dense and non-dense breast tissue. Breast Cancer Res Treat 131:267–75, 2012 [DOI] [PMC free article] [PubMed] [Google Scholar]
- 16.Partridge SC, Singer L, Sun R, et al. Diffusion-weighted MRI: influence of intravoxel fat signal and breast density on breast tumor conspicuity and apparent diffusion coefficient measurements. Magn Reson Imaging 29:1215–21, 2011 [DOI] [PMC free article] [PubMed] [Google Scholar]
- 17.Delfaut EM, Beltran J, Johnson G, et al. Fat suppression in MR imaging: techniques and pitfalls. Radiographics 19:373–82, 1999 [DOI] [PubMed] [Google Scholar]
- 18.Baron P, Dorrius MD, Kappert P, et al. Diffusion-weighted imaging of normal fibroglandular breast tissue: influence of microperfusion and fat suppression technique on the apparent diffusion coefficient. NMR Biomed 23:399–405, 2010 [DOI] [PubMed] [Google Scholar]
- 19.Rodriguez-Soto AE, Andreassen MMS, Conlin CC, et al. Characterization of the Diffusion Signal of Breast Tissues using Multi-exponential Models. medRxiv:2020.04.27.20082271, 2020 [DOI] [PMC free article] [PubMed] [Google Scholar]
- 20.Karunamuni RA, Kuperman J, Seibert TM, et al. Relationship between kurtosis and bi-exponential characterization of high b-value diffusion-weighted imaging: application to prostate cancer. Acta Radiologica 59:1523–1529, 2018 [DOI] [PubMed] [Google Scholar]
- 21.Panagiotaki E, Chan RW, Dikaios N, et al. Microstructural characterization of normal and malignant human prostate tissue with vascular, extracellular, and restricted diffusion for cytometry in tumours magnetic resonance imaging. Invest Radiol 50:218–27, 2015 [DOI] [PubMed] [Google Scholar]
- 22.Chatterjee A, Bourne RM, Wang S, et al. Diagnosis of Prostate Cancer with Noninvasive Estimation of Prostate Tissue Composition by Using Hybrid Multidimensional MR Imaging: A Feasibility Study. Radiology 287:864–873, 2018 [DOI] [PMC free article] [PubMed] [Google Scholar]
- 23.Rakow-Penner RA, White NS, Parsons JK, et al. Novel technique for characterizing prostate cancer utilizing MRI restriction spectrum imaging: proof of principle and initial clinical experience with extraprostatic extension. Prostate Cancer Prostatic Dis 18:81–5, 2015 [DOI] [PubMed] [Google Scholar]
- 24.White NS, McDonald CR, Farid N, et al. Diffusion-weighted imaging in cancer: Physical foundations and applications of restriction spectrum imaging. Cancer Research 74:4638–4652, 2014 [DOI] [PMC free article] [PubMed] [Google Scholar]
- 25.White NS, Leergaard TB, D’Arceuil H, et al. Probing tissue microstructure with restriction spectrum imaging: Histological and theoretical validation. Hum Brain Mapp 34:327–46, 2013 [DOI] [PMC free article] [PubMed] [Google Scholar]
- 26.White NS, McDonald CR, Farid N, et al. Improved conspicuity and delineation of high-grade primary and metastatic brain tumors using “restriction spectrum imaging”: quantitative comparison with high B-value DWI and ADC. AJNR Am J Neuroradiol 34:958–64, s1, 2013 [DOI] [PMC free article] [PubMed] [Google Scholar]
- 27.Woodhams R, Matsunaga K, Iwabuchi K, et al. Diffusion-weighted imaging of malignant breast tumors: the usefulness of apparent diffusion coefficient (ADC) value and ADC map for the detection of malignant breast tumors and evaluation of cancer extension. J Comput Assist Tomogr 29:644–9, 2005 [DOI] [PubMed] [Google Scholar]
- 28.Jin YN, Zhang Y, Cheng JL, et al. Monoexponential, Biexponential, and stretched-exponential models using diffusion-weighted imaging: A quantitative differentiation of breast lesions at 3.0T. J Magn Reson Imaging 50:1461–1467, 2019 [DOI] [PubMed] [Google Scholar]
- 29.Zhou WP, Zan XY, Hu XY, et al. Characterization of breast lesions using diffusion kurtosis model-based imaging: An initial experience. J Xray Sci Technol 28:157–169, 2020 [DOI] [PubMed] [Google Scholar]
- 30.Vidic I, Egnell L, Jerome NP, et al. Support vector machine for breast cancer classification using diffusion-weighted MRI histogram features: Preliminary study. J Magn Reson Imaging 47:1205–1216, 2018 [DOI] [PubMed] [Google Scholar]
- 31.Teruel JR, Goa PE, Sjobakk TE, et al. Diffusion weighted imaging for the differentiation of breast tumors: From apparent diffusion coefficient to high order diffusion tensor imaging. J Magn Reson Imaging 43:1111–21, 2016 [DOI] [PubMed] [Google Scholar]
- 32.Vidic I, Jerome NP, Bathen TF, et al. Accuracy of breast cancer lesion classification using intravoxel incoherent motion diffusion-weighted imaging is improved by the inclusion of global or local prior knowledge with bayesian methods. J Magn Reson Imaging 50:1478–1488, 2019 [DOI] [PubMed] [Google Scholar]
- 33.Teruel JR, Goa PE, Sjobakk TE, et al. A Simplified Approach to Measure the Effect of the Microvasculature in Diffusion-weighted MR Imaging Applied to Breast Tumors: Preliminary Results. Radiology 281:373–381, 2016 [DOI] [PubMed] [Google Scholar]
- 34.Egnell L, Vidic I, Jerome NP, et al. Stromal Collagen Content in Breast Tumors Correlates With In Vivo Diffusion-Weighted Imaging: A Comparison of Multi b-Value DWI With Histologic Specimen From Benign and Malignant Breast Lesions. J Magn Reson Imaging, 2019 [DOI] [PubMed] [Google Scholar]
- 35.Teruel JR, FjØsne HE, Østlie A, et al. Inhomogeneous static magnetic field-induced distortion correction applied to diffusion weighted MRI of the breast at 3T. Magnetic Resonance in Medicine 74:1138–1144, 2015 [DOI] [PubMed] [Google Scholar]
- 36.Gudbjartsson H, Patz S: The Rician distribution of noisy MRI data. Magn Reson Med 34:910–4, 1995 [DOI] [PMC free article] [PubMed] [Google Scholar]
- 37.Holland D, Kuperman JM, Dale AM: Efficient correction of inhomogeneous static magnetic field-induced distortion in Echo Planar Imaging. Neuroimage 50:175–83, 2010 [DOI] [PMC free article] [PubMed] [Google Scholar]
- 38.Jensen JH, Helpern JA, Ramani A, et al. Diffusional kurtosis imaging: the quantification of non-gaussian water diffusion by means of magnetic resonance imaging. Magn Reson Med 53:1432–40, 2005 [DOI] [PubMed] [Google Scholar]
- 39.Panagiotaki E, Walker-Samuel S, Siow B, et al. Noninvasive Quantification of Solid Tumor Microstructure Using VERDICT MRI. Cancer Research 74:1902–1912, 2014 [DOI] [PubMed] [Google Scholar]
- 40.Tamura T, Usui S, Murakami S, et al. Comparisons of multi b-value DWI signal analysis with pathological specimen of breast cancer. Magnetic Resonance in Medicine 68:890–897, 2012 [DOI] [PubMed] [Google Scholar]
- 41.Provenzale JM, Engelter ST, Petrella JR, et al. Use of MR exponential diffusion-weighted images to eradicate T2 “shine-through” effect. AJR Am J Roentgenol 172:537–9, 1999 [DOI] [PubMed] [Google Scholar]
- 42.American College of Radiology: Breast density: breast cancer screening. https://www.acr.org/-/media/ACR/Files/Breast-Imaging-Resources/Breast-Density-bro_ACR_SBI.pdf. Accessed March 20. 2020
- 43.Tsushima Y, Takahashi-Taketomi A, Endo K: Magnetic resonance (MR) differential diagnosis of breast tumors using apparent diffusion coefficient (ADC) on 1.5-T. J Magn Reson Imaging 30:249–55, 2009 [DOI] [PubMed] [Google Scholar]
- 44.Giess CS, Raza S, Birdwell RL: Patterns of nonmasslike enhancement at screening breast MR imaging of high-risk premenopausal women. Radiographics 33:1343–60, 2013 [DOI] [PubMed] [Google Scholar]
- 45.Shimauchi A, Jansen SA, Abe H, et al. Breast cancers not detected at MRI: review of false-negative lesions. AJR Am J Roentgenol 194:1674–9, 2010 [DOI] [PubMed] [Google Scholar]
- 46.Telegrafo M, Rella L, Stabile Ianora AA, et al. Unenhanced breast MRI (STIR, T2-weighted TSE, DWIBS): An accurate and alternative strategy for detecting and differentiating breast lesions. Magn Reson Imaging 33:951–5, 2015 [DOI] [PubMed] [Google Scholar]
- 47.Le Bihan D, Breton E, Lallemand D, et al. MR imaging of intravoxel incoherent motions: application to diffusion and perfusion in neurologic disorders. Radiology 161:401–7, 1986 [DOI] [PubMed] [Google Scholar]
- 48.Sigmund EE, Cho GY, Kim S, et al. Intravoxel incoherent motion imaging of tumor microenvironment in locally advanced breast cancer. Magn Reson Med 65:1437–47, 2011 [DOI] [PMC free article] [PubMed] [Google Scholar]
- 49.Cho GY, Gennaro L, Sutton EJ, et al. Intravoxel incoherent motion (IVIM) histogram biomarkers for prediction of neoadjuvant treatment response in breast cancer patients. European journal of radiology open 4:101–107, 2017 [DOI] [PMC free article] [PubMed] [Google Scholar]
- 50.Hammond MEH, Hayes DF, Wolff AC, et al. American society of clinical oncology/college of american pathologists guideline recommendations for immunohistochemical testing of estrogen and progesterone receptors in breast cancer. Journal of oncology practice 6:195–197, 2010 [DOI] [PMC free article] [PubMed] [Google Scholar]
- 51.Wolff AC, Hammond MEH, Hicks DG, et al. Recommendations for Human Epidermal Growth Factor Receptor 2 Testing in Breast Cancer: American Society of Clinical Oncology/College of American Pathologists Clinical Practice Guideline Update. Journal of Clinical Oncology 31:3997–4013, 2013 [DOI] [PubMed] [Google Scholar]
- 52.Wolff AC, Hammond MEH, Allison KH, et al. Human Epidermal Growth Factor Receptor 2 Testing in Breast Cancer: American Society of Clinical Oncology/College of American Pathologists Clinical Practice Guideline Focused Update. J Clin Oncol 36:2105–2122, 2018 [DOI] [PubMed] [Google Scholar]
Associated Data
This section collects any data citations, data availability statements, or supplementary materials included in this article.