Abstract
Background:
Cryoballoon apposition is crucial for durable pulmonary vein isolation (PVI) in atrial fibrillation, yet the balloon is difficult to visualize by conventional mapping systems, and pulmonary venography may miss small or out-of-plane leaks. We report a novel imaging system that offers real-time 3D navigation of the cryoballoon within atrial anatomy that may circumvent these issues.
Methods and results:
A novel overlay guidance system (OGS) registers already-acquired segmented atrial cardiac tomography (CT) with fluoroscopy, enabling real-time visualization of the cryoballoon within tomographic left atrial imaging during PVI. Phantom experiments in a patient-specific 3D printed left atrium showed feasibility for confirming PV apposition and leaks. We applied OGS prospectively to 68 PVs during PVI in 17 patients. The cryoballoon was successfully reconstructed in all cases, and its apposition was compared to concurrent PV venography. The OGS uncovered leaks undetected by venography in nine veins (eight cases), which enabled repositioning, confirming apposition in remaining 68 veins. Concordance of OGS to venography was 83.8% (χ2, P < .01)
Conclusions:
We report a new system for real-time imaging of cryoballoon catheters to ensure PV apposition within the tomography of the left atrium. While providing high concordance with other imaging modalities for confirming balloon apposition or leak, the system also identified leaks missed by venography. Future studies should determine if this tool can provide a new reference for cryoballoon positioning.
Keywords: ablation, atrial fibrillation, cryoballoon, PVI
1. INTRODUCTION
Atrial fibrillation (AF) affects an estimated 3–6 million patients in the United States.1,2 Pulmonary vein isolation (PVI) is cornerstone of ablative therapy in patients in whom AF has been refractory to anti-arrhythmic medication3 and is increasingly performed by cryoballoon for paroxysmal AF4,5 and in patients with persistent AF. One major limitation to cryoballoon therapy is the ability to obtain optimal apposition to the pulmonary vein (PV) ostia, which is required for sufficient PVI.6–8 Current available approaches each have limitations. Pulmonary venography using radio-opaque contrast is still frequently used, even in laboratories that aim to reduce fluoroscopic exposure,9 yet cannot readily quantify small leaks and may miss them. Although electroanatomic imaging is routinely used to visualize radiofrequency catheter contact, it often cannot detect PV apposition of the cryoballoon.7,8
We set out to validate and test the ability of a novel overlay guidance system (OGS) (Siemens Healthcare, Forchheim, Germany) to visualize PV apposition and leaks during cryoballoon therapy. The OGS can reconstruct the cryoballoon catheter within the left atrial anatomy segmented from patient-specific CT scans. Earlier versions of this software package were found to be as accurate as current electroanatomic mapping systems.10 We first performed a calibration study in a patient-specific 3D-printed left atrium (LA), in which we compared the OGS to venography to identify and quantify leaks of different known sizes. We then proceeded to a prospective study in a pilot clinical study at the Stanford University Medical Center.
2. METHODS
2.1. Novel imaging system
At procedure onset, the novel imaging system registers preprocedural computed tomography (CT) with biplane fluoroscopy in the same Cartesian (x,y,z) coordinate system. Computer reconstruction is then used to display tomographic LA anatomy and identified in-field catheters (in this case, cryoballoon) in 3D in subsequent real-time fluoroscopic images.
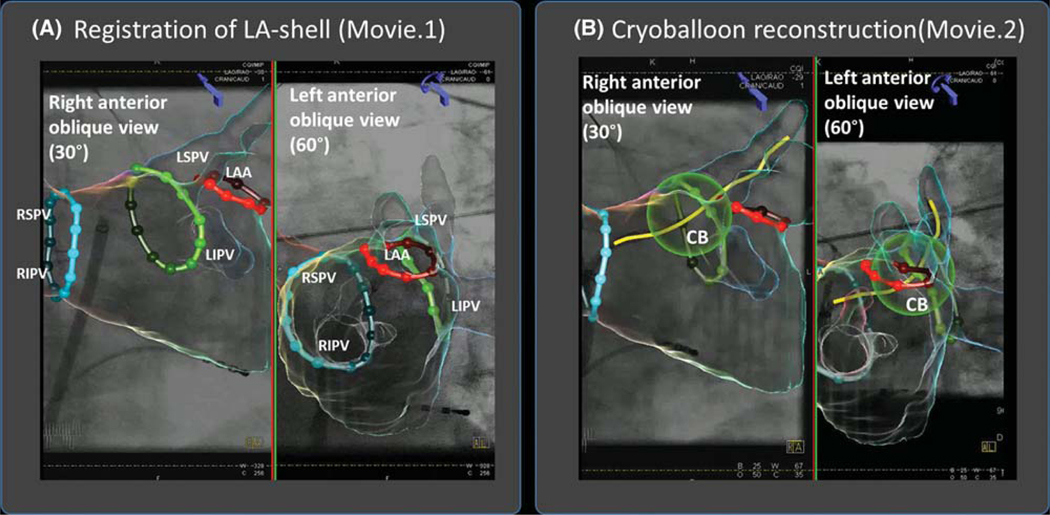
After a left atrial shell is segmented from preprocedural CT using Syngo™ (Siemens Healthcare), it is registered to 30° right anterior oblique and 60° left anterior oblique fluoroscopy views based on left atrial landmarks to (x,y,z) register both image sets (Figure 1A). The system takes inputs of real-time fluoroscopy, the table height, the position of both C-arms, and detector position. Continuous automatic data transfer from the biplane X-ray image system maintains registration throughout the procedure. The imaging system can also be used in a monoplane setting. In this case, registration should be performed in two steps using an anatomic landmark (e.g., the spine) first in the anterior-posterior view followed by registration in the lateral view.
FIGURE 1.
Novel overlay guidance system superimposes left atrial anatomy on fluoroscopic images during cryoablation procedure. A, Registration of LA-shell segmented from preprocedural CT on biplane fluoroscopic view (and Movie 1) in 30◦ right anterior oblique and 60° left anterior oblique views. Contrast is injected and the model is fit to the outline of the contrast cloud in both views. B, Cryoballoon reconstruction (and Movie 2). From this step, the cryoballoon catheter is identified in both views by manually marked points (proximal and distal ends of the balloon, and the distal end of the wire), which then allow automatic balloon reconstruction Abbreviations: CB = cryoballoon; LAA = left atrial appendage; LIPV = left inferior pulmonary vein; LSPV = left superior pulmonary vein; RIPV = right inferior pulmonary vein; RSPV = right superior pulmonary vein
To reconstruct an object (e.g., cryoballoon), fiducial points are first marked in biplane fluoroscopic views, providing reference points in cartesian coordinates (x,y,z). For the cryoballoon, we used three manually marked fiducial points: the proximal and distal ends of the balloon, and the distal end of the wire to automatically reconstruct the cryoballoon and its shaft (Figure 1B). The system outputs biplane fluoroscopy images with a superimposed 3D shell of the LA and catheter localization inside the heart based on triangulation. The cryoballoon is displayed as a sphere in the 3D CT reconstruction. Substantial movement of the patient relative to the image intensifier cannot then be corrected and may require repeat registration. Patients in our series (below) were studied under general anesthesia.
2.2. Calibration against 3D printed patient-specific LA
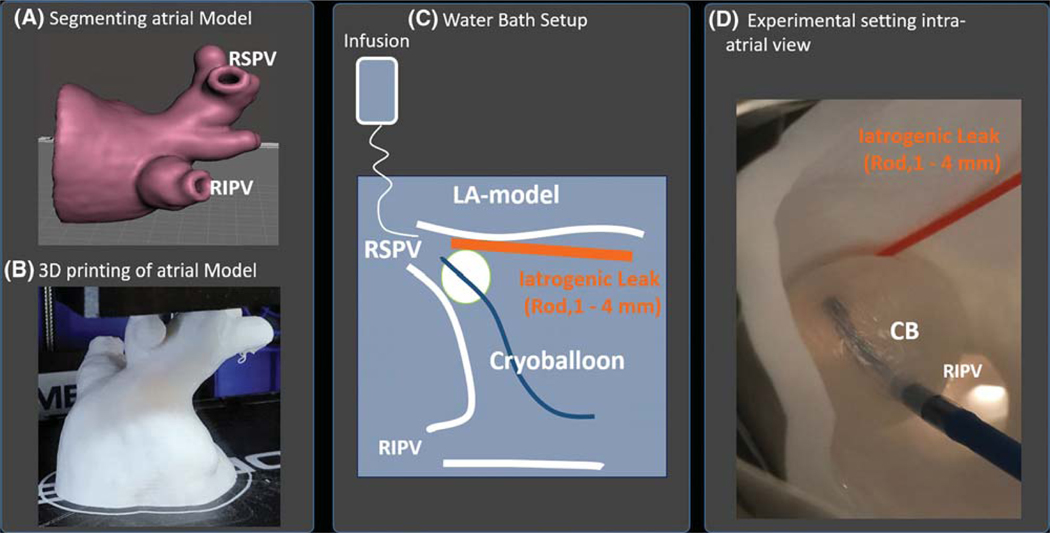
Feasibility testing was first performed using a 3D-printed left atrial plastic phantom model. We segmented the CT-imaged LA of a 69-year-old man with persistent AF from our series using the Syngo™ software package). Segmented atrial anatomy was analyzed in 3D modeling software (Meshmixer 3.2; Autodesk, Inc., San Rafael, CA) (Figure 2A), focusing on the LA including left PVs and appendage, setting wall thickness to 4 mm. We transferred the model to printing software (Autodesk Print Studio 1.6.5; Autodesk, Inc.) and printed the model using a 3D printer (Dremel Idea Builder 3D40; Dremel, Racine, WI) (Figure 2B). The process took 4 h. The atrial phantom was printed to 1:1 scale, has similar resolution to CT imaging (0.1 mm tolerance), and its material is less radiopaque than contrast and reflects ultrasound waves.
FIGURE 2.
Calibration of overlay guidance system in patient-specific 3D printed left atrial phantom. Atrial model (A) is segmented from preprocedural CT of a patient in the series and 3D printed (B). C, Atrial model was fixated in a waterbath with saline infused to simulate PV blood flow. A rod of varying diameters (1–4 mm) was interposed between the endocardial PV surface and cryoballoon to generate calibrated iatrogenic leaks. Leaks or absence of leaks were determined using venography and overlay guidance system. D, Photograph of the experiment Abbreviations: CB = cryoballoon; RIPV = right inferior pulmonary vein; RSPV = right superior pulmonary vein
2.3. Phantom experiment
The personalized left atrial phantom was positioned in a water bath (Figure 2C) and then registered in the OGS. To simulate pulmonary venous return, we infused normal saline into the PVs, at flow rate of 1.2 L/min to simulate cardiac output of 5 L/min distributed evenly between all 4 PVs in this patient. A cryoballoon (28 mm; Arctic front Advance, Medtronic, Minneapolis, MN) was inflated and inserted directly into the right superior PV. The cryoballoon position was determined using the OGS and venography performed by infusing contrast agent (Isovue-300; Bracco Diagnostics, Milan, Italy) through the lumen of cryoballoon.
First, occlusion was achieved and imaged concurrently with the OGS and venography. Second, to provide controlled leaks, plastic probes of 1, 2, 3, and 4 mm diameter (determined by a caliper gauge) were positioned superiorly in the PV (Figure 2D) and re-imaged with both modalities.
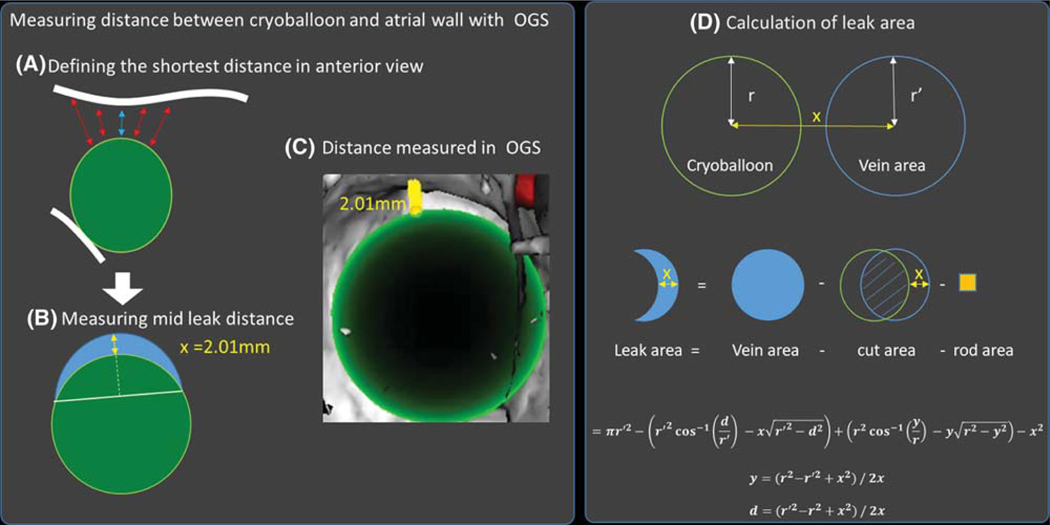
Third, leak sizes were measured. In the OGS, we measured the shortest distance between the cryoballoon and the left atrial wall first in the anterior-posterior view (Figure 3A). This allowed us to define a plane (blue) normal to the axis of the cryoballoon at height of the shortest distance, which represents the leak surface. The mid leak distance was then measured radially at the mid distance between the two touching points between LA wall and cryoballoon (Figure 3B and C).
FIGURE 3.
Analysis of calibration images in patient-specific LA phantom. A, The shortest line normal from the cryoballoon surface to the LA wall was defined in the anterior-posterior view of the PV, which defined a leak plane (blue) on which the mid leak normal (B) line from the balloon was measured (yellow arrow). C, Measurement of the mid leak distance using the OGS. D, Model used to calculate the leak area. To calculate the leak area, the area of the pulmonary vein ostium (blue) was calculated and the area covered by the cryoballoon subtracted. For the phantom experiment, the cross-section of the control rod was subtracted as well. r is the cryoballoon radius, r′ is the vein radius, and x is the control rod diameter
To calculate the leak area, the PV radius (r′) and the mid leak distance (x) were measured. Then the surface covered by the cryoballoon was subtracted from the surface of the pulmonary outlet . For the subtracted from the surface of the pulmonary outlet phantom experiment, the cross-section of the control rod (x2) was subtracted as well.
Figure 3D shows the model used, which led to the following equation:
where r is the cryoballoon radius, r’ is the vein radius, x is the mid leak distance ≈ size of control rod.
In venograms, leaks were categorized as no leak, mild leak, or more than moderate leak. Mild leak was identified if the contrast agent flow was linear and the contrast agent remained distal of the cryoballoon for >1 s, more moderate leak was identified if the contrast agent flow was turbulent, or the contrast agent was washed away after <1 s.
2.4. Patient series
We imaged 17 patients with the OGS, who were undergoing ablation for AF at the Stanford University Hospital, performed by three different physicians. Persistent AF was defined as AF for ≥7 days without self-termination. Shorter durations of AF without intervention for termination were labeled paroxysmal AF. AF had been refractory to >1 anti-arrhythmic medications. The study was approved by our Institutional Review Board.
2.5. Electrophysiological study and ablation
Patients were studied in the postabsorptive state. During clinical electrophysiological study, catheters were positioned in the right atrium (RA) and coronary sinus. Transseptal catheterization was performed for access to the LA. The cryoballoon catheter (Arctic Front Advance) was positioned in each PV antrum in turn, and contrast agent injected to verify contact of the cryoballoon with the PV antrum. The OGS was used during the procedure to visualize cryoballoon position. Cryoablation was then applied to each PV in turn, with verification of PV isolation using dedicated circular mapping catheters. The protocol used in this series was 180 s of cryoablation application for each PV, followed typically by a bonus freeze of 120 s. Parameters were adjusted in the case of phrenic proximity to the right PVs or esophageal temperature <15◦C.11,12
2.6. Measurement of PV leaks during cryoballoon ablation
2.6.1. Overlay guidance system
The cryoballoon position was saved and a video was generated containing a series of steps. First, an interior CT scan view was reconstructed with the cryoballoon in the PV antrum, then the angle of the CT scan view was altered by changing the tilt, for example, an anterior tilt, superior tilt, posterior tilt, and inferior tilt, to assess all possible leak locations. Videos of the CT scan images without the use of contrast were captured. These videos were assessed by three blinded clinical observers for analysis of apposition or leaks by consensus and assignment of a kappa score for interobserver reproducibility.
2.6.2. Venography
Contrast venography of the first cryoballoon position in each PV during the procedure was saved as a video sequence. These videos were assessed by three blinded clinical observers for analysis of apposition or leaks by consensus, with assignment of a kappa score for interobserver reproducibility.
2.7. Statistical analysis
Continuous data are represented as mean ± SD or median and interquartile range (IQR) as appropriate. Comparisons between two groups were made with Student’s t-tests and summarized with means and standard deviations for independent samples if normally distributed (e.g., age, left ventricular ejection fraction, body mass index [BMI]), or if not normally distributed, with the Mann-Whitney U test and summarized with medians and quartiles (CHADSVASc score). Nominal values were expressed as n (%) and compared with the Fisher exact test when expected cell frequency was <5 (e.g., gender, prior ablation, hypertension, coronary artery disease, stroke, and diabetes mellitus). The McNemar test was used to test paired dichotomous comparisons. A probability of <0.05 was considered statistically significant.
3. RESULTS
Table 1 shows patient demographics. There were 17 patients in the cohort, of whom eight (47.1%) had persistent AF. Thirteen were male and six had coronary artery disease. The mean age was 69 ± 8.0 years and their mean BMI was 27.5 ± 4.1 kg/m2.
TABLE 1.
Clinical demographic
| Entire cohort (n = 17) | Paroxysmal (n = 9) | Persistent AF (n = 8) | P | |
|---|---|---|---|---|
| Age (years) | 69.0 ± 8.0 | 69.8 ± 8.4 | 68.1 ± 7.4 | .66 |
| Male No. (%) | 13 (76.4%) | 7 (77.8%) | 6 (75.0%) | 1 |
| Prior atrial fibrillation ablation No. (%) | 12 (70.6%) | 6 (66.7%) | 6 (75.0%) | 1 |
| Hypertension No. (%) | 14 (82.4%) | 7 (77.8%) | 7 (87.5%) | 1 |
| Left ventricular (LV) ejection fraction (%) | 56.3 ± 11.0 | 58.3 ± 11.8 | 54.3 ± 9.6 | .46 |
| CHADSVASc score | 2 (1–3) | 2 (1–3) | 2 (2–3) | .63 |
| Coronary artery disease No. (%) | 6 (35.2%) | 3 (33.3%) | 3 (37.5%) | 1 |
| Body mass index (kg/m2) | 27.5 ± 4.1 | 25.7 ± 3.7 | 29.5 ± 3.6 | <.05 |
| Stroke No. (%) | 2 (11.7%) | 0 (0%) | 2 (25.0%) | .2 |
| Diabetes mellitus (DM) No. (%) | 1 (5.8%) | 1 (11.1%) | 0 (0%) | 1 |
3.1. Leak detection in phantom experiment
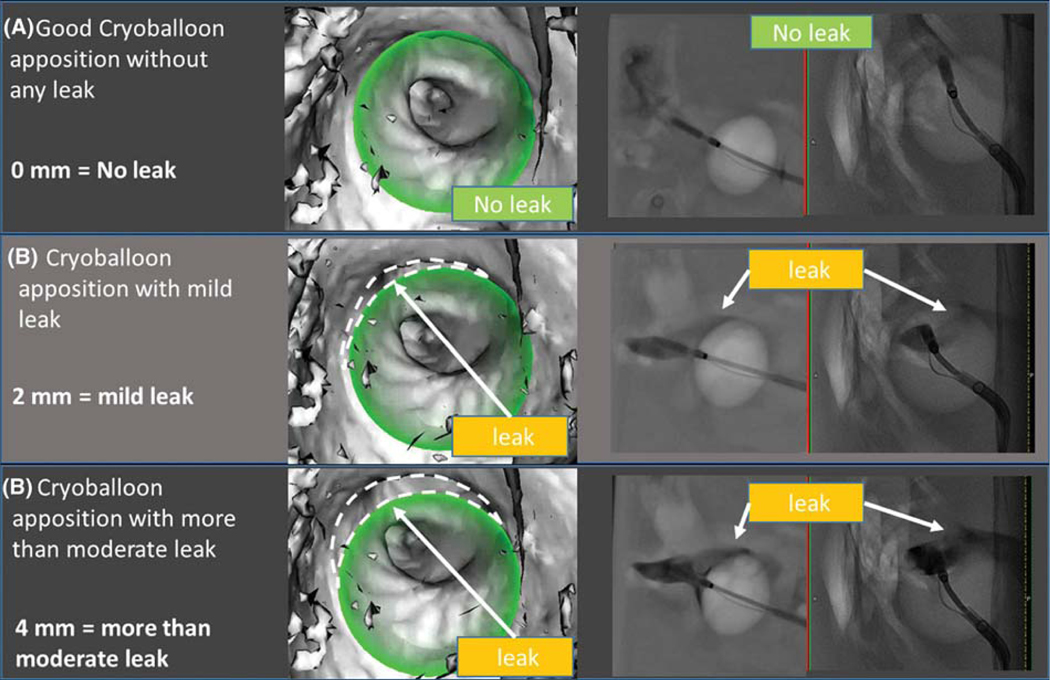
Venography and OGS both validated PV apposition or leak with the cryoballoon in the phantom experiment. Figure 4 shows comparative results on each visualization method to detect (a) no leak, (b) mild leak (2 mm), and (c) more than moderate leak (4 mm). In each case, the OGS correctly reconstructed the cryoballoon (in green) in the segmented atrial shell. Table 2 shows measurements performed during the experiment. The OGS accurately measured the distance between cryoballoon surface and left atrial wall at site of the rod. Having established feasibility of the system in a well-controlled atrial model with controlled flow, we proceeded to clinical validation.
FIGURE 4.
Results of phantom experiment: Leak detection by overlay guidance system and venogram: (A) No leak; (B) mild leak (2 mm); (C) more than moderate (4 mm). The novel imaging system (column 1) shows the reconstructed cryoballoon (in green) in the left atrial shell. The imaging system accurately identified apposition (a) or leak dimensions in each case (B and C). Venography (column 2) shows biplane cineangiograms during contrast infusion, again showing identifiable leaks (B and C) and albeit with difficulty to quantify size. Dashed lines were added to the figure to depict leaks; these are not part of the original image generated by the overlay guidance system
TABLE 2.
Leak detection by different methods (Phantom experiment)
| Leak size (defined by probe) (mm) | Overlay guidance system (mm) | Overlay guidance system (leak area) (mm2) | Venogram |
|---|---|---|---|
| 0 | 0 | 0 | No leak |
| 1 | 1.05 | 55 | Mild leak |
| 2 | 2.01 | 108 | Mild leak |
| 3 | 3.12 | 159 | More than moderate leak |
| 4 | 4.01 | 208 | More than moderate leak |
3.2. Clinical use of overlay guidance system (venogram vs OGS)
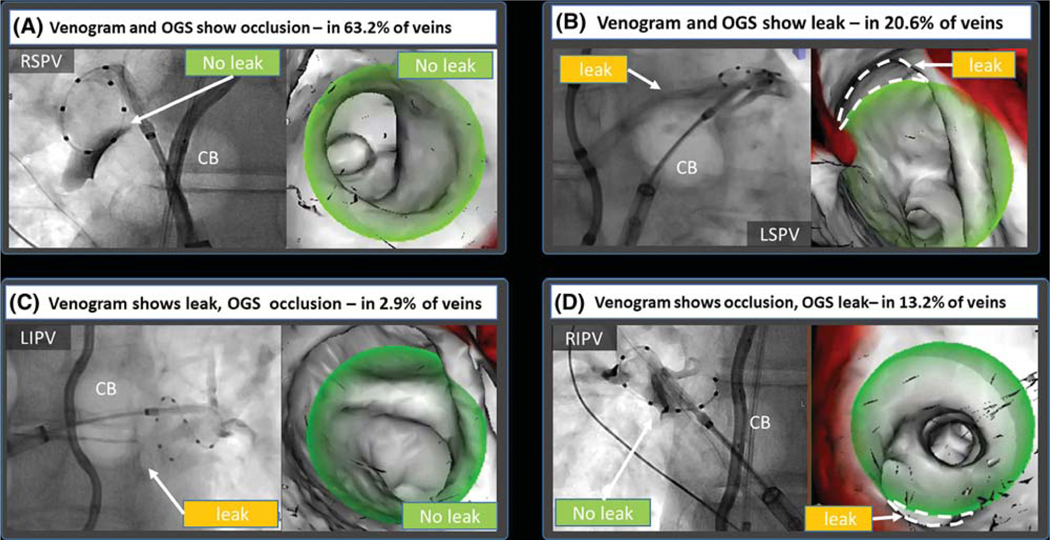
The use of the novel mapping system was feasible in all patients, with no complications. No additional fluoroscopy images were required. Figure 5 shows different scenarios observed in this study. In the majority of cases, the OGS and venography were concordant, showing either occlusion (Figure 5A) of leak (Figure 5B). Discordance was also observed. In some cases, venogram showed leak where OGS did not (Figure 5C), while in others OGS discovered leaks not shown by venogram (Figure 5D).
FIGURE 5.
First venogram performed after cryoballoon apposition at each vein. In the majority of cases (83.8%), there was concordance between venogram and the overlay guidance system (OGS). A, In 63.2% of PVs, both methods showed occlusion. C, The majority of leaks (20.6%) were detected by both venography and the OGS. C, In 2.9%, the OGS did not show a leak detected by venography. D, In 13.2% of PVs, the OGS was able to detect leaks missed by venogram. Dashed lines were added to the figure to depict leaks, these are not part of the original image generated by the overlay guidance system
Concordance and discordance between venography and the novel imaging system are shown in Table 3. Overall, the concordance between the novel imaging system and venogram was 83.8% (57 veins). Cryoballoon occlusion of the PVs by venography and the OGS was seen in 63.2% of cases (43 veins). Leaks were detected by venography and OGS in 20.6% of the PVs (14 veins). There was discordance in 16.2% of the PVs (11 veins). Venography showed leaks not seen on the OGS in 2.9% of cases (two PVs). The OGS showed leaks not detected by venography in 13.2% of cases (nine PVs) (Table 3; 𝜒2, P < .05).
TABLE 3.
Concordance and discordance between overlay guidance system and venography for identifying PV apposition and leaks
| Venogram |
||||
|---|---|---|---|---|
| Leak | No leak | Total | ||
| Overlay guidance system | Leak | 14 (20.6%) | 9 (13.2%) | 23 (33.8%) |
| No leak | 2 (2.9%) | 43 (63.2%) | 45 (66.2%) | |
| Total | 16 (23.5%) | 52 (76.5%) | 68 (100%) | |
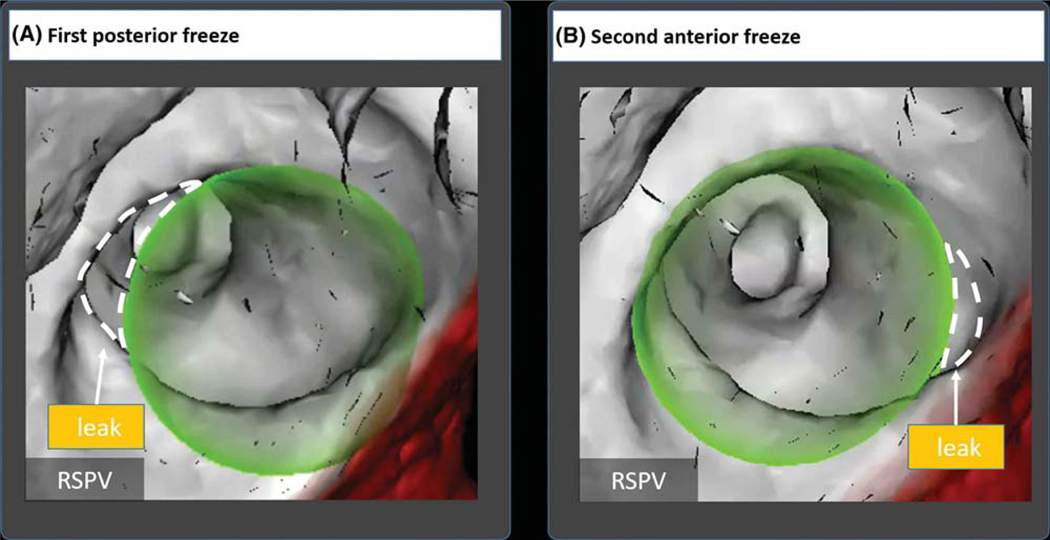
Figure 6 shows staged cryotherapy of the posterior and then anterior right superior PV in a 72-year-old woman, with balloon positioning and PV gaps tracked in real time using the overlay guidance system. This stepwise approach could also be used in patients with a left common PV ostium. Such antral ablation strategies have shown to lead to success rates, which are similar to those in patients without a left common PV ostium.13
FIGURE 6.
Two-step cryoballoon isolation of right superior pulmonary vein in a 72-year old woman. A, Initial positioning showed an anterior leak by venography confirmed by the overlay guidance system (OGS). Staged cryoballoon therapy started with therapy delivery to the posterior portion of the RSPV. B, The cryoballoon was then repositioned to cover the anterior RSPV by venography and confirmed on OGS. The OGS was able to visualize elimination of selected gaps by repositioning of the cryoballoon in real time. Dashed lines were added to the figure to depict leaks; these are not part of the original image generated by the overlay guidance system
3.2.1. Assessment of divergence in PV leak assessment
In cases in which the OGS detected cryoballoon-PV leaks undetected on corresponding venograms, we identified three reasons. First, leaks could be out of plane on the venogram, making detection difficult. This was seen in 83.3% (15 of 18 fluoroscopy images). Second, catheters or other features could overlap the venogram and obscure aleak. This was seen in 66.7% (12 of 18 monoplane fluoroscopy images). Third, poor image quality obscured leak detection in 33.3% (six monoplane fluoroscopy images in three patients with BMI > 30 kg/m2.
In terms of anatomical location of divergence, the OGS and venography showed 100% concordance (76% occlusions, 24% leak) at the left superior PV. The right inferior PV showed most discrepancies (41% concordant occlusions, 29% concordant leaks, 29% discordance).
Interrater agreement on venography showed agreement of 79.4%, with a Kappa score ranging from 0.46 to 0.50 consistent with moderate agreement. The interrater agreement for the OGS was 92.6% with a Kappa score ranging from 0.66 to 0.83 consistent with good to very good agreement.
3.2.2. Additional case examples
The OGS was also used in selected cases to reconstruct other catheters. Figure S1 shows its use to visualize intracardiac baskets (Abbott, Chicago, IL) within the LA, and Figure S2 shows its use to guide transseptal puncture.
4. DISCUSSION
We describe calibration studies and early clinical experience of a computerized OGS, which can track cryoballoon catheters in real time relative to the PVs and detect leaks. Calibration in custom 3D-printed patient-specific atrial phantom studies showed that the novel system accurately detected and quantified leaks compared to venography from iatrogenic obstacles of known size. Applied prospectively to patients, the OGS showed high concordance with traditional venography to confirm PV leaks, but also detected several off-plane or small leaks missed by venography. This study motivates future larger studies to determine if this approach can improve apposition of the cryoballoon to the PVs and may improve long-term outcomes.
4.1. Phantom experiment
The use of phantoms enabled us to calibrate the OGS to venography under controlled conditions. Both methods were able to detect iatrogenic leaks. However, while venography allowed only subjective measures of leaks, the OGS provided a direct and precise measurement of gap size (lack of opposition at the PV antrum) and leak. The OGS enabled calculation of leak surface area. The phantom experiment also provided a direct comparison between the methods and the iatrogenic leak size.
4.2. Prospective use in patients
The OGS enabled registration of the LA as well as reconstruction of the cryoballoon position in all cases. The OGS performed well in our prospective series, enabling us to confirm apposition seen by venography in 83.8% of cases, and detect leaks including 13.2%, which were not readily apparent on venography. Another advantage of the overlay guidance system was its greater interobserver reproducibility than for venography (K = 0.66–0.83 in OGS vs K = 0.46–0.50 in venogram). The OGS was used to enable cryoballoon repositioning in 3D based on visualized leaks (Figure 6).
4.3. General potential of the novel overlay guidance system
In most centers, cryoballoon ablation is performed without the use of a mapping system, since electroanatomic mapping systems rarely locate the cryoballoon catheter. The OGS can be used in those cases to provide intraprocedural visualization, navigation, and orientation. The OGS reconstructs any catheter from fluoroscopy via triangulation, and is thus not susceptible to electronic potential variation. The OGS could potentially be used for other procedures such as for visualizing devices for ventricular septal defect closure, ICD-leads, or mechanic valve placement.
4.4. Limitations
This study has several limitations. First, the phantom was printed from a rigid material, which does not reflect the flexibility of a human atrium. The human atrial wall might adapt to the cryoballoon while the printed atrium cannot. Nevertheless, we estimated that the dimensions of the phantom were sufficient to compare PV apposition and leak between imaging methods. Second, clinically, the quality of venography depends on multiple factors. Nevertheless, the examples used in these cases (see figures) show difficult-to-identify out of plane leaks, especially if monoplane fluoroscopy is used, which were seen using the OGS. Third, the OGS is a fluoroscopy-based navigation system, which may be less relevant to fluoroscopy-less laboratories. Nevertheless, fluoroscopy is often used during cryoballoon procedures, and in this series no additional X-ray images were obtained for the use of this navigation system. Finally, registration of the segmented atrium to the patient atrium is important. Offsets caused by misregistration or patient movement would cause errors. We saw this in 2.9% of the PVs, where the venogram showed leaks not detected by the OGS.
5. CONCLUSIONS
A novel computerized overlay guidance system enables real-time positioning of cryoballoon catheter within the LA to detect apposition to and leaks from the PV. Calibration in custom 3D-printed patient-specific phantoms confirmed its accuracy. Prospective use in a series of patients showed good concordance and detection of small or off-plane PV leaks missed by venography. Future studies should determine if this approach to visualize the cryoballoon within atrial anatomy in real time improves apposition to the PVs and may improve long-term outcomes.
Supplementary Material
ACKNOWLEDGMENT
This study was performed in (partial) fulfillment of the requirements for obtaining the degree “Dr. med.”
Abbreviations:
- AF
atrial fibrillation
- LA
left atrium
- OGS
overlay guidance system
- RA
right atrium
- PV
pulmonary vein
- PVI
pulmonary vein isolation
Footnotes
SUPPORTING INFORMATION
Additional supporting information may be found online in the Supporting Information section at the end of the article.
CONFLICT OF INTEREST
Dr Narayan reports compensation for his services till date from Abbott Laboratories (modest), American College of Cardiology Foundation (modest), Intellectual Property Rights from University of California Regents and Stanford University (modest), and research grants from National Institutes for Health (significant). The remaining authors Dr Wang, Mr Kowalewski, Mr Rodrigo, Mr Cruz, Dr Brodt, and Dr Haddad report no conflict of interest.
REFERENCES
- 1.Go A, Hylek EM, Phillips KA, et al. Prevalence of diagnosed atrial fibrillation in adults: national implications for rhythm management and stroke prevention: the AnTicoagulation and Risk Factors in Atrial Fibrillation (ATRIA) Study. JAMA. 2001;285:2370–2375. [DOI] [PubMed] [Google Scholar]
- 2.Miyasaka Y, Barnes ME, Gersh BJ, et al. Secular trends in incidence of atrial fibrillation in Olmsted County, Minnesota, 1980 to 2000, and implications on the projections for future prevalence. Circulation. 2006;114:119–125. [DOI] [PubMed] [Google Scholar]
- 3.Calkins H, Kuck KH, Cappato R, et al. 2012 HRS/EHRA/ECAS expert consensus statement on catheter and surgical ablation of atrial fibrillation: recommendations for patient selection, procedural techniques, patient management and follow-up, definitions, endpoints, and research trial design. Europace. 2012;14:528–606. [DOI] [PubMed] [Google Scholar]
- 4.Kuck KH, Furnkranz A, Chun KR, et al. Cryoballoon or radiofrequency ablation for symptomatic paroxysmal atrial fibrillation: reintervention, rehospitalization, and quality-of-life outcomes in the FIRE AND ICE trial. Eur Heart J. 2016;37:2858–2865. [DOI] [PMC free article] [PubMed] [Google Scholar]
- 5.Chun KRJ, Brugada J, Elvan A, et al. The impact of cryoballoon versus radiofrequency ablation for paroxysmal atrial fibrillation on healthcare utilization and costs: an economic analysis from the FIRE AND ICE Trial. J Am Heart Assoc. 2017;6. 10.1161/JAHA.117.002230 [DOI] [PMC free article] [PubMed] [Google Scholar]
- 6.Andrade JG, Dubuc M, Guerra PG, et al. The biophysics and biomechanics of cryoballoon ablation. Pacing Clin Electrophysiol. 2012;35: 1162–1168. [DOI] [PubMed] [Google Scholar]
- 7.Su W, Kowal R, Kowalski M, et al. Best practice guide for cryoballoon ablation in atrial fibrillation: the compilation experience of more than 3000 procedures. Heart Rhythm. 2015;12:1658–1666. [DOI] [PubMed] [Google Scholar]
- 8.Su W, Aryana A, Passman R, et al. Cryoballoon best practices II: practical guide to procedural monitoring and dosing during atrial fibrillation ablation from the perspective of experienced users. Heart Rhythm. 2018;15:1348–1355. [DOI] [PubMed] [Google Scholar]
- 9.Rubesch-Kutemeyer V, Fischbach T, Guckel D, et al. Long-term development of radiation exposure, fluoroscopy time and contrast media use in daily routine in cryoballoon ablations after implementation of intracardiac echocardiography and other radioprotective measures: experiences from a large single-centre cohort. J Interv Card Electrophysiol. 2019. 10.1007/s10840-019-00564-5 [DOI] [PubMed] [Google Scholar]
- 10.Bourier F, Fahrig R, Wang P, et al. Accuracy assessment of catheter guidance technology in electrophysiology procedures: a comparison of a new 3D-based fluoroscopy navigation system to current electroanatomic mapping systems. J Cardiovasc Electrophysiol. 2014;25:74–83. [DOI] [PubMed] [Google Scholar]
- 11.Metzner A, Burchard A, Wohlmuth P, et al. Increased incidence of esophageal thermal lesions using the second-generation 28-mm cryoballoon. Circ Arrhythm Electrophysiol. 2013;6:769–775. [DOI] [PubMed] [Google Scholar]
- 12.Furnkranz A, Bordignon S, Bohmig M, et al. Reduced incidence of esophageal lesions by luminal esophageal temperature-guided second-generation cryoballoon ablation. Heart Rhythm. 2015;12:268–274. [DOI] [PubMed] [Google Scholar]
- 13.Heeger CH, Tscholl V, Wissner E, et al. Acute efficacy, safety, and long-term clinical outcomes using the second-generation cryoballoon for pulmonary vein isolation in patients with a left common pulmonary vein: a multicenter study. Heart Rhythm. 2017;14:1111–1118. [DOI] [PubMed] [Google Scholar]
Associated Data
This section collects any data citations, data availability statements, or supplementary materials included in this article.


