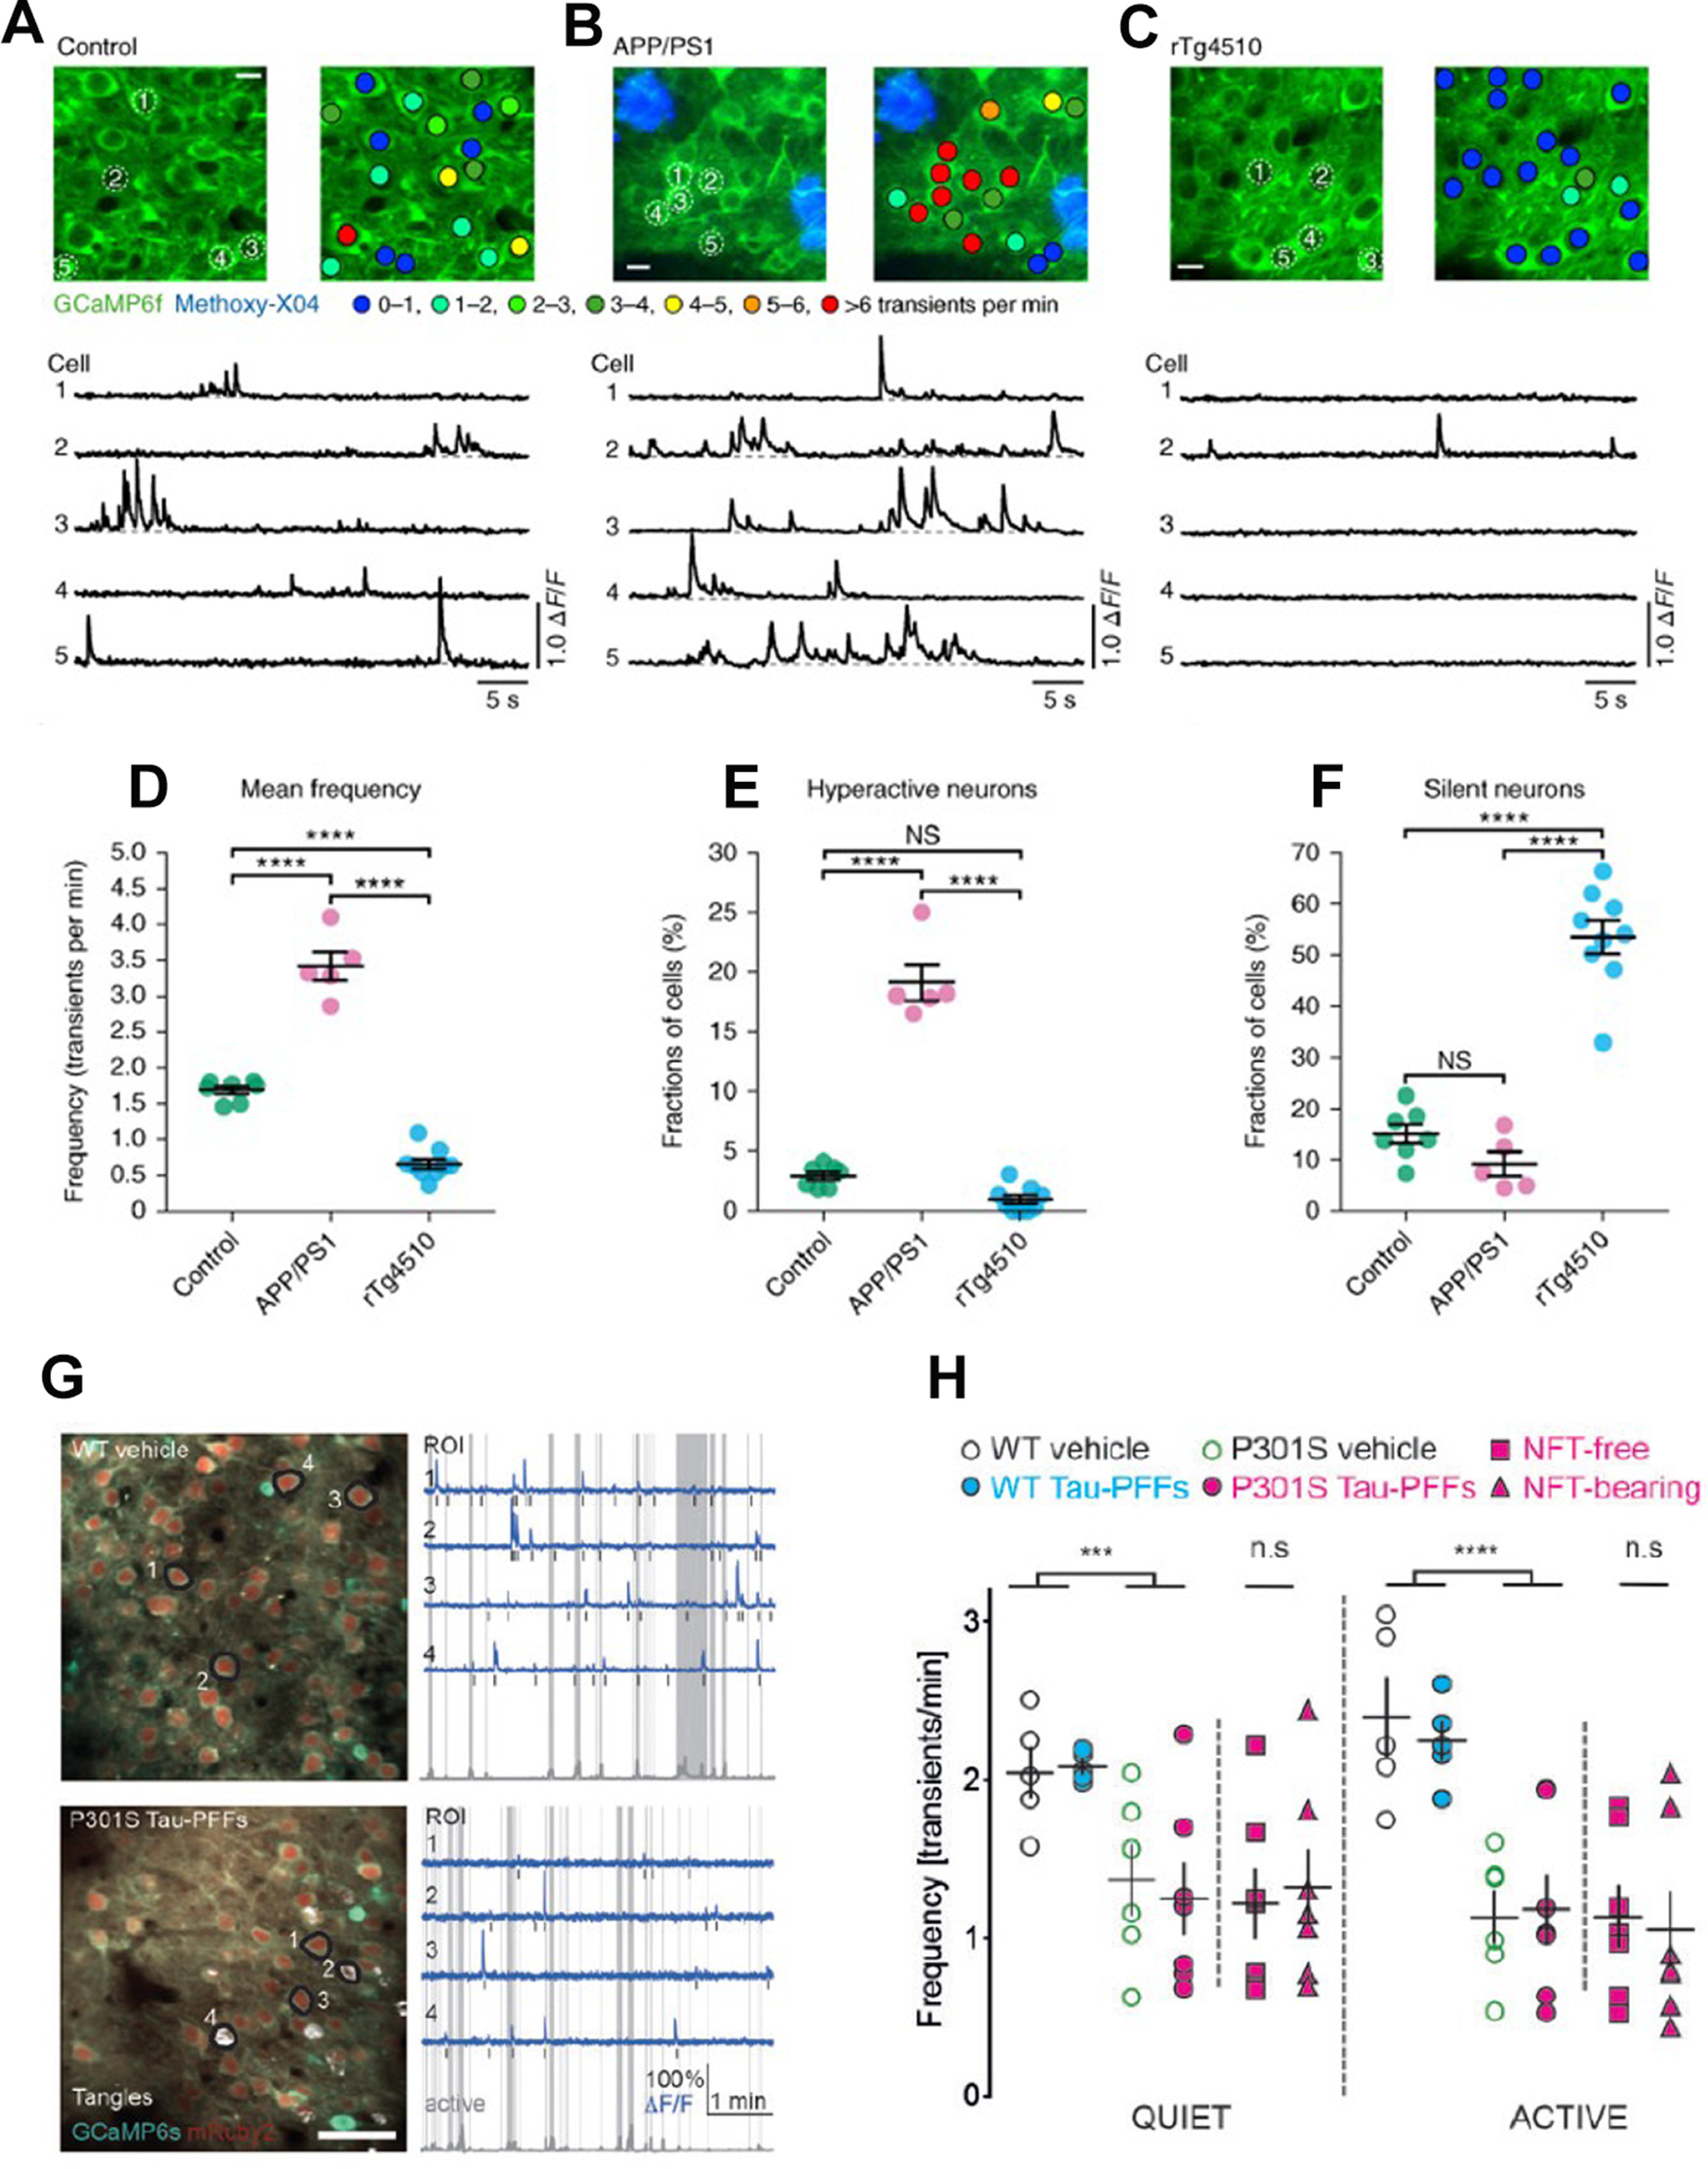
Figure 4.

In vivo evidence of suppression of neuronal activity in tau mouse models. A–F, Neuronal silencing in rTg4510 mice as compared with neuronal hyperactivity in APP/PS1 mice. Reproduced with permission from Busche et al. (2019). A–C, top, In vivo two-photon fluorescence images of GCaMP6f-expressing (green) layer 2/3 neurons in the parietal cortex and corresponding activity maps from WT controls (A), APP/PS1 (B), and rTg4510 (C) mice. In APP/PS1 mice, plaques were labeled with methoxy-X04 (blue); in the activity maps, neurons were color-coded as a function of their mean Ca2+ transient activity. Scale bars: 10 μm. Bottom, spontaneous Ca2+ transients of neurons indicated in the top panel. D, Mean neuronal frequencies for controls (1.69 ± 0.05 transients per minute), APP/PS1 (3.42 ± 0.20 transients per minute), and rTg4510 (0.66 ± 0.07 transients per minute); F(2,18) = 171.2, p = 1.93 × 10⁻¹². All post hoc multiple comparisons between genotypes were highly significant: p = 5.42 × 10⁻⁹ for controls versus APP/PS1, p = 1.38 × 10⁻⁶ for controls versus rTg4510, and p = 1.01 × 10⁻¹² for APP/PS1 versus rTg4510. E, Fractions of hyperactive neurons. Controls: 2.91 ± 0.35%, APP/PS1: 19.11 ± 1.50%, rTg4510: 0.93 ± 0.35%; F(2,18) = 176.2, p = 1.51 × 10⁻¹². Post hoc multiple comparisons were p = 2.84 × 10⁻¹¹ for controls versus APP/PS1, p = 1.64 × 10⁻¹² for APP/PS1 versus rTg4510 and not significant, p = 0.1045, for controls versus rTg4510. F, Fractions of silent neurons. Controls: 15.05 ± 1.87%, APP/PS1: 9.20 ± 2.36%, rTg4510: 53.48 ± 3.24%; F(2,18) = 77.18, p = 1.48 × 10⁻⁹. Post hoc multiple comparisons were p = 2.02 × 10⁻⁸ for controls versus rTg4510 and p = 1.08 × 10⁻⁸ for APP/PS1 versus rTg4510 and not significant, p = 0.3972, for controls versus APP/PS1. Each solid circle represents an individual animal (controls, n = 7; APP/PS1, n = 5; rTg4510, n = 9), and all error bars reflect the mean ± SEM; the differences between genotypes were assessed by one-way ANOVA followed by Tukey’s multiple comparisons test, ****p < 0.0001. NS, not significant. G, H, Neuronal activity is reduced in P301S mice independently of presence of NFTs. Reproduced with permission from Marinković et al. (2019). G, left, Representative in vivo recordings from WT vehicle and P301S tau-PFFs (tau preformed fibrils-injected) mice. AAV1 transduced neurons are labeled with mRuby2 (red) and GCaMP6s (green). NFTs are labeled with FSB (white). Images are made by averaging 450 time-series frames acquired in vivo at 410 Hz with two-photon lasers tuned to 940 nm for CGaMP6s/mRuby2 and to 750 nm for FSB. Scale bar: 50 mm. Right, Traces (blue) extracted from annotated regions of interest (black) during quiet and active (gray shade) behavioral states classified based on changes in whisking movement (gray trace in the bottom). Note that traces 2 and 4 in P301S tau-PFFs group are from NFT-bearing neurons. Black bars mark detected calcium transients. H, Mean frequency of calcium transients during quiet and active states of all neurons detectable in three or more time points. WT vehicle (black), WT tau-PFFs (cyan), P301S vehicle (green), all P301S tau-PFFs: all neurons are denoted as magenta circles, with NFT-free as magenta squares and NFT-bearing as magenta triangles. Data points represent individual mice, n = 5–7 mice per group; black lines represent mean value ± SEM; ***p < 0.001, ****p < 0.0001, WT versus P301S (two-way ANOVA, genotype factor, not significant; Student’s t test).
