Figure 6.

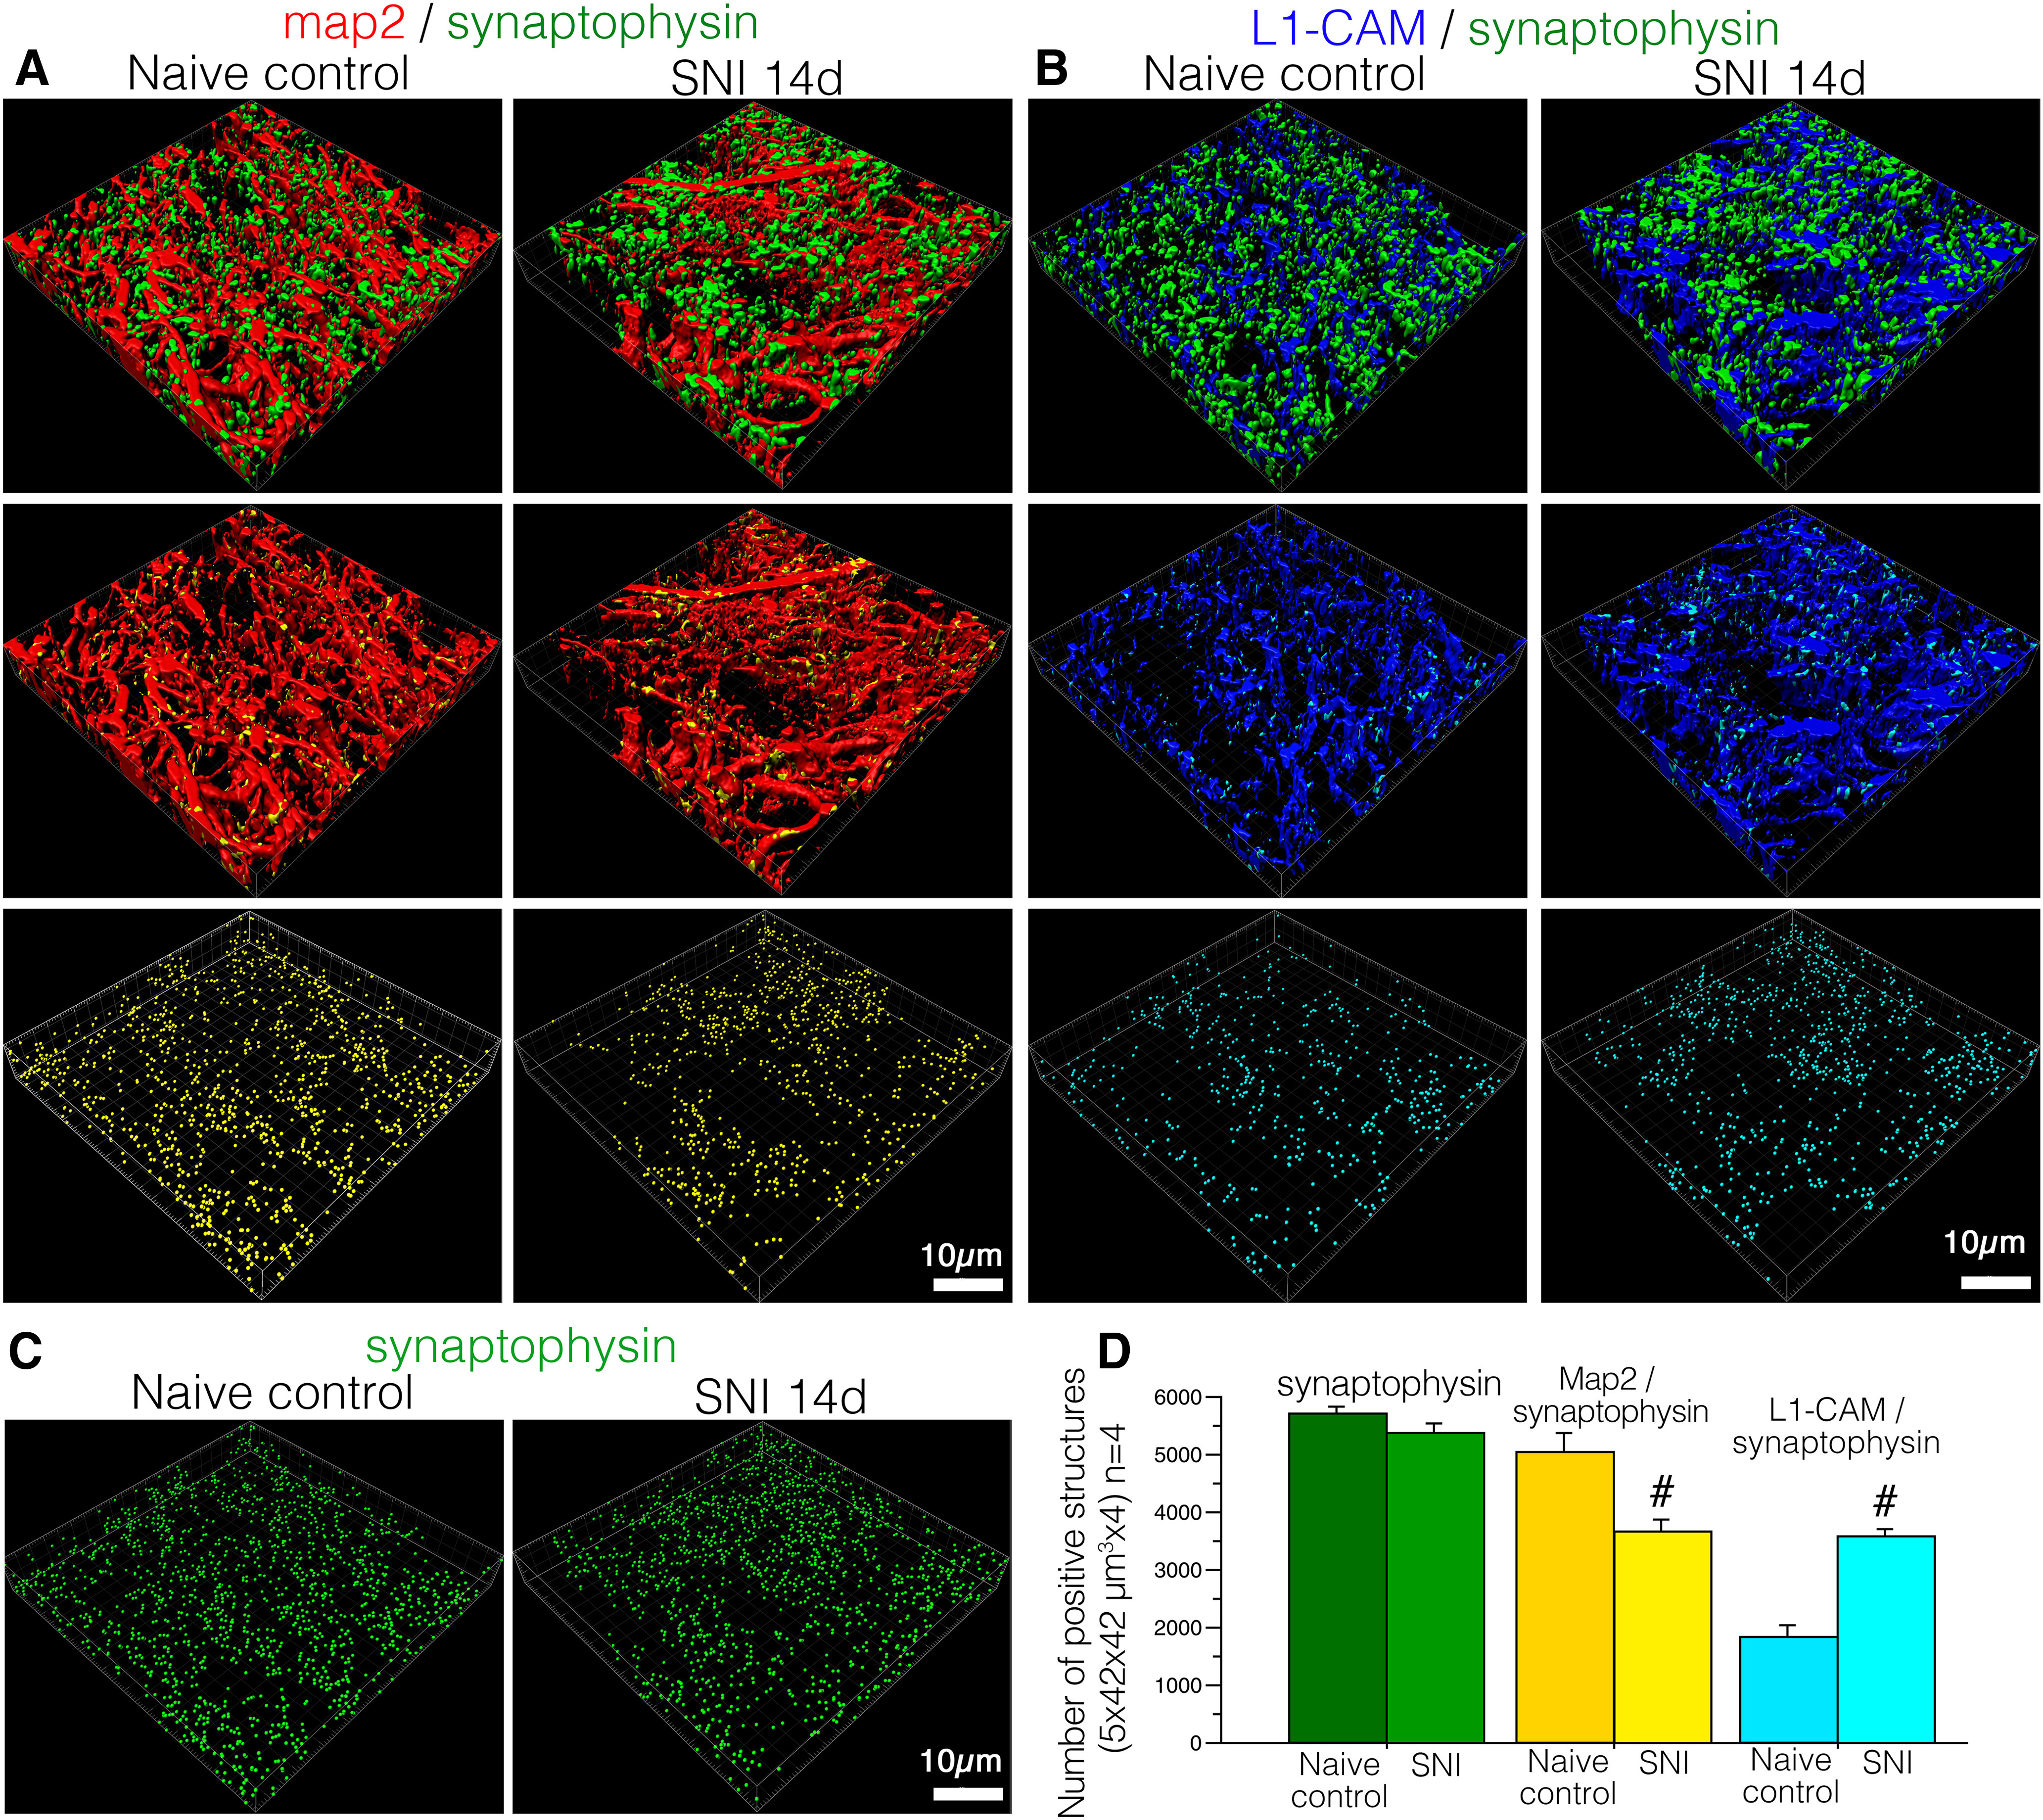
Reconstructed 3D images of deconvoluted z-scanned confocal images of immunoreactive structures for synaptophysin (green), MAP-2 (red), and tL1-CAM (blue) in the dorsal horn of control and SNI model rats. A, 3D images of synaptic terminals and dendrites (synaptophysin-ir and MAP-2-ir). Synaptophysin and MAP-2 contacts are represented as yellow spots on MAP-2-ir in the middle panels. The contacts in this space are represented as yellow particles in the panels in the lowest row. B, 3D images of synaptic terminals (synaptophysin-ir) and tL1-CAM-positive structures. Synaptophysin-ir and tL1-CAM-ir contacts are shown in light blue in tL1-CAM-ir, and these contacts are represented as particles in the lowest panels. C, Spots of synaptic terminals (synaptophysin-ir) in the dorsal horn of SNI and control rats are represented as green particles. D, Quantification of the total number of contact spots (synaptophysin/MAP-2, synaptophysin/tL1-CAM) and synaptophysin-ir structures in the dorsal horn (1764.0 μm2 × 5.0 μm in scope × depth, four positions per animal, each model n = 4); #p < 0.05 versus control. Scale bar: 10 μm.
