Abstract
lncRNA–mRNA co-expression pairs and prognostic markers related to the development of laryngeal squamous cell carcinoma (LSCC) were investigated. The lncRNA and mRNA expression data of LSCC in GSE84957 and RNA-seq data of 112 LSCC samples from TCGA database were used. Differentially expressed genes (DEGs) and lncRNAs (DE-lncRNAs) between LSCC and para-cancer tissues were identified. Co-expression analysis of DEGs and DE-lncRNA was conducted. Protein–protein interaction network for co-expressed DEGs of top 25 DE-lncRNA was constructed, followed by survival analysis for key nodes in co-expression network. Finally, expressions of several DE-lncRNAs and DEGs were verified using qRT-PCR. The lncRNA–mRNA network showed that ANKRD20A5P, C21orf15, CYP4F35P, LOC_I2_011146, XLOC_006053, XLOC_I2_003881, and LOC100506027 were highlighted in network. Some DEGs, including FUT7, PADI1, PPL, ARHGAP40, MUC21, and CEACAM1, were co-expressed with above lncRNAs. Survival analysis showed that PLOD1, GLT25D1, and KIF22 were significantly associated with prognosis. qRT-PCR results showed that the expressions of MUC21, CEACAM1, FUT7, PADI1, PPL, ARHGAP40, ANKRD20A5P, C21orf15, CYP4F35P, XLOC_I2_003881, LOC_I2_011146, and XLOC_006053 were downregulated, whereas the expression of LOC100506027 was upregulated in LSCC tissues. PLOD1, GLT25D1, and KIF22 may be potential prognostic markers in the development of LSCC. C21orf15-MUC21/CEACAM1/FUT7/PADI1/PPL/ARHGAP40 are potential lncRNA–mRNA pairs that play significant roles in the development of LSCC.
Keywords: laryngeal squamous cell carcinoma, differential expression, co-expression analysis, lncRNA–mRNA, prognosis
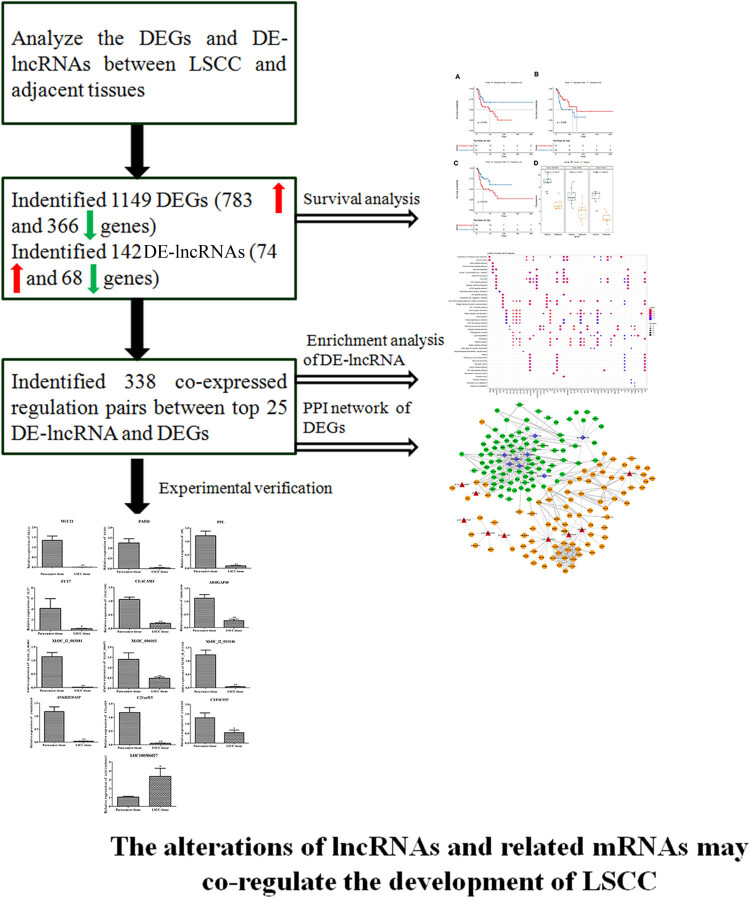
Graphical abstract
Several genes, PLOD1, GLT25D1, and KIF22, are identified as potential prognostic markers for LSCC development. In addition, lncRNA–mRNA pairs related to LSCC were explored, and 6 DEGs (MUC21, CEACAM1, FUT7, PADI1, PPL, and ARHGAP40) and 7 DE-lncRNAs (ANKRD20A5P, C21orf15, CYP4F35P, XLOC_I2_003881, XLOC_I2_011146, XLOC_006053, and LOC100506027) were validated to be abnormally expressed in LSCC tissue.
1. Introduction
Squamous cell carcinoma of the head and neck is the 6th most common malignancy worldwide with nearly 177,000 new cases in 2018 [1]. Laryngeal squamous cell carcinoma (LSCC) is the second common malignant tumor of the head and neck, comprising 96% of all laryngeal cancers [2]. It has been reported that the mortality rates and crude incidence of laryngeal cancer in China from 2008 to 2012 are 1.01/100,000 and 1.22/100,000, respectively, higher in men than in women [3]. Smoking and alcohol consumption, virus infection, and air pollution are considered as main factors inducing LSCC [4]. Although significant advances in LSCC detection and treatment have been made, the 5-year survival rate and prognosis of LSCC are still poor [5,6]. Thus, it is of great importance to clarify the molecular mechanisms of LSCC to establish more effective biomarkers or appropriate treatment targets.
In the last two decades, the molecular biomarkers and relative regulatory mechanisms of LSCC have been widely investigated [7]. Numerous long noncoding RNAs (lncNRAs) are closely associated with the development of some cancers [8]. For example, lncRNA SNHG1 is overexpressed in LSCC tissues, which is involved in the proliferation and metastasis of LSCC [9]. It is reported that some lncRNAs cooperate with nearby protein coding genes to constitute “lncRNA–mRNA pairs” that affect their function [10]. For instance, Kong et al. [11] indicated that lncRNA FOXC1-FOXCUT pair might be involved in oral squamous cell carcinoma progression. Yang et al. [12] reported that TCONS_00010232, ENST00000564977, and ENST00000420168 might affect CASP3 and FOXQ1 expression in HPV-18 positive cervical cancer cell. Zhou et al. [13] found several lncRNA–mRNA pairs, such as lncRNA-LMO1-2-RIC3 and lncRNA-MCL1-ADAMTSL4, which might play vital roles in the progression of hypopharyngeal squamous cell carcinoma. Besides, Feng et al. [14] suggested that lncRNA NR_027340-ITGB1, lncRNA MIR31HG-HIF1A, and lncRNA SOX2-OT-DDIT4 were important for advanced LSCC. However, the previous studies about lncRNA–mRNA pairs were not enough to elucidate the molecular mechanisms of LSCC development.
In the current study, the lncRNA and mRNA data of GSE84957 and the RNA-seq data of 112 LSCC samples from the cancer genome atlas (TCGA) database were used for the analysis. Differentially expressed genes (DEGs) and differentially expressed lncRNAs (DE-lncRNAs) between LSCC tissues and adjacent normal tissues were identified. Subsequently, co-expression analysis of DEGs and DE-lncRNA was conducted. Protein–protein interaction (PPI) prediction for top 25 DE-lncRNA co-expressed DEGs was performed, followed by Kyoto Encyclopedia of Genes and Genomes (KEGG) pathway enrichment analysis for lncRNA. After that, transcription factor (TF) and microRNA (miRNA) prediction and functional enrichment analysis of co-expressed DEG and survival analysis for key nodes in co-expression network were conducted. Finally, the expressions of several DE-lncRNAs and DEGs in paired samples of LSCC and adjacent tissues were verified using quantitative real-time-PCR (qRT-PCR). We aimed to find significant lncRNA–mRNA pairs and important prognostic genes in the development of LSCC and then tried to elucidate its molecular mechanisms.
2. Materials and methods
2.1. Data source
The lncRNA and mRNA expression profiles of LSCC were all analyzed in this study. The lncRNA and mRNA dataset GSE84957 involving 9 pairs of primary Stage IV LSCC tissues and adjacent normal tissues were also downloaded from GEO (http://www.ncbi.nlm.nih.gov/geo/) database. The expression data of this dataset were generated from the platform of GPL17843 Agilent-042818 Human lncRNA Microarray 8_24_v2.
In addition, the clinical data and RNA-seq data of 112 LSCC samples were achieved from the cancer genome atlas (TCGA) database. In brief, the clinical data and RNA-seq data of TCGA-head and neck squamous cell carcinoma (TCGA-HNSC) were downloaded from UCSC Genome Browser. According to the clinical information, the samples with tumor location at larynx were selected.
2.2. Data preprocessing and identification of DEGs and DE-lncRNAs
After obtaining the raw data of lncRNA–mRNA, the data were preprocessed with linear models for microarray data (limma) software [15], including background correction, data normalization, and concentration prediction. Following data annotation, when several probes were matched to one gene entry, the final expression value was calculated by the mean of these probes. The DEGs analysis between the tumor and control samples was conducted using Bayes test and the p values were revised by Benjamini/Hochberg (BH) method. The DEGs and DE-lncRNAs were screened, and |log2 fold-change (FC)| > 1 and adjusted p value <0.05 were deemed as significantly thresholds. The information of protein coding gene (V32) provided by Gencode (https://www.gencodegenes.org/) database [16] was applied to annotate the RNA-seq data of LSCC samples from TCGA into mRNA and lncRNA expression matrixes for following analysis. Then, the bidirectional hierarchical clustering heatmaps for DEGs and DE-lncRNAs were drawn with pheatmap package (Version 1.0.10, https://cran.r-project.org/web/packages/pheatmap/index.html) in R software [17].
2.3. Co-expression analysis of DEGs and DE-lncRNA
The expression matrixes data of DEGs and DE-lncRNAs identified from GSE84957 dataset were extracted to conduct the pearson correlation analysis. The pearson correlation coefficient (r) between each DEGs and DE-lncRNA was calculated. Then, DE-lncRNA-DEG pairs with r > 0.9 and p value <0.05 were selected, among which the pairs of top 25 expression changed DE-lncRNAs and their co-expression DEG was considered as important for following analysis.
2.4. Protein–protein interaction (PPI) prediction for top 25 DE-lncRNA co-expressed DEGs
The STRING database (http://string-db.org/) provides the functional partnerships and interactions between proteins for more than 2000 organisms [18]. The PPIs pairs between proteins edited by DEGs from the above significant correlated top 25 DE-lncRNA-DEGs co-expression pairs were analyzed using STRING (version 10.0) with setting PPI score as 0.4. Afterwards, the PPI network construction was conducted using Cytoscape software (version 3.2.0, http://www.cytoscape.org/) [19].
2.5. Kyoto Encyclopedia of Genes and Genomes (KEGG) pathway enrichment analysis for lncRNA
KEGG database, as a resource for deciphering genome and pathways, reveals biological interpretation of genes in molecular datasets [20]. lncRNA-enriched pathway was predicted based on functional pathways of each lncRNA co-expressed mRNA using the clusterprofiler package [21] in R software (Version 3.14.0, http://bioconductor.org/packages/3.2/bioc/html/clusterProfiler.html). BH-adjusted p value <0.05 and count >1 were used to present the significantly enriched KEGG pathways.
2.6. Transcription factor (TF) prediction and functional enrichment analysis for co-expressed DEGs
TFs are major trans-acting factors in transcriptional regulation, which is crucial to investigate the regulatory circuitry underlying complex traits. TRRUST is a database of reference TF-target regulatory interactions in humans based on literature curation, which conducted sentence-based text mining and prioritized the candidate sentences for the cost-effective literature curation [22]. TF was predicted for co-expressed DEGs using TRRUST v2 (https://www.grnpedia.org/trrust/). TF-target genes network was constructed using Cytoscape.
Gee ontology (GO)-biological process (BP), GO-cellular component (CC), GO-molecular function (MF), and KEGG pathway enrichment analyses were performed using R package clusterProfiler v 3.14.0. KEGG pathways and GO terms with adjusted p < 0.05 (method: BH) were screened, and the top 10 pathways/terms were presented using bubble chart.
2.7. microRNAs (miRNAs) prediction and functional enrichment analysis
miRNAs are noncoding small endogenous RNAs which mediate posttranscriptional gene regulation, which are reported to implicate in various biological processes, such as cell proliferation and apoptosis, disease development, and angiogenesis [23]. Therefore, we further predicted miRNAs for the co-expressed DEGs using Webgestalt (http://www.webgestalt.org/option.php) database. p value <0.05 was used to select miRNA-target interactions. miRNAs-target genes network was visualized using Cytoscape. Functional enrichment analyses were performed using R package clusterProfiler v 3.14.0, and BH-adjusted p < 0.05 was used to show significant enriched terms.
2.8. Survival analysis for key genes in co-expression network
The expression values of all genes and prognosis and survival information were extracted from TCGA database. The genes were divided into low or high expression group based on the median expression in all samples using R package Survival [24] (Version: 2.42-6 https://cran.r-project.org/web/packages/survival/index.html). Genes with p < 0.05 in survival analysis were considered as prognosis significantly related genes. In addition, Kaplan–Meier (K–M) survival curves were plotted. Furthermore, clinical information was analyzed based on progress-free survival (PFS) provided by TCGA.
2.9. qRT-PCR analysis
In total, five paired LSCC and adjacent nonneoplastic tissues samples were collected from five LSCC patients who underwent surgery in Otolaryngology Department of Gulou Hospital affiliated to Nanjing Medical College, and these tissue samples were then used in this study. The characteristics of patients included in the study are listed in Table A1. Total RNA from frozen tissue (50–100 mg) homogenized in 1 mL TRIZOL reagent was extracted by TRIzol reagent (9109, Takara, Japan) according to the manufacturer’s protocol. Then, qRT-PCR was conducted to verify the expressions of several DEGs and DE-lncRNAs identified in this study. mRNA was reversed transcribed to cDNA using primeScript RT Master MIX (RR036A, Takara), and reverse transcription reaction for miRNA was conducted with PrimeScript II RTase 1st Strand cDNA Synthesis Kit (6210A, Takara). Subsequently, amplification was conducted using Power SYBR Green PCR Master Mix (A25742, Thermo) with the reaction conditions as following: 50°C for 3 min, 95°C for 3 min, and 40 cycles of 95°C for 10 s and 60°C for 30 s. GAPDH was applied as internal controls for mRNAs. Table 1 lists the primer sequences of genes. The 2−ΔΔCt method was applied to calculate relative expression of genes.
Table 1.
The primer sequences of genes
| Gene names | Primer sequences (5′–3′) |
|---|---|
| CYP4F35P-hF | TCCAGAGCAGGACAAAGAGG |
| CYP4F35P-hR | AACCACCAAACAGTCAGCAGT |
| C21orf15-hF | GCCGTGCCCTACAGACC |
| C21orf15-hR | CTTGATGCCTTAGACCTCCC |
| ANKRD20A5P-hF | ATGGAAGATCCTGCTGTGAA |
| ANKRD20A5P-hR | TCCTCTGAAGCCACTGGTAAG |
| XLOC_006053-hF | CAGCCTGACCATTCCCTT |
| XLOC_006053-hR | GCAGTCTGGTGGTTCTTATTCTA |
| XLOC_l2_003881-hF | TGCGTGGCTGCCTCTTA |
| XLOC_l2_003881-hR | GCATCACTCCTGGGTGTCTT |
| XLOC_l2_011146-hF | GTCTTCCTGAAGCCACACAGA |
| XLOC_l2_011146-hR | TCCTCCAGAGTCTCCCATTAAA |
| LOC100506027-hF | ACAGCGATACCAGGCAGAC |
| LOC100506027-hR | GCATTCGTGGCGATAAGG |
| MUC21-hF | GAATGCACACAACTTCCCATAGT |
| MUC21-hR | GGCTATCGAGGATACTGGTCTC |
| CEACAM1-hF | GATCCTATACCTGCCACGCC |
| CEACAM1-hR | CCTGTGACTGTGGTCTTGCT |
| FUT7-hF | CACCTGAGTGCCAACCGAA |
| FUT7-hR | CACCCAGTTGAAGATGCCTCG |
| PADI1-hF | TGCAGACATGGTCGTATCTGT |
| PADI1-hR | GCCCAGAGCTTGGTCTTCC |
| PPL-hF | CCGGAGCATCTCTAACAAGGA |
| PPL-hR | GCATCCGCCTCTAGCACAT |
| ARHGAP40-hF | AGCCTTCAACATGGACTCTGC |
| ARHGAP40-hR | TTTGGGGACGGTAAACTTCGG |
| GAPDH-hF | TGACAACTTTGGTATCGTGGAAGG |
| GAPDH-hR | AGGCAGGGATGATGTTCTGGAGAG |
Informed consent: Informed consent has been obtained from all individuals included in this study.
Ethical approval: The research related to human use has been complied with all the relevant national regulations, institutional policies, and in accordance with the tenets of the Helsinki Declaration, and has been approved by the Ethics Committee of the Gulou Hospital affiliated to Nanjing Medical College.
2.10. Statistics analysis
All the data were presented as mean ± standard deviation. Statistics analysis was performed using Graphpad prism 5 (Graphpad Software, San Diego, CA), and the express values between groups were compared using Student’s t-test. p < 0.05 was deemed statistically significant.
3. Results
3.1. Identification of DEGs and DE-lncRNAs
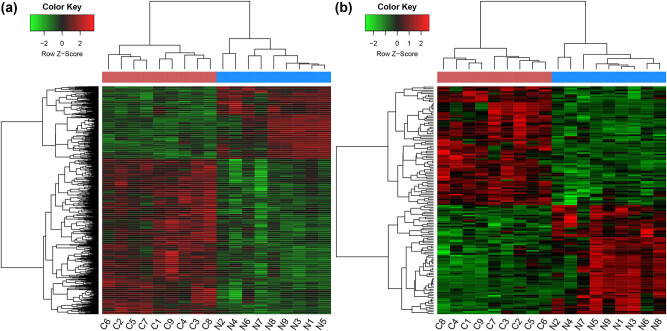
Under the cut-off of |log2 FC| > 1 and adjusted p value <0.05, a total of 1,149 DEGs (including 783 up- and 366 downregulated DEGs) and 142 DE-lncRNAs (including 74 up- and 68 downregulated DE-lncRNAs) were identified across LSCC tissues and normal tissues samples. The results of heatmaps showed that these DEGs and DE-lncRNAs could clearly distinguish the LSCC samples from normal samples, which verified DEGs and DE-lncRNAs were credible and could be used for following analysis (Figure 1).
Figure 1.
Heat maps of DEGs (a) and DE-lncRNA (b) in LSCC. X-axis shows the samples, and the Y-axis shows the DEGs or DE-lncRNA. DEGs: differentially expressed genes; DE-lncRNAs: differentially expressed lncRNAs; LSCC: laryngeal squamous cell carcinoma.
3.2. Co-expression analysis of top 25 DE-lncRNA and DEGs
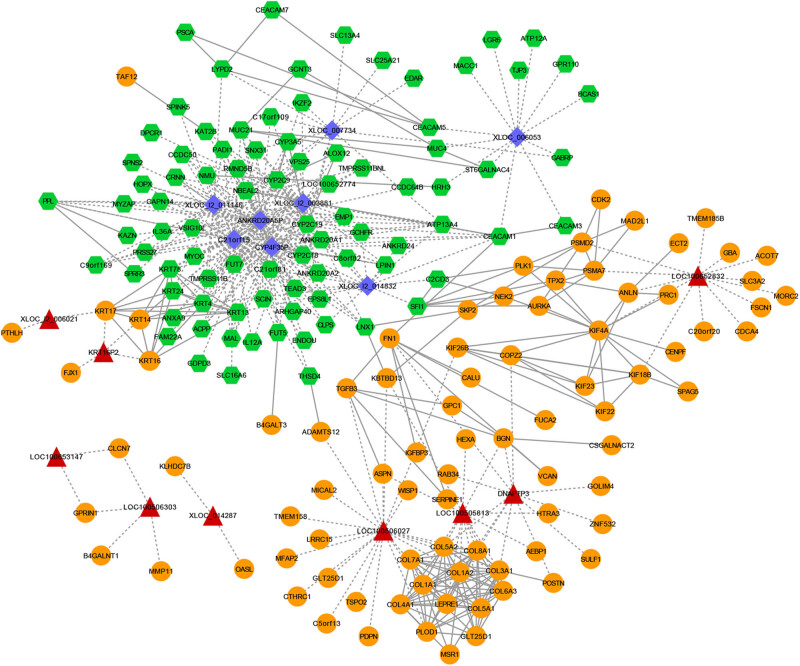
According to the given threshold, a total of 338 co-expressed regulation pairs between top 25 DE-lncRNA and DEGs (involving 17 DE-lncRNA and 145 DEGs) were identified. PPI prediction was performed for these 145 DEGs, of which 174 interaction pairs were predicted for 82 DEGs. Then, lncRNA–mRNA network (Figure 2, Table S1) was constructed by integrating these relations. It showed that seven significant downregulated DE-lncRNAs with lowest log2 FC values (ANKRD20A5P, C21orf15, CYP4F35P, XLOC_I2_011146, XLOC_006053, and XLOC_I2_003881) and one of top 3 upregulated LOC100506027 were highlighted in network. Furthermore, some DEGs were co-expressed with these lncRNA, such as FUT7, PADI1, PPL, ARHGAP40, MUC21, and CEACAM1.
Figure 2.
The lncRNA–mRNA co-expression network. Purple diamond: downregulated lncRNA; red triangle: upregulated lncRNA; green hexagon: downregulated mRNA; orange circle: upregulated mRNA; dotted line: lncRNA–mRNA co-expression pairs; solid line: protein–protein interaction (PPI) pairs.
3.3. KEGG pathway enrichment analysis for DE-lncRNA
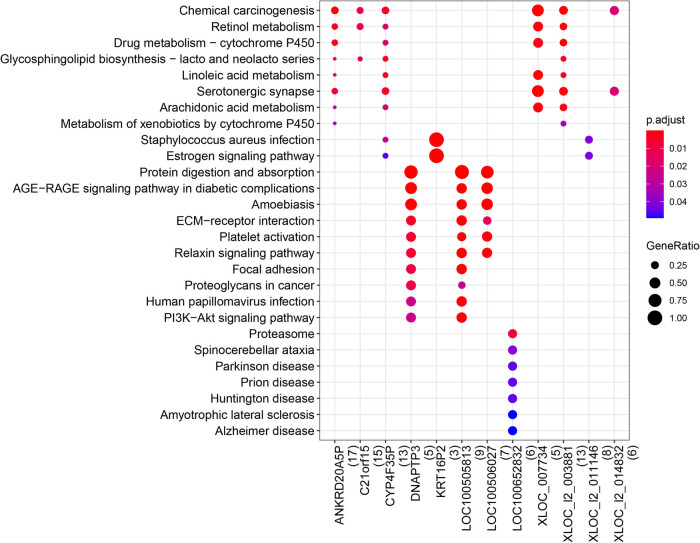
KEGG pathway enrichment analysis for lncRNAs in the lncRNA–mRNA network was performed based on each lncRNA co-expressed mRNA (Figure A1). It could be seen that there were similarities and differences on the involved KEGG pathways of these lncRNAs. For example, XLOC_l2_003881 and XLOC_007734 were significantly related to chemical carcinogenesis, drug metabolism-cytochrome P450 and serotonergic synapse, etc. While LOC100505813 and DNAPTP3 were associated with ECM−receptor interaction, platelet activation, and focal adhesion, LOC100652832 was implicated in proteasome.
3.4. TF prediction and functional enrichment analysis for co-expressed DEGs
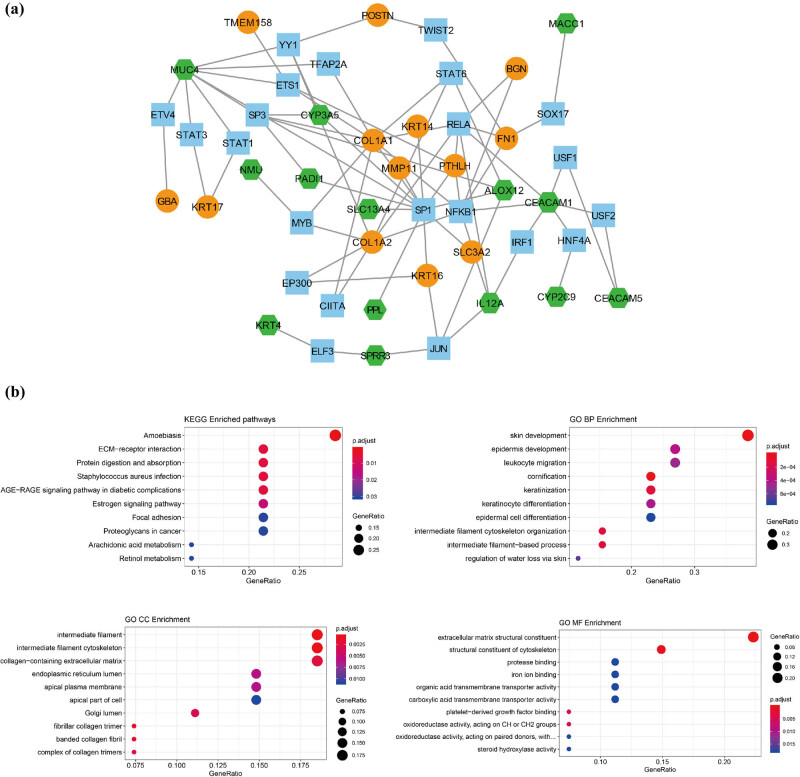
After TF prediction for 145 DEGs, 75 TF-mRNA pairs were obtained, which included 22 TFs (e.g., SP1, NFKB1, RELA, and JUN) and 27 DEGs (e.g., upregulated COL1A1, MMP11, PTHLH, and KRT14; downregulated PPL and CEACAM1) (Figure 3a).
Figure 3.
Transcription factor (TF) prediction and functional enrichment. (a) The TF-mRNA network. Blue square: TFs; orange circle: upregulated mRNA; green hexagon: downregulated mRNA. (b) The top 10 gene ontology (GO) terms and Kyoto Encyclopedia of Genes and Genomes (KEGG) pathways enriched by differentially expressed genes (DEGs) in TF-mRNA network. Point size: GeneRatio, color shift from blue to red indicates p adjust value from low to high.
As presented in Figure 3b, DEGs in TF-mRNA network were markedly enriched in amoebiasis, ECM−receptor interaction, protein digestion and absorption, staphylococcus aureus infection, and AGE-RAGE signaling pathway in diabetic complications. Furthermore, the evidently enriched GO-BP terms included skin development, cornification, and keratinization; GO-CC terms included intermediate filament, intermediate filament cytoskeleton, and collagen-containing extracellular matrix; while GO-MF terms included extracellular matrix structural constituent and structural constituent of cytoskeleton.
3.5. miRNAs prediction and functional enrichment analysis
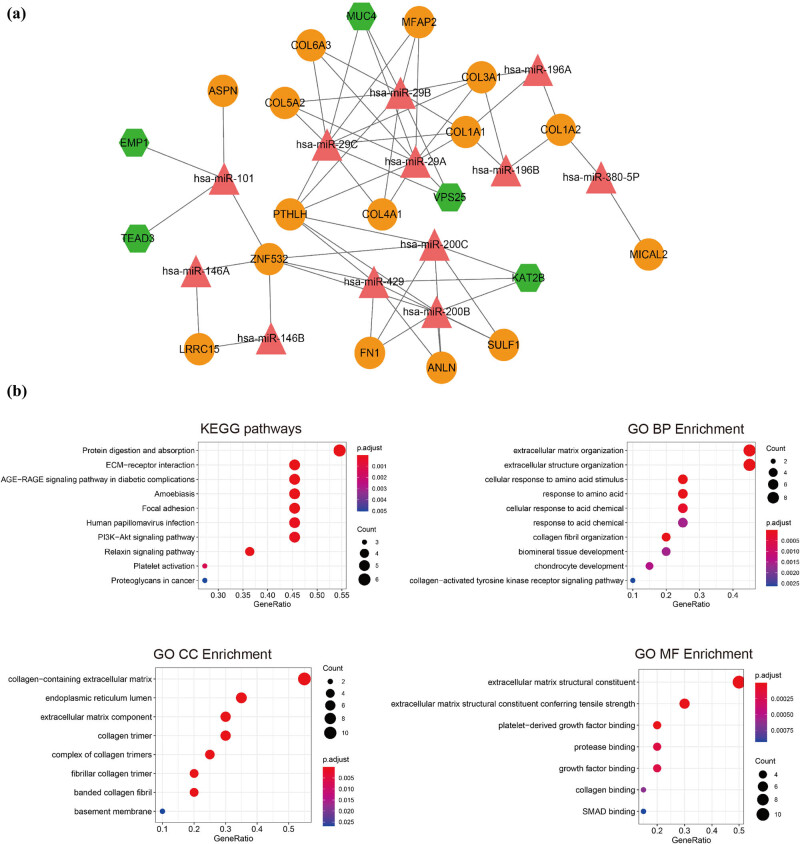
Following miRNAs prediction for 145 DEGs, the miRNA-target network was constructed (Figure 4a). The miRNA-target network contained 12 miRNAs (e.g., miR-200b/c, miR-29a/b/c and miR-429) and 20 DEGs (e.g., upregulated COL1A1, PTHLH, COL4A1; downregulated MUC4 and KAT2B).
Figure 4.
microRNAs (miRNAs) prediction and functional enrichment. (a) The miRNA-target network. Green hexagon: downregulated mRNAs; orange circle: upregulated mRNA; red triangle: miRNAs. (b) The top 10 gene ontology (GO) terms and Kyoto Encyclopedia of Genes and Genomes (KEGG) pathways enriched by differentially expressed genes (DEGs) in miRNA-target network. Point size: GeneRatio, color shift from blue to red indicates p adjust value from low to high.
Similarly, DEGs in miRNA-target network were significantly enriched in ECM−receptor interaction, focal adhesion, and PI3K − Akt signaling pathways. The enriched GO-BP contained extracellular matrix/structure organization, cellular response to amino acid/acid chemical; GO-CC terms included collagen − containing extracellular matrix and endoplasmic reticulum lumen; and GO-MF terms included extracellular matrix structural constituent and platelet − derived growth factor binding (Figure 4b).
3.6. Survival analysis
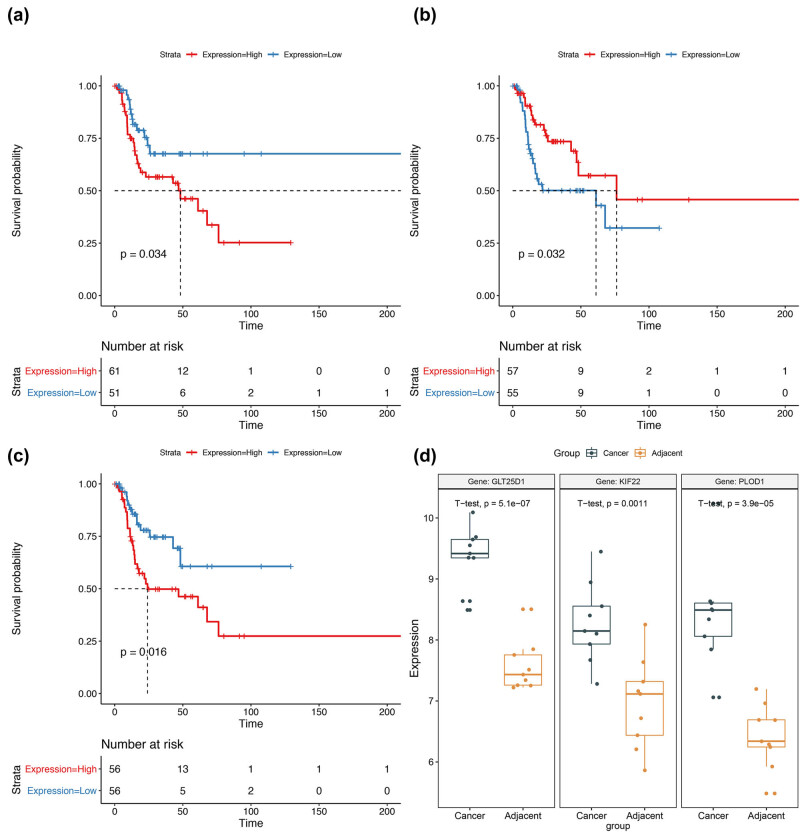
Survival analyses were conducted for one lncRNA (HCG22) and all the above mRNA nodes. The results showed that PLOD1 (p = 0.016), GLT25D1 (also named COLGALT1, p = 0.034), and KIF22 (p = 0.032) were significantly associated with prognosis (Figure 5a–c). The expression values of these three genes in GSE84957 were presented as box plot (Figure 5d).
Figure 5.
Survival analyses for GLT25D1 (a), KIF22 (b), and PLOD1 (c), and the box plot for the expression values of these three genes in GSE84957 (d).
3.7. Verification of gene expressions
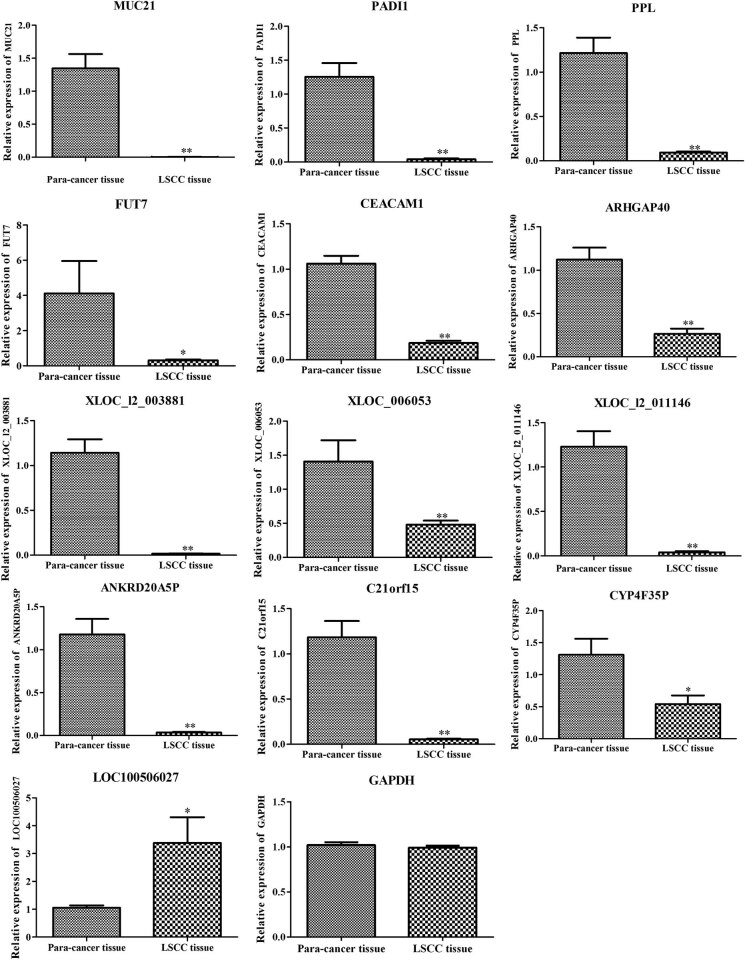
ANKRD20A5P, C21orf15, CYP4F35P, XLOC_I2_011146, XLOC_006053, XLOC_I2_003881, and LOC100506027 with larger |log2 FC| were co-expressed with more DEGs in lncRNA–mRNA network, thus the expression of these 7 lncRNA was verified. Furthermore, each of FUT7, PADI1, PPL, ARHGAP40, MUC21, and CEACAM1 was co-expressed with several of the above 7 lncRNAs, thus these 6 genes were verified. The qRT-PCR results suggested that the expressions of MUC21, CEACAM1, FUT7, PADI1, PPL, ARHGAP40, ANKRD20A5P, C21orf15, CYP4F35P, XLOC_I2_003881, XLOC_I2_011146, and XLOC_006053 were downregulated in LSCC compared with that in adjacent tissues. The expression of LOC100506027 was upregulated in LSCC compared with that in adjacent tissues (Figure 6).
Figure 6.
Relative mRNA expressions of MUC21, PADI1, PPL, FUT7, CEACAM1, ARHGAP40, XLOC_I2_003881, XLOC_006053, XLOC_I2_011146, ANKRD20A5P, C21orf15, CYP4F35P, LOC100506027, and GAPDH in LSCC tissues compared with adjacent tissues detected by real-time quantitative polymerase chain reaction. ** represents p < 0.01, and * represents p < 0.005 between LSCC and adjacent tissues samples.
4. Discussion
In the current study, lncRNA and mRNA expression profiles of LSCC were comprehensively analyzed to find significant lncRNA–mRNA pairs and important prognostic genes for LSCC. The lncRNA–mRNA network showed that top downregulated ANKRD20A5P, C21orf15, CYP4F35P, XLOC_I2_011146, XLOC_006053, and XLOC_I2_003881 and one of top 3 upregulated LOC100506027 were highlighted in network. Furthermore, some DEGs, such as FUT7, PADI1, PPL, ARHGAP40, MUC21, and CEACAM1, were co-expressed with these above lncRNAs. Survival analysis showed that PLOD1, GLT25D1 (COLGALT1), and KIF22 were significantly associated with prognosis of LSCC. In addition, the qRT-PCR results suggested that the expressions of MUC21, CEACAM1, FUT7, PADI1, PPL, ARHGAP40, ANKRD20A5P, C21orf15, CYP4F35P, XLOC_I2_003881, XLOC_I2_011146, and XLOC_006053 were significantly downregulated, whereas the expression of LOC100506027 was significantly upregulated in LSCC tissues compared with that in para-cancer tissues.
It was reported that PLOD1 is a potential prognostic marker in gastrointestinal cancer [25]. Yamada et al. [26] suggested that aberrant expressed PLOD1 was related to pathogenesis of bladder cancer, and it might be a potential prognostic marker for this cancer. PLOD1 can promote cell migration and growth in osteosarcoma [27]. Suppression of KIF22 inhibits cancer cell proliferation through delaying mitotic exit [28]. Zhang et al. [29] indicated that KIF22 was associated with clinical outcome and tumor progression in prostate cancer. KIF22 is involved in the migration and proliferation of gastric cancer cells through MAPK-ERK pathways [30]. As previously reported, COLGALT1 is involved in the progression of mammary tumor metastases [31]. Wang et al. [32] indicated that COLGALT2 played role in the proliferation of osteosarcoma. Not too much previous studies reported the roles of these three genes in LSCC. Combined with our present survival analysis results, we inferred that PLOD1, GLT25D1 (COLGALT1), and KIF22 might be potential prognostic markers for LSCC development.
Our qRT-PCR results showed that the expression of MUC21, CEACAM1, FUT7, PADI1, PPL, and ARHGAP40 was downregulated in LSCC tissues compared with that in para-cancer tissues. MUC21, as a member of the mucin family, may play a protective role against external stimuli in mucus layer on mucosal surfaces [33]. There is growing evidence that mucin families are responsible for epithelial carcinomas, especially LSCC [33]. Yuan et al. have reported that MUC21 is associated with differentiation and carcinogenesis of squamous epithelial di [34]. Nair et al. have predicted the downregulation of MUC21 in LSCC tumors via gene expression profile analysis [35], which is consistent with our result. Some studies showed that CEACAM1 played roles in tumorigenesis. The loss of expression and genetic alteration of the CEACAM1 may be an early event for colorectal cancers development [36]. CEACAM1 is related to oral tumors progression [37]. Importantly, Lucarini et al. [38] demonstrated that CEACAM1 was involved in LSCC progression and might be a potential therapeutic target for LSCC. There were no researches about the roles of FUT7, PADI1, PPL, and ARHGAP40 in LSCC, but the roles of these genes or the related genes in other cancers were reported. For example, lower expression of PPL is related to cancer-specific survival and pathological stage in urothelial carcinoma of the urinary bladder [39]. Cui et al. [40] demonstrated that overexpression of exogenous FUT7 contributed to migration and adhesion of cell line MDAMB-231 of breast cancer. PADI2 inhibits proliferation of colon cancer cells [41] and can be used as a potential marker for breast cancer [42]. Downregulated ARHGAP10 inhibits tumorigenicity of ovarian cancer cells [43]. ARHGAP17 plays tumor suppressive role in colon cancer via Wnt/β-Catenin Signaling [44]. Thus, MUC21, CEACAM1, FUT7, PADI1, PPL, and ARHGAP40 may be associated with the development of LSCC.
Chromosome 21 open reading frame 15 (C21orf15) is a lncRNA located in the juxtacentromeric region of human chromosome 21 with domain of spliced expressed sequence tags AJ003450 [45]. It has been reported that C21orf15 is predicted to be upregulated in metastatic prostate cancer [46], whereas our RT-PCR result showed that C21orf15 was downregulated in LSCC tissue. However, few studies reported the function of C21orf15. Combined with our present study that C21orf15 was co-expressed with MUC21, CEACAM1, FUT7, PADI1, PPL, and ARHGAP40, we inferred that C21orf15-MUC21/CEACAM1/FUT7/PADI1/PPL/ARHGAP40 were lncRNA–mRNA pairs that were involved in LSCC development. That is to say, C21orf15 may affect LSCC development by modulating the expression of MUC21/CEACAM1/FUT7/PADI1/PPL/ARHGAP40. Lastly, there are no previous researches that studied the functions of ANKRD20A5P, CYP4F35P, XLOC_I2_003881, XLOC_I2_011146, XLOC_006053, and LOC100506027. Further researches are needed to clarify the function of these lncRNA in LSCC. Besides, the co-expression relationships of 7 lncRNAs and these genes were needed to be verified by experiments in future.
5. Conclusion
In summary, PLOD1, GLT25D1, and KIF22 may be potential prognostic markers for LSCC development. MUC21, CEACAM1, FUT7, PADI1, PPL, and ARHGAP40 may be involved in the development of LSCC. C21orf15-MUC21/CEACAM1/FUT7/PADI1/PPL/ARHGAP40 are important lncRNA–mRNA pairs that play significant roles in LSCC. ANKRD20A5P, CYP4F35P, XLOC_I2_003881, XLOC_I2_011146, XLOC_006053, and LOC100506027 may be vital lncRNAs in LSCC progression. These lncRNAs and related mRNAs may be used for potential therapeutic targets of LSCC.
Appendix
Figure A1.
Significantly enriched Kyoto encyclopedia of genes and genomes (KEGG) pathway for lncRNAs in lncRNA–mRNA network. Abscissa: lncRNA; Ordinate: enriched KEGG pathways; point size: GeneRatio, color shift from blue to red indicates p adjust value from low to high.
Table A1.
The characteristics of the patients from Gulou hospital
| Patients | Diagnosis | Surgery | Age (years) | Sex | Smoking | Drinking | Tumor size | TNM stage | Lymph node metastasis |
|---|---|---|---|---|---|---|---|---|---|
| P1 | LSCC, dyspnea | Total laryngectomy and bilateral neck dissection | 45 | Male | Yes, smoking for 30 years | Yes | 3.5 cm × 2 cm × 1 cm | IVA (T4aN2bcM0) | N2b |
| P2 | LSCC, dyspnea | Total laryngectomy and bilateral neck dissection | 63 | Male | Yes, smoking for 40 years | No | 3 cm × 2.5 cm × 1 cm | IVA (T4aN2bcM0) | N1 |
| P3 | LSCC | Total laryngectomy and bilateral neck dissection | 79 | Male | Yes, smoking for 60 years | No | 3 cm × 2 cm × 0.6 cm | IVA (T4aN2bcM0) | N0 |
| P4 | LSCC | Total laryngectomy and left neck dissection | 64 | Male | Yes, smoking for 30 years | Yes | 3.5 cm × 3 cm × 1.5 cm | IVA (T4aN2bcM0) | N0 |
| P5 | LSCC | Total laryngectomy and right neck dissection | 70 | Male | Yes, smoking for 50 years | Yes | 2.5 cm × 1.4 cm × 1 cm | III (T3N0cM0) | N0 |
Footnotes
Funding information: This work was supported by The Project of Invigorating Health Care through Science, Technology and Education (No. ZDXKB2016015), Nanjing Medical Science and Technique Development Foundation (No. QRX17052). The funder had no role in study design, data collection and analysis, decision to publish, or preparation of the manuscript.
Author contributions: Conception and design of the research: J.W.; acquisition of data: D.L.; analysis and interpretation of data: Y.G.; statistical analysis: H.Z.; obtaining funding: J.W.; drafting the manuscript: X.Q. and X.S.; revision of manuscript for important intellectual content: X.S. and X.Q. All authors read and approved the final manuscript.
Conflict of interest: The authors state no conflict of interest.
Data availability statement: The datasets generated during and/or analyzed during the current study are available from the corresponding author on reasonable request.
Contributor Information
Xiaohui Shen, Email: shenxhglyy@163.com.
Xiaoyun Qian, Email: qianxiaoyun88@sina.com.
References
- [1].Bray F, Ferlay J, Soerjomataram I, Siegel RL, Torre LA, Jemal A. Global cancer statistics 2018: GLOBOCAN estimates of incidence and mortality worldwide for 36 cancers in 185 countries. CA Cancer J Clin. 2018;68(6):394–424. [DOI] [PubMed]; Bray F, Ferlay J, Soerjomataram I, Siegel RL, Torre LA, Jemal A. Global cancer statistics 2018: GLOBOCAN estimates of incidence and mortality worldwide for 36 cancers in 185 countries. CA Cancer J Clin. 2018;68(6):394–424. doi: 10.3322/caac.21492. [DOI] [PubMed] [Google Scholar]
- [2].Karatas OF, Suer I, Yuceturk B, Yilmaz M, Hajiyev Y, Creighton CJ, et al. The role of miR-145 in stem cell characteristics of human laryngeal squamous cell carcinoma Hep-2 cells. Tumour Biol J Int Soc Oncodev Biol Med. 2015;37(3):1–10. [DOI] [PubMed]; Karatas OF, Suer I, Yuceturk B, Yilmaz M, Hajiyev Y, Creighton CJ. et al. The role of miR-145 in stem cell characteristics of human laryngeal squamous cell carcinoma Hep-2 cells. Tumour Biol J Int Soc Oncodev Biol Med. 2015;37(3):1–10. doi: 10.1007/s13277-015-4219-z. [DOI] [PubMed] [Google Scholar]
- [3].Liu Y, Zhao Q, Ding G, Zhu Y, Li W, Chen W. Incidence and mortality of laryngeal cancer in China, 2008–2012. Chin J Cancer Res (Chung-kuo yen cheng yen chiu). 2018;30(3):299–306. [DOI] [PMC free article] [PubMed]; Liu Y, Zhao Q, Ding G, Zhu Y, Li W, Chen W. Incidence and mortality of laryngeal cancer in China, 2008–2012. Chin J Cancer Res. 2018;30(3):299–306. doi: 10.21147/j.issn.1000-9604.2018.03.02. (Chung-kuo yen cheng yen chiu). [DOI] [PMC free article] [PubMed] [Google Scholar]
- [4].Gama RR, Carvalho AL, Longatto FA, Scorsato AP, LóPez RV, Rautava J, et al. Detection of human papillomavirus in laryngeal squamous cell carcinoma: systematic review and meta-analysis. Laryngoscope. 2016;126(4):885–93. [DOI] [PubMed]; Gama RR, Carvalho AL, Longatto FA, Scorsato AP, LóPez RV, Rautava J. et al. Detection of human papillomavirus in laryngeal squamous cell carcinoma: systematic review and meta-analysis. Laryngoscope. 2016;126(4):885–93. doi: 10.1002/lary.25738. [DOI] [PubMed] [Google Scholar]
- [5].Steuer CE, El-Deiry M, Parks JR, Higgins KA, Saba NF. An update on larynx cancer. Ca Cancer J Clin. 2017;67(1):31–50. [DOI] [PubMed]; Steuer CE, El-Deiry M, Parks JR, Higgins KA, Saba NF. An update on larynx cancer. Ca Cancer J Clin. 2017;67(1):31–50. doi: 10.3322/caac.21386. [DOI] [PubMed] [Google Scholar]
- [6].Gorphe P, Matias M, Moya-Plana A, Tabarino F, Blanchard P, Tao Y, et al. Results and survival of locally advanced AJCC 7th edition T4a laryngeal squamous cell carcinoma treated with primary total laryngectomy and postoperative radiotherapy. Ann Surg Oncol. 2016;23(8):2596–601. [DOI] [PubMed]; Gorphe P, Matias M, Moya-Plana A, Tabarino F, Blanchard P, Tao Y. et al. Results and survival of locally advanced AJCC 7th edition T4a laryngeal squamous cell carcinoma treated with primary total laryngectomy and postoperative radiotherapy. Ann Surg Oncol. 2016;23(8):2596–601. doi: 10.1245/s10434-016-5217-0. [DOI] [PubMed] [Google Scholar]
- [7].Solomon B, Young RJ, Rischin D. Head and neck squamous cell carcinoma: Genomics and emerging biomarkers for immunomodulatory cancer treatments. Semin Cancer Biol. 2018;52(Pt 2):228–40. [DOI] [PubMed]; Solomon B, Young RJ, Rischin D. Head and neck squamous cell carcinoma: Genomics and emerging biomarkers for immunomodulatory cancer treatments. Semin Cancer Biol. 2018;52(Pt 2):228–40. doi: 10.1016/j.semcancer.2018.01.008. [DOI] [PubMed] [Google Scholar]
- [8].Damon S, Perez TRH, Pritchett JR. Long, abundantly expressed non-coding transcripts are altered in cancer. Hum Mol Genet. 2008;17(5):642–55. [DOI] [PubMed]; Damon S, Perez TRH, Pritchett JR. Long, abundantly expressed non-coding transcripts are altered in cancer. Hum Mol Genet. 2008;17(5):642–55. doi: 10.1093/hmg/ddm336. [DOI] [PubMed] [Google Scholar]
- [9].Lin SX, Jiang H, Xiang GZ, Zhang WR, Weng YH, Qiu FD, et al. Up-regulation of long non-coding RNA SNHG1 contributes to proliferation and metastasis in laryngeal squamous cell carcinoma. Eur Rev Med Pharmacol Sci. 2018;22(5):1333–41. [DOI] [PubMed]; Lin SX, Jiang H, Xiang GZ, Zhang WR, Weng YH, Qiu FD. et al. Up-regulation of long non-coding RNA SNHG1 contributes to proliferation and metastasis in laryngeal squamous cell carcinoma. Eur Rev Med Pharmacol Sci. 2018;22(5):1333–41. doi: 10.26355/eurrev_201803_14475. [DOI] [PubMed] [Google Scholar]
- [10].Pan F, Yao J, Chen Y, Zhou C, Geng P, Mao H et al. A novel long non-coding RNA FOXCUT and mRNA FOXC1 pair promote progression and predict poor prognosis in esophageal squamous cell carcinoma. Int J Clin Exp Pathol. 2014;7(6):2838–49. [PMC free article] [PubMed]; Pan F, Yao J, Chen Y, Zhou C, Geng P, Mao H. et al. A novel long non-coding RNA FOXCUT and mRNA FOXC1 pair promote progression and predict poor prognosis in esophageal squamous cell carcinoma. Int J Clin Exp Pathol. 2014;7(6):2838–49. [PMC free article] [PubMed] [Google Scholar]
- [11].Kong XP, Yao J, Luo W, Feng FK, Ma JT, Ren YP, et al. The expression and functional role of a FOXC1 related mRNA-lncRNA pair in oral squamous cell carcinoma. Mol Cell Biochem. 2014;394(1–2):177–86. [DOI] [PMC free article] [PubMed]; Kong XP, Yao J, Luo W, Feng FK, Ma JT, Ren YP. et al. The expression and functional role of a FOXC1 related mRNA-lncRNA pair in oral squamous cell carcinoma. Mol Cell Biochem. 2014;394(1–2):177–86. doi: 10.1007/s11010-014-2093-4. [DOI] [PMC free article] [PubMed] [Google Scholar]
- [12].Yang LY, Yi K, Wang HJ, Zhao YQ, Xi MR. Comprehensive analysis of lncRNAs microarray profile and mRNA–lncRNA co-expression in oncogenic HPV-positive cervical cancer cell lines. Oncotarget. 2016;7(31):49917–29. [DOI] [PMC free article] [PubMed]; Yang LY, Yi K, Wang HJ, Zhao YQ, Xi MR. Comprehensive analysis of lncRNAs microarray profile and mRNA–lncRNA co-expression in oncogenic HPV-positive cervical cancer cell lines. Oncotarget. 2016;7(31):49917–29. doi: 10.18632/oncotarget.10232. [DOI] [PMC free article] [PubMed] [Google Scholar]
- [13].Zhou J, Li W, Jin T, Xiang X, Lei D. Gene microarray analysis of lncRNA and mRNA expression profiles in patients with hypopharyngeal squamous cell carcinoma. Int J Clin Exp Med. 2015;8(4):4862–82. [PMC free article] [PubMed]; Zhou J, Li W, Jin T, Xiang X, Lei D. Gene microarray analysis of lncRNA and mRNA expression profiles in patients with hypopharyngeal squamous cell carcinoma. Int J Clin Exp Med. 2015;8(4):4862–82. [PMC free article] [PubMed] [Google Scholar]
- [14].Feng L, Wang R, Lian M, Ma H, He N, Liu H, et al. Integrated analysis of long noncoding RNA and mRNA expression profile in advanced laryngeal squamous cell carcinoma. PLoS One. 2016;11(12):e0169232. [DOI] [PMC free article] [PubMed]; Feng L, Wang R, Lian M, Ma H, He N, Liu H. et al. Integrated analysis of long noncoding RNA and mRNA expression profile in advanced laryngeal squamous cell carcinoma. PLoS One. 2016;11(12):e0169232. doi: 10.1371/journal.pone.0169232. [DOI] [PMC free article] [PubMed] [Google Scholar]
- [15].Smyth GK. Limma: linear models for microarray data. In: Gentleman R, Carey VJ, Huber W, Irizarry RA, Dudoit S, editors. Bioinformatics and computational biology solutions using R and bioconductor. New York, NY: Springer New York; 2005. p. 397–420; Smyth GK. Gentleman R, Carey VJ, Huber W, Irizarry RA, Dudoit S. Bioinformatics and computational biology solutions using R and bioconductor. New York, NY: Springer New York; 2005. Limma: linear models for microarray data. pp. p. 397–420. , editors. [Google Scholar]
- [16].Harrow J, Frankish A, Gonzalez JM, Tapanari E, Diekhans M, Kokocinski F, et al. GENCODE: the reference human genome annotation for The ENCODE Project. Genome Res. 2012;22(9):1760–74. [DOI] [PMC free article] [PubMed]; Harrow J, Frankish A, Gonzalez JM, Tapanari E, Diekhans M, Kokocinski F. et al. GENCODE: the reference human genome annotation for The ENCODE Project. Genome Res. 2012;22(9):1760–74. doi: 10.1101/gr.135350.111. [DOI] [PMC free article] [PubMed] [Google Scholar]
- [17].Kolde R, Kolde MR. Package ‘pheatmap’. Version; 2015.; Kolde R, Kolde MR. Package ‘pheatmap’. Version. 2015.
- [18].Szklarczyk D, Franceschini A, Wyder S, Forslund K, Heller D, Huerta-Cepas J, et al. STRING v10: protein–protein interaction networks, integrated over the tree of life. Nucleic acids Res. 2014;43(Database issue):D447–52. [DOI] [PMC free article] [PubMed]; Szklarczyk D, Franceschini A, Wyder S, Forslund K, Heller D, Huerta-Cepas J. et al. STRING v10: protein–protein interaction networks, integrated over the tree of life. Nucleic acids Res. 2014;43(Database issue)::D447–52. doi: 10.1093/nar/gku1003. [DOI] [PMC free article] [PubMed] [Google Scholar]
- [19].Shannon P, Markiel A, Ozier O, Baliga NS, Wang JT, Ramage D, et al. Cytoscape: a software environment for integrated models of biomolecular interaction networks. Genome Res. 2003;13(11):2498–504. [DOI] [PMC free article] [PubMed]; Shannon P, Markiel A, Ozier O, Baliga NS, Wang JT, Ramage D. et al. Cytoscape: a software environment for integrated models of biomolecular interaction networks. Genome Res. 2003;13(11):2498–504. doi: 10.1101/gr.1239303. [DOI] [PMC free article] [PubMed] [Google Scholar]
- [20].Kanehisa M, Goto S. KEGG: Kyoto encyclopedia of genes and genomes. Nucleic Acids Res. 2000;28(1):27–30. [DOI] [PMC free article] [PubMed]; Kanehisa M, Goto S. KEGG: Kyoto encyclopedia of genes and genomes. Nucleic Acids Res. 2000;28(1):27–30. doi: 10.1093/nar/28.1.27. [DOI] [PMC free article] [PubMed] [Google Scholar]
- [21].Yu G, Wang LG, Han Y, He QY. ClusterProfiler: an R package for comparing biological themes among gene clusters. Omics J Integr Biol. 2012;16(5):284–7. [DOI] [PMC free article] [PubMed]; Yu G, Wang LG, Han Y, He QY. ClusterProfiler: an R package for comparing biological themes among gene clusters. Omics J Integr Biol. 2012;16(5):284–7. doi: 10.1089/omi.2011.0118. [DOI] [PMC free article] [PubMed] [Google Scholar]
- [22].Han H, Cho JW, Lee S, Yun A, Kim H, Bae D, et al. TRRUST v2: an expanded reference database of human and mouse transcriptional regulatory interactions. Nucleic Acids Res. 2018;46(D1):D380–6. [DOI] [PMC free article] [PubMed]; Han H, Cho JW, Lee S, Yun A, Kim H, Bae D. et al. TRRUST v2: an expanded reference database of human and mouse transcriptional regulatory interactions. Nucleic Acids Res. 2018;46(D1):D380–6. doi: 10.1093/nar/gkx1013. [DOI] [PMC free article] [PubMed] [Google Scholar]
- [23].Lu TX, Rothenberg ME. microRNA. J Allergy Clin Immunol. 2018;141(4):1202–7. [DOI] [PMC free article] [PubMed]; Lu TX, Rothenberg ME. microRNA. J Allergy Clin Immunol. 2018;141(4):1202–7. doi: 10.1016/j.jaci.2017.08.034. [DOI] [PMC free article] [PubMed] [Google Scholar]
- [24].Pohar M, Stare J. Relative survival analysis in R. Comput Methods Programs Biomed.2006;81(3):272–8. [DOI] [PubMed]; Pohar M, Stare J. Relative survival analysis in R. Comput Methods Programs Biomed. 2006;81(3):272–8. doi: 10.1016/j.cmpb.2006.01.004. [DOI] [PubMed] [Google Scholar]
- [25].Wang D, Zhang S, Chen F. High expression of PLOD1 drives tumorigenesis and affects clinical outcome in gastrointestinal carcinoma. Genet Test Mol Biomarkers. 2018;22(6):366–73. [DOI] [PubMed]; Wang D, Zhang S, Chen F. High expression of PLOD1 drives tumorigenesis and affects clinical outcome in gastrointestinal carcinoma. Genet Test Mol Biomarkers. 2018;22(6):366–73. doi: 10.1089/gtmb.2018.0009. [DOI] [PubMed] [Google Scholar]
- [26].Yamada Y, Kato M, Arai T, Sanada H, Uchida A, Misono S, et al. Aberrantly expressed PLOD1 promotes cancer aggressiveness in bladder cancer: a potential prognostic marker and therapeutic target. Mol Oncol. 2019;13(9):1898–912. [DOI] [PMC free article] [PubMed]; Yamada Y, Kato M, Arai T, Sanada H, Uchida A, Misono S. et al. Aberrantly expressed PLOD1 promotes cancer aggressiveness in bladder cancer: a potential prognostic marker and therapeutic target. Mol Oncol. 2019;13(9):1898–912. doi: 10.1002/1878-0261.12532. [DOI] [PMC free article] [PubMed] [Google Scholar]
- [27].Wu X, Xiang H, Cong W, Yang H, Chen B. PLOD1, a target of miR-34c, contributes to cell growth and metastasis via repressing LATS1 phosphorylation and inactivating Hippo pathway in osteosarcoma. Biochem Biophys Res Commun. 2020;527(1):29–36. [DOI] [PubMed]; Wu X, Xiang H, Cong W, Yang H, Chen B. PLOD1, a target of miR-34c, contributes to cell growth and metastasis via repressing LATS1 phosphorylation and inactivating Hippo pathway in osteosarcoma. Biochem Biophys Res Commun. 2020;527(1):29–36. doi: 10.1016/j.bbrc.2020.04.052. [DOI] [PubMed] [Google Scholar]
- [28].Yue Y, Wang XY, Lei S, Wang YL, Wan YF, Li XQ, et al. Inhibition of KIF22 suppresses cancer cell proliferation by delaying mitotic exit through upregulating CDC25C expression. Carcinogenesis. 2014;6:6. [DOI] [PubMed]; Yue Y, Wang XY, Lei S, Wang YL, Wan YF, Li XQ. et al. Inhibition of KIF22 suppresses cancer cell proliferation by delaying mitotic exit through upregulating CDC25C expression. Carcinogenesis. 2014;6:6. doi: 10.1093/carcin/bgu065. [DOI] [PubMed] [Google Scholar]
- [29].Zhang Z, Xie H, Zhu S, Chen X, Niu Y. High expression of KIF22/kinesin-like DNA binding protein (Kid) as a poor prognostic factor in prostate cancer patients. Med Sci Monitor Int Med J Exp Clin Res. 2018;24:8190–7. [DOI] [PMC free article] [PubMed]; Zhang Z, Xie H, Zhu S, Chen X, Niu Y. High expression of KIF22/kinesin-like DNA binding protein (Kid) as a poor prognostic factor in prostate cancer patients. Med Sci Monitor Int Med J Exp Clin Res. 2018;24:8190–7. doi: 10.12659/MSM.912643. [DOI] [PMC free article] [PubMed] [Google Scholar]
- [30].Yu ZY, Jiang XY, Zhao RR, Qin JJ, Luo CJ, Ren YX, et al. Effect of KIF22 on promoting proliferation and migration of gastric cancer cells via MAPK-ERK pathways. Chin Med J. 2020;133(8):919–28. [DOI] [PMC free article] [PubMed]; Yu ZY, Jiang XY, Zhao RR, Qin JJ, Luo CJ, Ren YX. et al. Effect of KIF22 on promoting proliferation and migration of gastric cancer cells via MAPK-ERK pathways. Chin Med J. 2020;133(8):919–28. doi: 10.1097/CM9.0000000000000742. [DOI] [PMC free article] [PubMed] [Google Scholar]
- [31].Webster JA, Yang Z, Kim YH, Loo D, Mosa RM, Li H, et al. Collagen beta (1-O) galactosyltransferase 1 (GLT25D1) is required for the secretion of high molecular weight adiponectin and affects lipid accumulation. Biosci Rep. 2017;37(3):BSR20170105. [DOI] [PMC free article] [PubMed]; Webster JA, Yang Z, Kim YH, Loo D, Mosa RM, Li H. et al. Collagen beta (1-O) galactosyltransferase 1 (GLT25D1) is required for the secretion of high molecular weight adiponectin and affects lipid accumulation. Biosci Rep. 2017;37(3):BSR20170105. doi: 10.1042/BSR20170105. [DOI] [PMC free article] [PubMed] [Google Scholar]
- [32].Wang Y, Chu Y, Li K, Zhang G, Guo Z, Wu X, et al. Exosomes secreted by adipose-derived mesenchymal stem cells foster metastasis and osteosarcoma proliferation by increasing COLGALT2 expression. Front Cell Develop Biol. 2020;8:353. [DOI] [PMC free article] [PubMed]; Wang Y, Chu Y, Li K, Zhang G, Guo Z, Wu X. et al. Exosomes secreted by adipose-derived mesenchymal stem cells foster metastasis and osteosarcoma proliferation by increasing COLGALT2 expression. Front Cell Develop Biol. 2020;8:353. doi: 10.3389/fcell.2020.00353. [DOI] [PMC free article] [PubMed] [Google Scholar]
- [33].Sipaul F, Birchall M, Corfield A. What role do mucins have in the development of laryngeal squamous cell carcinoma? A systematic review. Eur Arch Oto-Rhino-Laryngol. 2011;268(8):1109–17. [DOI] [PubMed]; Sipaul F, Birchall M, Corfield A. What role do mucins have in the development of laryngeal squamous cell carcinoma? A systematic review. Eur Arch Oto-Rhino-Laryngol. 2011;268(8):1109–17. doi: 10.1007/s00405-011-1617-8. [DOI] [PubMed] [Google Scholar]
- [34].Yuan T, Kaori DN, Mika KS, Shoji N, Tatsuya T, Yuichi I, et al. Mucin 21 in esophageal squamous epithelia and carcinomas: analysis with glycoform-specific monoclonal antibodies. Glycobiology. 2012;22(9):1218–26. [DOI] [PubMed]; Yuan T, Kaori DN, Mika KS, Shoji N, Tatsuya T, Yuichi I. et al. Mucin 21 in esophageal squamous epithelia and carcinomas: analysis with glycoform-specific monoclonal antibodies. Glycobiology. 2012;22(9):1218–26. doi: 10.1093/glycob/cws082. [DOI] [PubMed] [Google Scholar]
- [35].Nair J, Jain P, Chandola U, Palve V, Vardhan NRH, Reddy RB, et al. Gene and miRNA expression changes in squamous cell carcinoma of larynx and hypopharynx. Genes Cancer. 2015;6(7–8):328–40. [DOI] [PMC free article] [PubMed]; Nair J, Jain P, Chandola U, Palve V, Vardhan NRH, Reddy RB. et al. Gene and miRNA expression changes in squamous cell carcinoma of larynx and hypopharynx. Genes Cancer. 2015;6(7–8):328–40. doi: 10.18632/genesandcancer.69. [DOI] [PMC free article] [PubMed] [Google Scholar]
- [36].Song JH, Cao Z, Yoon JH, Nam SW, Kim SY, Lee JY, et al. Genetic alterations and expression pattern of CEACAM1 in colorectal adenomas and cancers. Pathol Oncol Res. 2011;17(1):67–74. [DOI] [PubMed]; Song JH, Cao Z, Yoon JH, Nam SW, Kim SY, Lee JY. et al. Genetic alterations and expression pattern of CEACAM1 in colorectal adenomas and cancers. Pathol Oncol Res. 2011;17(1):67–74. doi: 10.1007/s12253-010-9282-6. [DOI] [PubMed] [Google Scholar]
- [37].Wang FF, Guan BX, Yang JY, Wang HT, Zhou CJ. CEACAM1 is overexpressed in oral tumors and related to tumorigenesis. Med Mol Morphol. 2017;50(1):42–51. [DOI] [PubMed]; Wang FF, Guan BX, Yang JY, Wang HT, Zhou CJ. CEACAM1 is overexpressed in oral tumors and related to tumorigenesis. Med Mol Morphol. 2017;50(1):42–51. doi: 10.1007/s00795-016-0147-2. [DOI] [PubMed] [Google Scholar]
- [38].Lucarini G, Zizzi A, Re M, Sayeed MA, Di Primio R, Rubini C. Prognostic implication of CEACAM1 expression in squamous cell carcinoma of the larynx: pilot study. Head Neck. 2019;41(6):1615–21. [DOI] [PubMed]; Lucarini G, Zizzi A, Re M, Sayeed MA, Di Primio R, Rubini C. Prognostic implication of CEACAM1 expression in squamous cell carcinoma of the larynx: pilot study. Head Neck. 2019;41(6):1615–21. doi: 10.1002/hed.25589. [DOI] [PubMed] [Google Scholar]
- [39].Matsumoto K, Hirayama T, Ikeda M, Nishi M, Tsumura H, Fujita T, et al. Loss of periplakin expression is associated with pathological stage and cancer-specific survival in patients with urothelial carcinoma of the urinary bladder. Eur Urol Suppl. 2015;14:2. [DOI] [PubMed]; Matsumoto K, Hirayama T, Ikeda M, Nishi M, Tsumura H, Fujita T. et al. Loss of periplakin expression is associated with pathological stage and cancer-specific survival in patients with urothelial carcinoma of the urinary bladder. Eur Urol Suppl. 2015;14:2. doi: 10.2220/biomedres.35.201. [DOI] [PubMed] [Google Scholar]
- [40].Cui H, Zhao X, Sun C, Lin Y, Yue L. Effects of overexpression of exogenous FUT7 on adhesion and migration of breast cancer cell. Cancer Res Prev Treat. 2014;41(3):252–5.; Cui H, Zhao X, Sun C, Lin Y, Yue L. Effects of overexpression of exogenous FUT7 on adhesion and migration of breast cancer cell. Cancer Res Prev Treat. 2014;41(3):252–5. [Google Scholar]
- [41].Funayama R, Taniguchi H, Mizuma M, Fujishima F, Nakayama K. PADI2 suppresses proliferation of colon cancer cells through protein citrullination. Cancer Sci. 2017;108(4):713. [DOI] [PMC free article] [PubMed]; Funayama R, Taniguchi H, Mizuma M, Fujishima F, Nakayama K. PADI2 suppresses proliferation of colon cancer cells through protein citrullination. Cancer Sci. 2017;108(4):713. doi: 10.1111/cas.13179. [DOI] [PMC free article] [PubMed] [Google Scholar]
- [42].McElwee JL, Mohanan S, Griffith OL, Breuer HC, Anguish LJ, Cherrington BD, et al. Identification of PADI2 as a potential breast cancer biomarker and therapeutic target. BMC Cancer. 2012;12:500. [DOI] [PMC free article] [PubMed]; McElwee JL, Mohanan S, Griffith OL, Breuer HC, Anguish LJ, Cherrington BD. et al. Identification of PADI2 as a potential breast cancer biomarker and therapeutic target. BMC Cancer. 2012;12:500. doi: 10.1186/1471-2407-12-500. [DOI] [PMC free article] [PubMed] [Google Scholar]
- [43].Luo N, Guo J, Chen L, Yang W, Qu X, Cheng Z. ARHGAP10, downregulated in ovarian cancer, suppresses tumorigenicity of ovarian cancer cells. Cell Death Dis. 2016;7:e2157. [DOI] [PMC free article] [PubMed]; Luo N, Guo J, Chen L, Yang W, Qu X, Cheng Z. ARHGAP10, downregulated in ovarian cancer, suppresses tumorigenicity of ovarian cancer cells. Cell Death Dis. 2016;7:e2157. doi: 10.1038/cddis.2015.401. [DOI] [PMC free article] [PubMed] [Google Scholar]
- [44].Pan S, Deng Y, Fu J, Zhang Y, Zhang Z, Ru X, et al. Tumor suppressive role of ARHGAP17 in colon cancer through Wnt/β-catenin signaling. Cell Physiol Biochem. 2018;46(5):2138–48. [DOI] [PubMed]; Pan S, Deng Y, Fu J, Zhang Y, Zhang Z, Ru X. et al. Tumor suppressive role of ARHGAP17 in colon cancer through Wnt/β-catenin signaling. Cell Physiol Biochem. 2018;46(5):2138–48. doi: 10.1159/000489543. [DOI] [PubMed] [Google Scholar]
- [45].Brun ME, Ruault M, Ventura M, Roizès G, De Sario A. Juxtacentromeric region of human chromosome 21: a boundary between centromeric heterochromatin and euchromatic chromosome arms. Gene. 2003;312:41–50. [DOI] [PubMed]; Brun ME, Ruault M, Ventura M, Roizès G, De Sario A. Juxtacentromeric region of human chromosome 21: a boundary between centromeric heterochromatin and euchromatic chromosome arms. Gene. 2003;312:41–50. doi: 10.1016/s0378-1119(03)00530-4. [DOI] [PubMed] [Google Scholar]
- [46].Crea F, Watahiki A, Quagliata L, Xue H, Pikor L, Parolia A, et al. Identification of a long non-coding RNA as a novel biomarker and potential therapeutic target for metastatic prostate cancer. Oncotarget. 2014;5(3):764–74. [DOI] [PMC free article] [PubMed]; Crea F, Watahiki A, Quagliata L, Xue H, Pikor L, Parolia A. et al. Identification of a long non-coding RNA as a novel biomarker and potential therapeutic target for metastatic prostate cancer. Oncotarget. 2014;5(3):764–74. doi: 10.18632/oncotarget.1769. [DOI] [PMC free article] [PubMed] [Google Scholar]


