Abstract
The decrease in number of AMPA-type glutamate receptor (AMPAR) at excitatory synapses causes LTD, a cellular basis of learning and memory. The number of postsynaptic AMPARs is regulated by the balance of exocytosis and endocytosis, and enhanced endocytosis of AMPAR has been suggested to underlie the LTD expression. However, it remains unclear how endocytosis and exocytosis of AMPAR change during LTD. In this study, we addressed this question by analyzing exocytosis and endocytosis of AMPAR by imaging super-ecliptic pHlorin (SEP)-tagged AMPAR around postsynaptic structure formed directly on the glass surface in the hippocampal culture prepared from rat embryos of both sexes. Contrary to a prevailing view on the LTD expression by endocytosis enhancement, the LTD induction by NMDA application only transiently enhanced endocytosis of SEP-tagged GluA1 subunits of AMPAR, which was counteracted by simultaneous augmentation of exocytosis. As a result, soon after the start of the LTD induction (∼1 min), the surface AMPAR did not markedly decrease. Thereafter, the surface GluA1-SEP gradually decreased (2–5 min) and kept at a low level until the end of observation (>30 min). Surprisingly, this gradual and sustained decrease of surface AMPAR was accompanied not by the enhanced endocytic events of GluA1, but by the suppression of exocytosis. Together, our data highlight an unprecedented mechanism for the LTD expression by attenuation of exocytosis of AMPAR, but not by enhanced endocytosis, together with a reduction of postsynaptic AMPAR scaffolding protein PSD95.
SIGNIFICANCE STATEMENT It has been generally assumed that LTD is expressed by enhancement of AMPAR endocytosis. Previous studies reported that endocytosis-related protein was involved in LTD and that significant amount of cell-surface AMPAR moved into intracellular compartments during LTD. Here, we report changes of cell-surface amount of AMPAR, and where and when individual exocytosis and endocytosis occurred during LTD. Cell-surface AMPAR gradually decreased in synchrony with suppression of exocytosis but not with enhancement of endocytosis. These results suggest that the decrease of cell-surface AMPAR amount during LTD was caused not by enhancement of endocytosis but rather by suppression of exocytosis, which revises current understanding of the expression mechanism of LTD.
Keywords: AMPAR receptor, endocytosis, exocytosis, hippocampus, imaging, long-term depression
Introduction
Synaptic plasticity, such as long-term potentiation (LTP) and long-term depression (LTD), has been regarded as a cellular mechanism of learning and memory and is implicated in neurological and psychiatric disorders (Malinow and Malenka, 2002; Kauer and Malenka, 2007; Collingridge et al., 2010). The main cellular mechanism of LTP or LTD is the increase or decrease in number of postsynaptic AMPA-type glutamate receptor (AMPAR), and changes in exocytosis and endocytosis are likely to underlie the increase or decrease of AMPAR on the cell surface (Shi et al., 1999; Malinow and Malenka, 2002; Kennedy and Ehlers, 2006; Huganir and Nicoll, 2013). Although enhanced endocytosis of AMPAR has been assumed to be a major mechanism of LTD (Beattie et al., 2000; Lee et al., 2002; Malinow and Malenka, 2002; Collingridge et al., 2010), the balance of exocytosis and endocytosis could be important. So far, it remains unclear how exocytosis and endocytosis of AMPAR change in the postsynaptic and extrasynaptic membranes during LTD expression.
To study AMPAR trafficking around postsynaptic membrane, we previously developed a method to induce formation of postsynaptic-like membrane (PSLM) on the glass surface coated with neurexin (NRX) in a rat hippocampal culture preparation (Tanaka and Hirano, 2012; Tanaka et al., 2014; Fujii et al., 2017). Then, AMPAR tagged with a pH-sensitive variant of GFP, superecliptic pHluorin (SEP) was expressed in neurons, and live-cell imaging around PSLM was performed with total internal reflection fluorescence microscopy (TIRFM) (Axelrod, 2001). SEP is dark in acidic vesicles but bright when exposed to the extracellular milieu with neutral pH. This method provided high signal-to-noise ratio images of AMPAR-SEP by limiting the visualization depth to within ∼100 nm above the glass surface, and individual exocytosis events of AMPAR-SEP were detected in both inside and outside of PSLM (non-PSLM) (Tanaka and Hirano, 2012). Furthermore, by changing extracellular pH intermittently using a U-tube system, which replaced extracellular solution rapidly, individual endocytic events of AMPAR-SEP around PSLM were visualized recently (Fujii et al., 2017).
In culture preparations, LTD has been often induced by application of NMDA (Lee et al., 1998; Lin and Huganir, 2007), and enhancement of clathrin-dependent endocytosis of AMPAR during LTD has been reported (Beattie et al., 2000; Lee et al., 2002; Collingridge et al., 2010). We previously showed transient enhancement of clathrin-dependent GluA1-SEP endocytosis soon after the onset of NMDA application, at PSLM in particular (Fujii et al., 2017). However, how endocytosis and exocytosis change in later periods and whether the transient endocytosis enhancement is sufficient for the LTD expression are unclear. It should be also noted that the time courses of change of AMPAR number in the postsynaptic and extrasynaptic membrane during LTD are still enigmatic. Previous studies reported a rapid decrease of AMPAR-SEP signal after NMDA application (Ashby et al., 2004; Lin and Huganir, 2007). However, later studies showed that the AMPAR-SEP signal comes not only from the cell surface but also from the endoplasmic reticulum with neutral intralumen pH (Paroutis et al., 2004; Rathje et al., 2013). Rathje et al. (2013) further reported that the intra-endoplasmic reticulum (ER) SEP signal decreases through acidification of ER lumen caused by NMDA application. Thus, AMPAR-SEP signal does not faithfully reflect the cell-surface amount of AMPAR-SEP after NMDA application.
Considering the above situations, here we applied the rapid pH change methods (Merrifield et al., 2005; Jullié et al., 2014; Fujii et al., 2017; Rosendale et al., 2017) to accurately estimate the cell-surface AMPAR amount during LTD induced by NMDA application (Lee et al., 1998; Ashby et al., 2004; Lin and Huganir, 2007). Then, we attempted to quantitatively measure frequencies and amounts of endocytosis and exocytosis events of AMPAR in both PSLM and non-PSLM, and tried to clarify how these endocytic and exocytic events regulate the number of cell surface AMPAR amount during initial, developing, and sustained phases of LTD.
Materials and Methods
Animals.
All experimental procedures were performed in accordance with the Society for Neuroscience policies on the use of animals and humans in neuroscience research and guidelines on animal experimentation of Kyoto University, and approved by the local committee for handling experimental animals in the Graduate School of Science, Kyoto University.
Primary cell culture/transfection.
Methods to prepare primary culture of hippocampal neurons from Wister rat (RRID, RGD_13508588) embryos of both sex and transfection of cDNA to neurons were similar to those used in previous studies (Tanaka and Hirano, 2012; Tanaka et al., 2014; Fujii et al., 2017), except that Neurobasal-Electro (Thermo Fisher Scientific) instead of Neurobasal was used as the culture medium in this study.
DNA constructs.
Expression vectors for GluA1(flop)-SEP, GluA1(flop)-myc, GluA2(flop)-SEP, transferrin receptor (TfR)-SEP, PSD95-TagRFPt, and NRX (1β without splice insertion 4)-Fc were described previously (Tanaka and Hirano, 2012; Fujii et al., 2017). To construct SEP-ER expression vector, calreticulin signal sequence was fused to N-terminal of SEP and KDEL sequence to the C-terminal, similarly to pEYFP-ER construct (Clontech) (see Fig. 2A), and inserted to pTagRFP-C vector (Evrogen) after deleting the TagRFP-coding region. KDEL is a C-terminal ER retention four-peptide sequence (Munro and Pelham, 1987).
Figure 2.
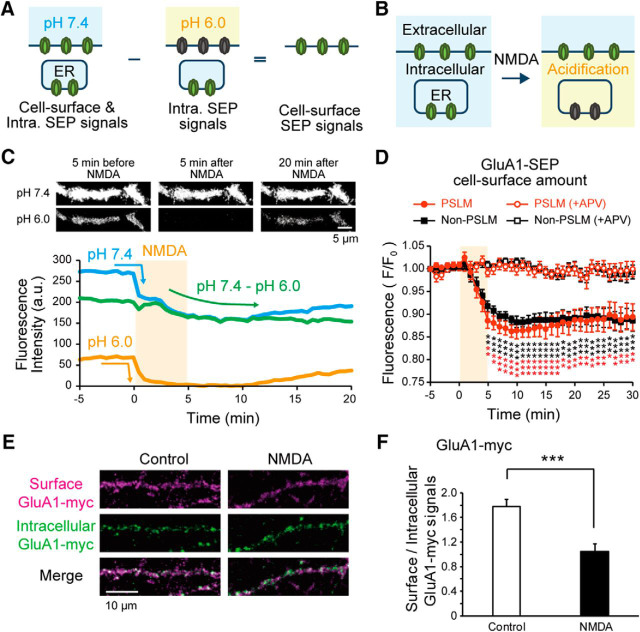
Estimation of cell-surface GluA1-SEP signal during LTD. A, B, Schema to show cell-surface and intracellular SEP signals (A), and effects of intracellular acidification by NMDA application on SEP signals (B). C, Representative images of GluA1-SEP at pH 7.4 and 6.0 (top) and time courses of GluA1-SEP signal intensities (bottom). Subtraction of the signal intensity at pH 6.0 (orange) from that at pH 7.4 (blue) gives the cell-surface signal intensity (green). D, The estimated cell-surface amount of GluA1-SEP in PSLM (red) and non-PSLM (black) before and after NMDA application (orange box) without (filled symbols, N = 14 cells) or with (open symbols, N = 7 cells) APV. Data are mean ± SEM. *p < 0.05, **p < 0.01, ***p < 0.001, compared with the mean value before NMDA application (−5 to 0 min), Dunnett's test. E, Immunofluorescence staining of cell-surface and intracellular GluA1-myc with or without NMDA application. F, Relative amount of GluA1-myc on the cell surface against intracellular GluA1-myc. Data are mean ± SEM. Control, N = 11 cells; NMDA, 13 cells; t(22) = 4.35, p = 0.0004, Student's t test.
Immunocytochemistry.
Thirty minutes after 5 min application of normal solution with or without NMDA, cultured neurons on poly-D-lysine-, but not NRX-coated, glass coverslip were fixed in PBS with 4% PFA for 5 min at room temperature. Then, nonspecific binding of antibodies was blocked in PBS with 5% normal goat serum (Blocking Solution) for 20 min, and the neurons were incubated with rabbit anti-myc antibody (1:500, ab1906, Abcam) for 1 h to label cell-surface GluA1-myc. Next, they were incubated with Blocking Solution with 0.3% Tween to permeabilize the cell membrane. After 3 times washes with Blocking Solution with 0.3% Tween, cells were labeled with mouse anti-myc antibody (1:500, BML-SA294, Enzo Life Sciences; RRID:AB_10541551) for 1 h. Then, samples were washed and incubated with secondary anti-rabbit and anti-mouse IgG antibodies (1:1000, Alexa568-conjugated anti-rabbit IgG, A-11011, Thermo Fisher Scientific, RRID:AB_143157; 1:1000, Alexa488-conjugated anti-mouse IgG, A-11029, Thermo Fisher Scientific, RRID:AB_138404). Fluorescence images were captured using a confocal laser scanning microscope FV1000 (Olympus), and the ratio of Alexa568 signal intensity and Alexa488 signal intensity was calculated in neuronal areas.
Coating glass surface with NRX.
The detailed procedures for NRX coating were described previously (Tanaka and Hirano, 2012; Tanaka et al., 2014). Briefly, glass coverslips were incubated with 43 μm biotinylated BSA (Thermo Fisher Scientific) in buffer A (100 mm KCl, 5 mm MgCl2, 25 mm HEPES, pH 7.4, adjusted with KOH) at 4°C for 8–24 h. Then, the glass was incubated with 17 μm streptavidin (Wako or Prospec) in buffer A for 1 h on a shaker. Next, coverslips were incubated with buffer A containing biotin-conjugated anti-human IgG (12–14 μg/ml) (109-065-098, Jackson ImmunoResearch Laboratories, RRID:AB_2337630) for 1 h on a shaker. Then, coverslips were incubated with buffer A containing 3–5 μg/ml NRX-Fc for 5 h. Incubation of coverslips with streptavidin, biotin-conjugated IgG, and NRX-Fc was performed at room temperature (20–25°C), and coverslips were washed with buffer A (3 times for 3–5 min) after each incubation. After NRX coating, coverslips were incubated with 0.02–0.2 mg/ml poly-D-lysine (Merck) at 37°C for 1–12 h. Before seeding neurons, coverslips were washed with water (3 times for 3–5 min) and soaked in neuronal culture medium. Detailed method to prepare NRX-Fc using HEK293 cells was reported previously (Tanaka et al., 2014). Neurons were cultured on the NRX- and poly-D-lysine-coated or only poly-D-lysine-coated glass.
Whole-cell voltage-clamp recordings and chemical LTD induction.
Whole-cell patch-clamp recording from cultured hippocampal neurons was performed with an amplifier (EPC-10, HEKA). The intracellular solution contained the following: 130 mm CsCl, 0.5 mm EGTA, 2 mm Mg-ATP, 0.2 mm Na-GTP, 10 mm HEPES-CsOH, pH 7.2–7.3, and the extracellular solution contained the following: 120 mm NaCl, 2 mm CaCl2, 0.3 mm MgCl2, 10 mm glucose, 10 mm HEPES-KOH, pH 7.3–7.4, and 1 μm TTX. mEPSCs were measured at room temperature in the presence of 20 μm bicuculline to block ionotropic GABAA receptors. The membrane potential was heled at −70 mV. Only recording with a series resistance <20 mΩ and input resistance >100 mΩ were analyzed. Mini Analysis software (Synaptosoft, RRID:SCR_002184) was used to analyze mEPSCs. Events >4 pA with appropriate time courses were selected as mEPSCs. The mean amplitudes and frequencies of mEPSCs were calculated from 200 to 400 events per cell. The NMDA solution applied to induce LTD was the external solution containing 1 μm strychnine to block glycine receptors, 30 μm NMDA, and 10 μm glycine.
U-tube system.
The U-tube system was prepared as described previously (Bretschneider and Markwardt, 1999; Fujii et al., 2017). The intra-U-tube solution was same as the extracellular solution, except that pH was adjusted to 6.0 with 2-(N-morpholino) ethanesulfonic acid and KOH.
TIRF microscopy and live-cell imaging.
The TIRFM imaging system was same as that used in a previous study (Fujii et al., 2017) and composed of an inverted fluorescence microscope IX71 (Olympus) equipped with a 100 × 1.45 numerical aperture TIRFM objective lens (Olympus), 1.6 × intermediate lens, EM-CCD camera (iXonEM+ DU-897, Andor), 488 nm laser (85-BCD-020, Melles Griot), and 561 nm laser (Sapphire 561LP, Coherent). For filtering and separating emitted fluorescence, mirror units U-MNIBA3 and U-MWIG3 (Olympus) were used. In dual-color imaging experiments, a BG multicolor dichroic mirror (TIFM488/561NM, Olympus) and BG multicolor emission filter (TIRFM488/561, Olympus) were used. Some experiments were performed under 488 nm laser illumination with a higher projection angle than the TIFRM condition (oblique illumination) (Wang et al., 2008) (see Fig. 9A). Data were acquired using MetaMorph Software (Molecular Devices, RRID:SCR_002368).
Figure 9.
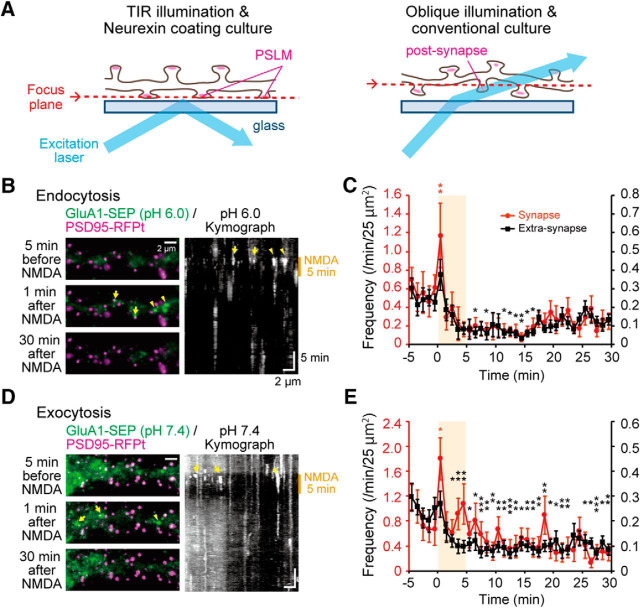
Effects of NMDA application on endocytosis and exocytosis of GluA1 in a conventional culture preparation under oblique illumination. A, Schematic presentation of experimental conditions for total internal reflection (TIR) and oblique illumination. B, Images of GluA1-SEP (green) and PSD95-RFPt (magenta) before and 1 min and 30 min after NMDA application, and kymograph of GluA1-SEP signals at pH 6.0 under oblique illumination. C, Frequencies of GluA1-SEP endocytosis in synapses (red, left ordinate) and extrasynapses (black, right ordinate) before and after NMDA application (orange box). N = 23 cells. D, Images of GluA1-SEP signals before and 1 min and 30 min after NMDA application, and kymograph of GluA1-SEP signals at pH 7.4 under oblique illumination. E, Exocytosis frequency of GluA1-SEP. N = 26 cells. *p < 0.05, **p < 0.01, ***p < 0.001, compared with the mean value before NMDA application (−5 to 0 min), Dunnett's test.
All live-cell imaging experiments were performed in the same external solution as used in whole-cell patch-clamp experiments at room temperature. Some experiments were performed at near physiological temperature 34°C using an inline-heater and its controller (SH-27B, TC-324B, Warner Instruments). In chemical LTD induction experiments, neurons were continuously perfused with the extracellular solution. The composition of NMDA perfusion solution to induce LTD was the same as that used in electrophysiological experiments. Some experiments were performed in the presence of pitstop2 (30 μm, SML1169, Merck), an inhibitor of clathrin-dependent endocytosis, or APV (100 μm, 0106, Tocris Bioscience), an antagonist of NMDA receptor.
In experiments for calculating the amount of GluA1-SEP on the cell surface, fluorescence images at pH 7.4 were acquired every 2 s, and images at pH 6.0 were acquired during 200–300 ms periods every 30 s. The exposure time was 50 ms in each condition, and neutral density filters (ND3-6) were used to reduce photo-bleaching.
For detection of individual exocytosis or endocytosis of GluA1-SEP with a high signal-to-noise ratio, images were acquired with ND50 filter or without ND filter, respectively. To record exocytosis, images were acquired every 2 s with 50 ms exposure time. In this recording, 30–60 s photo-bleaching was performed at pH 7.4 before image acquisition to improve the signal-to-noise ratio (Araki et al., 2010).
The detection and analysis of individual endocytic events were described previously (Fujii et al., 2017). Briefly, to record GluA1-SEP endocytosis, pH 7.4 and pH 6.0 images were acquired alternately by synchronizing magnetic valves with a camera. The pH 6.0 images were acquired with 100 ms exposure time during 200–300 ms acidic period every 4 s to minimize effects of acidic extracellular solution. On the other hand, the pH 7.4 images were acquired with 6 ms exposure time to avoid photo-bleaching of SEP on the cell surface. Before GluA1-SEP endocytosis recording, 30–60 s photo-bleaching was performed at pH 6.0 to reduce the intracellular GluA1-SEP signal from ER (Rathje et al., 2013). To investigate the change of intra-ER pH, the images were acquired with the same protocol as that used in estimation of cell-surface GluA1-SEP amounts. We also used 2 mm trypan purple (TP; 2465, ATT Bioquest) to quench SEP on the cell surface in some experiments (Jullié et al., 2014; Rosendale et al., 2017). TP was applied for 300–400 ms using the U-tube with 15 s intervals. Recovery of the SEP signal intensity after the TP application was not complete. Thus, we limited the number of TP application to <16 times.
The effect of NMDA on the PSD95-RFPt signal was examined by recording PSD95-RFPt fluorescence every 30 s and then normalized the signal intensity with F0, which was acquired 5 min before NMDA application. Before NMDA application, we recorded base line images for at least 5 min.
We examined the cell-surface amount and endocytosis and exocytosis frequencies of TfR-SEP in NMDA application experiments by alternatively recording images at pH 7.4 and 6.0 with 2 s intervals. ND20 filter was used with 100 ms exposure time. TfR-SEP signals showed spotted distribution with a high signal-to-noise ratio at pH 7.4, and at pH 6.0 background signals were quite weak. Thus, we did not apply photo-bleaching before the experiment.
Image analysis.
Analyses of acquired images were performed using MetaMorph (Molecular Devices), ImageJ (National Institutes of Health, Bethesda, MD), and Excel (Microsoft) in a manner similar to previous studies (Tanaka and Hirano, 2012; Tanaka et al., 2014; Fujii et al., 2017).
GluA1-SEP exocytosis events were detected as follows. First, drift of time-lapse images was corrected (Tanaka et al., 2014), and the sum of mean plus 3 × SD of the background signal was subtracted from each image. Then, to improve identification of ROIs (ROIexo) where exocytosis might have occurred, the averaged signal intensity in all dendritic areas was subtracted from the image at each time point. And the maximum-intensity projection (MIP) image was obtained by plotting the maximum intensity of each pixel over all frames. Next, the average-intensity projection image was subtracted from the MIP image. The image was low- and high- pass filtered and converted to a binary image by setting a threshold so that signals reflecting presumptive exocytosis were included. Signal-positive areas of appropriate size (7–72 pixels, 1 pixel = 0.01 μm2) were selected as ROIs (ROIexo).
The timing of exocytosis in each ROIexo was determined by the following two steps. First, Ft − Fav, Ft + 1 − Fav, and SD were calculated, where t represents the time, Ft is the background-subtracted fluorescence intensity at time t, Ft + 1 is the fluorescence intensity at the next frame, and Fav and SD are the mean and SD of fluorescence intensity during the 5 preceding frames (Ft − 5 to Ft − 1) in each ROIexo. When the intensity of Ft − Fav or Ft + 1 − Fav was larger than 5 × SD, t was selected as a candidate timing of exocytosis. Next, 5 circular areas of 4 pixels diameter were chosen randomly in dendritic regions outside of ROIexo, and the mean amplitude of fluorescence intensity fluctuation (fluorescence intensity changes between succeeding frames) before NMDA application was calculated as signal fluctuation (Sfl). When Ft − Fav or Ft + 1 − Fav was larger than 4 × Sfl, we regarded exocytosis to have occurred at t. Then, exocytosis events were sorted into PSLM or non-PSLM events. The mean value of exocytosis intensity was multiplied by those of frequency to estimates the amount of exocytosed SEP-tagged receptors every minute.
The PSLM area was defined as in a previous study (Tanaka and Hirano, 2012). Briefly, a background-subtracted PSD95-RFPt image was low- and high-pass filtered. Then, binarized PSD95-RFPt puncta ranging from 0.07 to 0.39 μm2, corresponding to a normal size of postsynaptic density plus its vicinity (within 0.3 μm), was defined as PSLM. Dendritic area without PSD95-RFPt signal was defined as non-PSLM.
GluA1-SEP or GluA2-SEP endocytosis was detected as previously described (Fujii et al., 2017). As in exocytosis detection, the MIP image at pH 6.0 was generated. Then, the local maxima in the MIP image were enclosed by 2.5 pixel radius circles as regions of interest (ROIendo) using the Find Maxima function of ImageJ with noise tolerance value of 500. Endocytosis timings were determined using pH 6.0 images similarly to determination of exocytosis timing. The intensity of fluorescence change in each endocytosis was defined as Ft − Fav. When F continuously increased after t, the intensity was defined as FT − Fav, where FT was the first peak value after t. When the intensity was >8 times the Sfl, we regarded endocytosis to have occurred at t. The frequency of exocytosis or endocytosis was normalized as the events number/min/25 μm2 unless otherwise stated.
We analyzed the cell-surface amount, endocytosis and exocytosis of TfR-SEP similarly to those of GluA1-SEP, except that we determined ROIexo at pH 7.4 similarly to ROIendo at pH 6.0. To estimate the cell-surface GluA1- or TfR-SEP signal intensity, the pH 6.0 image was subtracted from the pH 7.4 image every 1 min. Estimated fluorescence intensity at each time point was normalized by F0, which was obtained 5 min before NMDA application.
The mean value of endocytosis intensity (Ft − Fav or FT − Fav) was calculated, and it was multiplied by those of frequency to estimates the amount of endocytosed SEP-tagged receptors every minute.
Experimental design and statistical analysis.
The sample size in each experiment was determined based on previous publications dealing with live-cell imaging (Park et al., 2006; Araki et al., 2010; Tanaka and Hirano, 2012; Rathje et al., 2013; Zheng et al., 2015). In each experiment, N indicates the number of cells unless otherwise stated. All values are presented as mean ± SEM. The equality of SD was assessed by F test. When the equality was not denied, Dunnett's test or Student's t test was used to evaluate differences in means. If differences in SD were detected among data, Steel's test or Welch's t test was used. Statistical tests were performed using Kyplot (KyensLab) or R (The R Foundation; https://www.r-project.org/).
Results
Estimation of cell-surface amounts of GluA1-SEP during LTD
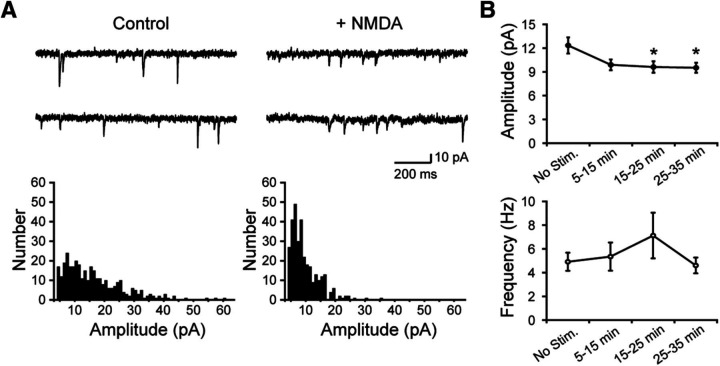
We induced LTD by NMDA application (Lee et al., 1998; Ashby et al., 2004; Lin and Huganir, 2007) and confirmed the decrease in amplitude of mEPSCs with whole-cell patch-clamp recording (Fig. 1).
Figure 1.
Changes of mEPSCs induced by NMDA application. A, Representative current traces and amplitude histograms of mEPSCs without (Control) or after (+NMDA) NMDA application. B, Time courses of mEPSC amplitude and frequency before and after NMDA application. Data are mean ± SEM in 10 min bins. N = 12 or 13 cells. *p < 0.05 (15–25 min, p = 0.04; 25–35 min, p = 0.03), Dunnett's test.
Next, we attempted to examine the change of cell-surface GluA1-SEP amounts during LTD in both PSLM and non-PSLM. The majority of previous studies assumed that intracellular SEP fused to extracellular domain of AMPAR was quenched because of low pH in the organelle lumen, and that most of SEP signal came from cell-surface AMPAR-SEP. However, other reports noted that AMPAR-SEP signal also came from ER with the neutral luminal pH (Fig. 2A,B) (Paroutis et al., 2004; Rathje et al., 2013). Indeed, we detected some diffuse GluA1-SEP signal even at pH 6.0 without prebleaching (Fig. 2C).
When LTD was induced by NMDA application, GluA1-SEP signal at pH 7.4 decreased with fast and slow kinetics (Fig. 2C, blue line). This decrease in AMPAR-SEP signal after NMDA application has been thought to reflect reduction of cell-surface AMPAR-SEP (Ashby et al., 2004; Lin and Huganir, 2007). However, Rathje et al. (2013) claimed that the signal decrease was mainly caused by intracellular acidification induced by NMDA application (Fig. 2B). Therefore, we attempted to precisely estimate the signal intensity of cell-surface GluA1-SEP by subtracting the intracellular fluorescent signal recorded at pH 6.0 from the signal recorded at pH 7.4 (Fig. 2A,C). The estimated cell-surface GluA1-SEP signal decreased slowly, reaching the minimum ∼10 min after the onset of NMDA application (Fig. 2C, green line, D). The decrease in GluA1-SEP signal intensity induced by NMDA application was suppressed by an antagonist of NMDA receptor APV (Fig. 2D). We also examined the cell-surface amount of GluA1 by immunofluorescence staining of GluA1-myc on the cell surface and within the cell. NMDA application significantly decreased the relative amount of GluA1-myc on the cell surface (t(22) = 4.35, p = 0.0003, Student's t test; Fig. 2E,F).
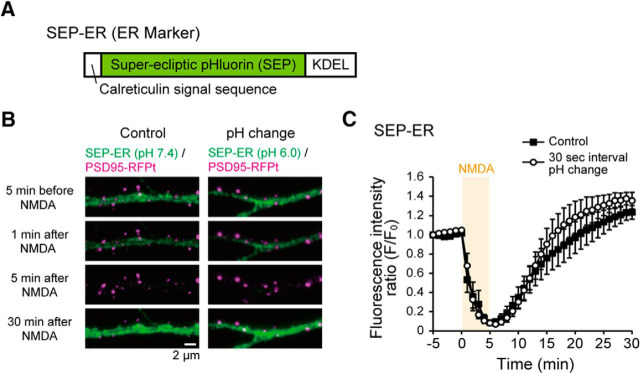
The intra-ER pH change caused by NMDA application was examined with an independent indicator, which was constructed by fusing calreticulin signal sequence to N-terminal of SEP and ER retention KDEL sequence to the C-terminal (SEP-ER) (Fig. 3A). Then, we observed SEP-ER signal coming from the ER lumen before and after NMDA application. As suggested previously (Rathje et al., 2013), SEP-ER signal rapidly decreased by NMDA application and recovered to a basal level (Fig. 3B,C). Next, we examined whether the repeated extracellular pH changes through the U-tube affected the intra-ER pH by monitoring SEP-ER signal with pH changes (30 s interval). The time course of SEP-ER signal change by NMDA application was not significantly different from that without extracellular pH changes (Fig. 3C). These results indicate that NMDA application decreased the intra-ER pH, which recovers within 20 min, and they suggest that the extracellular pH change does not significantly affect the intra-ER pH in the basal state and during NMDA application.
Figure 3.
Effects of NMDA application and extra-pH changes on intra-ER pH. A, SEP-ER cDNA construct. B, Representative images of SEP-ER before, 1 min, 5 min, and 30 min after NMDA application at pH 7.4 (without pH change, Control) and at pH 6.0 (with pH changes, 30 s interval). C, Averaged time courses of SEP-ER signals before and after NMDA application (orange box) at pH 7.4 with and without pH changes. In both cases, SEP-ER signal decreased by NMDA application and recovered. Data are mean ± SEM in 1 min bins. N = 6 cells for each.
GluA1-SEP endocytosis changes during LTD
The amount of GluA1-SEP on the cell surface should be regulated by endocytosis and exocytosis. Thus, we examined the AMPAR endocytosis during LTD. We detected individual endocytosis events with the intermittent extracellular pH changes with the U-tube (Fig. 4A) (Fujii et al., 2017). A single endocytic event was observed as emergence of GluA1-SEP signal at pH 6.0. As previously reported, NMDA application induced a transient increase in the endocytosis frequency in PSLM (Fig. 4B,C; Movie 1) (Fujii et al., 2017). Here, we report that, after the transient increase, the endocytosis frequency was not kept at a high level but rather decreased and the low frequency of GluA1-SEP endocytosis was retained (Fig. 4C). At some timepoints after NMDA application, the frequency of GluA1-SEP endocytosis was significantly lower than that before the application in non-PSLM.
Figure 4.
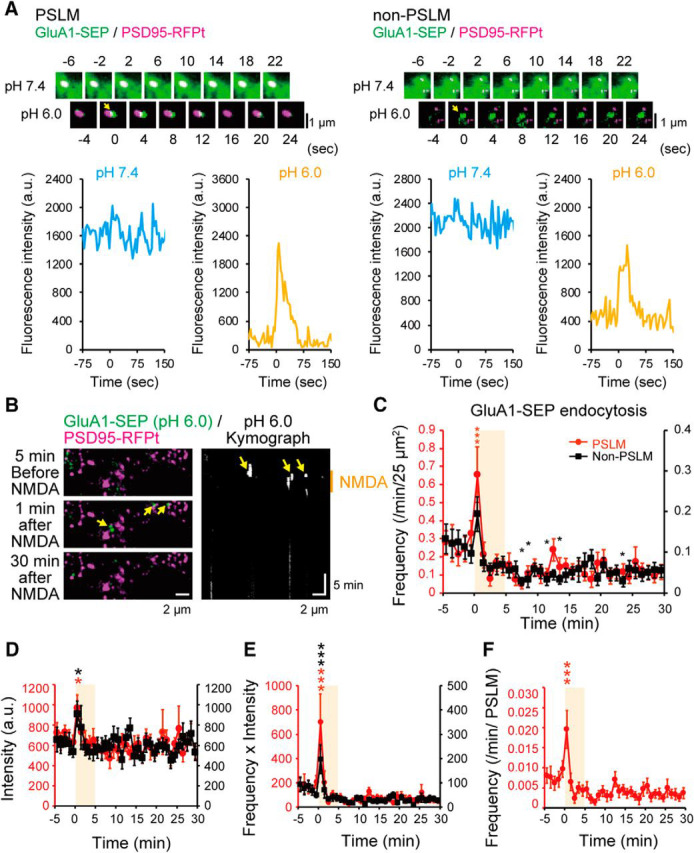
Changes of endocytosis GluA1-SEP after NMDA application. A, Representative images before and after endocytosis, and time courses of GluA1-SEP signal intensity at pH 7.4 and 6.0 in both PSLM and non-PSLM. The pH 6.0 images were acquired with 100 ms exposure time. On the other hand, the pH 7.4 images were acquired with 6 ms exposure time to avoid photo-bleaching of SEP on the cell surface. B, Images of GluA1-SEP (green) and PSD95-RFPt (magenta) before and 1 min and 30 min after NMDA application, and kymograph of GluA1-SEP signals at pH 6.0. C, Frequencies of GluA1-SEP endocytosis in PSLM (red, left ordinate) and non-PSLM (black, right ordinate) before and after NMDA application (orange box). This graph includes some data partly presented in a previous report (Fujii et al., 2017, their Fig. 3B). N = 21 cells. D, The intensity of GluA1-SEP signal intensity in each endocytosis in PSLM and non-PSLM before and after NMDA application. E, The intensity × frequency of GluA1-SEP endocytosis in PSLM and non-PSLM before and after NMDA application. F, Frequency of GluA1-SEP endocytosis per PSLM. *p < 0.05, ***p < 0.001, compared with the mean value before NMDA application (from −5 to 0 min), Dunnett's test.
Transient increase of GluA1-SEP endocytosis after NMDA application. GluA1-SEP endocytosis (green) after NMDA application in PSLM (magenta, arrows) and in non-PSLM (arrowhead) at pH 6.0. Movie runs 60 times faster than the real time.
We also examined whether the amount of GluA1-SEP in individual endocytosis changed during LTD by analyzing the signal intensity of SEP-GluA1 in each event. The signal intensity transiently increased immediately after NMDA application onset in both PSLM and non-PSLM and returned to the basal level thereafter (Fig. 4D). These results suggest that different type of endocytosis occurred just after NMDA application, which might have been related clathrin dependence of GluA1-SEP endocytosis at this timing (Fujii et al., 2017). They also reported that the basal GluA1-SEP endocytosis is clathrin-independent. The change of intensity × frequency value was qualitatively similar to that of frequency (Fig. 4C,E). The endocytosis frequency per PSLM also showed qualitatively similar tendency to that per area (Fig. 4C,F). Thus, in the following analysis, we mainly analyze the frequency of endocytosis events per minute and 25 μm2.
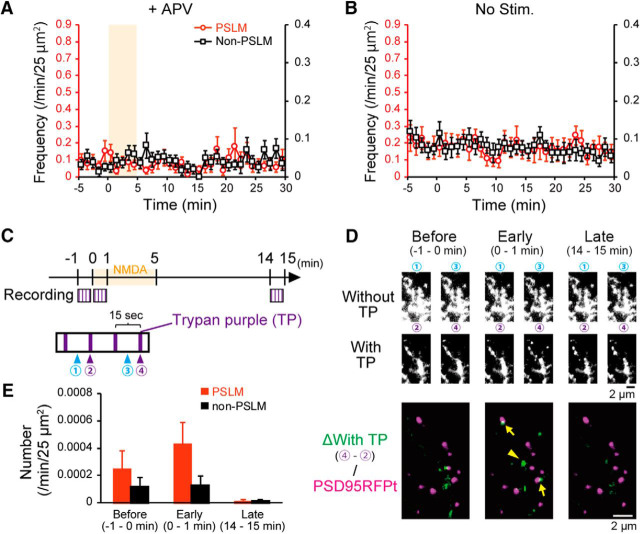
Endocytosis frequency of GluA1-SEP did not significantly change in the presence of APV or without NMDA application (Fig. 5A,B). We noticed that APV by itself decreased the endocytosis frequency of GluA1-SEP in non-PSLM (without APV, 0.089 events/25 μm2/min, N = 19 cells; with APV, 0.038 events/25 μm2/min, N = 18 cells; t(31) = −2.65, p = 0.013, Student's t test). Together, the transient enhancement and the following suppression of GluA1-SEP endocytosis could not explain the slowly developing NMDA-induced decrease in the cell-surface amount of GluA1-SEP (Fig. 2D).
Figure 5.
Changes of endocytosis frequency of GluA1-SEP after NMDA application in control conditions. A, Frequencies of GluA1-SEP endocytosis in the presence of APV before and after NMDA application. N = 18 cells. B, Frequencies of GluA1-SEP endocytosis without NMDA application. N = 19 cells. C, Scheme of TP application experiments. TP application was conducted 4 times each (purple lines) in 3 periods (squares, 1 min before to the onset of NMDA application, just after the onset of NMDA application to 1 min after, 14–15 min after the onset of NMDA application). D, Top 2 lines, GluA1-SEP Images recorded at Points 1–4 in respective periods without (Points 1, 3) or with (Points 2, 4) TP. Bottom, Difference images of GluA1-SEP (green, image recorded at Point 2 was subtracted from that at Point 4), presented with PSD95-RFPt signal (magenta). E, The normalized events numbers of GluA1-SEP signal increase/25 μm2/min detected between Point 2 and Point 4 in the 3 periods. In 14–15 min after NMDA application, events numbers were apparently smaller than those before, although significant differences were not detected in both PSLM (p = 0.10, N = 10, Steel's test) and non-PSLM (p = 0.64). We note that only endocytosis events detected with a 30 s interval recording were counted, Thus, events numbers should have been underestimated.
The rapid pH exchange methods have been repeatedly used in the analyses on endocytosis since the study by Merrifield et al. (2005). Previous studies (Jullié et al., 2014; Rosendale et al., 2017) reported that application of TP also quenched SEP signal and showed qualitatively similar results to those obtained by a pH exchange method, suggesting that side effects of low pH are limited. In the present study, we took every care to minimize low pH effects, such as use of mild low pH solution (not 5.5 but 6.0) and short duration of the low-pH-solution application (300 ms every 4 s). In addition, we have performed experiments to examine effects of NMDA application on GluA1-SEP endocytosis using TP. They showed qualitatively similar tendency to those obtained using the pH exchange method as shown in Figure 5C–E, although significant differences were not detected. Effects of TP were not completely reversible as that of low pH. Thus, only a limited number of application was possible and prebleaching of intra-ER GluA1-SEP in the presence of TP could not be performed, which prevented rigorous examination.
GluA1-SEP exocytosis changes during LTD
Taking into account that the number of cell-surface AMPAR are controlled by the balance of endocytosis and exocytosis together with the results above, we hypothesized that exocytosis might dynamically change in response to NMDA application. To test this idea, we examined effects of NMDA on GluA1-SEP exocytosis (Fig. 6). In PSLM, the exocytosis frequency of GluA1-SEP transiently increased after the onset of NMDA application (Fig. 6B,C; Movie 2). On the other hand, in non-PSLM NMDA, application gradually decreased the exocytosis frequency, which reached a steady level in several minutes (Fig. 6C). This exocytosis suppression should contribute to the gradual decrease of cell-surface amount of GluA1-SEP in non-PSLM (Fig. 2D) and also to that in PSLM through lateral diffusion of AMPAR from PSLM (Derkach et al., 2007; Chen et al., 2015).
Figure 6.
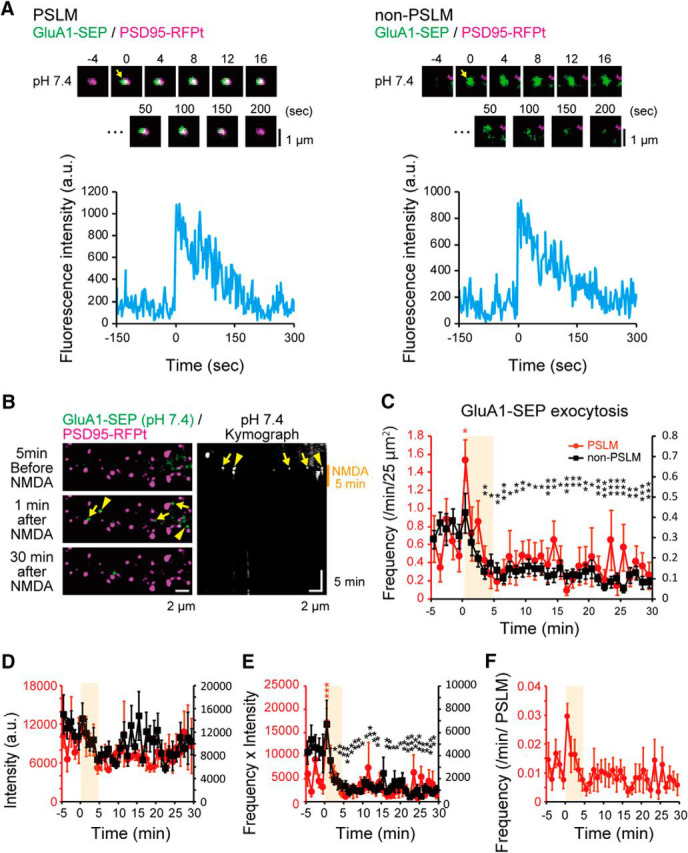
Changes of exocytosis of GluA1-SEP after NMDA application. A, Representative images and time courses of GluA1-SEP signal intensity before and after exocytosis in both PSLM and non-PSLM. B, Images of GluA1-SEP signals before and 1 min and 30 min after NMDA application, and kymograph of GluA1-SEP signals at pH 7.4. C, Exocytosis frequencies of GluA1-SEP in PSLM (red, left ordinate) and in non-PSLM (black, right ordinate) before and after NMDA application (orange box). N = 24 cells. D, The intensity of GluA1-SEP signal in each exocytosis in PSLM and non-PSLM before and after NMDA application. E, The intensity × frequency of GluA1-SEP exocytosis in PSLM and non-PSLM before and after NMDA application. F, Frequency of GluA1-SEP exocytosis per PSLM. *p < 0.05, **p < 0.01, ***p < 0.001, compared with the mean value before NMDA application (from −5 to 0 min), Dunnett's test.
Transient increase of GluA1-SEP exocytosis after NMDA application. GluA1-SEP exocytosis (green) after NMDA application in PSLM (magenta, arrows). Movie runs 60 times faster than the real time.
We also examined whether the amount of GluA1-SEP in individual exocytosis changed during LTD by analyzing the signal intensity of SEP-GluA1 in each event (Fig. 6D). The signal intensity did not change significantly by NMDA application, and the intensity × frequency value change was qualitatively similar to that of frequency change (Fig. 6C,E). The exocytosis frequency per PSLM also showed qualitatively similar tendency to that per area (Fig. 6C,F). Thus, in the following analysis, we mainly analyzed the frequency of exocytosis events per minute and 25 μm2.
In the presence of APV or without NMDA application, the exocytosis frequency of GluA1-SEP did not change significantly (Fig. 7A,B). However, we noticed a tendency that GluA1-SEP exocytosis frequency decreased without NMDA application (Fig. 7B), which was presumably caused by photo-bleaching of SEP. Considering this photo-bleaching effect, the frequency of GluA1-SEP might have recovered to some extent during the recording. The exocytosis frequency of GluA1-SEP after NMDA application in non-PSLM was significantly lower than that without application in 3 to 30 min (NMDA, 0.12 ± 0.02 events/25 μm2/min, N = 24 cells; no treatment, 0.24 ± 0.05, N = 21 cells; t(35) = −3.67, p = 0.0008, Welch's t test) (Figs. 6C, 7B). We also noticed that APV by itself decreased the exocytosis frequency of GluA1-SEP in non-PSLM (−5 to 0 min, without APV, 0.34 ± 0.05 events/25 μm2/min, N = 24 cells; with APV, 0.19 ± 0.02, N = 23 cells; t(31) = 2.97, p = 0.006, Welch's t test) (Figs. 6C, 7A), which is line with a previous study reporting suppression of AMPAR exocytosis in the presence of APV, TTX, and an AMPAR antagonist CNQX (Araki et al., 2010).
Figure 7.
Changes of exocytosis frequency of GluA1-SEP after NMDA application in control conditions. A, Frequencies of GluA1-SEP exocytosis in the presence of APV before and after NMDA application. N = 23 cells. B, Frequencies of GluA1-SEP exocytosis without NMDA application. N = 21 cells. C, Frequencies of GluA1-SEP exocytosis in the presence of pitstop2 before and after NMDA application. N = 20 cells. No significant difference was detected (Dunnett's test).
Our previous study showed that transient enhancement of GluA1 endocytosis after NMDA application was suppressed by pitstop2 (Fujii et al., 2017), an inhibitor of clathrin-dependent endocytosis. We wondered whether transient enhancement of exocytosis after NMDA application was coupled to endocytosis enhancement, and we examined effects of pitstop2 on exocytosis. Pitstop2 suppressed transient enhancement of exocytosis after NMDA application (Fig. 7C). In the presence of pitstop2, the decrease of exocytosis frequency was less clear than that without pitstop2 (Figs. 6C, 7C), partly because pitstop2 increased the background signal. However, in the presence of pitstop2, the exocytosis frequencies in 15 to 20 min (0.11 ± 0.03, p = 0.048, N = 24 cells, Dunnett's test) and in 25 to 30 min (0.11 ± 0.02, p = 0.04) were significantly lower than that before NMDA application (−5 to 0 min, 0.25 ± 0.06).
Exocytosis and endocytosis changes at 34°C
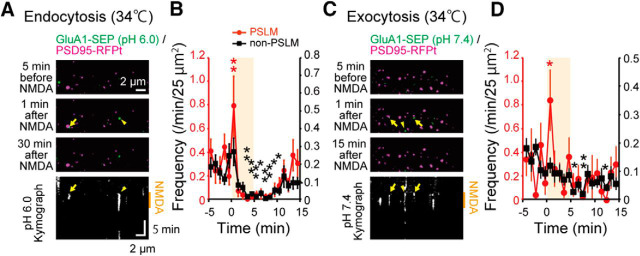
Next, we examined whether transient enhancement of endocytosis and exocytosis after NMDA application and their later suppression occurred at near physiological temperature. We obtained qualitatively similar time courses of frequency changes of endocytosis and exocytosis at 34°C (Fig. 8). Transient enhancement of GluA1-SEP endocytosis and exocytosis in PSLM and later suppression of endocytosis and exocytosis in non-PSLM were observed. However, SEP fluorescence was weaker and photo-bleached faster at 34°C than at room temperature, which made long recording and rigorous examination at near physiological temperature difficult.
Figure 8.
Endocytosis and exocytosis recording at 34°C. A, Images of GluA1-SEP (green) and PSD95-RFPt (magenta) before and 1 min and 10 min after NMDA application, and kymograph of GluA1-SEP signals at pH 6.0. B, Frequencies of GluA1-SEP endocytosis in PSLM (red, left ordinate) and non-PSLM (black, right ordinate) before and after NMDA application (orange box). N = 15 cells. C, Images of GluA1-SEP and PSD95-RFPt before and 1 min and 10 min after NMDA application, and kymograph of GluA1-SEP signals at pH 7.4. D, Frequencies of GluA1-SEP exocytosis in PSLM and non-PSLM before and after NMDA application. N = 20 cells. *p < 0.05, **p < 0.01, Dunnett's test.
Exocytosis and endocytosis changes of GluA1-SEP at conventional synapses
We attempted to confirm that our results on exocytosis and endocytosis changes of GluA1-SEP around PSLM during NMDA-induced LTD is applicable to those at normal synapses in a usual culture preparation on the NRX-uncoated glass using oblique illumination (Fig. 9A). Primarily because of the increased background signals, it was more difficult to qualitatively evaluate changes of endocytosis and exocytosis induced by NMDA application in a conventional culture preparation. However, transient enhancement of endocytosis and exocytosis at synapses immediately after NMDA application and following suppression of both endocytosis and exocytosis in extrasynaptic areas were observed (Fig. 9B–E), suggesting that the results obtained around PSLM are applicable to normal postsynaptic membrane.
GluA2-SEP changes after NMDA application
Our previous study on changes of cell-surface amount and exocytosis frequency of AMPAR subunit during LTP found that GluA1 and GluA2 show different changes during the LTP expression (Tanaka and Hirano, 2012). We examined how the surface amount and endocytosis and exocytosis of GluA2-SEP changed after NMDA application. NMDA application decreased the surface amount of GluA2 in both PSLM and non-PSLM, although the decrease was more prominent in PSLM (Fig. 10A,B). We also noticed that GluA2-SEP on the cell surface showed recovery of the signal intensity after 10 min, which was different from GluA1-SEP.
Figure 10.
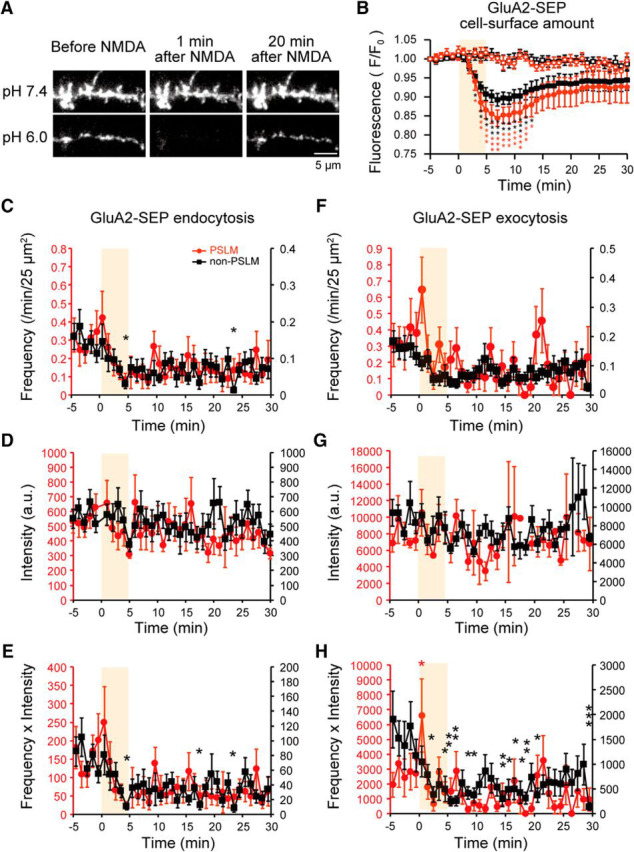
Changes in the cell-surface amount and frequencies of endocytosis and exocytosis of GluA2-SEP after NMDA application. A, Representative images of GluA2-SEP at pH 7.4 and 6.0 before and after NMDA application. B, The estimated cell-surface amount of GluA1-SEP in PSLM (red) and non-PSLM (black) before and after NMDA application (orange box) without (filled symbols, N = 13 cells) or with (open symbols, N = 7 cells) APV. C, Frequencies of GluA2-SEP endocytosis in PSLM and non-PSLM before and after NMDA application. N = 16 cells. D, The intensity of GluA1-SEP signal intensity in each endocytosis in PSLM and non-PSLM before and after NMDA application. E, The intensity × frequency of GluA1-SEP endocytosis in PSLM and non-PSLM before and after NMDA application. F, Exocytosis frequencies of GluA2-SEP in PSLM and in non-PSLM before and after NMDA application. N = 27 cells. G, The intensity of GluA2-SEP signal in each exocytosis in PSLM and non-PSLM before and after NMDA application. H, The intensity × frequency of GluA2-SEP exocytosis in PSLM and non-PSLM before and after NMDA application. *p < 0.05, **p < 0.01, ***p < 0.001, compared with the mean value before NMDA application (−5 to 0 min), Dunnett's test.
The transient enhancement of both exocytosis and endocytosis of GluA2-SEP was not significant, except for the transient increase of exocytosis frequency × intensity value in PSLM (Fig. 10C–H). The decrease of GluA2-SEP exocytosis and endocytosis frequencies were less clear than GluA1-SEP, although the exocytosis frequency × intensity value showed the decrease in several points between 4 and 20 min in non-PSLM (Fig. 10H). Together, GluA2-SEP showed changes different from GluA1-SEP after NMDA application, indicating distinct regulation of AMPAR subtypes during LTD.
Exocytosis and endocytosis changes of TfR-SEP after NMDA application
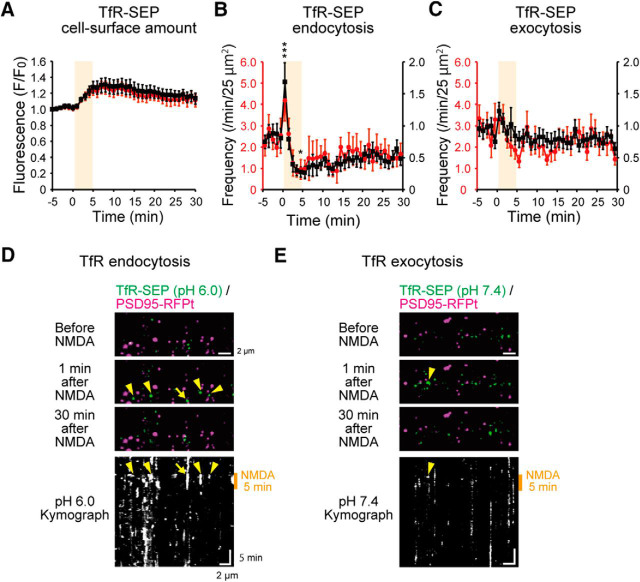
Next, we addressed whether NMDA-induced exocytosis and endocytosis changes were general phenomena applicable to other cell-surface proteins. Thus, we examined the effects of NMDA application on trafficking of TfR, which is constitutively internalized through clathrin-mediated endocytosis and has been widely used in studies on endocytosis together with transferrin (Park et al., 2006; Kennedy et al., 2010; Rosendale et al., 2017) (Fig. 11). Interestingly, NMDA application increased the cell-surface amount of SEP-tagged TfR (TfR-SEP), in clear contrast to the decrease in that of GluA1-SEP (Figs. 2D, 11A) (non-PSLM, −5 to 0 min, 1.02 ± 0.02; 5 to 10 min, 1.29 ± 0.09; t(17) = 3.23, p = 0.005; PSLM, −5 to 0 min, 1.01 ± 0.01; 5 to 10 min, 1.25 ± 0.07; t(17) = 3.07, p = 0.007, Student's t test, N = 18 cells).
Figure 11.
Changes of cell-surface amount and endocytosis and exocytosis frequencies of TfR-SEP after NMDA application. A, Cell-surface amount of TfR-SEP in PSLM (red) and non-PSLM (black). N = 18 cells. B, Frequency of TfR-SEP endocytosis. N = 18 cells. This graph includes some data partly presented in a previous report (Fujii et al., 2017, their Fig. 3D). C, Frequency of TfR-SEP exocytosis. N = 18 cells. *p < 0.05, ***p < 0.001, compared with the mean value before NMDA application (from −5 to 0 min), Dunnett's test. D, Images and kymograph of TfR-SEP before and after NMDA application at pH 6.0. E, Images and kymograph of TfR-SEP before and after NMDA application at pH 7.4.
NMDA application transiently enhanced TfR-SEP endocytosis in non-PSLM and then suppressed it, as endocytosis of GluA1-SEP (Fig. 11B,D). However, TfR-SEP endocytosis frequency gradually recovered after NMDA application, which was different from that of GluA1-SEP. On the other hand, TfR-SEP exocytosis frequency tended to increase transiently in non-PSLM after NMDA application (−5 to 0 min, 100 ± 9.7%; 1 min, 139.6 ± 15.1%; t(34) = −2.2, p = 0.036, Student's t test, N = 18 cells) but returned to a basal level quickly (Fig. 11C,E). These results demonstrate that regulation of exocytosis and endocytosis of TfR is distinct from that of GluA1.
Effects of NMDA application on postsynaptic scaffold protein
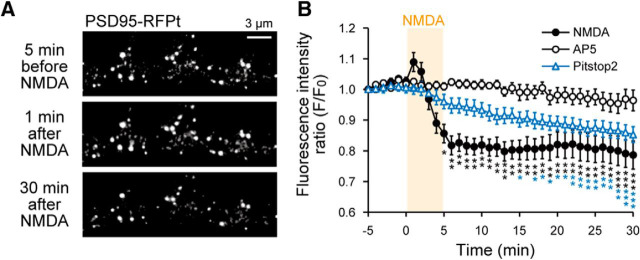
Postsynaptic scaffolding proteins play important roles in retention and regulation of postsynaptic proteins, including AMPAR. Hence, we examined whether NMDA application had some effects on a main postsynaptic scaffold protein PSD95. We found that NMDA application transiently increased (−5 to 0 min, 100 ± 0.8%; 1 min, 107 ± 3.1%; t(13) = −2.89, p = 0.013, Student's t test, N = 14 cells) and then decreased the intensity and size of PSD95-RFPt signal in PSLM (Fig. 12A,B). The decrease of PSD95-RFPt signal induced by NMDA application was suppressed by APV (Fig. 12B). The decrease of PSD95 amount might contribute to LTD by decreasing the number of AMPAR binding slots provided by postsynaptic PSD95 (Derkach et al., 2007; Opazo et al., 2012; Chen et al., 2015). We also found that pitstop2 suppressed the transient increase of PSD95 after NMDA application (Fig. 12B), suggesting that endocytosis is somewhat coupled to PSD95 regulation. In the presence of pitstop2, PSD95-RFPt signal slowly decreased.
Figure 12.
Effects of NMDA application on PSD95-RFPt. A, Representative images of PSD95-RFPt before and after NMDA application. B, The time courses of PSD95-RFPt signal intensity without (filled circles, N = 14 cells) or with (open circles, N = 12 cells) APV or pitstop2 (blue triangles, N = 19 cells). Data are mean ± SEM in 1 min bins. *p < 0.05, **p < 0.01, ***p < 0.001, compared with the mean value before NMDA application (from −5 to 0 min), Dunnett's test.
Discussion
Here, we quantified changes of cell-surface AMPAR amount during LTD. NMDA application caused intracellular acidification and quenched GluA1-SEP signal in the ER lumen. To isolate the cell-surface SEP signal from intra-ER signal, we adopted a rapid pH change method using the U-tube. By subtracting the intra-ER GluA1-SEP fluorescence signal recorded at pH 6.0 from the whole signal recorded at pH 7.4, we precisely demonstrated the time course of cell-surface GluA1-SEP amount during LTD expression. The number of GluA1-SEP on the cell surface slowly decreased after NMDA application.
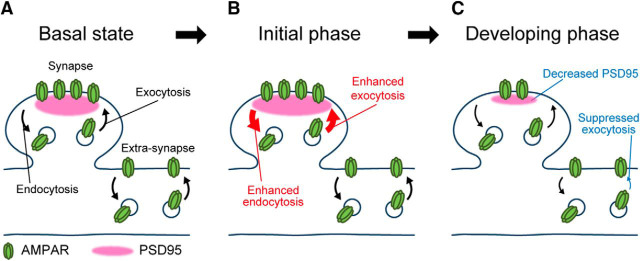
Next, we examined respective changes of exocytosis and endocytosis presumably underlying the gradual decrease in the cell-surface amount of GluA1-SEP during LTD. In contrast to an idea that LTD is caused by enhanced endocytosis of surface AMPAR (Malinow and Malenka, 2002; Collingridge et al., 2010), GluA1-SEP endocytosis was only transiently enhanced around PSLM and then suppressed. Transient enhancement of individual AMPAR endocytosis events after NMDA application were reported recently (Fujii et al., 2017; Rosendale et al., 2017). In parallel to the endocytic dynamics, exocytosis of GluA1-SEP was also transiently enhanced around PSLM after NMDA application and was suppressed after that. Interestingly, the transient enhancement of exocytosis was coupled to the clathrin-dependent endocytosis transiently enhanced after NMDA application because the former was also suppressed by pitstop2. The decreasing time course of cell-surface amount of GluA1-SEP was similar to that of the GluA1-SEP exocytosis frequency and the frequency × intensity value. Thus, we considered that the reduction of exocytosis should contribute to the gradual decrease in cell-surface amount of AMPAR during the NMDA-induced LTD (Fig. 13). In the later plateau phase of LTD (∼10 min), the suppression of AMPAR endocytosis might have counterbalanced the suppression of exocytosis to maintain a sustained low level of cell-surface AMPAR. Thus, our data suggest an essential contribution of suppression of AMPAR exocytosis to the hippocampal LTD expression (Fig. 13). We should note that our analyses on endocytosis and exocytosis were semiquantitative or qualitative for the following reasons. First, SEP signal gradually decreased with time by photo-bleaching. Thus, data recoded in later periods in an experiment might have been somewhat underestimated. Small exocytosis and endocytosis events might not have been analyzed because of signal noises. The distance between non-PSLM membrane and the bottom glass-surface was not constant, and most non-PSLM membrane might have been outside of TIRFM visualization zone. Thus, data on non-PSLM could not be directly compared with data on PSLM.
Figure 13.
Schematic presentation of exocytosis and endocytosis of GluA1-containing AMPAR during LTD. A, In a basal condition, AMPAR traffics through exocytosis, clathrin- and dynamin-independent endocytosis, and lateral diffusion. B, Soon after NMDA application (∼1 min), clathrin- and dynamin-dependent endocytosis occurs together with enhanced exocytosis around the postsynaptic membrane. C, In the slowly decreasing phase (2–5 min) of cell-surface AMPAR, the exocytosis is suppressed. Endocytosis is also suppressed slightly, and the amount of PSD95 is decreased. Arrow sizes reflect relative frequencies of exocytosis and endocytosis.
Previous studies suggested an important contribution of clathrin-dependent endocytosis to the LTD induction (Beattie et al., 2000; Lee et al., 2002; Malinow and Malenka, 2002; Collingridge et al., 2010). In line with those studies, we previously reported the transient enhancement of clathrin-dependent GluA1-SEP endocytosis soon after NMDA application (Fujii et al., 2017). However, we here found that this transient endocytosis enhancement occurred together with the exocytosis augmentation. As a result, the cell-surface amount of GluA1-SEP did not change significantly at the onset of NMDA application (∼1 min). In the following period (∼2 min), both the endocytosis and exocytosis were suppressed. Thus, we think that enhanced endocytosis of GluA1-SEP by itself is insufficient to explain the slowly developing decrease in the cell-surface amount of GluA1-SEP during LTD. Rather, stronger suppression of exocytosis than endocytosis of GluA1-SEP is likely to contribute to the decrease, although we do not negate a critical role of clathrin-dependent endocytosis of AMPAR in the LTD induction. AMPAR-endocytosed clathrin-dependently might be preferentially sent to lysosomes rather than recycling endosomes, which might decrease the total amount of intracellular AMPAR that could be exocytosed in the following period (Fernández-Monreal et al., 2012). Clathrin-dependent endocytosis might be coupled to various cellular events, including exocytosis regulation and maintenance of postsynaptic scaffold, because pitstop2 suppressed transient enhancement of GluA1-SEP exocytosis and PSD95 increase after NMDA application. The molecular mechanisms of these couplings are interesting questions to be addressed in the future.
There is another intriguing possibility for a role of clathrin-dependent AMPAR endocytosis. Transiently enhanced exocytosis and endocytosis of AMPAR after NMDA application might change AMPAR subtypes at the postsynaptic membrane, which influences intracellular signaling processes regulating LTD. It is known that GluA1/2 and GluA2/3 hetero-tetramers are main AMPAR in hippocampal neurons (Dingledine et al., 1999), and insertion of GluA1 homo-tetramer, which is Ca2+-permeable, to the postsynaptic membrane takes place in the early phase of LTP or LTD (Plant et al., 2006; Lu et al., 2007; Sanderson et al., 2016). Therefore, transient enhancement of exocytosis and endocytosis of GluA1-SEP in PSLM soon after NMDA application might contribute to replacement of GluA2-containing AMPAR to GluA2-deficient AMPAR, such as GluA1 homo-tetramer, possibly affecting Ca2+-dependent intracellular signaling near the postsynaptic membrane. Here, we showed that the time courses of the changes of surface amount and frequencies of endocytosis and exocytosis of GluA2-SEP after NMDA application were different from those of GluA1-SEP. Thus, GluA1-SEP and GluA2-SEP behaved differently during the LTD expression after NMDA application as they did during the LTP expression caused by high-frequency electrical stimulation (Tanaka and Hirano, 2012). How respective types of AMPAR, such as GluA1 homo-tetramer, GluA1/2 hetero-tetramer, and GluA2/3 hetero-tetramer, traffic during different phases of LTD is an important question to be more thoroughly addressed in the future.
PSD95 plays an essential role in the hippocampal LTD expression. A PSD95 knock-out mouse shows-facilitated LTP and deficit in LTD (Migaud et al., 1998). On the other hand, PSD95 overexpression enhances LTD and suppresses LTP (Stein et al., 2003). Interestingly, PSD95 works not only as a slot for holding AMPAR but also as a signaling molecule controlling LTD (Xu et al., 2008). We show here that PSD95 increased at the onset of NMDA application and then decreased after that. It might be possible that the transient PSD95 increase plays a role as a slot for Ca2+-permeable AMPAR, such as GluA1 homomer, and activates molecular signaling cascade inducing LTD (Sanderson et al., 2016). Another possibility is that the increased PSD95 interacts with the LTD-inducing signaling proteins activated by Ca2+ coming through NMDA receptor. In the sustained phase of decreased cell-surface amount of GluA1-SEP, we also found the decrease in PSD95 amount, which should reduce the number of slots for AMPAR in PSLM. Unexpectedly, we found that pitstop2 suppressed the transient increase of PSD95 after NMDA application, and it also slowly decreased PSD95 amount. Clathrin-dependent endocytosis might be involved in the maintenance of PSD structure by some unknown mechanisms.
In this study, effects of NMDA application on GluA1-SEP were compared with those on TfR-SEP. Transferrin transport Fe3+ with TfR. Transferrin conjugated with fluorescent dye or TfR fused with fluorescent protein has been used as a general indicator reporting changes of endocytosis rate in neurons (Park et al., 2006; Kennedy et al., 2010; Rosendale et al., 2017). Here, we found that NMDA application constantly increased the cell-surface amount of TfR-SEP, which was opposite to the effect on that of GluA1-SEP. We also demonstrate that time courses of endocytosis and exocytosis of TfR after NMDA application were different from those of GluA1-SEP. Thus, GluA1 and TfR trafficking seems to be differentially regulated (Zheng et al., 2015), although we noticed some qualitative similarities, such as transient enhancement and following suppression of endocytosis after NMDA application.
In this study, we used PSLM as a model of postsynaptic membrane. PSLM is an artificial structure and might not express all normal postsynaptic function. However, PSLM shows certain critical properties of postsynaptic membrane: clustered distribution of postsynaptic proteins, such as PSD95, homer, and GluA1–3, and dynamic changes of AMPAR during LTP (Tanaka and Hirano, 2012; Tanaka et al., 2014). In addition, here we report that normal synapses in a conventional culture preparation showed qualitatively similar dynamic changes of GluA1-SEP to those observed in PSLM during NMDA-induced LTD. Together, we suggest that PSLM retains important properties related to synaptic plasticity and is useful for the study on dynamics of postsynaptic membrane proteins.
Footnotes
This work was supported by Ministry of Education, Culture, Sports, Science and Technology in Japan Grant 25110717 to T.H. and Grant 15H01556 to H.T., Japan Society for the Promotion of Science Grants 15H04259 and 18H02526 to T.H., Grant 15K18338 to H.T., and Grant 15J02047 to S.F., Takeda Science Foundation to T.H., and Naito and Uehara Memorial Foundations in Japan to H.T.
The authors declare no competing financial interests.
References
- Araki Y, Lin DT, Huganir RL (2010) Plasma membrane insertion of the AMPA receptor GluA2 subunit is regulated by NSF binding and Q/R editing of the ion pore. Proc Natl Acad Sci U S A 107:11080–11085. 10.1073/pnas.1006584107 [DOI] [PMC free article] [PubMed] [Google Scholar]
- Ashby MC, De La Rue SA, Ralph GS, Uney J, Collingridge GL, Henley JM (2004) Removal of AMPA receptors (AMPARs) from synapses is preceded by transient endocytosis of extrasynaptic AMPARs. J Neurosci 24:5172–5176. 10.1523/JNEUROSCI.1042-04.2004 [DOI] [PMC free article] [PubMed] [Google Scholar]
- Axelrod D (2001) Total internal reflection fluorescence microscopy in cell biology. Traffic 2:764–774. 10.1034/j.1600-0854.2001.21104.x [DOI] [PubMed] [Google Scholar]
- Beattie EC, Carroll RC, Yu X, Morishita W, Yasuda H, von Zastrow M, Malenka RC (2000) Regulation of AMPA receptor endocytosis by a signaling mechanism shared with LTD. Nat Neurosci 3:1291–1300. 10.1038/81823 [DOI] [PubMed] [Google Scholar]
- Bretschneider F, Markwardt F (1999) Drug-dependent ion channel gating by application of concentration jumps using U-tube technique. Methods Enzymol 294:180–189. 10.1016/S0076-6879(99)94011-9 [DOI] [PubMed] [Google Scholar]
- Chen X, Levy JM, Hou A, Winters C, Azzam R, Sousa AA, Leapman RD, Nicoll RA, Reese TS (2015) PSD-95 family MAGUKs are essential for anchoring AMPA and NMDA receptor complexes at the postsynaptic density. Proc Natl Acad Sci U S A 112:E6983–E6992. 10.1073/pnas.1517045112 [DOI] [PMC free article] [PubMed] [Google Scholar]
- Collingridge GL, Peineau S, Howland JG, Wang YT (2010) Long-term depression in the CNS. Nat Rev Neurosci 11:459–473. 10.1038/nrn2867 [DOI] [PubMed] [Google Scholar]
- Derkach VA, Oh MC, Guire ES, Soderling TR (2007) Regulatory mechanisms of AMPA receptors in synaptic plasticity. Nat Rev Neurosci 8:101–113. 10.1038/nrn2055 [DOI] [PubMed] [Google Scholar]
- Dingledine R, Borges K, Bowie D, Traynelis SF (1999) The glutamate receptor ion channels. Pharmacol Rev 51:7–61. [PubMed] [Google Scholar]
- Fernández-Monreal M, Brown TC, Royo M, Esteban JA (2012) The balance between receptor recycling and trafficking toward lysosomes determines synaptic strength during long-term depression. J Neurosci 32:13200–13205. 10.1523/JNEUROSCI.0061-12.2012 [DOI] [PMC free article] [PubMed] [Google Scholar]
- Fujii S, Tanaka H, Hirano T (2017) Detection and characterization of individual endocytosis of AMPA-type glutamate receptor around postsynaptic membrane. Gene Cells 22:583–590. 10.1111/gtc.12493 [DOI] [PubMed] [Google Scholar]
- Huganir RL, Nicoll RA (2013) AMPARs and synaptic plasticity: the last 25 years. Neuron 80:704–717. 10.1016/j.neuron.2013.10.025 [DOI] [PMC free article] [PubMed] [Google Scholar]
- Jullié D, Choquet D, Perrais D (2014) Recycling endosomes undergo rapid closure of a fusion pore on exocytosis in neuronal dendrites. J Neurosci 34:11106–11118. 10.1523/JNEUROSCI.0799-14.2014 [DOI] [PMC free article] [PubMed] [Google Scholar]
- Kauer JA, Malenka RC (2007) Synaptic plasticity and addiction. Nat Rev Neurosci 8:844–858. 10.1038/nrn2234 [DOI] [PubMed] [Google Scholar]
- Kennedy MJ, Ehlers MD (2006) Organelles and trafficking machinery for postsynaptic plasticity. Annu Rev Neurosci 29:325–362. 10.1146/annurev.neuro.29.051605.112808 [DOI] [PMC free article] [PubMed] [Google Scholar]
- Kennedy MJ, Davison IG, Robinson CG, Ehlers MD (2010) Syntaxin-4 defines a domain for activity-dependent exocytosis in dendritic spines. Cell 141:524–535. 10.1016/j.cell.2010.02.042 [DOI] [PMC free article] [PubMed] [Google Scholar]
- Lee HK, Kameyama K, Huganir RL, Bear MF (1998) NMDA induces long-term synaptic depression and dephosphorylation of the GluR1 subunit of AMPA receptors in hippocampus. Neuron 21:1151–1162. 10.1016/S0896-6273(00)80632-7 [DOI] [PubMed] [Google Scholar]
- Lee SH, Liu L, Wang YT, Sheng M (2002) Clathrin adaptor AP2 and NSF interact with overlapping sites of GluR2 and play distinct roles in AMPA receptor trafficking and hippocampal LTD. Neuron 36:661–674. 10.1016/S0896-6273(02)01024-3 [DOI] [PubMed] [Google Scholar]
- Lin DT, Huganir RL (2007) PICK1 and phosphorylation of the glutamate receptor 2 (GluR2) AMPA receptor subunit regulates GluR2 recycling after NMDA receptor-induced internalization. J Neurosci 27:13903–13908. 10.1523/JNEUROSCI.1750-07.2007 [DOI] [PMC free article] [PubMed] [Google Scholar]
- Lu Y, Allen M, Halt AR, Weisenhaus M, Dallapiazza RF, Hall DD, Usachev YM, McKnight GS, Hell JW (2007) Age-dependent requirement of AKAP150-anchored PKA and GluR2-lacking AMPA receptors in LTP. EMBO J 26:4879–4890. 10.1038/sj.emboj.7601884 [DOI] [PMC free article] [PubMed] [Google Scholar]
- Malinow R, Malenka RC (2002) AMPA receptor trafficking and synaptic plasticity. Annu Rev Neurosci 25:103–126. 10.1146/annurev.neuro.25.112701.142758 [DOI] [PubMed] [Google Scholar]
- Merrifield CJ, Perrais D, Zenisek D (2005) Coupling between clathrin-coated-pit invagination, cortactin recruitment, and membrane scission observed in live cells. Cell 121:593–606. 10.1016/j.cell.2005.03.015 [DOI] [PubMed] [Google Scholar]
- Migaud M, Charlesworth P, Dempster M, Webster LC, Watabe AM, Makhinson M, He Y, Ramsay MF, Morris RG, Morrison JH, O'Dell TJ, Grant SG (1998) Enhanced long-term potentiation and impaired learning in mice with mutant postsynaptic density-95 protein. Nature 396:433–439. 10.1038/24790 [DOI] [PubMed] [Google Scholar]
- Munro S, Pelham HR (1987) A C-terminal signal prevents secretion of luminal ER proteins. Cell 48:899–907. 10.1016/0092-8674(87)90086-9 [DOI] [PubMed] [Google Scholar]
- Opazo P, Sainlos M, Choquet D (2012) Regulation of AMPA receptor surface diffusion by PSD-95 slots. Curr Opin Neurobiol 22:453–460. 10.1016/j.conb.2011.10.010 [DOI] [PubMed] [Google Scholar]
- Park M, Salgado JM, Ostroff L, Helton TD, Robinson CG, Harris KM, Ehlers MD (2006) Plasticity-induced growth of dendritic spines by exocytic trafficking from recycling endosomes. Neuron 52:817–830. 10.1016/j.neuron.2006.09.040 [DOI] [PMC free article] [PubMed] [Google Scholar]
- Paroutis P, Touret N, Grinstein S (2004) The pH of the secretory pathway: measurement, determinants, and regulation. Physiology (Bethesda) 19:207–215. 10.1152/physiol.00005.2004 [DOI] [PubMed] [Google Scholar]
- Plant K, Pelkey KA, Bortolotto ZA, Morita D, Terashima A, McBain CJ, Collingridge GL, Isaac JT (2006) Transient incorporation of native GluR2-lacking AMPA receptors during hippocampal long-term potentiation. Nat Neurosci 9:602–604. 10.1038/nn1678 [DOI] [PubMed] [Google Scholar]
- Rathje M, Fang H, Bachman JL, Anggono V, Gether U, Huganir RL, Madsen KL (2013) AMPA receptor pHluorin-GluA2 reports NMDA receptor-induced intracellular acidification in hippocampal neurons. Proc Natl Acad Sci U S A 110:14426–14431. 10.1073/pnas.1312982110 [DOI] [PMC free article] [PubMed] [Google Scholar]
- Rosendale M, Jullié D, Choquet D, Perrais D (2017) Spatial and temporal regulation of receptor endocytosis in neuronal dendrites revealed by imaging of single vesicle formation. Cell Rep 18:1840–1847. 10.1016/j.celrep.2017.01.081 [DOI] [PubMed] [Google Scholar]
- Sanderson JL, Gorski JA, Dell'Acqua ML (2016) NMDA receptor-dependent LTD requires transient synaptic incorporation of Ca2+-permeable AMPARs mediated by AKAP150-anchored PKA and calcineurin. Neuron 89:1000–1015. 10.1016/j.neuron.2016.01.043 [DOI] [PMC free article] [PubMed] [Google Scholar]
- Shi SH, Hayashi Y, Petralia RS, Zaman SH, Wenthold RJ, Svoboda K, Malinow R (1999) Rapid spine delivery and redistribution of AMPA receptors after synaptic NMDA receptor activation. Science 284:1811–1816. 10.1126/science.284.5421.1811 [DOI] [PubMed] [Google Scholar]
- Stein V, House DR, Bredt DS, Nicoll RA (2003) Postsynaptic density-95 mimics and occludes hippocampal long-term potentiation and enhances long-term depression. J Neurosci 23:5503–5506. 10.1523/JNEUROSCI.23-13-05503.2003 [DOI] [PMC free article] [PubMed] [Google Scholar]
- Tanaka H, Hirano T (2012) Visualization of subunit-specific delivery of glutamate receptors to postsynaptic membrane during hippocampal long-term potentiation. Cell Rep 1:291–298. 10.1016/j.celrep.2012.02.004 [DOI] [PubMed] [Google Scholar]
- Tanaka H, Fujii S, Hirano T (2014) Live-cell imaging of receptors around postsynaptic membranes. Nat Protoc 9:76–89. 10.1038/nprot.2013.171 [DOI] [PubMed] [Google Scholar]
- Wang C, Fu G, Wang J, Wang G, Cheng Y, Xu ZZ (2008) Direct visualization of the dynamics of membrane-anchor proteins in living cells. J Microsc 229:67–77. 10.1111/j.1365-2818.2007.01865.x [DOI] [PubMed] [Google Scholar]
- Xu W, Schlüter OM, Steiner P, Czervionke BL, Sabatini B, Malenka RC (2008) Molecular dissociation of the role of PSD-95 in regulating synaptic strength and LTD. Neuron 57:248–262. 10.1016/j.neuron.2007.11.027 [DOI] [PMC free article] [PubMed] [Google Scholar]
- Zheng N, Jeyifous O, Munro C, Montgomery JM, Green WN (2015) Synaptic activity regulates AMPA receptor trafficking through different recycling pathways. Elife 4:260–267. 10.7554/eLife.06878 [DOI] [PMC free article] [PubMed] [Google Scholar]
Associated Data
This section collects any data citations, data availability statements, or supplementary materials included in this article.
Supplementary Materials
Transient increase of GluA1-SEP endocytosis after NMDA application. GluA1-SEP endocytosis (green) after NMDA application in PSLM (magenta, arrows) and in non-PSLM (arrowhead) at pH 6.0. Movie runs 60 times faster than the real time.
Transient increase of GluA1-SEP exocytosis after NMDA application. GluA1-SEP exocytosis (green) after NMDA application in PSLM (magenta, arrows). Movie runs 60 times faster than the real time.


