
FIGURE 4.
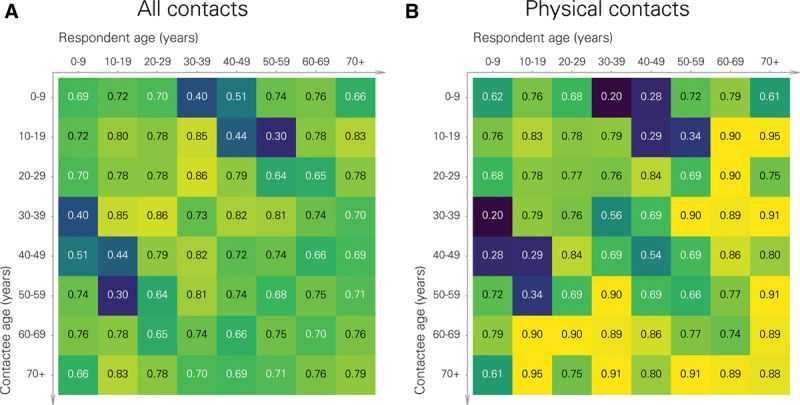
Relative reductions in the mean numbers of daily contacts (during vs. before social distancing) between the eight 10-year age classes. A, all types of contacts; B, physical contacts. The respondent’s age class (years) is on the top row. The rows correspond to the contactees’ age classes (years). The numbers are posterior expectations.