

Abstract
Background
Prior studies have suggested aortic peak wall stress (PWS) and peak wall rupture index (PWRI) can estimate the rupture risk of an abdominal aortic aneurysm (AAA), but whether these measurements have independent predictive ability over assessing AAA diameter alone is unclear. The aim of this systematic review was to compare PWS and PWRI in participants with ruptured and asymptomatic intact AAAs of similar diameter.
Methods and Results
Web of Science, Scopus, Medline, and The Cochrane Library were systematically searched to identify studies assessing PWS and PWRI in ruptured and asymptomatic intact AAAs of similar diameter. Random‐effects meta‐analyses were performed using inverse variance‐weighted methods. Leave‐one‐out sensitivity analyses were conducted to assess the robustness of findings. Risk of bias was assessed using a modification of the Newcastle‐Ottawa scale and standard quality assessment criteria for evaluating primary research papers. Seven case‐control studies involving 309 participants were included. Meta‐analyses suggested that PWRI (standardized mean difference, 0.42; 95% CI, 0.14–0.70; P=0.004) but not PWS (standardized mean difference, 0.13; 95% CI, −0.18 to 0.44; P=0.418) was greater in ruptured than intact AAAs. Sensitivity analyses suggested that the findings were not dependent on the inclusion of any single study. The included studies were assessed to have a medium to high risk of bias.
Conclusions
Based on limited evidence, this study suggested that PWRI, but not PWS, is greater in ruptured than asymptomatic intact AAAs of similar maximum aortic diameter.
Keywords: abdominal aortic aneurysm, biomechanics, computed tomography, finite element analysis, imaging, meta‐analysis, systematic review
Subject Categories: Aneurysm, Angiography, Computerized Tomography (CT), Imaging, Vascular Disease
Nonstandard Abbreviations and Acronyms
- FEA
finite element analysis
- PWRI
peak wall rupture index
- PWS
peak wall stress
- SMD
standardized mean differences
Clinical Perspective
What Is New?
Prior studies have suggested that aortic peak wall stress and peak wall rupture index can predict abdominal aortic aneurysm rupture. However, the value of measuring peak wall stress and peak wall rupture index over simply measuring maximum abdominal aortic aneurysm diameter is unclear.
This systematic review and meta‐analysis suggests that peak wall rupture index, but not peak wall stress, is greater in ruptured than asymptomatic intact abdominal aortic aneurysms of similar diameter.
What Are the Clinical Implications?
The measurement of peak wall rupture index may add to that of maximum aortic diameter in assessing the risk of abdominal aortic aneurysm rupture.
Abdominal aortic aneurysm (AAA) rupture is estimated to be responsible for 200 000 deaths annually worldwide. 1 , 2 AAA rupture is thought to occur when the hemodynamic forces exceed the aortic wall strength. 1 , 3 In clinical practice, maximum AAA diameter is the main measure used to estimate rupture risk and select patients for elective repair. 1 Current guidelines recommend elective repair of asymptomatic large AAAs (maximum aortic diameter ≥50 mm in women and ≥55 mm in men). 1 , 4 , 5 Approximately 1% to 2% of small asymptomatic AAAs rupture each year 4 and some large AAAs remain stable during a patient's lifetime, 6 suggesting that diameter is an imperfect measure of rupture risk.
Biomechanical imaging may provide a more precise means to estimate AAA rupture risk and select patients for repair. Finite element analysis (FEA) can noninvasively estimate the maximum tensile stress within the AAA wall (peak wall stress; PWS) and the maximum ratio between wall stress and the estimated local wall strength (peak wall rupture index; PWRI). 3 Semiautomated systems have been developed to enable clinicians without engineering backgrounds to perform FEA using computed tomography (CT) scans that are routinely performed to assess people with AAA (Figure 1). 3 , 7 Thus, it would be feasible to use PWS and/or PWRI in clinical practice if these measures were shown to be independent predictors of AAA rupture. Currently, however, the value of measuring PWS and PWRI over simply measuring maximum AAA diameter is unclear.
Figure 1. Examples of 3‐dimensional segmentation produced using finite element analysis from computed tomography images of patients with AAA.
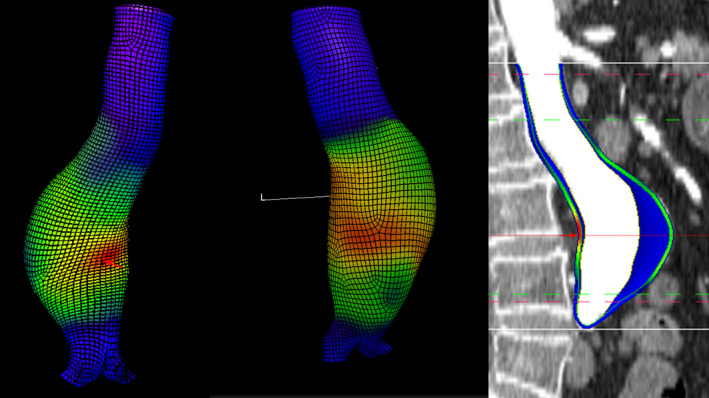
The red areas indicate areas of high aortic wall stress. AAA indicates abdominal aortic aneurysm.
Previous meta‐analyses 3 , 8 have suggested that PWS is greater in patients with ruptured than intact AAAs; however, the generalizability of this finding is unclear owing to a number of limitations. These included lack of adjustment or matching for aortic diameter, 3 inclusion of symptomatic AAAs mixed with ruptured AAAs, 8 and small sample sizes. 9 These limitations have been addressed in more recent studies that have been reported after the publication of the most recent meta‐analysis, 7 , 8 suggesting that higher quality data are now available for an updated meta‐analysis. Furthermore, PWRI has been suggested by one, 10 but not another study, 11 to be a superior measure of rupture risk than PWS. No meta‐analysis comparing PWRI in ruptured and intact AAA has been reported. 3 , 8 The aim of this systematic review and meta‐analysis was to provide an up‐to‐date pooled analysis of prior studies that compared PWS and PWRI in patients with ruptured and asymptomatic intact AAA of similar diameter.
Methods
Literature Search and Inclusion Criteria
The data that support the findings of this study are available from the corresponding author upon reasonable request. This systematic review and meta‐analysis was performed according to the Preferred Reporting Items for Systematic Reviews and Meta‐Analyses statement. 12 A study protocol for this systematic review was designed (Data S1) and was not preregistered with any database. A literature search was performed using the following databases: Web of Science (via Institute for Scientific Information Web of Knowledge; 1965), Scopus (1966), Medline (via OvidSP, 1966), and The Cochrane Library to identify case‐control studies investigating PWS in patients with ruptured and diameter matched asymptomatic intact AAAs. The following search terms were applied: “peak wall stress” OR “peak wall rupture index” OR “rupture potential index” AND “abdominal aortic aneurysm.” The search was performed in October 2020 without language restrictions by one author (T.P.S.). Reference lists of primary articles and reviews were searched to increase the yield of relevant publications. Titles and abstracts were screened to identify relevant studies. If the suitability of an article was uncertain, the full text was reviewed. For inclusion in the meta‐analysis studies needed to have compared PWS or PWRI in asymptomatic intact AAAs and ruptured AAAs of similar diameter (within 3 mm mean difference between groups). Studies in which it was not possible to separate symptomatic from ruptured AAAs were excluded.
Data Extraction and Risk of Bias of the Included Studies
Data were extracted from included studies independently by 3 authors (T.S., J.M., and J.G.). The following data were collected: sample sizes for the ruptured and intact AAA group; study design; software used to perform FEA, PWS, and PWRI estimates; AAA diameter; risk factors (including age, sex, smoking history, hypertension, diabetes mellitus, ischemic heart disease; stroke; chronic obstructive pulmonary disease); and systolic blood pressure. If relevant data were not reported in the publication, the corresponding author was contacted for this information. The risk of bias was assessed independently by 3 authors (T.S., J.M., and J.G.). A quality assessment tool was designed to assess the risk of bias of the included studies adapted from 2 previously reported tools (Newcastle‐Ottawa scale and Standard Quality Assessment Criteria for Evaluating Primary Research Papers). 13 , 14 A number of additional aspects of the included studies relevant to this systematic review were also assessed including criteria used to define AAA rupture, method used to estimate PWS and PWRI and reproducibility reported, use of a standardized blood pressure in PWS and PWRI calculations (ie, use of a single blood pressure measurement for all participants or omission of blood pressure in calculations), inclusion of CT scan before or after rupture (for ruptured cases), matching for AAA diameter between asymptomatic intact and ruptured cases, and matching for other confounding variables. The overall risk of bias assessed within each study was assessed as low, medium, or high based on predefined criteria. Details regarding the quality assessment criteria can be found in Table S1.
Statistical Analysis
Meta‐analysis was performed using inverse variance‐weighted methods 15 in order to calculate standardized mean differences (SMD) with 95% (CI. PWS outcome data were converted from newton per square centimeter (N/cm2) to kilopascal (kPa) where required. 16 Because of anticipated interstudy heterogeneity in methods and biomechanical analyses, SMDs were calculated using random‐effects models. 17 Interstudy heterogeneity was assessed using the I2 index and values <25%, between 25% to 75%, and >75% were considered to represent low, moderate, and high heterogeneity, respectively. 18 If PWS and PWRI were computed at a standardized blood pressure (ie, same blood pressure for all participants) this value was used in the meta‐analysis. One study calculated PWS and PWRI using a standardized blood pressure of 140/80 mm Hg for the main analysis and sensitivity analyses were performed using a lower (120/70 mm Hg) and higher (160/90 mm Hg) blood pressure. 7 For that study, results from the main analysis were used in the meta‐analysis. If studies did not use a standardized blood pressure, PWS and PWRI values computed with patient‐specific blood pressures were used. 11 , 19 , 20 In one study the SD of PWS was not reported and this was derived from the SE using Review Manager version 5.4 (The Cochrane Collaboration) as previously described. 3 , 17 To identify sources of heterogeneity a leave‐one‐out‐sensitivity analysis was performed by excluding individual studies one at a time and recalculating the pooled estimates for the remaining studies. Publication bias was assessed by funnel plots comparing the summary estimate of each study to its precision (1/SE) for outcomes that were reported in ≥5 studies. 21 Analyses were conducted using Stata version 16.1 (StataCorp LP, College Station, TX). All statistical tests were 2‐sided and a P value of <0.05 was considered significant.
Results
Study Identification
The initial database searches identified 836 studies after removal of duplicates. After title and abstract screening, the full texts of 20 studies were assessed against the inclusion criteria. Thirteen articles were excluded after full text review. Common reasons for exclusion included mismatch in AAA diameter between ruptured and intact AAAs, 22 inclusion of symptomatic but not ruptured AAAs 22 , 23 , 24 and lack of comparison of PWS or PWRI between ruptured and intact AAAs. 25 Ultimately 7 studies were included (Figure 2).
Figure 2. PRISMA diagram describing the literature search.
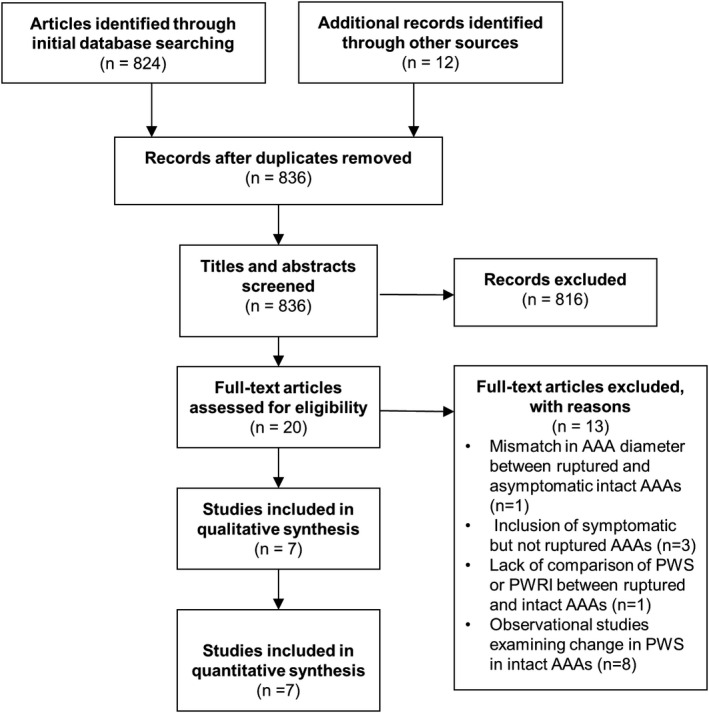
AAA indicates abdominal aortic aneurysm; PRISMA, Preferred Reporting Items for Systematic Reviews and Meta‐Analyses; PWRI, peak wall rupture index; and PWS, peak wall stress.
Study Characteristics
A total of 309 participants with ruptured (n=139) and asymptomatic intact (n=170) AAAs of similar aortic diameter were investigated in the 7 included studies. 7 , 10 , 11 , 16 , 19 , 20 , 26 All studies were of case‐control design and sample sizes ranged between 14 and 75 (see Table 1). 7 , 10 , 11 , 16 , 19 , 20 , 26 Three studies were performed in Sweden 10 , 19 , 26 and the remaining studies were conducted in Australia, 7 Spain, 11 Czechia, 20 and The Netherlands. 16 Six studies used the A4 Clinics 5.0 (VASCOPS GmbH, Graz, Austria) platform 7 , 10 , 11 , 19 , 20 , 26 and 1 study used ABAQUS v.6.5 (Hibbit, Karlsson and Sorensen, Inc, Pawtucket, RI) for FEA. 16 One study used a combination of the A4 Clinics 5.0 and the ANSYS (Ansys Inc.) platforms. 20 The inclusion criteria varied between studies. In 4 studies AAA cases were included only if the available CT scan satisfied specific imaging criteria, 7 , 11 , 19 , 26 whereas other studies did not report this as a requirement for inclusion. 10 , 16 , 20 The imaging criteria used to select CT scans differed between studies. One study specifically reported excluding patients with juxtarenal or thoracoabdominal aneurysms and patients with ruptured AAAs that had massive contrast extravasation. 7 Another study included only participants with CT scans in which the aorta was visible from the renal arteries to the iliac bifurcation and the lumen was distinguishable from intraluminal thrombus. 11 One study required CT scans to have a sufficiently high out‐of‐plane image resolution with good visibility of the exterior aneurysm surface. 26 In another study, only participants with good quality CT scans were included; however, the criteria used to determine this were not reported. 19 All studies either matched cases and controls for aortic diameter or included cases and controls with similar mean aortic diameter (within 3 mm difference; see Tables 1 and 2). Three studies used a standardized blood pressure to compute PWS or PWRI in all participants, 7 or matched cases and controls for blood pressures, 26 or omitted blood pressure from calculations. 10 The remaining studies used patient‐specific blood pressures although the relationship between their measurement and the timing of CT scan varied across studies (Table 1). For ruptured AAA cases, blood pressure readings before rupture were frequently used. 11 , 16 , 26 For participants with asymptomatic intact AAAs, measurements were either taken from the same hospital visit 26 in which the CT scan was performed or from a prior visit. 11 , 16 The timing of blood pressure measurements in relation to CT scans were not reported in 2 studies. 19 , 20 Three studies reported the reproducibility of their FEA estimates (Table 1). 7 , 19 , 20
Table 1.
Characteristics of Case Control Studies Comparing PWS and PWRI Between Ruptured and Asymptomatic Intact AAAs of Similar Aortic Diameter
| Study | Total Sample Size | Sample Size (Asymptomatic Intact: Ruptured)* | Biomechanical Measurements | Software Used | Variables That Were Balanced Between Asymptomatic iAAA and rAAAs | Blood Pressure Used in PWS or PWRI Analysis | Reproducibility of Biomechanical Measurements |
|---|---|---|---|---|---|---|---|
| Singh et al (2020) 7 | 75 | 75 (50:25) | PWS, PWRI | A4 Clinics 5.0 (VASCOPS GmbH, Graz, Austria). | Diameter and blood pressure | Standardized blood pressure (140/80 mm Hg) used and sensitivity analysis with lower and higher blood pressures (120/70 mm Hg and 160/90 mm Hg) for all participants | Intraobserver reproducibility; CV 2.7% and 4.7% for PWS in iAAA and rAAAs respectively |
| Siika et al (2019) 10 | 283 | 60 (40:20) | PWS, PWRI | A4 Clinics 5.0 (VASCOPS GmbH, Graz, Austria) | Diameter, sex, age and blood pressure | Blood pressure omitted from analyses | NR |
| Siika et al (2018) 19 | 90 | 43 (15:28) | PWS, PWRI | A4 Clinics 5.0 (VASCOPS GmbH, Graz, Austria) | Diameter | Patient‐specific blood pressure; timing of blood pressure measurement in relation to CT scan not reported | Intraobserver reproducibility; Mean % difference of 6.86±6.46 and 7.70±6.26 for PWS and PWRI respectively. Interobserver reproducibility; mean % difference 7.09±6.16 and 9.47±8.18 † |
| Leemans et al (2018) 11 | 175 | 62 (31:31) | PWS, PWRI, rupture risk equivalent diameter | A4 Clinics 5.0 (VASCOPS GmbH, Graz, Austria). | Diameter | Patient‐specific blood pressure obtained from the last measurement in a noncritical setting within 1 year before presentation | NR |
| Polzer et al (2015) 20 | 14 | 14 (7:7) | PWRI and probabilistic rupture risk index | A4 Clinics 5.0 (VASCOPS GmbH, Graz, Austria) and ANSYS (Ansys Inc.) | Diameter | Patient‐specific blood pressure; timing of blood pressure measurement not reported | Intraobserver reproducibility; CV <5.5% for PWS and PWRI in participants with iAAAs. Interobserver reproducibility; intraclass correlation coefficient 0.98 (range 0.97–0.99) for PWS and PWRI † |
| Gasser et al (2010) 26 | 50 | 35 (17:18) | PWS, PWRI | A4 Clinics 5.0 (VASCOPS GmbH, Graz, Austria) | Diameter and blood pressure | Participants were matched for blood pressure between groups. Blood pressure measurements obtained in the same admission in which CT scan was performed or earlier hospital or healthcare center visit (for ruptured cases) | NR |
| Truijers et al (2007) 16 | 30 | 20 (10:10) | PWS | ABAQUS v.6.5 (Hibbit, Karlsson and Sorensen, Inc, Pawtucket, RI) | Diameter and blood pressure | Patient‐specific blood pressure obtained from a year before CT scan; Sensitivity analysis also performed in which a standardized blood pressure (120 mm Hg systolic) was used | NR |
AAA indicates abdominal aortic aneurysm; CT, computed tomography; CV, coefficient of variation; iAAA, asymptomatic intact AAA; NR, not reported; PWRI, peak wall rupture index; PWS, peak wall stress; and rAAA, ruptured AAA.
Sample sizes reported are reflective of the cases and control that were similar in AAA diameter and excluded symptomatic AAA cases.
Reported in an external publication.
Table 2.
Clinical Characteristics of Participants With Ruptured and Asymptomatic Intact AAAs of Similar Aortic Diameter
| Study | Group | Number | Age, y | Male | Diabetes Mellitus | Ischemic Heart Disease | Stroke | Chronic Obstructive Pulmonary Disease | Smoking | Systolic Blood Pressure (mm Hg) |
|---|---|---|---|---|---|---|---|---|---|---|
| Singh et al (2020) 7 | iAAA | 50 | 72±7 | 94 | 18 | 52 | 10 | 24 | 94 | 140* |
| rAAA | 25 | 73±7 | 72 | 13 | 38 | 0 | 13 | 88 | 140* | |
| Siika et al (2019) 10 | iAAA | 40 | 78±7 | 60 | NR | NR | NR | NR | NR | NR † |
| rAAA | 20 | 79±7 | 55 | NR | NR | NR | NR | NR | NR † | |
| Siika et al (2018) 19 | iAAA | 15 | 75±8 | 87 | NR | NR | NR | NR | NR | NR |
| rAAA | 28 | 76±10 | 75 | NR | NR | NR | NR | NR | NR | |
| Leemans et al (2018) 11 | iAAA | 31 | NR | NR | NR | NR | NR | NR | NR | NR |
| rAAA | 31 | NR | NR | NR | NR | NR | NR | NR | NR | |
| Polzer et al (2015) 20 | iAAA | 7 | NR | NR | NR | NR | NR | NR | NR | 132±8 |
| rAAA | 7 | NR | NR | NR | NR | NR | NR | NR | 152±26 | |
| Gasser et al (2010) 26 | iAAA | 17 | 75±8 | 78 | NR | NR | NR | NR | NR | NR ‡ |
| rAAA | 18 | 76±11 | 78 | NR | NR | NR | NR | NR | NR ‡ | |
| Truijers et al (2007) 16 | iAAA | 10 | 72±2 | 90 | 10 | 70 | 20 | 30 | 40 | 120* |
| rAAA | 10 | 70±2 | 70 | 10 | 30 | 20 | 20 | 40 | 120* |
Values are expressed as mean±SD, median [interquartile range] or n (%). AAA indicates abdominal aortic aneurysm; iAAA, asymptomatic intact AAA; NR, not reported; and rAAA, ruptured AAA.
A standardized blood pressure was used for biomechanical analyses.
Blood pressure was omitted from patient‐specific parameters.
iAAAs and rAAAs were matched for blood pressure.
Participant Characteristics
The participant characteristics are summarized in Table 2. The average age of participants ranged between 70 and 79 years. 7 , 10 , 16 , 19 , 26 There were no significant differences in the average age of participants between asymptomatic intact and ruptured AAA groups in the 3 studies that statistically assessed this. 7 , 10 , 19 The proportions of men in the asymptomatic intact and ruptured groups were 60% to 94% and 55% to 78% respectively. One study included a significantly larger proportion of women in the ruptured AAA group, 7 whereas 2 studies reported no significant differences in sex between groups. 10 , 19 The remaining studies either did not report sex 11 , 20 or did not statistically compare this. 16 , 26 Details regarding diabetes mellitus, ischemic heart disease, stroke, chronic obstructive pulmonary disease, smoking, and blood pressure were reported in only 2 studies (Table 2).
Risk of Bias Assessment
The methodological quality assessment and overall risk of bias of the included studies are reported in Figure 3. Six studies were assessed to have a high risk of bias, 10 , 11 , 16 , 19 , 20 , 26 and 1 study was assessed to have a medium risk of bias. 7 Six studies were of retrospective design, and the design of 1 study was unclear. 20 Only 1 study used an objective definition of AAA rupture, which was defined as the presence of blood in the retroperitoneum or peritoneum identified on CT by a consultant vascular specialist. 7 The method of estimating PWS and PWRI was well described in 3 out of the 7 studies that included the reporting of the reproducibility of the method 7 within the same or a previous publication (see Figure 3). 19 , 20 Only 2 of these studies assessed intra‐ and interobserver reproducibility (see Table 1). 19 , 20 One study assessed the reproducibility of methods in both asymptomatic and ruptured AAAs (coefficients of variation 2.7% and 4.7% for PWS in asymptomatic intact AAA and ruptured AAAs respectively 7 ), whereas in the other 2 studies reproducibility was assessed in asymptomatic intact AAAs only. Six studies matched ruptured and asymptomatic intact AAA cases by AAA diameter, 7 , 10 , 11 , 19 , 20 , 26 whereas in one study participants were not matched; however, the mean diameter between intact and ruptured cases was similar (51±2 versus 53±2 mm respectively). 16 Three studies used a standardized blood pressure to calculate PWS and PWRI whereas the other 3 studies 11 , 19 , 20 used patient‐specific blood pressures. One study matched participants for age and sex 10 in addition to AAA diameter. An a priori sample size calculation was performed in only 1 study. 7
Figure 3. Strengths and weaknesses of studies included in this systematic review.
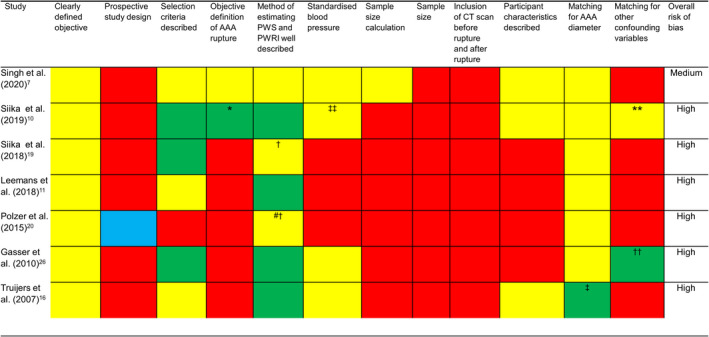
The yellow and red colored cells represent criteria, which were and not met in each study respectively. For the sample size criterion, red colored cells represent studies that had a sample size <100 and yellow‐colored cells represent studies that had sample sizes >100. The green colored cells represent criteria that were partially met in each study. A blue colored cell was used if it was unclear whether a criterion was met by a study. AAA indicates abdominal aortic aneurysm; CT, computed tomography; PWRI, peak wall rupture index; and PWS, peak wall stress. *AAA rupture cases were identified using an International Classification; **cases and controls matched for age and sex; †reproducibility reported in an external publication; ††cases and controls matched for blood pressure; ‡cases and controls were not matched by study design although AAA diameter was similar between groups; ‡‡in this study blood pressure was omitted from biomechanical calculations; #PWS not assessed in this study.
Reported Association of PWS and PWRI With AAA Rupture
The mean aortic diameter of included patients ranged between 51 to 82 mm and 53 to 82 mm in included asymptomatic intact and ruptured AAAs respectively (see Table 3). No significant differences in PWS between groups were reported, although in one study PWS was not assessed 20 and another study did not statistically compare PWS between groups in the matched participants. 26 PWRI was significantly higher in ruptured AAAs than asymptomatic intact AAAs in 2 studies. 10 , 19 PWRI was higher in the remaining studies that assessed this 7 ; however, differences were not statistically significant (see Table 3). 7 , 11
Table 3.
Comparison of PWS and PWRI of Participants With Ruptured and Asymptomatic Intact AAAs of Similar Aortic Diameter
| Study | Group | Number | Diameter (mm) | P Value | PWS (kPa) | P Value | PWRI | P Value |
|---|---|---|---|---|---|---|---|---|
| Singh et al (2020) 7 | iAAA | 50 | 82±14 | 0.906 | 263.8±69.4 | 0.192 | 1.09±0.52 | 0.982 |
| rAAA | 25 | 82±13 | 279.8±90.5 | 1.20±0.76 | ||||
| Siika et al (2019) 10 | iAAA | 40 | 53±5 | 0.319 | 197.0±40.3 | 0.162 | 0.35±0.08 | 0.016 |
| rAAA | 20 | 55±5 | 216.3±45.3 | 0.43±0.11 | ||||
| Siika et al (2018) 19 | iAAA | 15 | 73±11 | 0.674 | 284±53.4* | 0.194 | 0.48±0.11* | <0.001 |
| rAAA | 28 | 74±12 | 249±53.9* | 0.80±0.54* | ||||
| Leemans et al (2018) 11 | iAAA | 31 | 71±15 | 0.81 | 261±89 † | 0.99 | 0.69±0.33 | 0.61 |
| rAAA | 31 | 72±18 | 262±75 † | 0.70±0.27 | ||||
| Polzer et al (2015) 20 | iAAA | 7 | 73±11 | NR | NR | 0.48±0.41 ‡ | NR | |
| rAAA | 7 | 76±14 | NR | 0.69±0.41 ‡ | ||||
| Gasser et al (2010) 26 | iAAA | 17 | 75±12 | NR | 292.0±108.7 | NR | 0.61±0.26 | NR |
| rAAA | 18 | 77±15 | 330.8±114.2 | 0.74±0.29 | ||||
| Truijers et al (2007) 16 | iAAA | 10 | 51±2 | 0.57 | 317±73 † | 0.30 | NR | |
| rAAA | 10 | 53±2 | 367±126 † | NR |
Values are expressed as mean±SD unless indicated otherwise. AAA indicates abdominal aortic aneurysm; iAAA, asymptomatic intact AAA; kPa, kilopascal; NR, not reported; PWRI, peak wall rupture index; PWS, peak wall stress; and rAAA, ruptured AAA.
SDs not available and were imputed from the diameter mismatched analysis reported in the same study.
PWS converted from newton per square centimeter to kPa.
Derived PWRI values reported that have been divided by the mean arterial pressure inflation factor used in the study to obtain comparable results.
Data Synthesis
In the meta‐analysis, PWS was not significantly different between ruptured and asymptomatic AAAs (SMD, 0.13; 95% CI, −0.18 to 0.44; P=0.418; Figure 4). Moderate heterogeneity was observed (I2=40.6%). In contrast, PWRI was significantly higher in participants with ruptured compared with asymptomatic intact AAA (SMD, 0.42; 95% CI, 0.14–0.70, P=0.004; Figure 5). Interstudy heterogeneity was low (I2=25.5%). Leave‐one‐out sensitivity analysis suggested that the results of the meta‐analyses were not dependent on the inclusion of any single study (Figures S1 and S2). The funnel plot for PWRI appeared asymmetrical (Figure S3) suggesting potential publication bias.
Figure 4. Differences in peak wall stress in ruptured and asymptomatic intact AAAs.
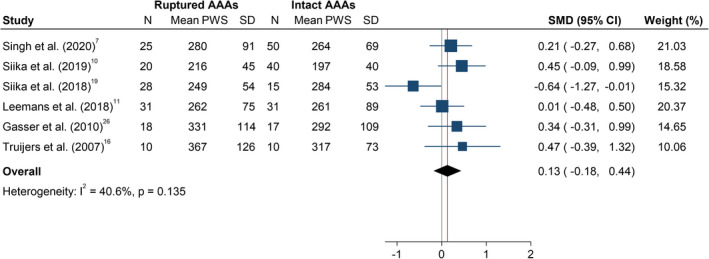
The SMD is the mean difference between both groups, standardized to 1 SD difference in PWS (kilopascal) within that study. The summary SMD is estimated from inverse variance‐weighted meta‐analysis. Box areas are inversely proportional to the variance of the SMD and horizontal lines illustrate 95%CIs. AAA indicates abdominal aortic aneurysm; PWS, peak wall stress; and SMD, standardized mean difference.
Figure 5. Differences in peak wall rupture index in ruptured and asymptomatic intact AAAs.
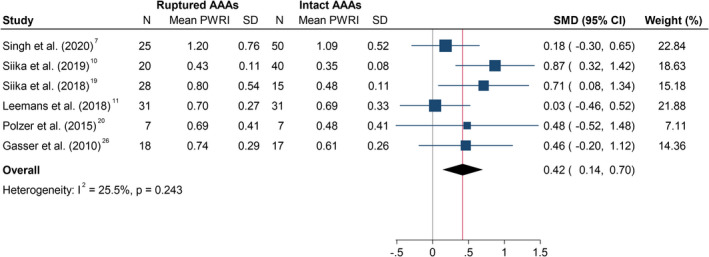
The SMD is the mean difference between both groups, standardized to 1 SD difference in PWRI within that study. The summary SMD is estimated from inverse variance‐weighted meta‐analysis. Box areas are inversely proportional to the variance of the SMD and horizontal lines illustrate 95% CIs. AAA indicates abdominal aortic aneurysm; CT, computed tomography; PWRI, peak wall rupture index; and SMD, standardized mean difference.
Discussion
This meta‐analysis suggested that PWRI, but not PWS, is greater in ruptured than asymptomatic intact AAAs of similar diameter. This finding is in contrast with a previous meta‐analysis that reported greater PWS in ruptured than intact AAAs. 3 A major limitation of the previous meta‐analysis was the mismatch in aortic diameter between groups and inclusion of symptomatic patients in the ruptured group. Participants with symptomatic intact AAAs were not included in the current study as their risk of rupture is uncertain. 5 , 9
Maximum aortic diameter is currently the most established measure of AAA rupture risk. 1 , 5 , 27 There are, however, a number of limitations in using aortic diameter in clinical practice, in particular the measurement error, which may be greater than the annual change in diameter. 28 , 29 Additional methods of estimating rupture risk and determining management may therefore be valuable. The findings of this study suggest that measurement of PWRI may add to aortic diameter in assessing the risk of AAA rupture. There are, however, many limitations of this technology that need to be addressed. There is currently no standardized approach to conducting FEA. There was substantial variation in the approach used to incorporate blood pressures in the calculation of PWS and PWRI in the included studies. Some studies used an arbitrary blood pressure for all participants, whereas others used patient‐specific blood pressures. It is currently unclear which approach is most appropriate. Additionally, wall thickness and strength have an important effect on the risk of aortic rupture and prior investigations have suggested that increased aortic wall thickness is associated with reduced aortic wall stress. 26 , 30 Currently there is no accurate and feasible method to estimate wall thickness from imaging. 7 Six of the 7 studies used FEA software to estimate PWRI using the same formula that was derived from prior tensile testing of human AAA wall specimens ex vivo, but this may not be representative of the situation in individual patients in vivo. 30 Aortic calcification has previously been suggested to have an important influence on biomechanical forces but there remains no standardized method of including this in estimations of wall stress. 31 , 32
Although the current meta‐analysis suggested that PWRI is likely to be higher in ruptured AAAs compared with asymptomatic intact AAAs of similar diameter, the confidence in this finding is lessened as the included studies were assessed to have either a medium or high risk of bias because of a number of design limitations. First, studies included participants with CT scans performed after rupture and it is likely that the biomechanical forces before rupture were different. Second, some studies used patient‐specific blood pressures to perform biomechanical analyses rather than a standardized blood pressure. 11 , 19 , 20 This may have contributed to heterogeneity and led to under‐ or overestimation of PWS and PWRI. Although patients with asymptomatic intact and ruptured AAAs had similar aortic diameter, other characteristics were generally poorly reported and confounding owing to an unmeasured factor cannot be ruled out. Additionally, the CT scans of ruptured AAA cases were required to meet certain inclusion criteria in some studies and selection bias cannot be excluded. 7 , 11 , 19 , 26 We were unsuccessful in contacting the corresponding author of 2 studies 10 , 19 to clarify whether there was an overlap in participants included in these investigations. Nevertheless, the leave‐one‐sensitivity analysis suggested that the findings of the PWRI meta‐analysis was not materially altered with individual omission of either of these studies. 10 , 19 Lastly the relevance of the findings of this meta‐analysis to small AAAs is limited as 5 studies included only patients with large AAAs 7 , 11 , 19 , 20 , 26 (mean±SD aortic diameter [mm] ranged between 71±15 and 82±14 for the asymptomatic intact AAAs; 72±18 and 82±13 for the ruptured AAAs). Furthermore, this meta‐analysis compared PWS and PWRI in individuals with asymptomatic intact and ruptured AAAs but did not examine the predictive ability of these biomechanical measures for AAA rupture. Investigating this would require a large observational study; however, owing to the low rupture rate of small AAAs and the high repair rate of large AAAs, such a study maybe infeasible to perform.
Conclusions
In conclusion the results of this study suggest that PWRI is greater in ruptured than asymptomatic intact AAAs of similar diameter. The findings suggest the potential value of biomechanical measures in estimating AAA rupture risk accepting the medium to high risk of bias of the included studies.
Sources of Funding
The Townsville Hospital and Health Services Study, Education and Research Trust Fund and The Queensland Government supported this work. Jonathan Golledge holds a Practitioner Fellowship from the National Health and Medical Research Council (1117061) and a Senior Clinical Research Fellowship from the Queensland Government, Australia. Joseph V. Moxon holds an Advance Queensland Mid‐Career fellowship from the Queensland Government. Singh holds a Junior Doctor Research Fellowship from the Queensland Government.
Disclosures
T. Christian Gasser is a scientific advisor for VASCOPS GmbH. The remaining authors have no disclosures to report.
Supporting information
Data S1
Table S1
Figures S1–S3
(J Am Heart Assoc. 2021;10:e019772. DOI: 10.1161/JAHA.120.019772.)
Supplementary Material for this article is available at https://www.ahajournals.org/doi/suppl/10.1161/JAHA.120.019772
For Sources of Funding and Disclosures, see page 10.
References
- 1. Golledge J. Abdominal aortic aneurysm: update on pathogenesis and medical treatments. Nat Rev Cardiol. 2019;16:225–242. DOI: 10.1038/s41569-018-0114-9. [DOI] [PubMed] [Google Scholar]
- 2. Sampson UK, Norman PE, Fowkes FGR, Aboyans V, Song Y, Harrell FE Jr, Forouzanfar MH, Naghavi M, Denenberg JO, McDermott MM. Global and regional burden of aortic dissection and aneurysms: mortality trends in 21 world regions, 1990 to 2010. Glob Heart. 2014;9:171–180.e110. DOI: 10.1016/j.gheart.2013.12.010. [DOI] [PubMed] [Google Scholar]
- 3. Khosla S, Morris D, Moxon J, Walker PJ, Gasser T, Golledge J. Meta‐analysis of peak wall stress in ruptured, symptomatic and intact abdominal aortic aneurysms. Br J Surg. 2014;101:1350–1357. DOI: 10.1002/bjs.9578. [DOI] [PubMed] [Google Scholar]
- 4. The UK Small Aneurysm Trial Participants . Mortality results for randomised controlled trial of early elective surgery or ultrasonographic surveillance for small abdominal aortic aneurysms. Lancet. 1998;352:1649–1655. [PubMed] [Google Scholar]
- 5. Wanhainen A, Verzini F, Van Herzeele I, Allaire E, Bown M, Cohnert T, Dick F, van Herwaarden J, Karkos C, Koelemay M, et al. Editor's choice–European Society for Vascular Surgery (ESVS) 2019 clinical practice guidelines on the management of abdominal aorto‐iliac artery aneurysms. Eur J Vasc Endovasc Surg. 2019;57:8–93. DOI: 10.1016/j.ejvs.2018.09.020. [DOI] [PubMed] [Google Scholar]
- 6. Cao P, De Rango P, Verzini F, Parlani G, Romano L, Cieri E; Group CT . Comparison of surveillance versus aortic endografting for small aneurysm repair (CAESAR): results from a randomised trial. Eur J Vasc Endovasc Surg. 2011;41:13–25. DOI: 10.1016/j.ejvs.2010.08.026. [DOI] [PubMed] [Google Scholar]
- 7. Singh TPMJ, Iyer V, Gasser T, Jenkins J, Golledge J. Comparison of peak wall stress and peak wall rupture index in ruptured and asymptomatic intact abdominal aortic aneurysms (accepted). Br J Surg. 2020. Sep 30. [epub ahead of print]. DOI: 10.1002/bjs.11995. [DOI] [PubMed] [Google Scholar]
- 8. Leemans EL, Willems TP, van der Laan MJ, Slump CH, Zeebregts CJ. Biomechanical indices for rupture risk estimation in abdominal aortic aneurysms. J Endovasc Ther. 2017;24:254–261. DOI: 10.1177/1526602816680088. [DOI] [PubMed] [Google Scholar]
- 9. Indrakusuma R, Jalalzadeh H, Planken R, Marquering H, Legemate D, Koelemay M, Balm R. Biomechanical imaging markers as predictors of abdominal aortic aneurysm growth or rupture: a systematic review. Eur J Vasc Endovasc Surg. 2016;52:475–486. DOI: 10.1016/j.ejvs.2016.07.003. [DOI] [PubMed] [Google Scholar]
- 10. Siika A, Lindquist Liljeqvist M, Zommorodi S, Nilsson O, Andersson P, Gasser TC, Roy J, Hultgren R. A large proportion of patients with small ruptured abdominal aortic aneurysms are women and have chronic obstructive pulmonary disease. PLoS One. 2019;14:e0216558. DOI: 10.1371/journal.pone.0216558. [DOI] [PMC free article] [PubMed] [Google Scholar]
- 11. Leemans EL, Willems TP, Slump CH, van der Laan MJ, Zeebregts CJ. Additional value of biomechanical indices based on cta for rupture risk assessment of abdominal aortic aneurysms. PLoS One. 2018;13:e0202672. DOI: 10.1371/journal.pone.0202672. [DOI] [PMC free article] [PubMed] [Google Scholar]
- 12. Moher D, Liberati A, Tetzlaff J, Altman DG; Group P . Preferred reporting items for systematic reviews and meta‐analyses: the PRISMA statement. PLoS Med. 2009;6:e1000097. DOI: 10.1371/journal.pmed.1000097. [DOI] [PMC free article] [PubMed] [Google Scholar]
- 13. Kmet LM, Cook LS, Lee RC. Standard Quality Assessment Criteria for Evaluating Primary Research Papers From a Variety of Fields. Canada: Alberta Heritage Foundation for Medical Research Edmonton; 2004. Available at: https://www.ihe.ca/advanced‐search/standard‐quality‐assessment‐criteria‐for‐evaluating‐primary‐research‐papers‐from‐a‐variety‐of‐fields. Accessed September 10, 2020. [Google Scholar]
- 14. Stang A. Critical evaluation of the Newcastle‐Ottawa scale for the assessment of the quality of nonrandomized studies in meta‐analyses. Eur J Epidemiol. 2010;25:603–605. DOI: 10.1007/s10654-010-9491-z. [DOI] [PubMed] [Google Scholar]
- 15. Mantel N, Haenszel W. Statistical aspects of the analysis of data from retrospective studies of disease. J Natl Cancer Inst. 1959;22:719–748. [PubMed] [Google Scholar]
- 16. Truijers M, Pol J, Schultzekool L, Van Sterkenburg S, Fillinger M, Blankensteijn J. Wall stress analysis in small asymptomatic, symptomatic and ruptured abdominal aortic aneurysms. Eur J Vasc Endovasc Surg. 2007;33:401–407. DOI: 10.1016/j.ejvs.2006.10.009. [DOI] [PubMed] [Google Scholar]
- 17. Higgins JP, Thomas J, Chandler J, Cumpston M, Li T, Page MJ, Welch VA. Cochrane Handbook for Systematic Reviews of Interventions. Chichester: John Wiley & Sons; 2019. [DOI] [PMC free article] [PubMed] [Google Scholar]
- 18. Higgins JP, Thompson SG. Quantifying heterogeneity in a meta‐analysis. Stat Med. 2002;21:1539–1558. DOI: 10.1002/sim.1186. [DOI] [PubMed] [Google Scholar]
- 19. Siika A, Lindquist Liljeqvist M, Hultgren R, Gasser TC, Roy J. Aortic lumen area is increased in ruptured abdominal aortic aneurysms and correlates to biomechanical rupture risk. J Endovasc Ther. 2018;25:750–756. DOI: 10.1177/1526602818808292. [DOI] [PubMed] [Google Scholar]
- 20. Polzer S, Gasser TC. Biomechanical rupture risk assessment of abdominal aortic aneurysms based on a novel probabilistic rupture risk index. J R Soc Interface. 2015;12:20150852. DOI: 10.1098/rsif.2015.0852. [DOI] [PMC free article] [PubMed] [Google Scholar]
- 21. Sterne JA, Gavaghan D, Egger M. Publication and related bias in meta‐analysis: power of statistical tests and prevalence in the literature. J Clin Epidemiol. 2000;53:1119–1129. DOI: 10.1016/S0895-4356(00)00242-0. [DOI] [PubMed] [Google Scholar]
- 22. Fillinger MF, Raghavan ML, Marra SP, Cronenwett JL, Kennedy FE. In vivo analysis of mechanical wall stress and abdominal aortic aneurysm rupture risk. J Vasc Surg. 2002;36:589–597. DOI: 10.1067/mva.2002.125478. [DOI] [PubMed] [Google Scholar]
- 23. Soto B, Vila L, Dilme J, Escudero J‐R, Bellmunt S, Camacho M. Finite element analysis in symptomatic and asymptomatic abdominal aortic aneurysms for aortic disease risk stratification. Int Angiol. 2018;37:479–485. DOI: 10.23736/S0392-9590.18.03994-9. [DOI] [PubMed] [Google Scholar]
- 24. Soto B, Vila L, Dilmé JF, Escudero JR, Bellmunt S, Camacho M. Increased peak wall stress, but not maximum diameter, is associated with symptomatic abdominal aortic aneurysm. Eur J Vasc Endovasc Surg. 2017;54:706–711. DOI: 10.1016/j.ejvs.2017.09.010. [DOI] [PubMed] [Google Scholar]
- 25. Stevens RR, Grytsan A, Biasetti J, Roy J, Lindquist Liljeqvist M, Gasser TC. Biomechanical changes during abdominal aortic aneurysm growth. PLoS One. 2017;12:e0187421. DOI: 10.1371/journal.pone.0187421. [DOI] [PMC free article] [PubMed] [Google Scholar]
- 26. Gasser TC, Auer M, Labruto F, Swedenborg J, Roy J. Biomechanical rupture risk assessment of abdominal aortic aneurysms: model complexity versus predictability of finite element simulations. Eur J Vasc Endovasc Surg. 2010;40:176–185. DOI: 10.1016/j.ejvs.2010.04.003. [DOI] [PubMed] [Google Scholar]
- 27. Brady AR, Thompson SG, Fowkes FGR, Greenhalgh RM, Powell JT. Abdominal aortic aneurysm expansion: risk factors and time intervals for surveillance. Circulation. 2004;110:16–21. DOI: 10.1161/01.CIR.0000133279.07468.9F. [DOI] [PubMed] [Google Scholar]
- 28. Lederle FA, Wilson SE, Johnson GR, Reinke DB, Littooy FN, Acher CW, Messina LM, Ballard DJ, Ansel HJ; Center CSPC . Variability in measurement of abdominal aortic aneurysms. J Vasc Surg. 1995;21:945–952. DOI: 10.1016/S0741-5214(95)70222-9. [DOI] [PubMed] [Google Scholar]
- 29. Golledge J, Norman PE, Murphy MP, Dalman RL. Challenges and opportunities in limiting abdominal aortic aneurysm growth. J Vasc Surg. 2017;65:225–233. DOI: 10.1016/j.jvs.2016.08.003. [DOI] [PubMed] [Google Scholar]
- 30. Raghavan M, Vorp DA. Toward a biomechanical tool to evaluate rupture potential of abdominal aortic aneurysm: identification of a finite strain constitutive model and evaluation of its applicability. J Biomech. 2000;33:475–482. DOI: 10.1016/S0021-9290(99)00201-8. [DOI] [PubMed] [Google Scholar]
- 31. Parr A, Mclaughlin S, Mclaughlin M, Mchir JG. Aortic calcification and abdominal aortic aneurysm expansion. Atherosclerosis. 2009;202:350. DOI: 10.1016/j.atherosclerosis.2008.05.017. [DOI] [PMC free article] [PubMed] [Google Scholar]
- 32. Doyle BJ, Bappoo N, Syed MBJ, Forsythe RO, Powell JT, Conlisk N, Hoskins PR, McBride OMB, Shah ASV, Norman PE, et al. Biomechanical assessment predicts aneurysm related events in patients with abdominal aortic aneurysm. Eur J Vasc Endovasc Surg. 2020;60:365–373. DOI: 10.1016/j.ejvs.2020.02.023. [DOI] [PubMed] [Google Scholar]
Associated Data
This section collects any data citations, data availability statements, or supplementary materials included in this article.
Supplementary Materials
Data S1
Table S1
Figures S1–S3