

SUMMARY
Axon degeneration is a central pathological feature of many neurodegenerative diseases. SARM1 is an NAD+-cleaving enzyme whose activation triggers axon destruction. Loss of the biosynthetic enzyme NMNAT2, which converts nicotinamide mononucleotide (NMN) to NAD+, activates SARM1 via an unknown mechanism. Using structural, biochemical, biophysical, and cellular assays, we demonstrate that SARM1 is activated by an increase in the ratio of NMN to NAD+, and show that both metabolites compete for binding to the auto-inhibitory N-terminal ARM domain of SARM1. We report structures of the SARM1 ARM domain bound to NMN and of the homo-octameric SARM1 complex in the absence of ligands. We show that NMN influences the structure of SARM1 and demonstrate via mutagenesis that NMN binding is required for injury-induced SARM1 activation and axon destruction. Hence, SARM1 is a metabolic sensor responding to an increased NMN/NAD+ ratio by cleaving residual NAD+, thereby inducing feed-forward metabolic catastrophe and axonal demise.
Keywords: NADase, TIR domain, ARM domain, allostery, cryo-EM, X-ray crystallography, nicotinamide riboside
eTOC Blurb
Figley et al. demonstrate that SARM1, an inducible pro-degenerative NADase, is a metabolic sensor activated by an increase in the NMN/NAD+ ratio. The authors provide structural and functional insights into SARM1 regulation, which expands our understanding of SARM1 as a druggable target, with implications for a wide-range of neurodegenerative diseases.
INTRODUCTION
Pathological axon degeneration is an early and common feature of many neurodegenerative diseases. SARM1 (sterile alpha and Toll/interleukin-1 receptor motif-containing 1) is the major pro-degenerative protein in axons (Coleman et al., 2020; Figley et al., 2020), with loss of SARM1 protecting axons after traumatic injury and in several neurodegenerative disease conditions, including neuropathies, traumatic brain injury, and glaucoma (Geisler et al., 2016; Gerdts et al., 2013; Henninger et al., 2016; Ko et al., 2020; Marion et al., 2019; Maynard et al., 2020; Osterloh et al., 2012; Turkiew et al., 2017; Ziogas et al., 2018). SARM1 is the founding member of a family of TIR (Toll/interleukin-1 receptor)-domain nicotinamide adenine dinucleotide (NAD+)-cleaving enzymes (Essuman et al., 2017; Essuman et al., 2018; Horsefield et al., 2019; Wan et al., 2019), and activation of SARM1 induces the enzymatic destruction of NAD+ and subsequent axon degeneration (Essuman et al., 2017; Gerdts et al., 2015). While the injury-induced enzymatic activity of SARM1 has been elucidated recently, the molecular mechanism of SARM1’s activation remains unresolved.
SARM1 activation in axons is normally restrained by the axon survival factor and NAD+-synthesizing enzyme NMNAT2 (nicotinamide mononucleotide adenylyltransferase 2), which uses NMN (nicotinamide mononucleotide) and ATP to synthesize NAD+ (see Figure S1A for chemical structures). NMNAT2 is a labile protein in axons and is rapidly degraded after axon injury (Gilley et al., 2010). Both chronic and acute loss of NMNAT2 are sufficient to cause axon fragmentation that is dependent on SARM1, suggesting that the absence of NMNAT2 can activate SARM1 (Gilley et al., 2015; Gilley et al., 2017). Coleman, Conforti and colleagues provided genetic and pharmacological data that the NMNAT2 substrate NMN promotes SARM1-dependent axon degeneration (Di Stefano et al., 2015; Loreto et al., 2015). As NMNAT2 is lost after axon injury, the levels of NMN rise in axons prior to fragmentation (Di Stefano et al., 2015). Manipulations that lower NMN, such as inhibition of the NMN-generating enzyme NAMPT (nicotinamide phosphoribosyltransferase) (Sasaki et al., 2009) or expression of the bacterial NMN-consuming enzyme NMN deamidase (Di Stefano et al., 2015), provide protection after axon injury and so offer supporting evidence of a pro-degenerative role for NMN. In addition, NMN can potentiate SARM1 activity in vitro (Bratkowski et al., 2020; Zhao et al., 2019). However, multiple manipulations that boost the levels of NMN do not trigger axon degeneration, and instead robustly protect axons after injury (Liu et al., 2018; Sasaki et al., 2016). As both low and high levels of NMN are compatible with strong axon protection, the postulated pro-degenerative activity of NMN has remained controversial and must be dependent on additional factors. Indeed, loss of NMNAT2 not only leads to an increase in the level of NMN, but also a decrease in the level of its product, NAD+. Hence, both an increase in NMN, a decrease in NAD+, or a change in their ratio are candidate mechanisms for SARM1 activation (Coleman and Hoke, 2020; Di Stefano et al., 2017; Krauss et al., 2020; Llobet Rosell et al., 2019).
The N-terminal region of SARM1 contains an ARM (armadillo repeat) domain that directly binds to and restrains the pro-degenerative function of the enzymatic TIR domain at the C-terminus (Gerdts et al., 2013; Summers et al., 2016). SARM1 lacking the N-terminal region is constitutively active (Bratkowski et al., 2020; Chuang et al., 2005; Gerdts et al., 2015; Gerdts et al., 2013) and is highly destructive to cells due to unchecked NADase activity, similar to the increased NAD+ degradation that occurs after axotomy-induced activation (Sasaki et al., 2016). We previously identified an amino acid residue, K193, in the N-terminal region of SARM1, that is required for activation and demonstrated that its mutation in full-length SARM1 has potent dominant-negative effects (Geisler et al., 2019). In order to test the role of the N-terminal region, NMN, and NAD+ in SARM1 activation, we took a two-pronged approach. First, we developed functional and biochemical assays in primary neurons to test the impact of altering NMN and NAD+ levels on SARM1 activation. We demonstrate that both increased NMN and decreased NAD+ activate SARM1 in neurons, and provide evidence that SARM1 activation is sensitive to the ratio of NMN to NAD+. Second, we determined the structure of the SARM1 auto-inhibitory N-terminal domain and demonstrate that NMN and NAD+ directly compete for binding to SARM1’s ARM domain. We demonstrate that residues in this regulatory pocket are necessary for both NMN- and injury-dependent activation of SARM1 and subsequent axon degeneration. Finally, we present a cryo-EM map of the full octameric SARM1 complex and show that the conformation of the SARM1 ARM domain is regulated by NMN. These functional and structural insights identify SARM1 as a metabolic sensor of the NMN/NAD+ ratio, define the mechanism of SARM1 activation, and may enable a path to the development of allosteric SARM1 inhibitors that block SARM1 activation.
RESULTS
NMN activates SARM1 in neurons in a context-dependent manner
NMN can increase SARM1 NADase activity in vitro (Bratkowski et al., 2020; Zhao et al., 2019), yet increased levels of NMN in uninjured neurons are associated with potent axon protection (Sasaki et al. 2016; Liu et al. 2018), suggesting that NMN activation of SARM1 may be context-dependent. To directly test the hypothesis that increased levels of NMN can activate SARM1 in primary neurons, we sought a method to increase intracellular NMN in the absence of axonal injury. To do so, we tested treatment of neurons with nicotinamide riboside (NR), which is cell permeable, while overexpressing the enzyme nicotinamide riboside kinase (NRK1), which converts NR to NMN (Figure S1A) intracellularly, and assessed the effects on SARM1 activation.
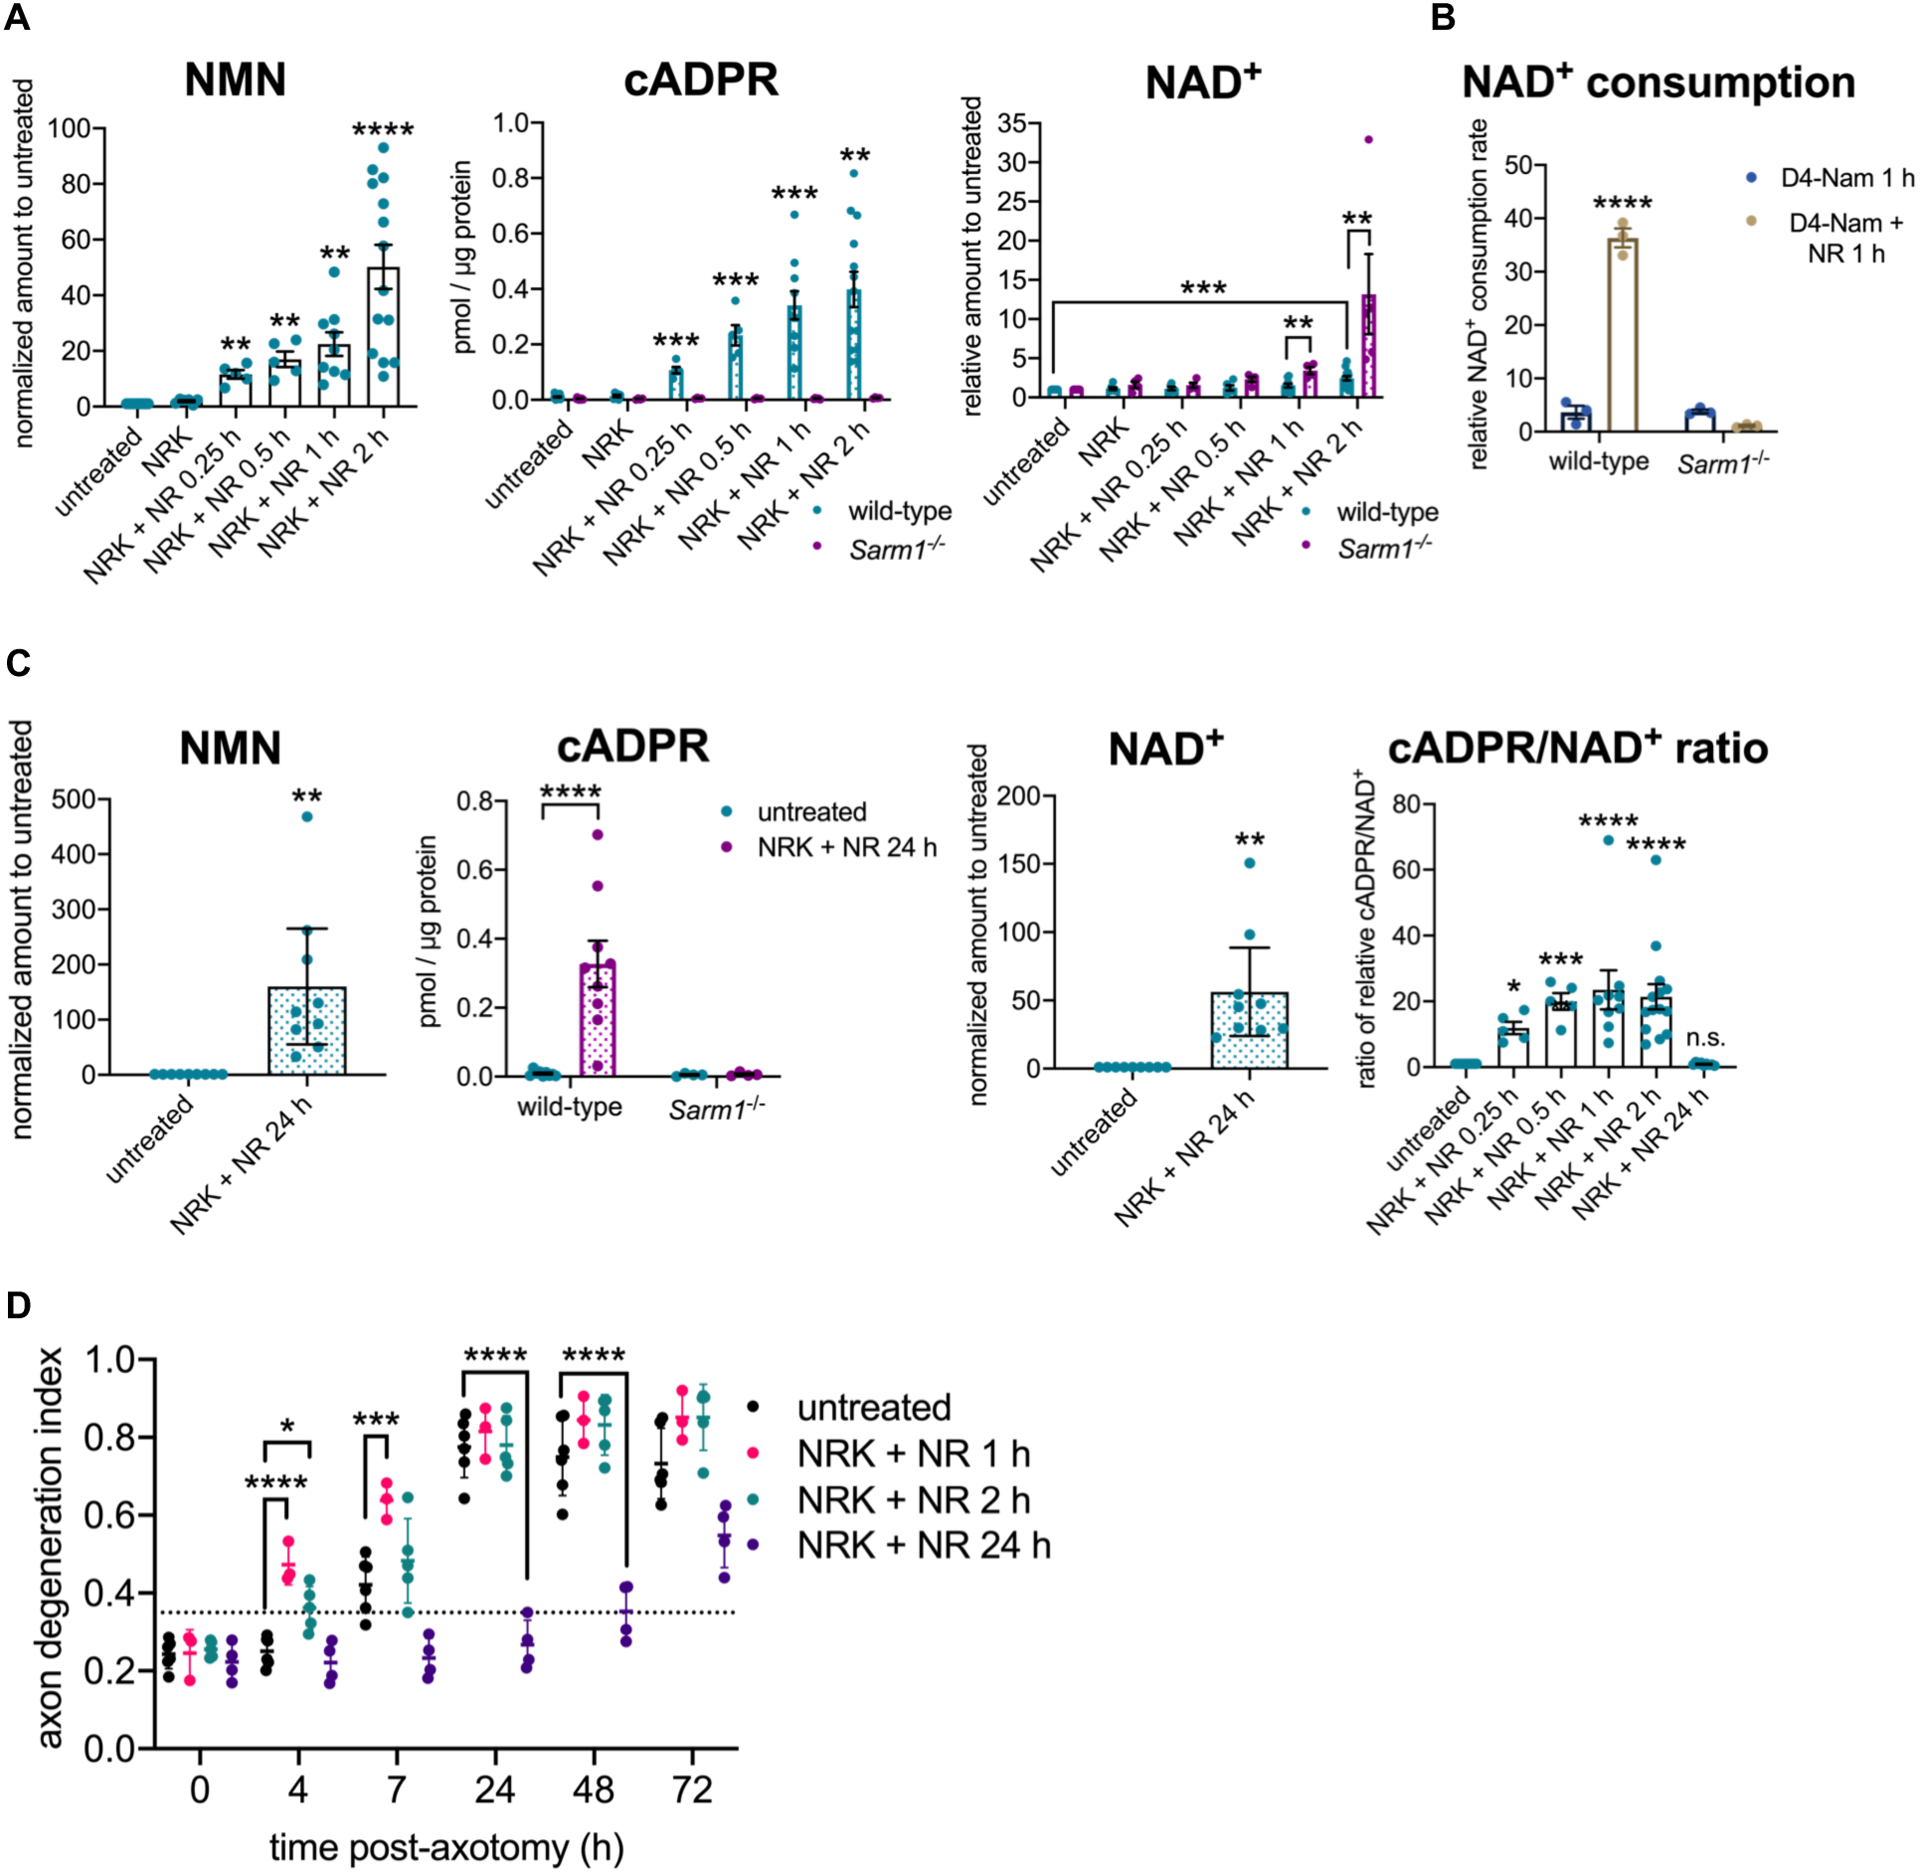
Using primary mouse embryonic dorsal root ganglion (eDRG) neurons, we find that lentiviral overexpression of NRK1 and treatment with NR results in rapid accumulation of intracellular NMN within 15 min (Figure 1A). When SARM1 is activated, its C-terminal TIR domain cleaves NAD+ into ADPR (adenosine diphosphate ribose) or cyclic ADPR (cADPR) (Essuman et al., 2017) (Figure S1A). SARM1 is the major source of neuronal cADPR, a quantitative biomarker of SARM1 activation in neurons (Sasaki et al., 2020a). Indeed, cADPR levels rapidly increase in cells treated with NR, as soon as 15 min after treatment (Figure 1A). The increase in cADPR is absent in neurons cultured from Sarm1−/− mice, confirming the production of cADPR is entirely SARM1-dependent (Figure 1A). Although NMN levels are increased rapidly, neuronal NAD+ levels are not significantly changed until 2 h after NR treatment, suggesting a balance between the opposing reactions of NMN conversion to NAD+, presumably by NMNAT2, and NAD+ consumption by SARM1 (Figure 1A). In the absence of SARM1, NAD+ is significantly increased 1 h and 2 h after NR treatment, demonstrating that the increase in NAD+ biosynthesis induced by the addition of NR would lead to NAD+ accumulation if not for NAD+ cleavage by the activated SARM1 (Figure 1A).
Figure 1.
NMN activates SARM1 in primary neurons in the absence of injury.
A NMN (nicotinamide mononucleotide), cADPR (cyclic adenosine diphosphate ribose), and NAD+ (nicotinamide adenine dinucleotide) levels from wild-type or Sarm1−/− primary mouse eDRG neurons with lentiviral expression of NRK1 and treated with NR (nicotinamide riboside) [100 μM]. NMN and NAD+ levels are shown relative to untreated control, and cADPR as concentration in pmol/μg protein, measured by LC-MS-MS. Data correspond to means from replicate experiments and error bars denote ±SEM. Statistical significance was determined by Sidak’s multiple comparisons test, relative to untreated neurons, or by unpaired t-tests with corrections for multiple comparisons using the Holm-Sidak method, comparing wild-type to Sarm1−/− for each condition. * denotes P value=<0.05; **=<0.01; ***=<0.001; ****=<0.0001.
B Relative NAD+ consumption rate in primary mouse eDRG neurons after D4-nicotinamide (D4-Nam) [300 μM] +/− 1 h NR [100 μM] treatment. Data correspond to means from replicate experiments and error bars denote ±SEM. Statistical significance was determined by two-way ANOVA with Tukey’s multiple comparisons test. * denotes P value=<0.05; **=<0.01; ***=<0.001; ****=<0.0001.
C NMN, cADPR and NAD+ levels from primary eDRG neurons from wild-type or Sarm1−/− mice. NMN and NAD+ levels relative to untreated control, and cADPR as concentration in pmol/μg protein, measured by LC-MS-MS, are shown. Ratio of relative cADPR to relative NAD+ levels from primary mouse eDRG neurons treated with NR are also shown. Data correspond to means from replicate experiments and error bars denote ±SEM. Statistical significance was determined by t-test (NMN, NAD+); Two-way ANOVA with Tukey’s multiple comparison test (cADPR) or Dunnett’s multiple comparison test (relative to untreated) (cADPR/NAD+). * denotes P value=<0.05; **=<0.01; ***=<0.001; ****=<0.0001.
D Axon degeneration time course after axotomy, quantified as degeneration index (DI), where a DI of 0.35 or above represents degenerated axons, indicated by a horizontal dotted line. Data correspond to means from replicate experiments and error bars denote ±SD. Statistical significance was determined by two-way ANOVA with Dunnett’s multiple comparison test, comparing each condition to the others at each time point. * denotes P value=<0.05; **=<0.01; ***=<0.001; ****=<0.0001.
See also Figure S1.
As a complementary test of SARM1 activation, we analyzed NAD+ consumption after NR treatment using a previously characterized heavy-nicotinamide flux assay (Sasaki et al., 2016). NAD+ consumption is greatly increased in a SARM1-dependent manner after 1 h of NR treatment, confirming the NADase activity of SARM1 is activated (Figure 1B). Finally, we show that NR treatment of wild-type neurons that do not overexpress NRK1 also leads to a significant increase in both NMN and SARM1 activation (Figure S1B). Hence, exposure of healthy neurons to NR, a common nutritional supplement used to boost NAD+ (Bogan et al., 2008), activates the pro-degenerative SARM1 NADase.
Previously, we demonstrated that 24 h of pre-treatment with NR in the presence of NRK1 prior to axon injury results in increased neuronal NAD+ levels, as well as strong axon protection, despite very high levels of NMN (Sasaki et al., 2016). This finding is not consistent with NMN itself being directly pro-degenerative, at least in these circumstances. However, having developed an NMN activation assay of SARM1, we tested whether these high levels of NMN activate SARM1. Indeed, while we find similarly high levels of SARM1-dependent cADPR production after brief (1 h) or long-term (24 h) NR treatment (Figure 1C), these axons do not spontaneously degenerate despite the high levels of NMN and SARM1 production of cADPR. By 24 h after NR treatment, NAD+ levels are also greatly increased, and the ratio of cADPR to NAD+ is similar to that in untreated neurons (Figure 1C). SARM1 has some basal activity (Sasaki et al., 2020), and so the restoration of a normal cADPR/NAD+ ratio at 24 h is most consistent with basal SARM1 activity generating more cADPR due to the large increase in the concentration of its substrate NAD+. Hence, these findings suggest that 24 h after NR addition, levels of NAD+ are increased to an extent that SARM1 is reverted to its low, basal activity. This model explains why pre-treatment with NR + NRK1, which leads to a dramatic increase in both NMN and NAD+, not only does not trigger spontaneous axon degeneration, but instead robustly protects axons following injury (Sasaki et al., 2016).
To explore this hypothesis further, we injured axons at various times after NR addition to the neurons. When axons are injured after 1 or 2 h of pre-treatment with NR, a time when NMN levels are high and SARM1 is activated, axons show accelerated degeneration, even though NAD+ levels are still essentially unchanged, findings consistent with a pro-degenerative role for NMN-activated SARM1 (Figure 1D and S1C). By contrast, axons injured after a 24 h NR pre-treatment that increases NAD+ levels do not degenerate (Figure 1D and S1C), consistent with previous observations (Sasaki et al., 2016). This failure of the axon to degenerate in the face of high levels of NMN may be explained by an inhibitory effect on SARM1 activation by concomitantly high neuronal NAD+ levels. These findings highlight that the pro-degenerative activity of NMN is context-dependent. When NMN levels increase in an intact axon containing NMNAT2, NMN activates SARM1 NADase activity, but it is also converted to NAD+, countering SARM1 activation and promoting axon survival. By contrast, the loss of the short-lived NMNAT2 protein after axon injury eliminates this compensatory effect and the resulting increase in NMN levels without concomitant increases in NAD+ causes SARM1 activation and triggers axon degeneration.
NMN/NAD+ ratio controls SARM1 activation in neurons
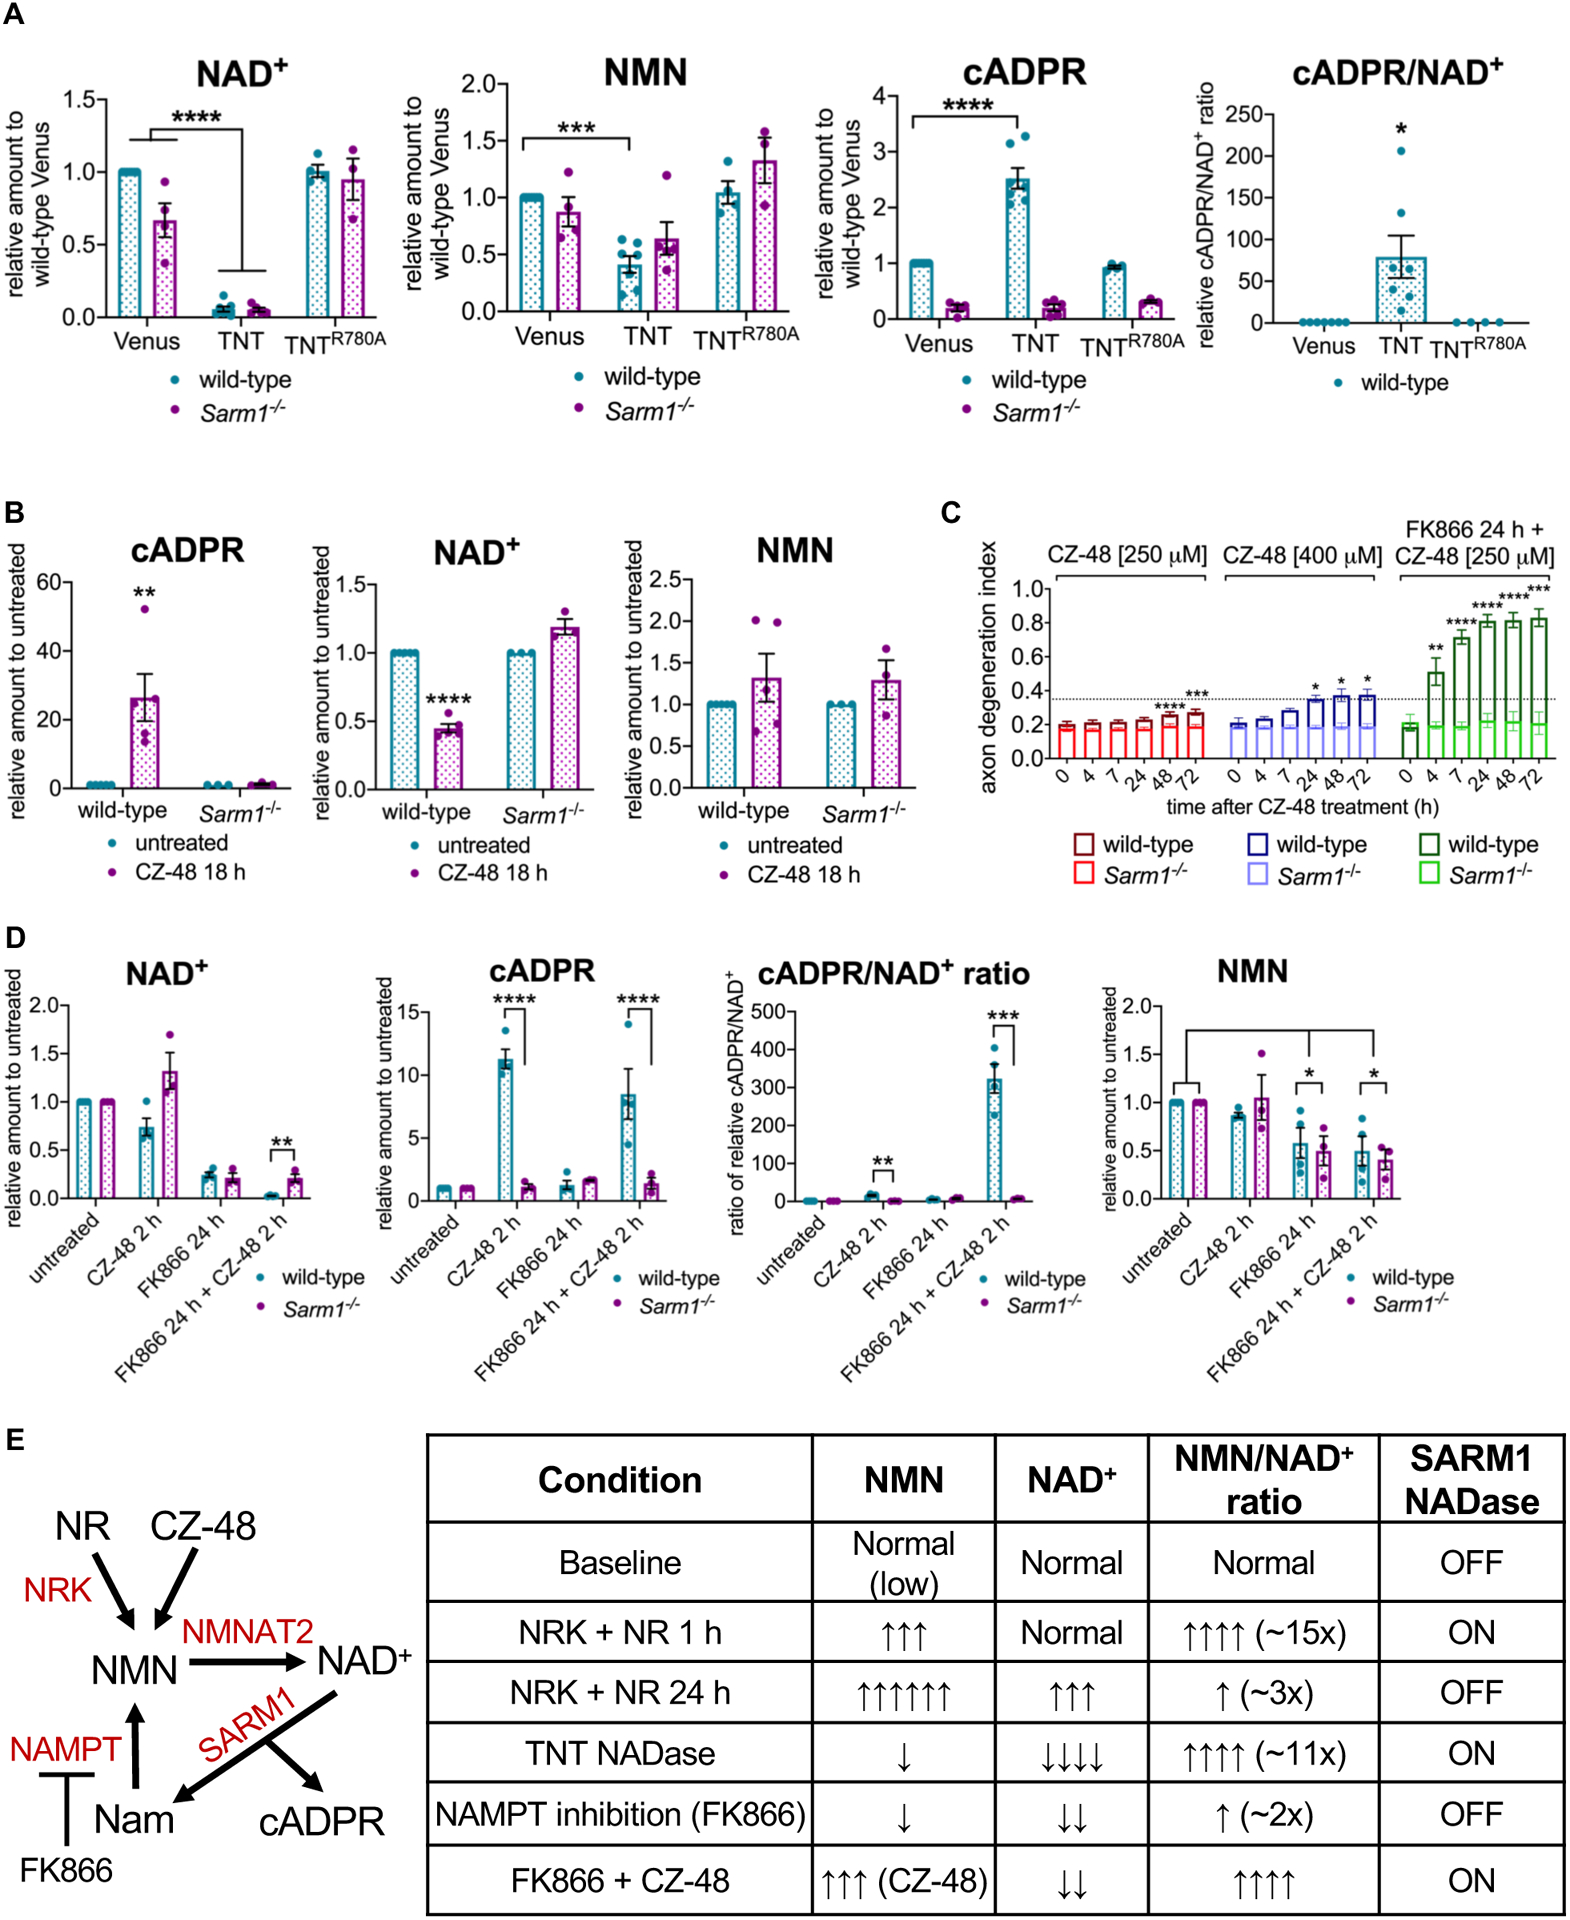
Having demonstrated that an increase in NMN activates SARM1 in neurons, we next tested the hypothesis that a decrease in NAD+ can also activate SARM1. We could not reduce NAD+ levels by inhibiting NAD+ synthesis, because any such manipulation would also affect NMN levels. When both NMN and NAD+ are decreased simultaneously, axons are protected (Di Stefano et al., 2015; Sasaki et al., 2016; Sasaki et al., 2009). To selectively decrease NAD+, we expressed the tuberculosis necrotizing toxin (TNT), which is a NAD+ glycohydrolase that cleaves NAD+ into nicotinamide and ADPR (Tak et al., 2019). This is different from SARM1, which cleaves NAD+ into nicotinamide and either ADPR or cADPR (Essuman et al., 2017). We used lentiviruses to express Venus fluorescent protein, TNT, or the catalytically-dead glycohydrolase TNTR780A in wild-type and Sarm1−/− DRG neurons. After four days, metabolites were extracted from the neurons and analyzed by LC-MS-MS. Expression of functional TNT leads to a dramatic loss of NAD+ to ~ 5% of control levels in both wild-type and Sarm1−/− neurons (Figure 2A and S2A). By contrast, NMN levels are only modestly reduced by the expression of TNT in either genotype. The resulting NMN/NAD+ ratio is ~11x higher than control neurons (10.7 ± 2.8). This system therefore allows us to test the impact of low NAD+ on SARM1 activation, without the confounding effect of an equivalent decrease in NMN. In wild-type neurons, expression of TNT leads to a significant increase in the levels of the SARM1 biomarker cADPR (Figure 2A and S2A). By contrast, there is no change in the levels of cADPR when TNT is expressed in Sarm1−/− neurons. The expression of TNT not only depletes NAD+, but also activates SARM1. Indeed, the observed change in cADPR levels may be an underestimate of the level of SARM1 activation, because the levels of the SARM1 substrate NAD+ are very low and so the functional change may be better represented by assessing the ratio of product to substrate (cADPR/NAD+) (Figure 2A). These data support the model that loss of NAD+ promotes SARM1 activation without the requirement for an increase in NMN, occurring even when NMN levels are below normal.
Figure 2.
NMN/NAD+ ratio controls SARM1 activation in neurons.
A NAD+, NMN, cADPR levels and the relative cADPR/NAD+ ratios from primary eDRG neurons from wild-type or Sarm1−/− mice expressing Venus control, TNT or TNTR780A after four days, relative to Venus control, measured by LC-MS-MS. Data correspond to means from replicate experiments and error bars denote ±SEM. Statistical significance was determined by two-way ANOVA with Dunnett’s multiple comparison test, comparing each condition to Venus-expressing control neurons. * denotes P value=<0.05; **=<0.01; ***=<0.001; ****=<0.0001.
B cADPR, NAD+ and NMN levels from primary eDRG neurons from wild-type or Sarm1−/− mice, after treatment with CZ-48 [250 μM] for 18 h, relative to untreated control, measured by LC-MS-MS. Data correspond to means from replicate experiments and error bars denote ±SEM. Statistical significance was determined by multiple unpaired t-tests with corrections for multiple comparisons using the Holm-Sidak method. * denotes P value=<0.05; **=<0.01; ***=<0.001; ****=<0.0001.
C Axon-degeneration time course after treatment with CZ-48 [250 or 400 μM] or 24 h pre-treatment with FK866 [100 nM] + CZ-48 [250 μM], in primary eDRG neurons from wild-type or Sarm1−/− mice, and quantified as degeneration index (DI), where a DI of 0.35 or above represents degenerated axons. Data correspond to means from replicate experiments and error bars denote ±SD. Statistical significance was determined by two-way ANOVA with Dunnett’s multiple comparison test, comparing each time-point to time 0 h within each condition. * denotes P value=<0.05; **=<0.01; ***=<0.001; ****=<0.0001.
D NAD+ and cADPR and NMN levels, and relative cADPR/NAD+ ratio from primary eDRG neurons from wild-type or Sarm1−/− mice after treatment with 2 h CZ-48 [250 μM], FK866 24 h [100 nM], or FK866 24 h [100 nM] + 2 h CZ-48 [250 μM], relative to untreated control, measured by LC-MS-MS. Data correspond to means from replicate experiments and error bars denote ±SEM. Statistical significance was determined by unpaired t-tests with corrections for multiple comparisons using the Holm-Sidak method, comparing wild-type to Sarm1−/− for each condition (NAD+, cADPR, and cADPR/NAD+), or two-way ANOVA with correction for multiple comparisons using the Holm-Sidak method, comparing each condition to untreated within each genotype (NMN). * denotes P value=<0.05; **=<0.01; ***=<0.001; ****=<0.0001.
E Schematic of NAD+ pathway and experimental manipulations used in Figures 1 and 2. A summary table of experimental conditions from Figures 1 and 2 and their effects on NMN and NAD+ levels, the NMN/NAD+ ratio, and SARM1 NADase activity.
See also Figure S2.
Both an increase in NMN and a decrease in NAD+ can promote SARM1 activation, leading us to hypothesize that NMN and NAD+ may compete to control the activation state of SARM1. To test this model, we wished to determine whether selectively lowering NAD+ levels can potentiate NMN-dependent SARM1 activation. Again, this cannot be done by inhibiting the NAD+ biosynthetic pathway, as both NMN and NAD+ levels would change. Instead, we turned to CZ-48, a cell-permeable NMN mimetic that can activate SARM1 in vitro and trigger SARM1-dependent cell death in cortical neurons (Bratkowski et al., 2020; Zhao et al., 2019). Incubation of wild-type and Sarm1−/− neurons with 250 μM CZ-48 leads to a SARM1-dependent increase in cADPR by 18 h (Figure 2B), which is a direct demonstration that CZ-48 activates SARM1 in neurons. While SARM1 is activated by treatment with 250 μM CZ-48, this dose or a higher dose (400 μM) does not trigger robust axon degeneration (Figure 2C). The effects of CZ-48 are blocked in Sarm1−/− neurons, demonstrating SARM1-dependence. We next pre-treated wild-type neurons for 24 h with the NAMPT inhibitor FK866. NAMPT synthesizes NMN, thus FK866 treatment leads to a decrease in both NMN and NAD+ and delays axon degeneration following axotomy, presumably due to the decrease in NMN levels (Di Stefano et al., 2015; Sasaki et al., 2009). Incubation of FK866-treated neurons with 250 μM CZ-48 leads to rapid and robust SARM1-dependent axon degeneration that is readily apparent by 4 h after CZ-48 treatment (Figure 2C and S2B). Thus, the same concentration of an NMN mimetic that results in very mild axon degeneration after 24 h when NAD+ levels are normal, triggers robust SARM1-dependent axon destruction after 4 h when NAD+ levels are low. We confirmed by LC-MS-MS that wild-type neurons treated with FK866 for 24 h have reduced NMN and NAD+, and that a subsequent 2 h treatment with 250 μM CZ-48 results in elevated levels of cADPR and a dramatic increase in the ratio of cADPR/NAD+, when compared with 2 h CZ-48 treatment alone (Figure 2D). Hence, we find the NMN mimetic CZ-48 is much more effective at activating SARM1 enzymatic activity when NAD+ levels are low, consistent with the model that NAD+ and NMN compete to regulate the activation state of SARM1.
In this series of studies, we have manipulated the levels of NMN and NAD+ using a variety of complementary approaches. We summarize these manipulations and their impact on metabolite levels, the NMN/NAD+ ratio, and SARM1 activation in Figure 2E. In these experiments there is not a clear relationship between NMN levels and SARM1 activation—SARM1 can be on or off in the presence of either low or high levels of NMN. Instead, it is the NMN/NAD+ ratio that predicts SARM1 activation—modest increases on the order of 2–3 fold do not induce SARM1 enzyme activity, while an increase in the ratio of >10-fold is associated with activated SARM1. Taken together, these findings support the model that SARM1 is a metabolic sensor that responds to a large change in the NMN/NAD+ ratio, as is seen when NMNAT2 is lost, but that is not activated by either concurrent, equivalent changes in the levels of NMN and NAD+ or by more modest changes in their ratio.
NMN/NAD+ ratio controls NADase activity of recombinantly produced purified SARM1
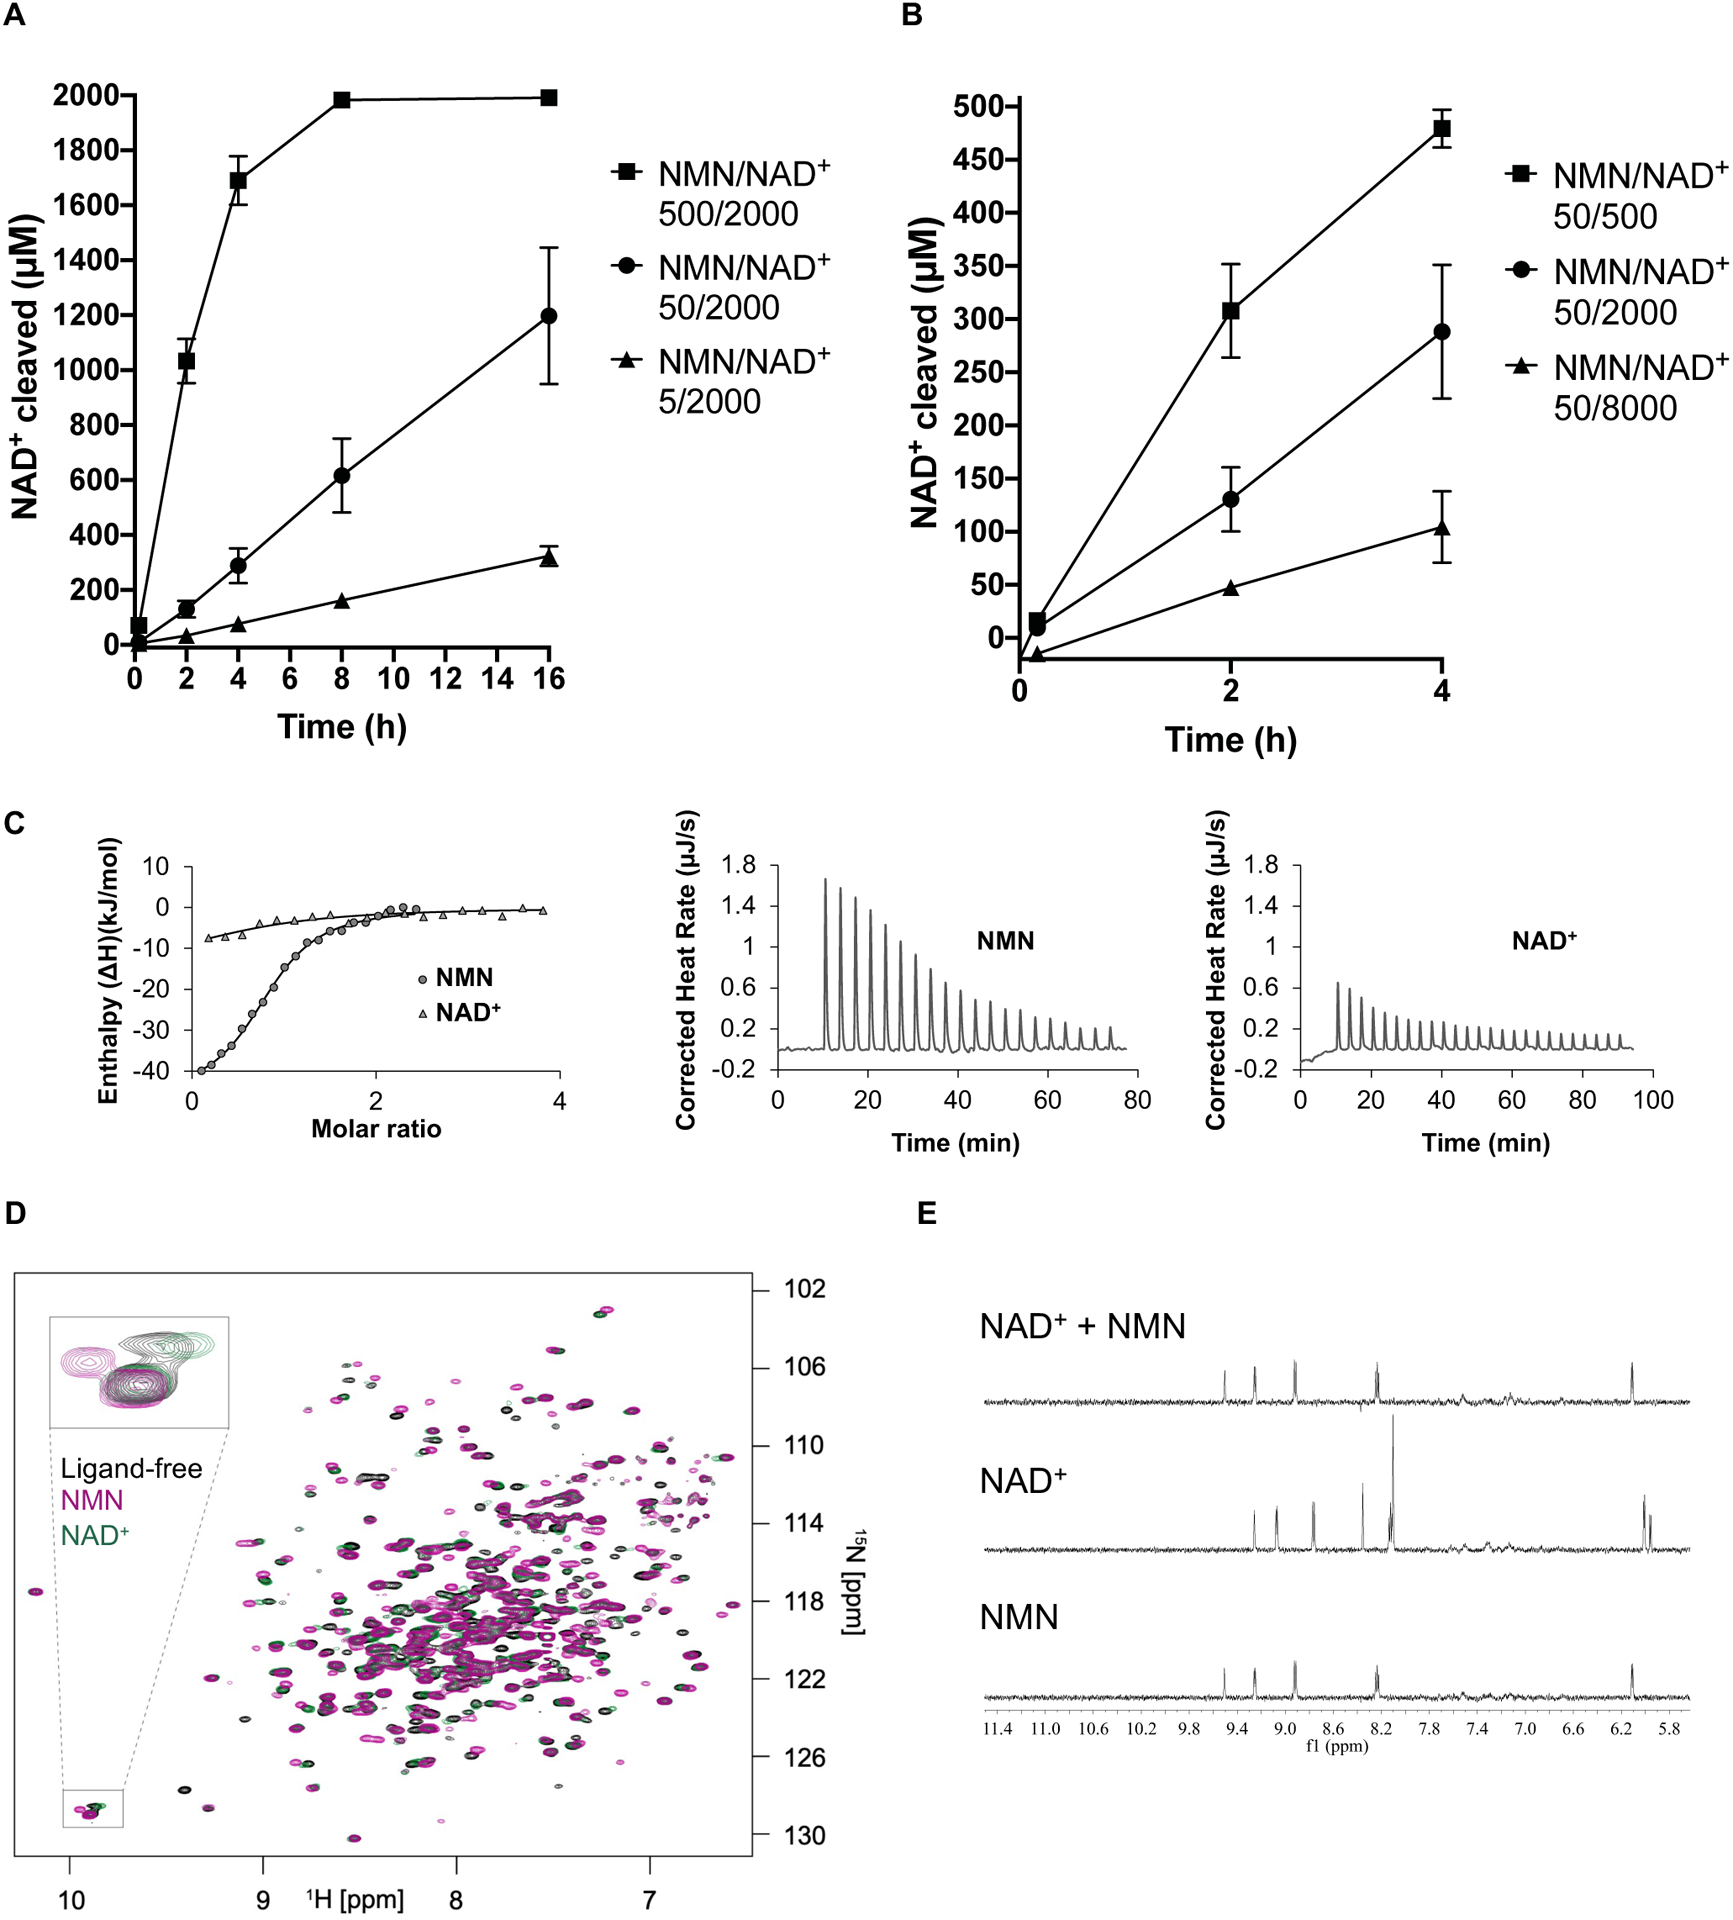
Having demonstrated in cellular assays that SARM1 activity is regulated by the NMN/NAD+ ratio, we next tested such regulation in vitro, using purified SARM1 protein. We successfully produced human SARM1 lacking its mitochondrial targeting signal but containing the ARM, tandem SAM (sterile-alpha motif) and TIR domains (residues 28–724, termed here hSARM1) in mammalian cells and used a previously established 1H NMR assay (Horsefield et al., 2019) to evaluate the effects of altering the NMN/NAD+ ratios on NADase activity. First, we showed that NMN increases hSARM1 NADase activity (Figure 3A, S3A–B), consistent with previous findings (Bratkowski et al., 2020; Zhao et al., 2019). We then incubated hSARM1 with NMN for differing lengths of time prior to adding NAD+. We found that longer NMN pre-incubation times resulted in a more significant activation of hSARM1 NADase activity (Figure S3C), suggesting slow conformational changes of SARM1 from the inactive to the active state upon NMN binding. Similar to our cell-based assays, we then altered the NMN/NAD+ ratio. Increasing the NMN/NAD+ ratio, by either raising the NMN concentration or reducing the NAD+ concentration, leads to faster cleavage of NAD+ by hSARM1 (Figure 3A–B). In the absence of NMN, however, increasing the NAD+ concentration mostly results in increased NADase activity (Figure S3D), which is likely due to the increased availability of substrate to the enzyme at the orthosteric site. Hence, both biochemical and cell-based studies demonstrate that the NMN/NAD+ ratio controls hSARM1 activation.
Figure 3.
NMN/NAD+ ratio controls NADase activity of recombinantly produced SARM1.
A Increasing the NMN/NAD+ ratio by raising the NMN concentration (5–500 μM) leads to higher NAD+-cleavage activity by hSARM1 (500 nM). Initial NAD+ concentration was 2000 μM for all NMR samples. The mean and range of two experiments are shown.
B Increasing the NMN/NAD+ ratio by lowering initial NAD+ concentration (8 mM – 500 uM) leads to higher NAD+ cleavage activity by hSARM1 (500 nM). The NMN concentration was 50 μM for all NMR samples. Only data from the initial 4 h are shown as the reaction for the 500 μM NAD sample was almost complete by 4 h. The mean and range of two experiments are shown.
C Integrated (left) and raw (right) ITC data for the titration of 0.4 mM NMN with 60 μM dSARM1ARM and 1 mM NAD+ with 80 μM dSARM1ARM.
D Overlay of 15N-TROSY-HSQC NMR spectra, showing the effect of NMN (0.15 mM, purple) and NAD+ (0.15 mM, green) binding to 15N-labelled dSARM1ARM (0.15 mM, black). The inset shows an expansion of the tryptophan indole chemical shift region of the spectrum, where NMN addition causes a larger chemical shift change, and in the opposite direction, than addition of NAD+.
E Expansions of STD NMR spectra, showing saturation-transfer signals in the aromatic region for dSARM1ARM (40 μM) interactions with NMN (1 mM), NAD+ (1 mM), and NMN plus NAD+ (1 mM of each).
See also Figure S3.
NMN activates SARM1 by direct interaction with the ARM domain
Because the ARM domain is required for auto-inhibition of SARM1 (Gerdts et al., 2013), we hypothesized that NMN (and likely NAD+) bind directly to the ARM domain. To test this hypothesis, we first attempted to produce the ARM region of human SARM1 recombinantly; however, the protein constructs tested were insoluble. Human and Drosophila SARM1 are functionally and structurally conserved (Osterloh et al., 2012), and so we tested the Drosophila SARM1 protein. The ARM domain of the Drosophila SARM1 ortholog (residues 307–678; dSARM1ARM; Figure S3E) was successfully produced in E. coli. ITC (isothermal titration calorimetry) measurements showed that NMN binds directly to dSARM1ARM at a 1:1 molar ratio, with a Kd value of 6.39 ± 0.04 μM (Figure 3C). NAD+ also binds to dSARM1ARM, although with almost nine-fold lower affinity compared to NMN (Kd = 54.2 ± 6.4 μM; Figure 3C). In agreement, 15N-TROSY-HSQC (transverse relaxation optimized spectroscopy - heteronuclear single quantum coherence) NMR (nuclear magnetic resonance) spectroscopy showed that one dSARM1ARM molecule binds to one molecule of NMN or NAD+, and that there are larger chemical shift perturbations in dSARM1ARM residues upon addition of NMN compared to addition of NAD+ (Figure 3D). Furthermore, the effect of the ligands on the indole NH, observed in the 15N-TROSY-HSQC spectra, demonstrates that one of the tryptophans in dSARM1ARM has a stronger interaction with NMN than NAD+ and that this interaction is different upon binding of the two molecules (Figure 3D). The weaker binding affinity of NAD+ was also corroborated by competition binding assays via STD (saturation-transfer difference) NMR, as NMN almost eliminated NAD+ binding to dSARM1ARM at equal concentration (Figure 3E). Consistent with these findings, STD NMR experiments also showed that NMN and NAD+ bind directly to hSARM1 (Figure S3F). Our results therefore demonstrate that NMN and NAD+ regulate SARM1 activity by binding in a competitive fashion directly to a regulatory site in its ARM domain.
Crystal structure of the NMN-bound Drosophila SARM1 ARM domain
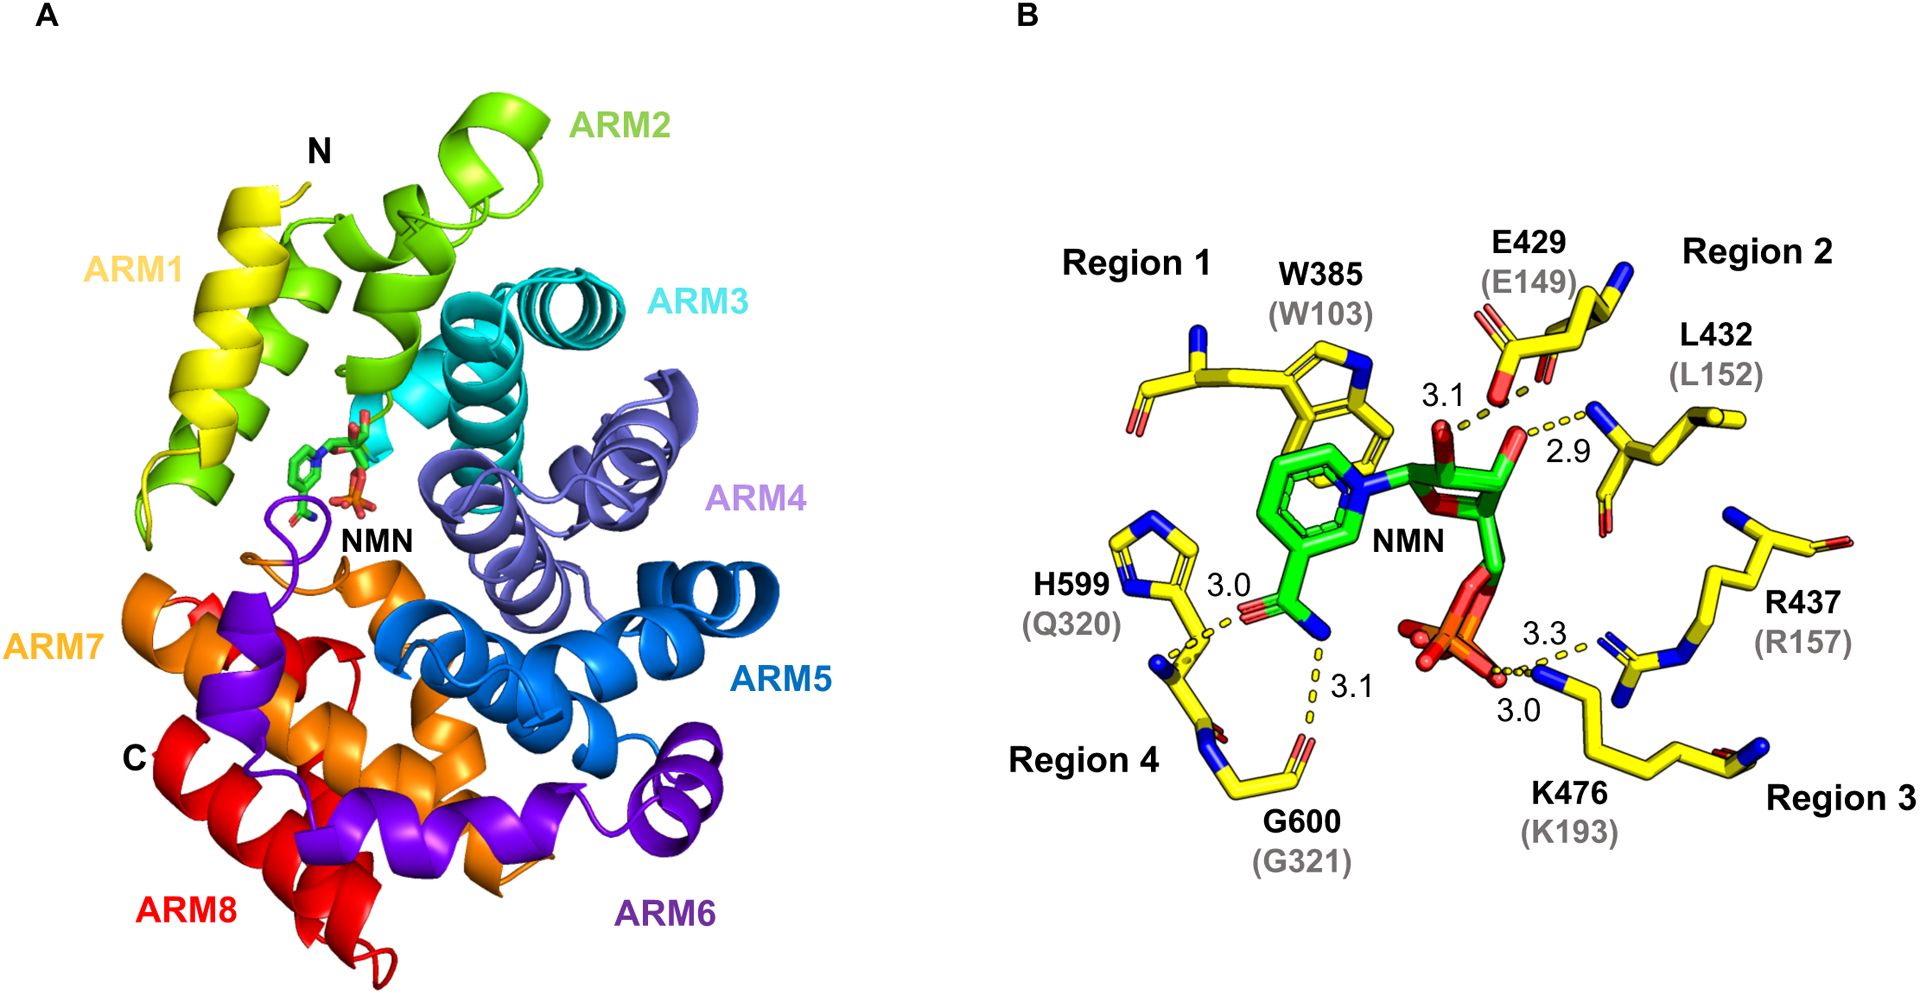
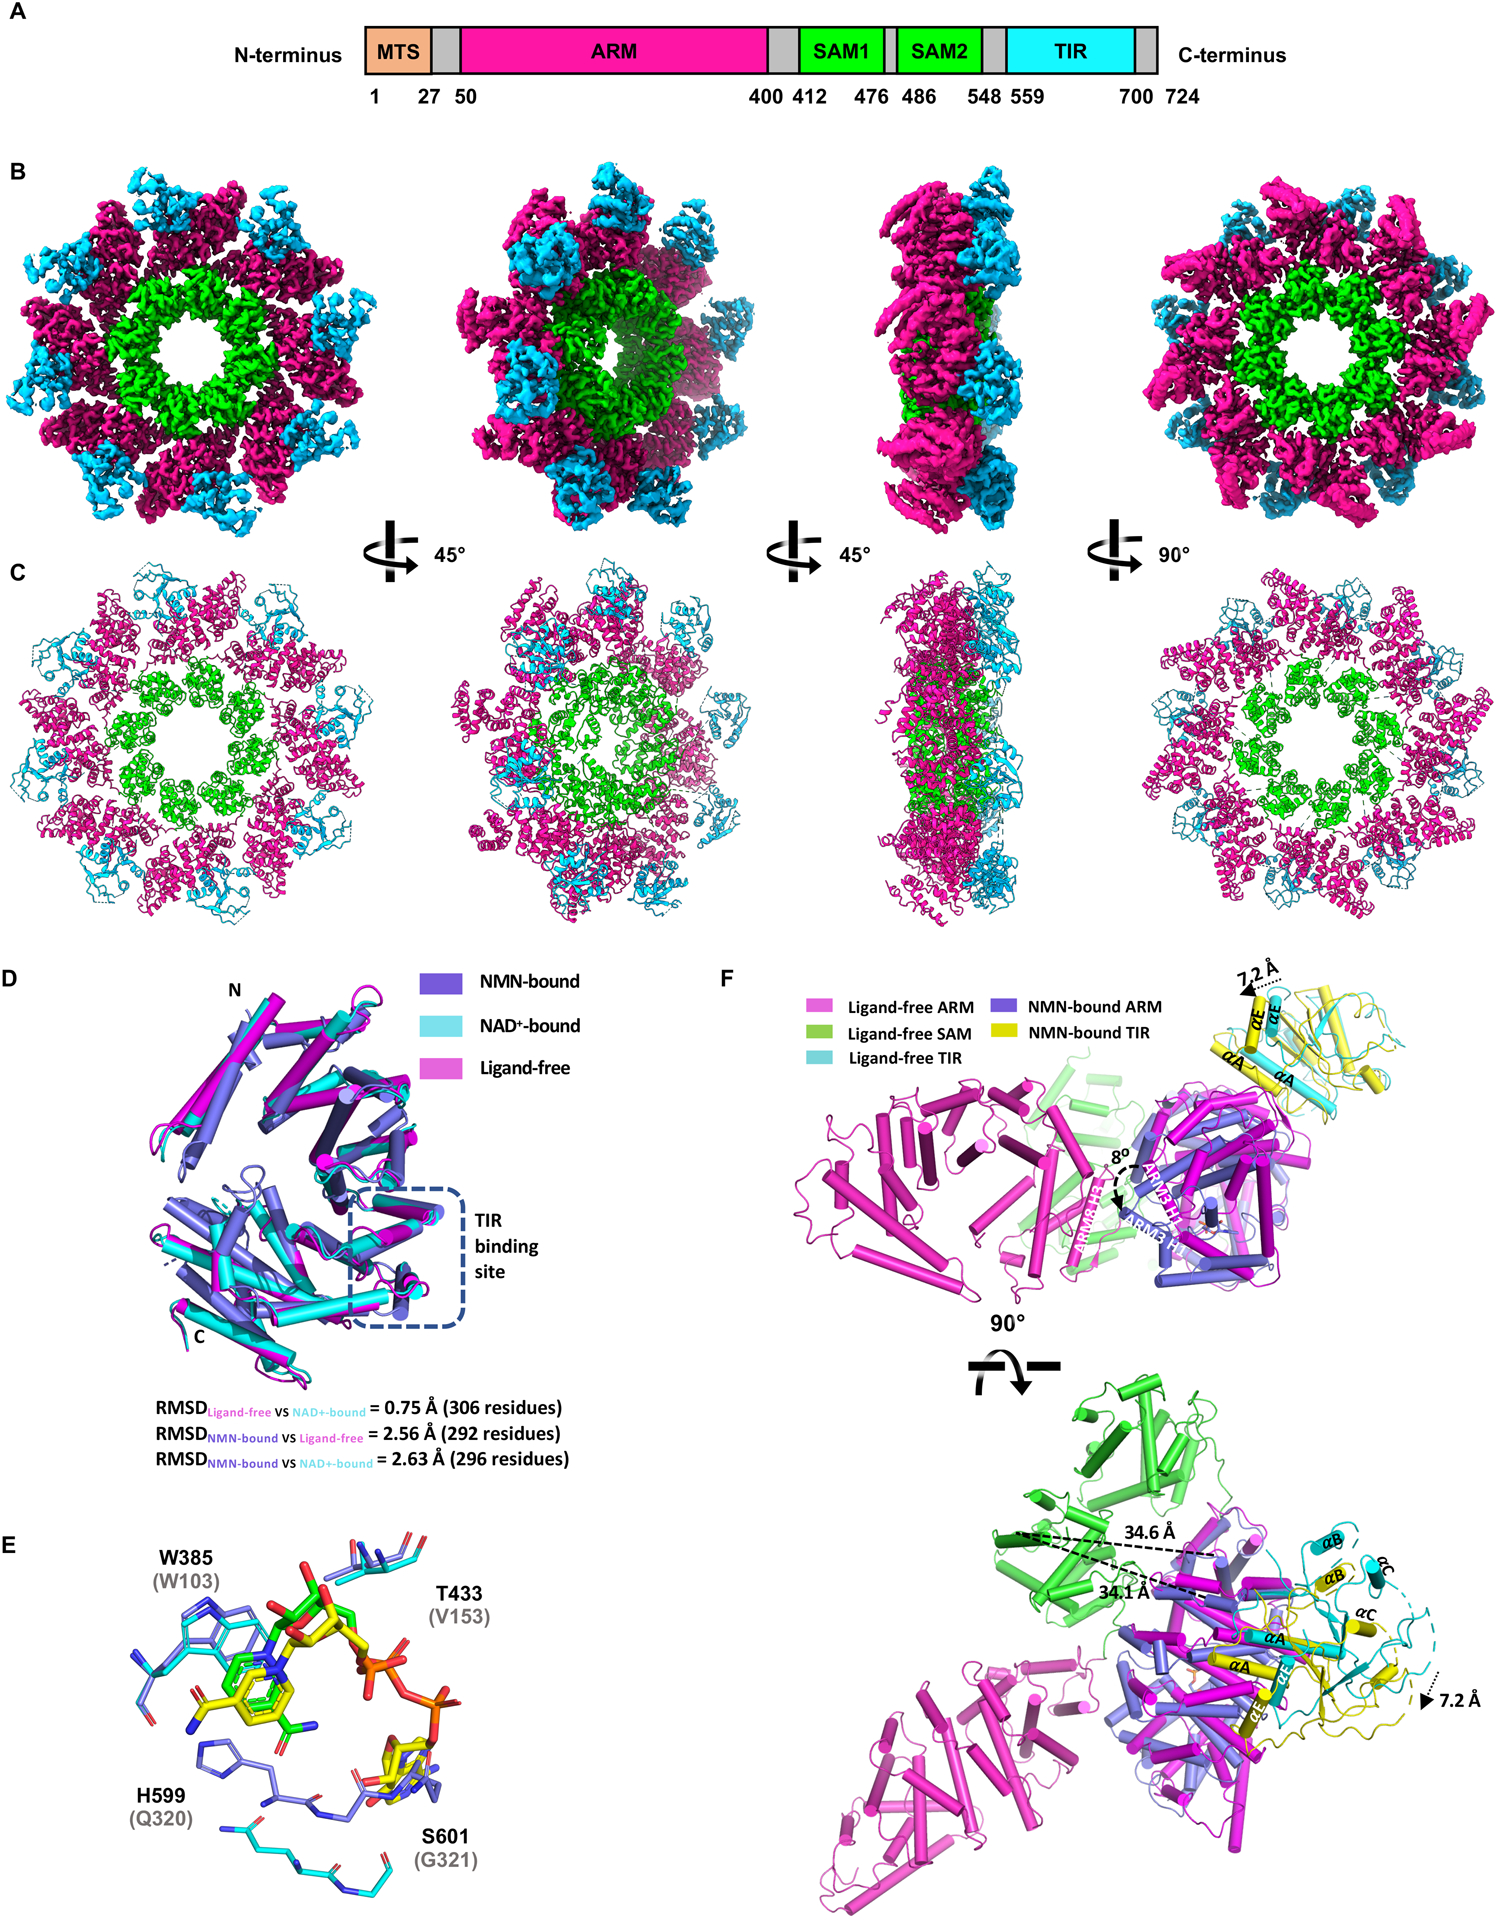
To understand the structural and molecular basis of the NMN:SARM1 interaction, we determined the crystal structure of the NMN-bound dSARM1ARM using the MIRAS (multiple isomorphous replacement combined with anomalous scattering) approach (1.7 Å resolution; Table S1) (Gu et al., 2021). The crystals of the NMN-bound dSARM1ARM have two molecules arranged in an antiparallel manner in the asymmetric unit. The dSARM1ARM protein is monomeric in solution, as characterized by MALS (multi-angle light scattering), either in the presence or absence of NMN (Figure S4A). Typical ARM-repeat proteins form superhelical structures, with each motif corresponding to a structural repeat consisting of three α-helices, H1–3 (Huber et al., 1997; Kobe et al., 2000; Tewari et al., 2010). The dSARM1ARM structure contains eight tandem repeats of armadillo motifs (ARM1–8) and displays an unusually compact and less regular superhelix, with both N- and C-terminal regions collapsed around NMN (Figure 4A, Figure S4B–E, Table S2). ARM1 starts with the H3 helix, followed by four ARM repeats (ARM2–5) with the usual three α-helices (H1–3). H3 helices from ARM1–5 are stacked in parallel, to generate the principal concave surface of the protein. ARM6 makes a sharp turn, leading to the C-terminal ARM7–8 folding towards the N-terminus. ARM7 only contains helices H2 and H3, and its H3 helix faces the convex surface of the protein. ARM8 has the usual three helices, and its H3 helix stacks parallel to the ARM7 H3.
Figure 4.
Crystal structure of NMN-bound dSARM1ARM.
A Crystal structure of dSARM1ARM (cartoon representation) interacting with NMN (stick representation).
B Interaction between dSARM1ARM and NMN (stick representation). Hydrogen bonds are shown as yellow dashed lines, labelled with distances in Å. The phosphate of NMN occupies two alternative positions. The predicted NMN binding residues in hSARM1 are shown in parentheses.
The interface between dSARM1ARM and NMN comprises 20 residues from four separate regions of the ARM domain, with a buried surface area of ~ 656 Å2 (Figure 4B, Figure S3E, S4F–G and Table S3). The average B-factor of NMN is ~25 Å2, which is lower than the average dSARM1ARM B-factor (28 Å2), suggesting a stable interaction between NMN and the protein. Region 1 contains the highly-conserved ARM1 residue W385 (W103 in hSARM1), which forms a parallel π-stacking interaction with the pyridine ring of NMN. Region 2 consists of multiple residues from ARM2 (E429, Q430, C431, L432, T433) and the ARM3 H1 helix (T434 and R437). Both E429 and L432 (E149 and L152 in hSARM1) form hydrogen bonds with the NMN ribose moiety, while R437 (R157 in hSARM1) interacts with the phosphate group. Region 3 consists of two residues from the ARM3 H3 helix (H473 and K476). K476 (K193 in hSARM1) forms a hydrogen bond with the phosphate moiety of NMN. Region 4 consists of residues from the loop between ARM6 and 7 (L595, A596, H597, A598, H599, G600, Q601, and S602) and both H599 and G600 (Q320 and G321 in human SARM1) form hydrogen bonds with the amide group of the nicotinamide portion in NMN. The amino-acid sequence of the corresponding loop in hSARM1 (residues 312–324) is not well conserved and contains a three-amino acid insertion, compared to dSARM1 (Figure S3E). Interestingly, the hydrogen bond mediated by K476 and the π-stacking interaction mediated by W385 in dSARM1ARM are analogous to the interaction of NAD+ with human NMNAT1 (Saridakis et al., 2001; Zhou et al., 2002) (the corresponding residues in human NMNAT1 are K57 and W169, respectively; Figure S4H–I). In summary, our crystallographic analysis reveals the molecular basis for NMN binding to the ARM domain of Drosophila SARM1. Apart from the loop connecting ARM6 and 7, the residues directly interacting with NMN are conserved in human SARM1 (Figure 4B, S3E and Table S3), strongly suggesting a similar NMN-binding mode.
Conformational changes associated with NMN binding
Because of the unusual compact structure of dSARM1ARM, we hypothesized that NMN binding may induce conformational changes. The appearance of new peaks in the 15N-TROSY-HSQC spectrum of dSARM1ARM after addition of NMN suggests that NMN binding stabilises a dynamic part of the protein to a defined conformation (Figure 3D). This is not the case for NAD+, where some chemical shift changes are seen but no new peaks appear as a result of binding. Moreover, the large number of chemical-shift changes observed for NMN cannot be explained by simple binding to the pocket identified in the crystal structure, as this would only perturb the resonances in the pocket. Instead, the binding must lead to rearrangement of the protein, which causes additional chemical-shift changes in sites distal to the binding pocket. To characterize these structural changes in more detail, we determined the crystal structure of ligand-free dSARM1ARM (Figure S4J–L, Table S1). The comparison of the structures in the absence and presence of NMN shows a compaction of the structure upon NMN binding (Figure S4K). However, a disulfide bond between residues near the NMN-binding site, found only in the ligand-free structure, may have stabilized a partially closed conformation during the crystallization process (Figure S4L), possibly understating the conformational changes induced by NMN binding. In support of this suggestion, molecular dynamics simulations of ligand-free and NMN-bound dSARM1ARM suggest further opening of the structure is possible in the absence of both NMN and disulfide bonds (Figure S5).
To shed further light on the conformational changes associated with NMN binding and their effects in the context of full-length SARM1, we determined the cryo-EM (cryogenic electron microscopy) structure of hSARM1 in the absence of ligands (3.1 Å resolution; Figure S6A–H; Table S4). The structure shows the central octameric ring of tandem SAM domains (Horsefield et al., 2019; Sporny et al., 2019), the ARM domains wrapped around the ring, and the TIR domains wedged between the ARM domains on the outside of the ring (Figure 5A–C). The ARM:TIR interaction site is predominantly hydrophobic in nature and involves the αA helix (residues K581, V582 and L586) of the TIR domain and the H2 helix of the ARM5 repeat (residues W253, F255 and P256) in the ARM domain. The TIR domains make no contact with each other and the BB-loop is poorly ordered, suggesting the protein is in an inactive state. While this work was in progress, four similar structures were reported (Bratkowski et al., 2020; Jiang et al., 2020; Shen et al., 2021; Sporny et al., 2020). The ligand-free hSARM1 structure is notably different to the NMN-bound dSARM1ARM crystal structure (RMSD [root-mean-square deviation] of 2.63 Å over 296 Cα atoms). The comparison of the two structures suggests that the ARM domain is in an open conformation when not bound to NMN (Figure 5D). Prominent differences are observed in ARM1 H3, ARM2 H2, and the loop connecting ARM1 and ARM2 on one side of the NMN-binding pocket, and in ARM6 H3, ARM7 H2 and ARM8 H1–2 on the opposite side of the pocket. The ARM3–5 repeats do not undergo any major rearrangements, suggesting that NMN binding does not directly modify the TIR domain-binding site. Overall, our structural data suggest that NMN-induced activation of SARM1 involves a conformational transition in the ARM domain from an open to a more closed state.
Figure 5.
Cryo-EM structure of hSARM1.
A A schematic representation of the hSARM1 domain architecture.
B Electrostatic potential density map of the hSARM1 octamer.
C Cartoon representation of the hSARM1 octamer.
D Structural superpositions of NMN-bound dSARM1ARM (slate; residues 373–676), ligand-free hSARM1 (magenta; residues 90–400) and NAD+-bound hSARM1 (cyan; PDB: 7CM6; residues 90–400; (Jiang et al., 2020)). The ARM:TIR interface is indicated by a dashed black box.
E Structural superposition of the NMN-binding site in NMN-bound dSARM1ARM (slate) and the NAD+-binding site in NAD+-bound hSARM1 (cyan; PDB:7CM6; (Jiang et al., 2020)). The structures were aligned using residues W385 and T433 in dSARM1ARM and W103 and V153 in hSARM1. NMN and NAD+ are shown in green and yellow stick representation, respectively. Labelled residues correspond to dSARM1, with equivalent hSARM1 residues shown in parentheses.
F Structural superposition of ARM8 in NMN-bound dSARM1ARM (slate) and ligand-free hSARM1 (magenta) suggests that the ARM domain would rotate and potentially clash with the ARM domain of adjacent subunits (magenta) upon NMN binding. Structure movements are indicated by black dashed arrows and SAM-TIR distances are indicated by dashed lines. Helices are presented as cylinders.
To assess the differential effects of NMN and NAD+ on the conformation of SARM1ARM, we compared the ARM-domain structures in NAD+-bound hSARM1 (Jiang et al., 2020), ligand-free hSARM1, and NMN-bound dSARM1ARM. The analysis confirms that NAD+ binds at the same allosteric site in the ARM domain as NMN, but the nicotinamide portion of NAD+ adopts a different conformation compared to NMN (Figure 5E). The pyridine ring of both NMN and NAD+ form π-stacking interactions with the conserved ARM1 tryptophan (W385 in dSARM1ARM; W103 in hSARM1), but in NMN-bound dSARM1ARM, the amide group interacts with the loop connecting ARM6 and ARM7, while in NAD+-bound hSARM1, the nicotinamide is flipped 180° and the amide group interacts with Q150. This is consistent with our dSARM1ARM 15N-TROSY-HSQC data (Figure 3D), which demonstrated that NMN and NAD+ interact differently with one of the tryptophan residues. The ARM domain of the NAD+-bound hSARM1 structure also displays an open conformation, highly similar to that of the inactive ligand-free hSARM1 structure, with an RMSD of 0.75 Å over 306 residues. Both the ligand-free and NAD+-bound hSARM1 structures are equally dissimilar to NMN-bound dSARM1ARM (Figure 5D). Further structural comparisons reveal that movement, relative to the inactive structure, of the loop connecting ARM1 and ARM2, and the helices H3 in ARM1 and H2 in ARM2 in NMN-bound dSARM1ARM would largely be prevented by the presence of NAD+ within the binding pocket. Presumably, this constrained movement is due to the presence of adenosine and ribose moieties in NAD+ preventing compaction of the ARM domain. This is most acutely demonstrated by residues W385 (W103 in hSARM1), T433 (V153 in hSARM1), and the loop region connecting ARM6 and ARM7 (H599-S602, Q320-G323 in hSARM1), which move further towards the center of the binding pocket by 2.4 Å, 2.6 Å, and 4.5 Å, respectively, in the NMN-bound dSARM1ARM structure, relative to NAD+-bound hSARM1 (Figure 5E). The nicotinamide-ribose moiety of NAD+ and NMN sharing the same binding site, and NAD+-bound hSARM1 closely mimicking our ligand-free hSARM1 structure are consistent with a model where NAD+ blocks NMN binding to prevent SARM1 activation.
As the C-terminus of the ARM domain is tethered to the octameric SAM ring, we predict this region is likely to exhibit less movement than other regions in the ARM domain upon NMN binding. Assuming hSARM1 ARM8 remains stationary upon NMN binding, the movement observed in the C-terminal region of NMN-bound dSARM1ARM (Figure 5D) would translate to rotation of the ARM domain. When ARM8 of NMN-bound dSARM1ARM is superimposed onto ligand-free hSARM1, ARM3 shifts significantly (8 Å) towards the adjacent ARM domain in the SARM1 octamer, and the loop connecting ARM1 and ARM2 moves ~10 Å towards ARM7 H3 (Figure 5F). This movement leads to a ~ 7 Å translation of the TIR domains, but the overall distance between the SAM and TIR domains remains ~34 Å, making it unlikely that the translation is sufficient to destabilize the ARM:TIR interaction (Figure 5F). However, the movement of ARM3 towards the adjacent ARM domain in the SARM1 octamer may also cause a steric clash between ARM domains and lead to changes in the ARM:SAM interface (Figure 5F). Analysis of the 2D classification of hSARM1 particles revealed several classes with only a partial ARM domain ring visible (Figure S6I), suggesting that the rotation of the ARM domain further destabilizes the ARM domain ring, resulting in complete dislodgement from the SAM domain octamer, with individual ARM domains becoming highly flexible. In this state, the ARM:TIR interaction observed in the inactive hSARM1 structure would be abolished, allowing release of the TIR domains and activation of SARM1.
Mutations in the NMN/NAD+ binding pocket block NMN- and injury-dependent SARM1 activation
We hypothesized that mutations in the NMN/NAD+-binding pocket would render SARM1 incapable of being activated by NMN in the absence of injury. Furthermore, if a change in the NMN/NAD+ ratio is the bona fide injury signal activating SARM1, mutations in this binding site should also block injury-induced axon degeneration. To test these hypotheses, we introduced site-directed mutations that alter amino acids in the four ARM-domain regions predicted to participate in NMN and NAD+ binding in dSARM1ARM and full-length hSARM1 (Figure 4B, S3E, S4F, Table S3). We tested the effect of these mutations on NMN- and NAD+-binding affinities and on SARM1 NADase activity. In parallel, we expressed selected mutants in Sarm1−/− neurons, and tested their ability to be activated by a direct increase in NMN levels, as well as by axonal injury.
Using ITC, we first tested the ability of dSARM1ARM mutants to bind NMN. The mutation of W385 (W103 in hSARM1) in region 1 to alanine completely blocks the NMN interaction (Figure S7A), while mutation of R437 (R157 in hSARM1) in region 2 to an alanine leads to an approximately two-fold reduction in NMN binding affinity (Kd = 12.45 ± 0.03 μM) (Figure S7B). Importantly, the W385A mutant binds neither NMN nor NAD+ (Figure S7C). Next, we investigated whether these and other mutants in the NMN/NAD+-binding pocket could be activated by NMN using our 1H NMR NADase assay. We found that the W103A, W103F, R157A and K193A mutants are not activated by NMN, while the E149A mutant is responsive to NMN (Figure 6A). Consistent with our dSARM1ARM ITC data, STD NMR analysis demonstrated that the W103A mutation leads to a complete loss of NMN binding (Figure 6B), while only residual STD NMR signals were observed for NAD+ (Figure S7D), the latter likely originate from NAD+ binding at the active site region in the TIR domain. Interestingly, the STD NMR signal of the ribose anomeric proton (H1’) of NMN almost doubled in the K193A mutant, whereas those of the nicotinamide ring (H2, H4, H5, and H6) of NMN showed only modest increases of roughly 25% (Figure 6B). Such variations in the change of STD NMR signals suggest that NMN binds to the K193A mutant in a different manner, which results in an inability to induce a conformational change capable of disrupting the ARM:TIR domain interactions. Similar variations in the change of STD NMR signals were also observed for NMN with the R157A mutant. By contrast, the STD NMR signals for NAD+ with the R157A and K193A mutants were reduced compared to the wild-type protein (Figure S7D), indicating that NMN and NAD+ engage differently with these residues.
Figure 6.
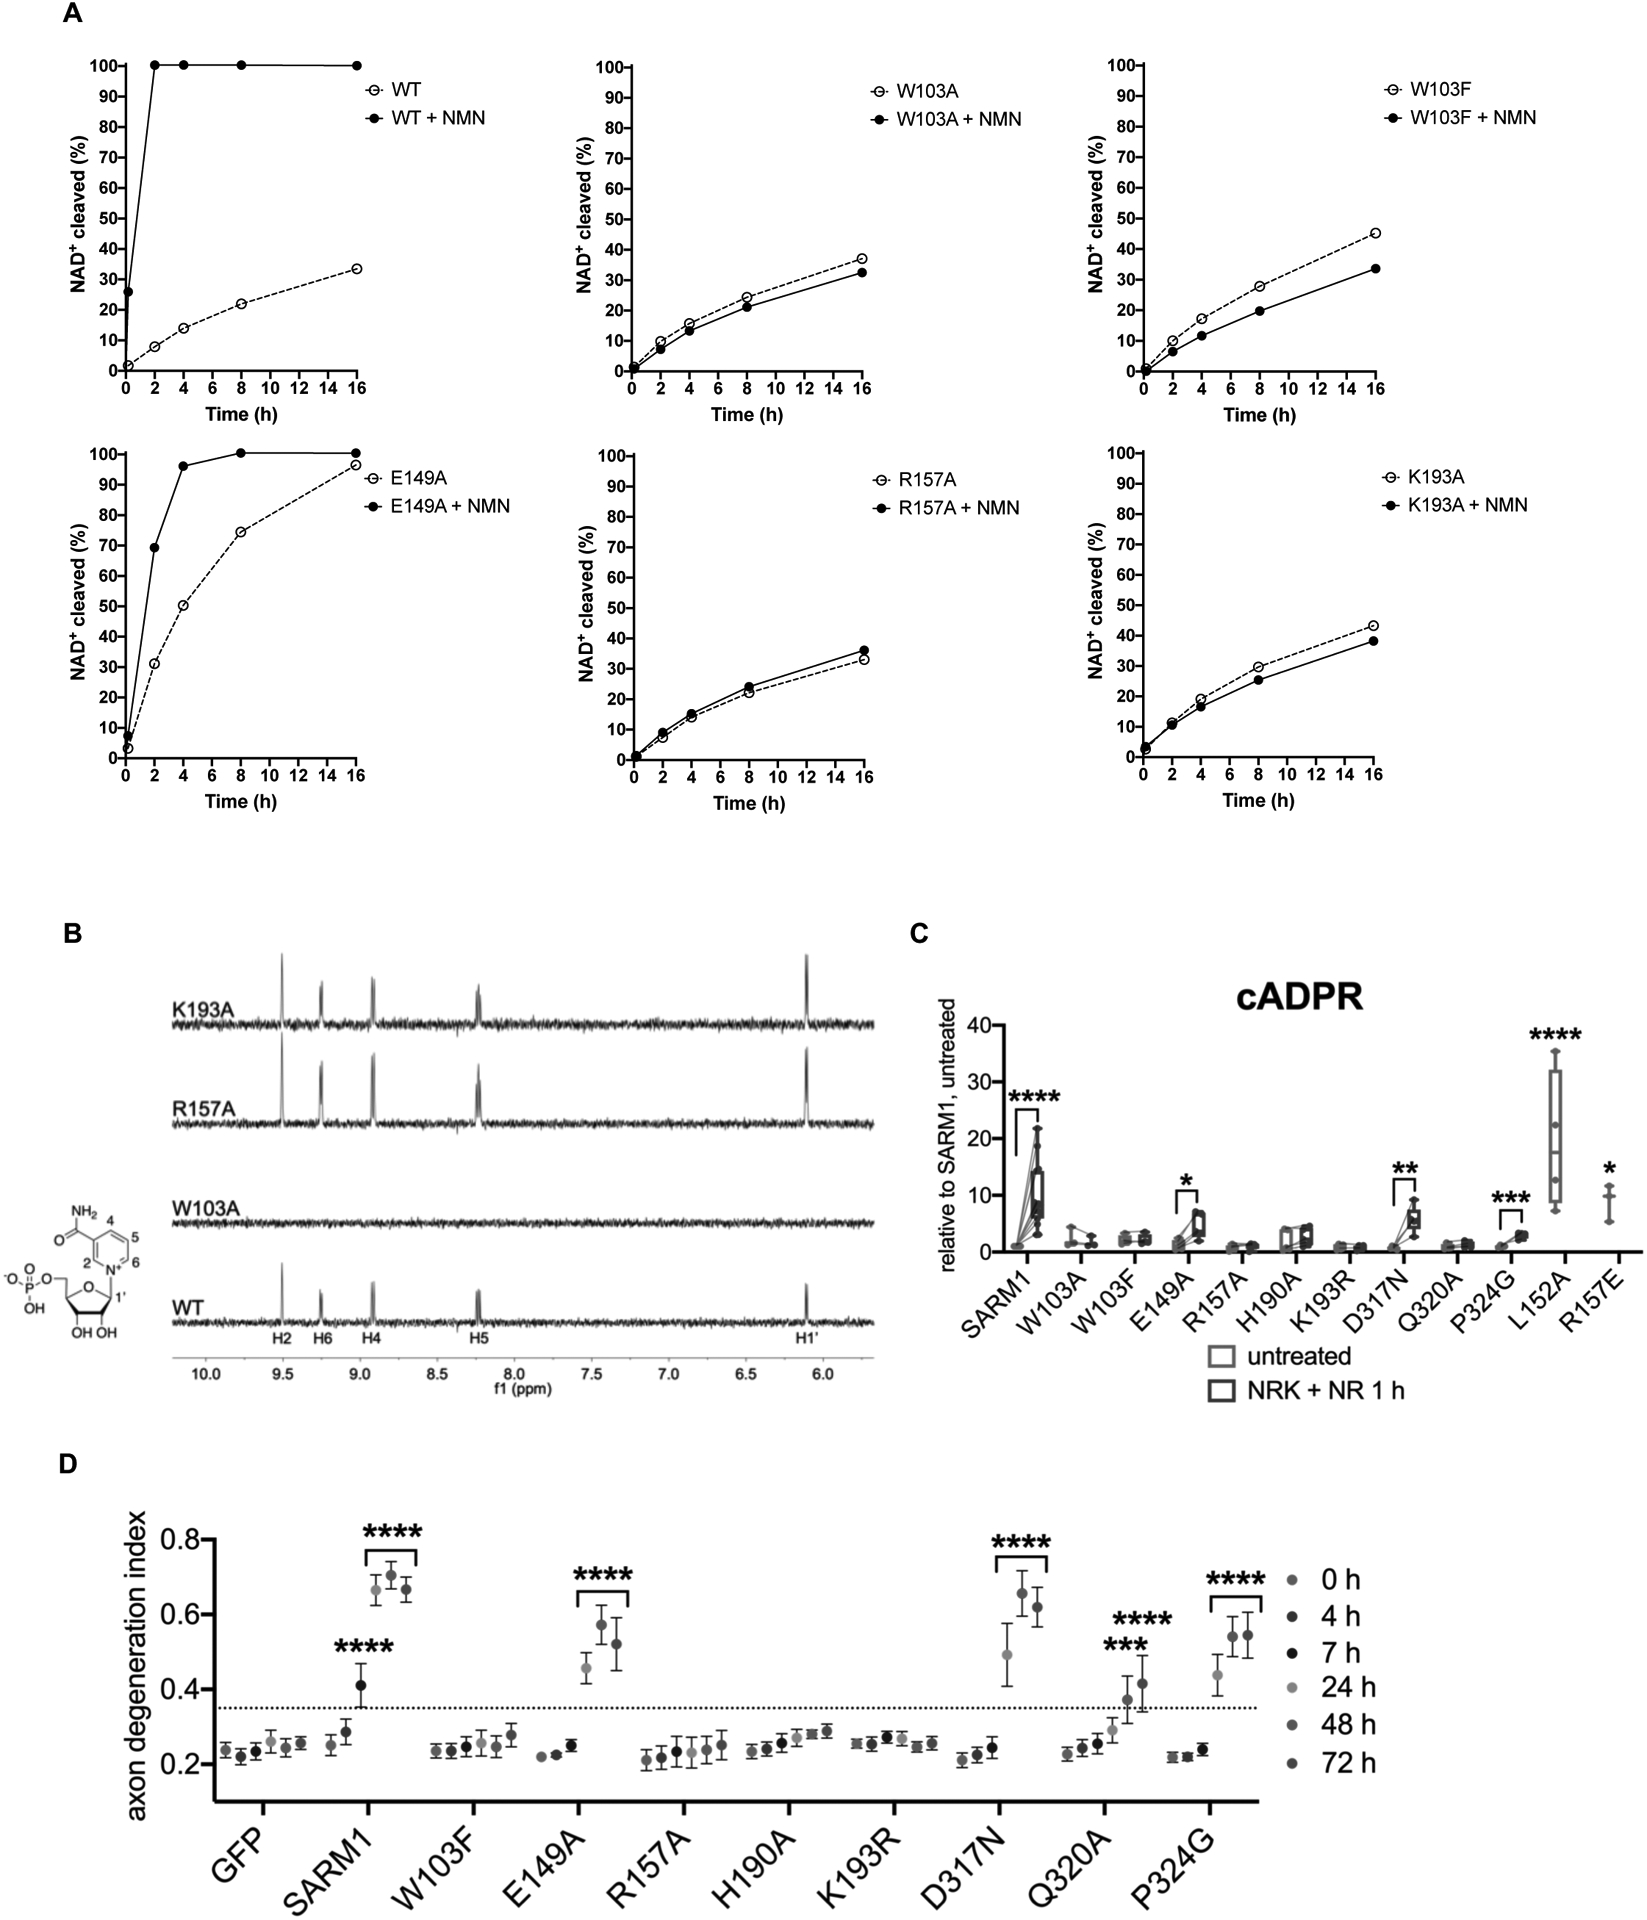
Mutations in the NMN-binding pocket of human SARM1 block NMN- and injury-dependent SARM1 activation.
A Multiple binding-site mutants disrupt NMN-activation of hSARM1 (500 nM) enzyme activity. The NMN concentration was 500 μM for all NMR samples.
B STD NMR spectra showing NMN (500 μM) binding to hSARM1 mutants (5.25 μM).
C cADPR levels from primary eDRG neurons from Sarm1−/− mice expressing wild-type or mutant SARM1 from lentivirus for 5 days, untreated or after 1 h NR [100 μM] treatment, relative to levels from untreated wild-type SARM1 expressing neurons, measured by LC-MS-MS. Data correspond to means from replicate experiments. The box represents the 25–75% and the whiskers extend to maximum and minimum values, to include all data points. Statistical significance was determined by unpaired t-tests comparing untreated to NRK + NR 1 h conditions. Lines connect paired data from individual biological replicates. Two-way ANOVA with Dunnett’s test for multiple comparisons was used to compare untreated SARM1 to untreated SARM1 L152A and R157E. * denotes P value=<0.05; **=<0.01; ***=<0.001; ****=<0.0001.
D Axon degeneration time course after axotomy in primary eDRG neurons from Sarm1−/− mice expressing wild-type or mutant SARM1 from lentivirus, quantified as degeneration index (DI), where a DI of 0.35 or above represents degenerated axons. Data correspond to means from replicate experiments and error bars denote ±SEM. Statistical significance was determined by two-way ANOVA with Dunnett’s multiple comparison test, comparing each time-point to time 0 h within each condition. * denotes P value=<0.05; **=<0.01; ***=<0.001; ****=<0.0001.
See also Figure S7.
We next asked whether these SARM1 mutants are activated in response to high NMN in the absence of injury in neurons. Expression of SARM1 variants was very similar to that of wild-type SARM1 (Figure S7E). To increase NMN in primary neurons, we combined overexpression of NRK1 with 1 h NR treatment. In Sarm1−/− DRG neurons, human SARM1 expressed by lentivirus responds to high NMN by significantly increasing cADPR, as observed with endogenous mouse SARM1 (Figure 6C). Using cADPR production as a measure of SARM1 activity, we found that mutations in region 1 (W103A or W103F), region 2 (R157A), region 3 (H190A, K193A, K193R) and region 4 (Q320A) completely abolished the ability to respond to NMN (Figure 6C and S7F). W103A, W103F, H190A and K193A demonstrate very low constitutive activity, producing slightly more cADPR at baseline than wild-type SARM1 (Figure 6C and S7F). The mutations E149A in region 2, and D317N and P324G in region 4 each show a partial response to NMN by modestly increasing cADPR (Figure 6C). As such, mutating residues in each of these four prospective NMN-binding regions (Figure 4B) renders SARM1 completely insensitive to NMN-dependent activation. These results are consistent with our in vitro enzymatic activity assays (Figure 6A). The identification of mutations in the NMN-binding pocket that result in low constitutive SARM1 activity (W103A, W103F, H190A, and K193A) suggest they induce an altered, partially active conformation. Interestingly, mutating R157 to glutamate (R157E) instead of alanine leads to a dramatic increase in constitutive activity that is on par with NMN-activated wild-type SARM1. A similar result occurs upon mutation of the nearby residue L152 to alanine (L152A) (Figure 6C). The identification of site-directed mutants within the NMN/NAD+-binding domain that lead to fully active SARM1 suggests that these mutants may mimic the NMN-bound form of the ARM domain.
If increased NMN is the important signal for SARM1 activation after nerve injury, then NMN-binding mutants should be unable to be activated by axon injury to mediate axonal degradation. Therefore, we tested if NMN-binding mutants can mediate axon degeneration after axotomy in primary mouse neurons. We expressed SARM1 mutants in Sarm1−/− DRG neurons and examined their ability to promote axonal degeneration. Expression of wild-type human SARM1 triggers axon degeneration by 7 h post-axotomy (Figure 6D), which is very similar to the time-course mediated by endogenous mouse SARM1 (Sasaki et al., 2009). Mutants in all four NMN-binding regions are profoundly defective in mediating injury-induced axon degeneration. When expressed in Sarm1−/− neurons, W103F, R157A, H190A, K193A and K193R are all severe loss-of-function mutations for injury-induced axon degeneration and are indistinguishable from the GFP control, with no discernible axon degeneration for at least 72 h post-injury (Figure 6D and S7G). Q320A also shows a very strong loss-of-function phenotype; however, it does promote mild, severely delayed axon degeneration (Figure 6D). E149A, D317N and P324G, which are partially responsive to NMN, lead to a modest loss-of-function phenotype with slower, but significant, axon degeneration (Figure 6D). Thus, SARM1 mutants that are not activated by NMN are also not activated by axotomy, consistent with the model that NMN is a bona fide injury signal for SARM1 activation in the axon.
DISCUSSION
SARM1 is the central executioner of pathological axon degeneration and is an inducible NAD+-cleavage enzyme that is activated by the loss of the NAD+ biosynthetic enzyme NMNAT2 (Figley and DiAntonio, 2020). Here, we define the molecular mechanism of SARM1 activation. SARM1 is a metabolic sensor activated by an increase in the NMN/NAD+ ratio via the competitive binding of these metabolites to an allosteric pocket in the N-terminal auto-regulatory ARM domain of SARM1. We demonstrate that binding of NMN to this allosteric pocket induces conformational changes in the SARM1 ARM domain, which enables the activation of NADase activity in the C-terminal TIR domain. This TIR-mediated degradation of residual NAD+ ultimately helps drive the destruction of the axon. Hence, these findings resolve the long-standing mystery of how NMNAT2, an NAD+ biosynthetic enzyme, counteracts the function of SARM1, an NAD+-cleaving enzyme. It does not do so via the direct regulation of NAD+ levels downstream of SARM1, but instead it indirectly regulates the activation state of SARM1. Delineating the mechanism of SARM1 activation identifies SARM1 as a metabolic sensor that, upon the loss of NAD+ biosynthesis, initiates a positive feedback loop, ultimately resulting in catastrophic NAD+ depletion and axon self-destruction (Figure 7).
Figure 7.
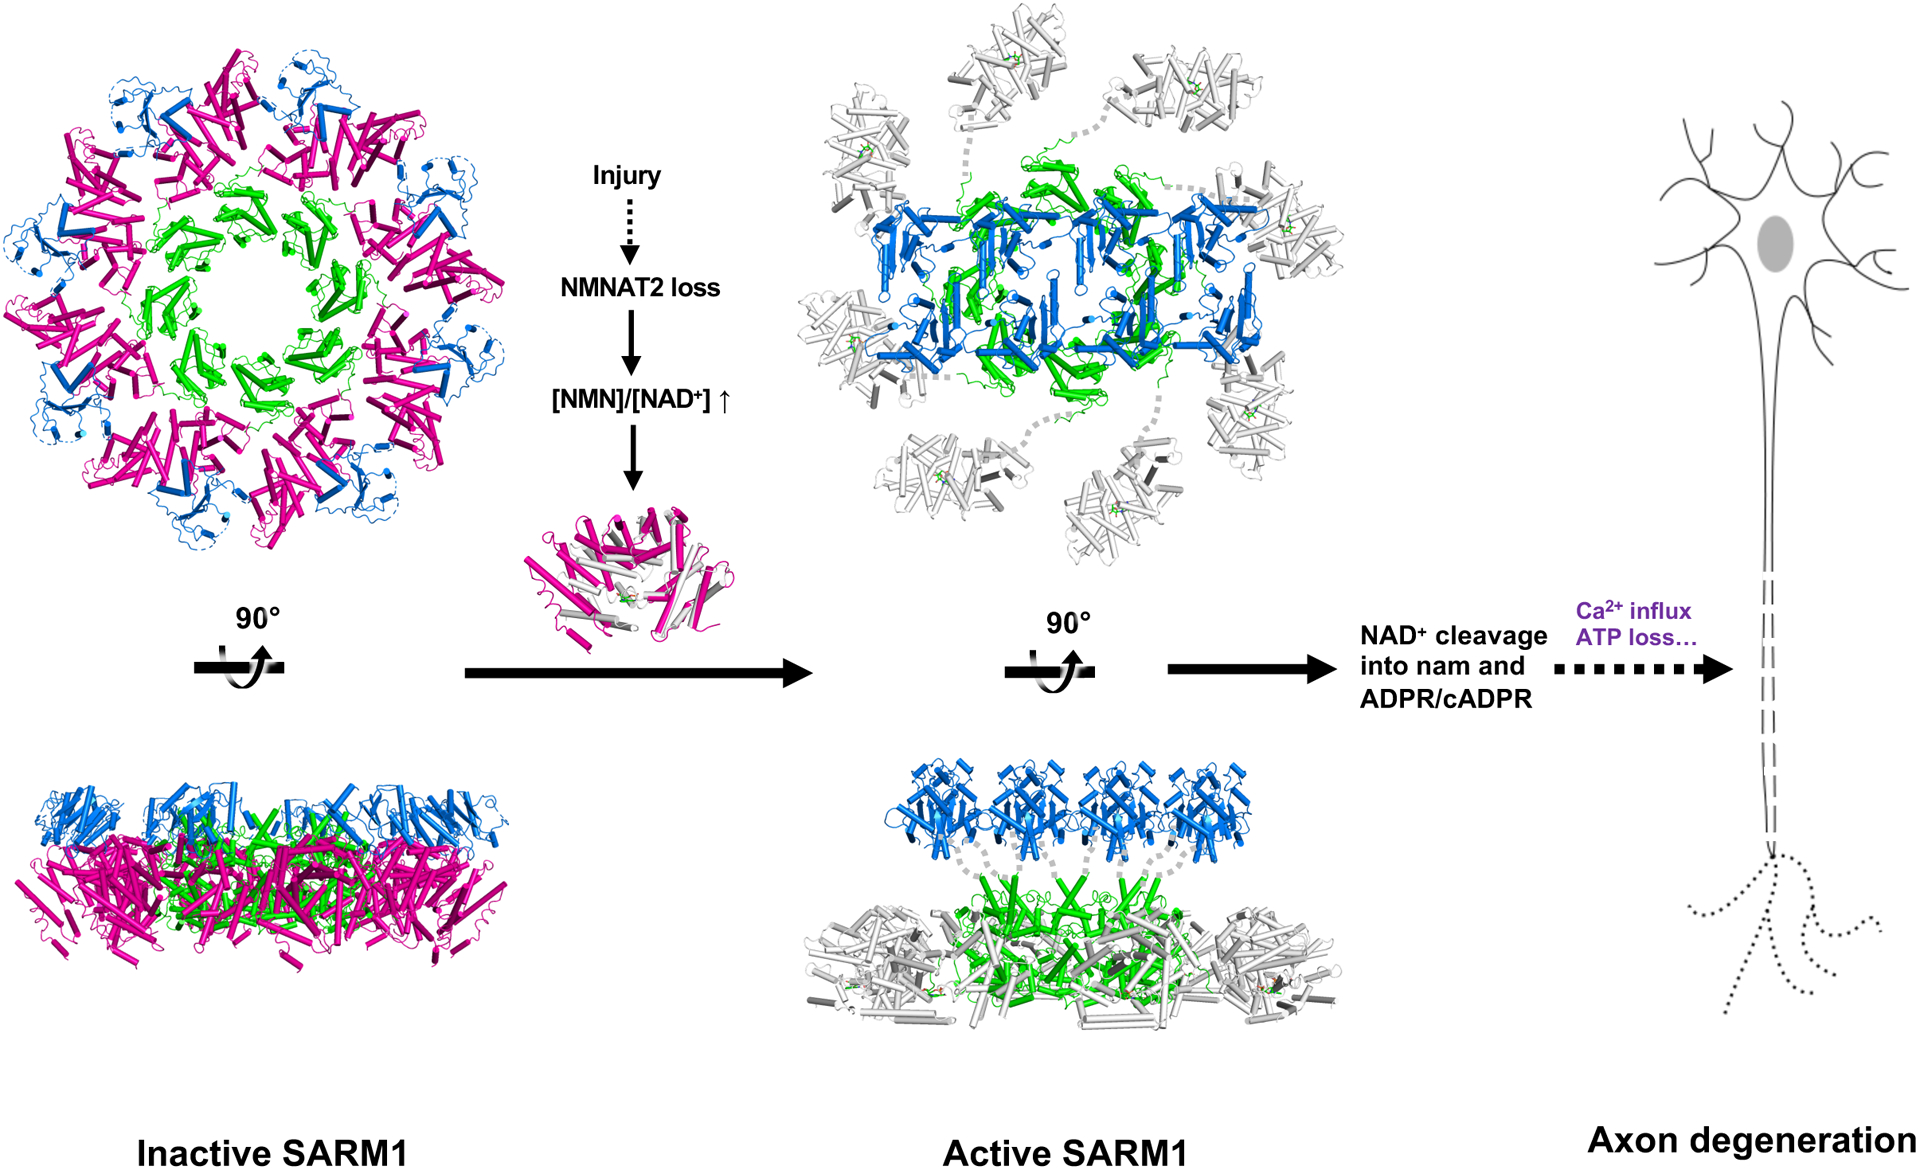
Schematic model of SARM1 activation.
In the inactive state, the ARM domain (magenta) interacts with the TIR domain (blue), separating it from the neighboring TIR domains. Upon injury, NMN interaction induces a more compact conformation of the ARM domain (grey), which leads to destabilization of the peripheral ARM domain ring, and disruption of the ARM:TIR lock. This permits the TIR domains to associate with each other, form the catalytic site, cleave NAD+, and trigger axon degeneration. The SAM domains are shown in lime.
SARM1 is a metabolic sensor of NMNAT function
NMNAT biosynthetic enzymes condense NMN and ATP to form NAD+. Hence, by sensing the NMN/NAD+ ratio as a trigger for activation, SARM1 is exquisitely tuned to the change in metabolite levels that occurs upon the loss of NMNAT enzyme function. Importantly, this mechanism ensures that SARM1 is only temporarily activated in situations where NMN is increased in the presence of NMNAT2, because NMN is efficiently converted to NAD+ and the NMN/NAD+ ratio will quickly return to baseline. Thus, SARM1 activity will be relatively stable to momentary increases in NMN levels, such as might occur with intake of its dietary precursor nicotinamide (vitamin B3). Similarly, if vitamin B3 were limiting, then both NMN and NAD+ levels could be significantly decreased, yet the NMN/NAD+ ratio would remain unchanged and SARM1 would remain inactive. In this way, SARM1 remains auto-inhibited, despite changes in the cellular energy status reflected in alterations of the flux of NMN and NAD+, but can be activated by loss of NMNAT enzyme function, which causes rapid increases in NMN and decreases in NAD+. Indeed, this mechanism explains the activation of SARM1 in response to the loss of either NMNAT2 in the axon (Gilley et al., 2015) or NMNAT1 in photoreceptors (Sasaki et al., 2020b). Moreover, this mechanism could have meaningful implications for people taking the popular nutritional supplement nicotinamide riboside (NR) (Mehmel et al., 2020). NR bypasses NAMPT, the rate-limiting enzyme in the NAD+ biosynthetic pathway, and so is more efficiently converted to NMN than is nicotinamide, a more common form of vitamin B3. In the nerves of healthy people with normal levels of axonal NMNAT2, SARM1 likely remains mostly inactive after NR treatment, because the increased levels of NMN are efficiently converted to NAD+ by NMNAT2. However, in conditions where axonal NMNAT2 levels are compromised, such as peripheral neuropathy or traumatic injury, increases in NMN stimulated by NR treatment could pathologically activate SARM1 and lead to further axon damage. This possibility will need to be assessed in the ongoing clinical trials examining the efficacy of NR treatment for various neuropathies.
The roles of NMN and NAD+ binding in SARM1 activation
The basal ratio of NMN to NAD+ in axons is not yet known, because their absolute concentrations have yet to be determined within the axonal compartment. However, in most cells, NAD+ levels are much greater than NMN levels (Formentini et al., 2009). NAD+ levels are 2–3 orders of magnitude higher than NMN in DRG neurons (Liu et al., 2018) and 1–2 orders of magnitude higher in mouse sciatic nerves (Di Stefano et al., 2015). These ratios are consistent with a model where the SARM1 allosteric pocket is bound to NAD+ at baseline and SARM1 is auto-inhibited. The SARM1 ARM domain binds either one molecule of NMN or NAD+ in a competitive manner, and binds NMN more tightly, observations consistent with an increased NMN/NAD+ ratio serving as a SARM1 activation signal. The binding affinity data are derived from the Drosophila ARM domain, and so it is difficult to compare quantitatively the binding data to the changes in metabolite levels that activate mammalian SARM1. However, we can estimate the range of metabolite changes necessary for SARM1 activation in mammalian neurons—the NR treatment used to raise NMN and the TNT NADase expression used to lower NAD+ both lead to >10x increase in the NMN/NAD+ ratio, which robustly activates SARM1. In contrast, conditions that lead to a 2–3 fold increase in the NMN/NAD+ ratio do not activate SARM1 (Figure 2E). We propose that as the NMN/NAD+ ratio increases past this threshold, NMN binding at the allosteric site transforms hSARM1 to its active state, the local concentration of NAD+ drops and the proportion of hSARM1ARM bound by NMN increases, resulting in feed-forward activation of the SARM1 NADase.
NMN binding activates SARM1, while NAD+ binding inhibits SARM1 activation. Two models could explain the inhibitory effects of NAD+: 1) NAD+ binding could actively stabilize the auto-inhibited state; and 2) NAD+ binding could block NMN binding and so prevent the compaction of the ARM domain that drives SARM1 activation. These mechanisms are not mutually exclusive. Two recent studies proposed that NAD+ binding directly promotes SARM1 auto-inhibition, because mutants in the NAD+-binding site lead to constitutively active SARM1 (Jiang et al., 2020; Sporny et al., 2020). However, this does not demonstrate that NAD+ binding is stabilizing the auto-inhibited state, because a number of mutations in the ARM domain unrelated to NAD+ binding can also lead to robust constitutive activation of SARM1 (Bratkowski et al., 2020; Jiang et al., 2020; Shen et al., 2021). We addressed this question in two ways. First, we demonstrated biochemically that NAD+ inhibits NMN-dependent activation of SARM1 but does not significantly inhibit SARM1 in the absence of NMN activation. Second, we identified a mutant, W103A, that cannot bind NMN or NAD+, and when expressed in Sarm1−/− neurons, this mutant is almost completely inactive in the absence of injury and is not activatable by an increase in NMN. Hence, the default state of SARM1, i.e. with the ARM domain not bound to either NMN or NAD+, is inactive or nearly inactive, and is dramatically less active than either wild-type SARM1 after injury or bona fide constitutively active SARM1 mutants such as R157E or L152A. Taken together, these data strongly support the model that the inhibitory role of NAD+ is primarily due to competition with NMN binding and blockade of the NMN-dependent activation of SARM1.
SARM1 activation mechanism
Our structural studies have revealed the molecular basis for NMN binding to the SARM1 ARM domain, and demonstrate that SARM1 is auto-inhibited by spatially separating the TIR domains from each other via binding to the ARM domains. We further showed that the ARM domain undergoes conformational changes upon NMN binding. We propose that SARM1 activation involves the following steps (Figure 7).
First, NMN binding leads to a more closed ARM domain conformation. Our mutagenesis data suggest that this compaction is driven, in part, by the interaction of R157 and K193 with the phosphate moiety of NMN, as the R157A and K193A mutants of hSARM1 are able to bind NMN, but do not become activated. Next, NMN-induced ARM domain compaction leads to a rotation of the ARM domain, which results in destabilisation of the ARM:ARM and ARM:SAM interfaces and, consequently, the dislodgement of the ARM domains from the octameric SAM domain ring. These effects are likely to add significant strain on the SAM-TIR linker, resulting in disruption of the ARM:TIR lock. Finally, the TIR domains self-associate to form a functional catalytic site and subsequently cleave NAD+ into nicotinamide and ADPR/cADPR (Essuman et al., 2017; Gerdts et al., 2015; Horsefield et al., 2019). Structural information for the TIR domains in the context of the active state of full-length SARM1 is not currently available, however our previously reported crystal structures of SARM1TIR revealed antiparallel two-stranded open-ended assemblies of TIR domains, and mutations of residues involved in the interactions between subunits within each strand (D594A, E596K, and G601P) and between the two strands (L579A and H685A) abolished SARM1 NADase activity (Horsefield et al., 2019). We therefore speculate that upon NMN-induced SARM1 activation, at least four TIR domains come together, as observed in the SARM1TIR crystal structure, to form the catalytic site and activate the NADase function. In support of this hypothesis, two recent cryo-EM structures of plant TIR domain-containing proteins with NADase activity, Roq1 and RPP1, were determined (Ma et al., 2020; Martin et al., 2020) In the activated state, the TIR domains in both Roq1 and RRP1 form a tetramer, analogous to TIR:TIR interactions observed in the SARM1TIR crystal structure. The lack of any density for the TIR-domain assembly in the activated form of SARM1 (Bratkowski et al., 2020) suggests that, in the case of SARM1, the TIR domains remain dynamic and may rapidly associate and dissociate while hydrolysing NAD+. It is plausible that the oligomeric form of the TIR domain corresponds to a transition state of the enzyme and is only stable when bound to NAD+, and rapidly disassociates once NAD+ is cleaved. As such, use of non-cleavable analogues of NAD+ or molecules stabilising the oligomeric assembly of the TIR domains may be necessary to capture a structure of the SARM1 active state.
Therapeutic implications of the SARM1 activation mechanism
SARM1 activation drives pathological phenotypes in many neurodegenerative diseases, including peripheral neuropathy, traumatic brain injury, glaucoma, and retinal degeneration. Because SARM1 is an enzyme that cleaves a small molecule, there is great interest in developing SARM1 enzyme inhibitors as candidate therapies for neurodegenerative disorders (Hughes et al., 2021; Krauss et al., 2020; Loring et al., 2020). Our discovery of an allosteric pocket that binds both an activating metabolite, NMN, as well as a countervailing inhibitory metabolite, NAD+, has important implications for drug discovery. Identification of high-affinity ligands that could mimic NAD+ and block NMN binding or otherwise stabilize the inactive conformation of the ARM domain, would be predicted to lock SARM1 in an inactive state. Conversely, high-affinity NMN mimetics that bind the allosteric pocket and activate SARM1 are predicted to induce robust axon degeneration. Hence, it will be important to identify other endogenous or exogenous metabolites that bind the allosteric pocket and regulate SARM1 activity (Loreto et al., 2020), as these may be important determinants of axon stability and/or axon loss and are potential environmental contributors to neurodegenerative disorders. The discovery of the SARM1 allosteric pocket and the mechanism of activation therefore greatly expand our understanding of SARM1 as a druggable target, with implications for a wide-range of human neurodegenerative diseases.
STAR METHODS
RESOURCE AVAILABILITY
Lead Contact
Further information and requests for resources and reagents should be directed to and will be fulfilled by the Lead Contact, Thomas Ve (t.ve@griffith.edu.au).
Materials availability
Some unique/stable reagents may be available from the Lead Contact with a completed Materials Transfer Agreement. Restrictions may apply on some of the reagents due to limited availability and prioritization for internal use. Plasmids generated in this study are available upon request.
Data and code availability
Ligand-free and NMN bound dSARMARM crystal structures have been deposited in the Protein Data Bank (7LCY and 7LCZ), respectively. The ligand-free hSARM128–724 cryo-EM map and structure have been deposited to the Electron Microscopy Data Bank (EMD-23278 and Protein Data Bank (7LDO), respectively.
EXPERIMENTAL MODEL AND SUBJECT DETAILS
Culture of mouse primary embryonic DRG neurons
All animal experiments were performed in accordance with the policies and guidelines of the Institutional Animal Care and Use Committee (IACUC) of Washington University in St. Louis (specific protocols #20-0020 and #20-0484). Embryonic DRG spot cultures were prepared as described previously (Sasaki et al., 2016). Briefly, DRGs were cultured from embryonic day 12.5–13.5 wild-type CD1 (Charles River Laboratories (Wilmington, MA)) or Sarm1−/− timed-pregnant mice (Szretter et al., 2009) on plates coated with poly-D-lysine and laminin. Neurobasal culture medium (Thermo-Fisher (Waltham, MA); Cat.#21103049) was supplemented with 2% B27, 50 ng/mL nerve growth factor (Envigo Bioproducts (Indianapolis, IN); Cat.#B5017), and 10 μM 5-fluoro-2’-deoxyuridine (Sigma-Aldrich (St. Louis, MO); Cat.#F0503) and 10 μM uridine (Sigma-Aldrich (St. Louis, MO); Cat.#U3003). On DIV5, half the media was removed and replaced with new media. All experiments were performed at DIV6–7.
Expression of dSARM1ARM in E. coli
Plasmids encoding dSARM1ARM constructs were transformed into E. coli BL21 (DE3) or B834 (DE3) cells, and grown on LB (lysogeny broth) agar plates containing 100 μg/mL ampicillin at 37 °C overnight. Colonies were inoculated into 10 mL of LB media containing 100 μg/mL ampicillin, and incubated at 37 °C, 225 rpm overnight. For large-scale protein production, 1 mL of LB overnight culture of transformed E. coli BL21 (DE3) cells was inoculated into 1 L of auto-induction media (Studier, 2005) containing 100 μg/mL ampicillin and incubated at 37 °C, 225 rpm until OD600 reached 0.8 – 1. The temperature was then decreased to 20 °C for overnight expression.
To produce labelled proteins, 1 mL of LB overnight culture of transformed E. coli B834 (DE3) cells (for selenomethionine (SeMet)-labelled protein) or BL21 (DE3) cells (for 15N-labelled protein) was inoculated into 1 L of M9 minimal media containing 1 × M9 salt (NH4Cl was replaced by 15NH4Cl for 15N labelling), 1 × trace elements solution, 0.4% glucose, 1 mM MgSO4, 0.3 mM CaCl2, 1 × BME vitamin solution (Sigma-Aldrich) and 100 μg/mL ampicillin. The bacteria were grown at 37 °C, 225 rpm until OD600 reached 0.8 – 1. The temperature was then decreased to 20 °C for a 30-min incubation. For the expression of the SeMet protein, 1 mL of 50 mg/mL SeMet solution was added to 1 L of culture. The expression was induced by adding 1 mL of 1 M IPTG (isopropyl β-D-1-thiogalactopyranoside) at 20 °C, 225 rpm for overnight expression.
Expression of hSARM1 in HEK293T cells
HEK293T cells (ATCC) were grown in 50% Freestyle 293 Expression Medium (Gibco) and 50% Ex-Cell 293 Medium (Sigma) supplemented with 3% L-Glutamine in vented flasks at 90 rpm in an 80% humidified, 8% carbon dioxide atmosphere at 37°C. When cells reached a density of 2 × 10⁶ cells/mL they were centrifuged at 500g for 10 min and resuspended in 100% Freestyle 293 Expression Medium to a density of 2.5 ×10⁶ cells/ml. After resuspension the cells were transfected with 3 μg/mL of plasmid DNA using Polyethylenimine (PEI) transfection reagent (Polysciences) and growth was continued overnight. On the next day, transfected cells were diluted 1:1 with Ex-Cell 293 Medium and valproic acid (VPA) was added to a final concentration of 2.2 mM. Growth was continued for an additional three days. Cells were harvested by centrifugation at 1,500 g for 10 min at 4°C and stored at −80°C until used for purification.
METHOD DETAILS
Chemicals
Nicotinamide riboside (NR) was a gift from ChromaDex, Inc. (Los Angeles, CA). Deuterium-labelled nicotinamide (Nicotinamide-2,4,5,6-d4 (D4-Nam)) was obtained from C/D/N Isotopes Inc. (Pointe-Claire, QC, Canada). NR and D4-Nam were dissolved in water at 100 mM and stored at −20 °C. CZ-48 was obtained from Wuxi AppTec (Shanghai, China). CZ-48 was dissolved in DMSO at 250 mM and stored at −20 °C. FK866 was obtained from the National Institute of Mental Health Chemical Synthesis and Drug Supply Program (NIMH code F-901), solubilized in DMSO at 100 mM and stored at −20 °C.
Plasmids
Lentiviral transfer plasmids containing cDNAs were based on the FUGW plasmid (a gift from David Baltimore, Addgene (Watertown, MA); Cat. #14883) (Araki et al., 2004). The plasmid with cDNA to express mouse NRK1 was described previously (Sasaki et al., 2016). SARM1 plasmids were cloned with tandem T2A/P2A self-cleaving peptide sequences C-terminal to the SARM1 human cDNA and followed by Venus fluorescent protein. For experiments in primary neurons, human SARM1 cDNA encoded the full-length human SARM1 protein (724 amino acids) (NCBI Reference Sequence NP_055892.2). In-Fusion HD Cloning Plus kit (Takara Bio USA (Mountain View, CA); Cat. #638920) was used for site-directed mutagenesis of cDNAs. All plasmids were verified by Sanger sequencing (Genewiz, South Plainfield, NJ).
The amino-acid sequence of tuberculosis necrotizing toxin (TNT) was obtained from outer membrane channel protein/necrotizing toxin glycohydrolase (CpnT) of Mycobacterium tuberculosis (strain ATCC 25618 / H37Rv, accession number: WP_003899759) (Sun et al., 2015). The TNT domain corresponding to the region between R651 and E846, with human NMNAT2 intron 9, inserted between E745 and K746 (in order to prevent bacterial toxicity during plasmid amplification), was codon-optimized using codon-optimization tool (IDT) and the double-strand DNA containing additional nucleotides necessary for DNA assembly (In-Fusion, Takara) was synthesized (gBlocks, IDT). The DNA fragment was cloned into BamHI (5’ end of TNT) and NheI (3’ end of TNT) sites of FCIV (Araki et al., 2004). The mutant TNT lacking NAD+ glycohydrolase activity (R780A (Sun et al., 2015)) was generated by PCR. Briefly, forward and reverse mutagenesis primers harboring the R780A mutation in the middle of each primer were used to generate two TNT DNA fragments including R651 to S786 and A775 to E846, by PCR. The PCR amplified fragments and FCIV cut with BamHI and NheI were assembled using In-Fusion cloning. The constructs were verified by sequencing.
-
Codon-optimized TNT sequence:
CGG CTG TCA GAT GAA GCC GTC GAC CCA CAA TAC GGT GAG CCA CTT TCA CGG CAT TGG GAT TTC ACA GAT AAT CCC GCC GAC AGATCC CGG ATC AAT CCC GTC GTG GCA CAG CTC ATG GAA GAC CCT AAC GCA CCA TTT GGA CGA GAC CCA CAA GGC CAA CCT TAT ACTCAG GAG AGG TAT CAG GAG AGA TTC AAC TCT GTC GGT CCC TGG GGT CAG CAA TAT AGC AAC TTT CCT CCA AAT AAT GGA GCC GTCCCC GGC ACT AGG ATA GCC TAC ACT AAC CTC GAA AAG TTT TTG TCC GAC TAT GGA CCT CAA CTG GAT CGG ATC GGT GGA GAC CAGGGA AAA TAC CTT GCC ATA ATG GAG CAT GGT AGA CCC GCA TCA TGG GAG CAG CGA GCT CTT CAT GTC ACC TCC CTT AGA GAC CCATAT CAT GCT TAC ACT ATT GAC TGG CTG CCT GAG GGC TGG TTC ATT GAA GTG TCA GAG GTG GCA CCT GGT TGC GGC CAG CCT GGTGGG TCA ATA CAA GTT AGA ATT TTC GAT CAT CAG AAC GAA ATG AGA AAA GTA GAG GAG TTG ATA CGG AGA GGT GTG CTT CGA CAG
-
Codon-optimized TNT with human NMNAT2 intron 9 (lower case):
ATGGACTACAAGGATGACGATGACAAGCGGCTGTCAGATGAAGCCGTCGACCCACAATACGGTGAGCCACTTTCACGGCATTGGGATTTCACAGATAATCCCGCCGACAGATCCCGGATCAATCCCGTCGTGGCACAGCTCATGGAAGACCCTAACGCACCATTTGGACGAGACCCACAAGGCCAACCTTATACTCAGGAGAGGTATCAGGAGAGATTCAACTCTGTCGGTCCCTGGGGTCAGCAATATAGCAACTTTCCTCCAAATAATGGAGCCGTCCCCGGCACTAGGATAGCCTACACTAACCTCGAAgtgagtcctccatcctgctagtgcatctgtgttatggcccttctctgagagtcctggcagctggaggagtgagagagcaaaaggagtttagtgggagggactggcaactgactctgtctgctctgtcctcagAAGTTTTTGTCCGACTATGGACCTCAACTGGATCGGATCGGTGGAGACCAGGGAAAATACCTTGCCATAATGGAGCATGGTAGACCCGCATCATGGGAGCAGCGAGCTCTTCATGTCACCTCCCTTAGAGACCCATATCATGCTTACACTATTGACTGGCTGCCTGAGGGCTGGTTCATTGAAGTGTCAGAGGTGGCACCTGGTTGCGGCCAGCCTGGTGGGTCAATACAAGTTAGAATTTTCGATCATCAGAACGAAATGAGAAAAGTAGAGGAGTTGATACGGAGAGGTGTGCTTCGACAG*
-
Codon-optimized mutant TNT (Arg780Ala) with human NMNAT2 intron 9 (mutated nucleotides are underlined):
ATGGACTACAAGGATGACGATGACAAGCGGCTGTCAGATGAAGCCGTCGACCCACAATACGGTGAGCCACTTTCACGGCATTGGGATTTCACAGATAATCCCGCCGACAGATCCCGGATCAATCCCGTCGTGGCACAGCTCATGGAAGACCCTAACGCACCATTTGGACGAGACCCACAAGGCCAACCTTATACTCAGGAGAGGTATCAGGAGAGATTCAACTCTGTCGGTCCCTGGGGTCAGCAATATAGCAACTTTCCTCCAAATAATGGAGCCGTCCCCGGCACTAGGATAGCCTACACTAACCTCGAAgtgagtcctccatcctgctagtgcatctgtgttatggcccttctctgagagtcctggcagctggaggagtgagagagcaaaaggagtttagtgggagggactggcaactgactctgtctgctctgtcctcagAAGTTTTTGTCCGACTATGGACCTCAACTGGATCGGATCGGTGGAGACCAGGGAAAATACCTTGCCATAATGGAGCATGGTAGACCCGCATCATGGGAGCAGGCAGCTCTTCATGTCACCTCCCTTAGAGACCCATATCATGCTTACACTATTGACTGGCTGCCTGAGGGCTGGTTCATTGAAGTGTCAGAGGTGGCACCTGGTTGCGGCCAGCCTGGTGGGTCAATACAAGTTAGAATTTTCGATCATCAGAACGAAATGAGAAAAGTAGAGGAGTTGATACGGAGAGGTGTGCTTCGACAG*
-
Arg780Ala mutagenesis primers:
R651 to S786 Forward: GTAGACCCGCATCATGGGAGCAGGCAGCTCTTCATGTCACCTCCCTTA
-
R651 to S786 Reverse:
GGCGGATCACCGGTAGCTAG
-
A775 to E846 Forward:
TTGGGCTGCAGGTCGACTCTAGAG
A775 to E846 Reverse: TAAGGGAGGTGACATGAAGAGCTGCCTGCTCCCATGATGCGGGTCTAC
For Drosophila SARM1, isoform F was used as the reference sequence (NP_001036594.1). The cDNAs corresponding to the N-terminal ARM domain of Drosophila SARM1 (residues 307–678, dSARM1ARM; and residues 315–678, dSARM1ARM315), codon-optimized for E. coli expression, were cloned into the pMCSG7 expression vector at the SspI site using ligation-independent cloning (Stols et al., 2002) yielding a construct with a N-terminal His6-tag followed by a TEV-protease cleavage site.
For protein production in HEK293T cells the cDNA coding for human SARM1 (NP_055892.2) lacking the mitochondrial localisation signal (residues 28–724; hSARM1), and codon-optimized for expression in human cell lines, was cloned into the PSF-CMV-AMP vector (Sigma Aldrich) via the NcoI and XbaI restriction sites yielding a construct with a N-terminal His6-tag followed by a TEV-protease cleavage site and an AVI-tag.
The dSARM1ARM and hSARM1 mutants were produced using Q5® Site-Directed Mutagenesis (New England BioLabs).
Plasmids of hSARM1 and dSARM1ARM (wild-type and mutants) were prepared by transforming into E. coli NEB 5-alpha competent cells using heat-shock at 42 °C for 45 s. The transformed E. coli cells were grown on LB agar plates containing 100 μg/mL ampicillin. A single colony was inoculated into 10 mL of LB media containing 100 μg/mL ampicillin, and incubated at 37 °C, 225 rpm overnight. Pure plasmids were prepared using the QIAprep Spin Miniprep Kit (Qiagen) and the sequences were confirmed by the Australian Genome Research Facility (AGRF).
Lentiviral transduction
Lentivirus was produced by transfecting HEK293T cells with a transfer plasmid of interest, pCMV-VSV-G (Addgene (Watertown, MA), Cat.#8454, a gift from Bob Weinberg) and psPAX2 (Addgene (Watertown, MA), Cat.#12260, a gift from Didier Trono) plasmids using FuGENE® 6 Transfection Reagent (Promega (Madison, WI); Cat.#E2691). For transfer plasmids encoding constitutively active SARM1 mutants, HEK293T cells with stable overexpression of NRK1 were used to produce lentivirus and were supplemented with 1 mM NR just prior to transfection. Two days after transfection, media containing lentivirus particles were collected, briefly centrifuged at 5,000 × g for 5 min at 4 °C and the virus-containing supernatant was added directly to cultured primary neurons at DIV0–2. For TNT experiments, lentivirus was first concentrated 10x in DBPS using Lenti-X Concentrator (Takara Bio (Kusatsu, Shiga, Japan), Cat.#631232), before transducing neurons.
Analysis of axon degeneration
Axons were imaged and their degree of fragmentation was quantified as described previously (Sasaki et al., 2016). Briefly, axons from DRG spot cultures in 24-well plates were transected using a microsurgical blade under a microscope at DIV7. Bright-field images of distal axons (20 fields/well and 2 wells/condition) were taken at 0–72 h after axotomy using a high content imager (Operetta; PerkinElmer (Waltham, MA)) with a 20x objective (Gerdts et al., 2011). Axon degeneration was quantified using degeneration index (DI) calculated using ImageJ (NIH), as described previously (Gerdts et al., 2011; Sasaki et al., 2009). The DI was calculated from axon images from the same fields just after (0 h) or hours after axotomy (4–72 h). At least four biological replicates were performed for each condition.
Metabolite collection
DIV6–7 eDRG (embryonic dorsal root ganglion) cultures grown in 24-well plates were placed on ice and the medium was replaced with ice-cold 0.9% NaCl solution. DRG metabolites were extracted using ice-cold 1:1 mixture of LC/MS-grade methanol and water (160 μL per well) on ice for 5 min. The metabolite-containing solution was then added to 54 μL chloroform, mixed well, and centrifuged at 15,000 rpm for 10 min at 4 °C. The aqueous phase (140 μL) was transferred to a separate tube, lyophilized and stored at −20 °C until further analysis.
The concentration of protein in each well was quantified using a Pierce BCA assay kit (Thermo-Fisher (St. Louis, MO); Cat.#23227). Samples were run in duplicate and the average was used as the concentration of protein/well. Metabolite measurements from LC-MS-MS were normalized by well to the concentration of protein.
Metabolite measurement using LC-MS-MS
Lyophilized samples were reconstituted with 5 mM ammonium formate (15 μl), centrifuged (13,000 g, 10 min, 4°C), and 10 μl clear supernatant was analyzed. NMN, NAD+, and cADPR were measured using LC-MS/MS (Hikosaka et al., 2014; Sasaki et al., 2020a; Sasaki et al., 2016). Samples were injected into C18 reverse phase column (Atlantis T3, 2.1 × 150 mm, 3 μm; Waters; Milford, MA) using HPLC (Agilent 1290 Infinity LC) at a flow rate of 0.15 mL/min with 5 mM ammonium formate for mobile phase A and 100% methanol for mobile phase B. Metabolites were eluted with gradients of 0–10 min, 0–70% B; 10–15 min, 70% B; 16–20 min, 0% B. The metabolites were detected with a triple quad mass spectrometer (Agilent 6470 MassHunter; Agilent) under positive ESI multiple reaction monitoring (MRM) using parameters specific for each compound (NAD+ (Sigma, Cat. #N1636), 664>428, fragmentation (F) = 160 V, collision (C) = 22 V, and cell acceleration (CA) = 7 V: NMN (Sigma, Cat. #N3501) 335 > 123, F=135, C=8, CA = 7V: cADPR (Sigma, Cat. #C7344), 542>428, F = 100 V, C = 20 V, and CA = 3 V). Serial dilutions of standards for each metabolite in 5 mM ammonium formate were used for calibration. Metabolites were quantified by Masshunter quantitative analysis tool (Agilent) with standard curves and normalized by the protein concentration.
NAD+-flux assays
NAD+-flux assays were performed as described previously (Sasaki et al., 2016). Briefly, primary eDRG neurons were treated with 300 μM D4-nicotinamide (D4-Nam) −/+ 100 μM NR and metabolites were collected 1 h later. Labelled (D3-NAD+ and D4-NAD+) (heavy) or non-labelled (light) NAD+ were quantified by LC-MS-MS. We added D3-NAD+ and D4-NAD+ values and used this combined value as the amount of newly synthesized heavy NAD+. For each well, we calculated a rate of consumption from the formula: 100*((heavy NAD+ + light NAD+) − light NAD+)/(heavy NAD+ + light NAD+), and we used the mean from four technical replicates per condition as one biological replicate.
Western blot
Mouse primary embryonic DRG neurons were cultured in four dense spots per well of a 12-well plate. On DIV7, cultures were placed on ice and washed with cold DPBS (Thermo-Fisher (Waltham, MA), Cat.#14190144) and lysed with RIPA buffer (Sigma-Aldrich (St. Louis, MO); Cat.#R0278) containing cOmplete™ EDTA-free Protease Inhibitor Cocktail (Sigma-Aldrich (St. Louis, MO); Cat.#11836170001). Cells were scraped, washed from the well into 1.5 mL Eppendorf tubes and incubated on ice for 10 min. Cells were centrifuged at 5,000 × g for 5 min at 4°C. The supernatant was mixed with Laemmli buffer to 1x and boiled for 10 min at 100°C. 2-mercaptoethanol (Sigma-Aldrich (St. Louis, MO); Cat. #M3148) was added to 5% final concentration. Samples were run on 4–20% Mini-PROTEAN® TGX™ Precast Protein Gels (Bio-Rad Laboratories (Hercules, CA); Cat.#4561095) and transferred to nitrocellulose membranes using Trans-Blot ® Turbo™ Midi Nitrocellulose Transfer Packs (Bio-Rad Laboratories (Hercules, CA); Cat.#1704159). Nitrocellulose blots were blocked by incubation with 5% milk (Instant Nonfat Dry Milk, Nestlé Carnation (Vevey, Switzerland), in 1x Tris-buffered saline, 0.1% Tween® 20 Detergent (TBST). Primary antibodies were incubated overnight at 4 °C in 5% milk in TBST and secondary antibodies were incubated at room temperature for 1 h. Membranes were washed 3x with TBST after incubation with both primary and secondary antibodies. EMD Millipore Immobilon™ Western Chemiluminescent HRP substrate (MilliporeSigma (Burlington, MA); Cat. #WBKLS0500) was used to visualize the HRP signal, which was detected using a Syngene G:BOX (Synoptics Ltd. (Cambridge, England)).
The following antibodies were used in this study: rabbit anti-β3 tubulin (TUJ1; 1:10,000; Sigma-Aldrich (St. Louis, MO); Cat.#T2200), mouse anti-2A (3H4) peptide (1:1,000; Novus Biologicals (Centennial, CO); Cat.#NBP2-59627), rabbit anti-SARM1 (D2M5I) (1:2,500; Cell Signaling Technology (Danvers, MA); Cat.#13022), rabbit anti-GAPDH (D16H11) XP (1:2,500; Cell Signaling Technology (Danvers, MA); Cat.#5174), Peroxidase AffiniPure Goat Anti-Rabbit IgG (1:10,000; Jackson ImmunoResearch Laboratories (West Grove, PA); Cat.#111-035-045), Peroxidase AffiniPure Goat Anti-Mouse IgG (1:10,000; Jackson ImmunoResearch Laboratories (West Grove, PA); Cat.#115-035-003). Western-blot quantification was performed using ImageJ (v1.53a).
Purification of dSARM1ARM
dSARMARM was expressed as described in the EXPERIMENTAL MODEL AND SUBJECT DETAILS section. Cells were harvested by centrifugation at 6000 × g for 20 min at 4 °C. The harvested cells were resuspended in lysis buffer (50 mM HEPES (pH 8.0), 500 mM NaCl, 30 mM imidazole, 1 mM DTT) at a ratio of 4 mL of buffer to 1 g of cells. PMSF (phenylmethanesulfonylfluoride) was added to the cell resuspension to a final concentration of 1 mM. Cell suspensions were lysed by sonication in 30 mL aliquots, using an amplitude of 40% for 60 s (10 s on and 20 s off) and centrifuged at 15300 × g for 40 min at 4 °C. The soluble cell lysate was loaded on a HisTrap HP 5 mL column pre-equilibrated with lysis buffer at 3 mL/min, and then washed with 100 mL of lysis buffer at 5 mL/min. The bound protein was eluted from the column using elution buffer (50 mM HEPES (pH 8.0), 500 mM NaCl, 300 mM imidazole, 1 mM DTT) at 5 mL/min using FPLC (Fast Protein Liquid Chromatography, GE Healthcare). The peak fractions were combined and incubated with TEV protease at a ratio of 1 mg of TEV protease to 20 mg of protein, in the SnakeSkin Dialysis Tubing, 3.5K MWCO (Thermo Fisher Scientific), dialyzed against the buffer containing 20 mM HEPES (pH 8.0), 300 mM NaCl and 1 mM DTT at 4 °C overnight. The cleaved protein was re-loaded on the HisTrap HP 5 mL column and the flow-through was collected, concentrated to 10 mL and injected onto the Superdex 75 HiLoad 26/600 column equilibrated with gel-filtration buffer containing 10 mM HEPES (pH 8.0), 150 mM NaCl and 1 mM DTT for the native, mutant and SeMet-labelled proteins, or 10 mM HEPES (pH 7.2), 100 mM NaCl and 1 mM DTT for the 15N-labelled protein. The peak fractions were analyzed on 15% SDS-PAGE, combined, concentrated, flash-frozen and stored at −80 °C.
Purification of hSARM1
hSARM1 was expressed as described in the EXPERIMENTAL MODEL AND SUBJECT DETAILS section, and purified to homogeneity using a combination of immobilised metal-ion affinity chromatography (IMAC) and size-exclusion chromatography (SEC). Cell pellets from 900 mL expressions were resuspended in 20–30 mL of lysis buffer (50 mM HEPES buffer (pH 8), 400 mM NaCl, 5% glycerol, 0.5 mM TCEP [tris(2-carboxyethyl)phosphine]), lysed using a digital sonicator, and clarified by centrifugation (2x cycles of 15,000 × g for 20 minutes). The clarified lysate was applied to a nickel HisTrap column (GE Healthcare) pre-equilibrated with 10 column volumes (CVs) of the lysis buffer at a rate of 1 mL/min. The column was then washed with 10–20 CVs of lysis buffer supplemented with 20 mM imidazole, followed by elution of bound proteins using elution buffer (50 mM HEPES buffer (pH 8), 400 mM NaCl, 250 mM imidazole, 5% glycerol, 0.5 mM TCEP). The elution fractions were analyzed by SDS-PAGE and the fractions containing hSARM1 were pooled and further purified on a S200 HiLoad 26/600 column pre-equilibrated with gel-filtration buffer (25 mM HEPES pH 7.4, 150 mM NaCl, 0.1 mM TCEP and 0–5% glycerol). The peak fractions were analyzed by SDS-PAGE, and the fractions containing hSARM1 were pooled and concentrated to a final concentration of 2–3 mg/mL and stored at −80°C. For cryo-EM, the IMAC elution fractions were pooled, supplemented with TEV protease, and dialysed into gel-filtration buffer overnight at 4°C. Cleaved hSARM1 was reloaded onto the HisTrap column to remove the TEV protease, His6-tag and contaminants. After the second IMAC step, hSARM1 was further purified on a S200 HiLoad 26/600 column and stored as described above.
Protein crystallization
Hanging-drop vapour diffusion was used for protein crystallization. For dSARM1ARM:NMN complex, dSARM1ARM was incubated with NMN overnight at a molar ratio of 1:10. The drops contained 2 μL of protein at 17 mg/mL and 2 μL of well solution (0.1 M SPG buffer (succinic acid, sodium dihydrogen phosphate, and glycine in the molar ratios 2:7:7 and pH adjusted to 8.0 by adding 10 M NaOH) and 25% PEG1500), and were equilibrated against 500 μL of well solution at 20 °C. Crystals were observed after 3–5 days. SDS-PAGE analysis of the crystals, followed by mass spectrometry, indicated that the crystallized protein contained only residues 370–678, rather than the intact protein comprising residues 307–678, suggesting that in situ partial proteolysis occurred during the crystallization process.
Diffraction quality crystals of the ligand-free Drosophila SARM1 ARM domain could only be obtained with the construct comprising residues 315–678 (dSARM1ARM315). Rod-shaped crystals grew in 1.7 M sodium malonate (pH 5.8), at 18 °C and with protein concentration of 6.8 mg/mL.
Size-exclusion chromatography - multi-angle light scattering (SEC-MALS)
Twenty μL of 1.5 mg/mL dSARM1ARM was injected onto the Superdex 200 Increase 5/150 GL column equilibrated with the buffer containing 10 mM HEPES (pH 8.0), 150 mM NaCl and 1 mM DTT. The same amount of the protein incubated with NMN at a molar ratio of 1:10 (protein: NMN) was injected onto the same column equilibrated with the buffer containing of 10 mM HEPES (pH 8.0), 150 mM NaCl, 1 mM DTT and 1 mM NMN. MALS was measured by a DAWN HELEOS II 10-angle light-scattering detector combined with an Optilab rEX refractive index detector (Wyatt Technology).
X-ray data collection and crystal structure determination
The crystals of the NMN-bound dSARM1ARM were cryo-protected in the mother liquor (0.1 M SPG buffer (pH 8.0) and 25% PEG1500) containing 25% PEG 400. X-ray diffraction data was collected at the Australian Synchrotron MX2 beamline. The native protein data were collected at the wavelength of 0.95372 Å. For Br (bromide)-soak data, the crystals were soaked in the mother liquor containing 0.5 M sodium bromide and 25% PEG 400, for 2 min, and X-ray electron diffraction was collected at the wavelength of 0.91976 Å. The SeMet-containing protein was crystallized in the same conditions as the native protein and X-ray diffraction data was collected at the wavelength of 0.97857 Å. The crystal structure of the NMN-bound dSARM1ARM was determined by multiple isomorphous replacement combined with anomalous scattering (MIRAS), using all three datasets. AUTOPROC and AUTOSHARP (Global Phasing Limited) were used for data processing and phase determination, using data between 25 and 2.5 Å resolution (Vonrhein et al., 2007; Vonrhein et al., 2011). A more detailed description of the crystallization of NMN-bound dSARM1ARM and the MIRAS approach used for structure determination is described elsewhere (Gu et al., 2021).
The crystals of the ligand-free protein were cryo-protected in 3 M sodium malonate (pH 5.8). The crystal structure of the ligand-free dSARM1ARM315 was determined by molecular replacement using the NMN-bound dSARM1ARM as a search model, using the program Phaser (McCoy, 2007).
For both structures, the models were built/rebuilt using the program Autobuild, and the refinement and model building was performed using PHENIX (Afonine et al., 2012) and Coot (Crystallographic Object-Oriented Toolkit) (Emsley et al., 2004).
Isothermal titration calorimetry (ITC)
ITC experiments were performed in duplicate on Nano ITC (TA Instruments). All proteins and compounds were dissolved in a buffer containing 10 mM HEPES (pH 8.0) and 150 mM NaCl. The baseline was equilibrated for 600 s before the first injection. 0.4 – 1 mM NMN or NAD+ was titrated as 20–25 injections of 1.96–2.44 μL every 200 s, into 60 – 200 μM protein. The heat change was recorded by injection over time and the binding isotherms were generated as a function of molar ratio of the protein solution. The dissociation constants (Kd) were obtained after fitting the integrated and normalized data to a single-site binding model using NanoAnalyze (TA Instruments).
15N - heteronuclear single quantum coherence (15N-TROSY-HSQC) spectroscopy
The NMR experiments were carried out using a NMR spectrometer (Bruker NEO) operating at a nominal 1H resonance frequency of 900 MHz, and equipped with a triple-resonance TCI cryoprobe. The 15N-TROSY-HSQC spectra were individually recorded for 300 μL of sample containing 150 μM 15N-labelled dSARM1ARM with 0, 75, 150, 300, 750 and 1500 μM NMN or NAD+, in a buffer containing 10 mM HEPES (pH 7.2), 100 mM NaCl, 1 mM DTT and 5% D2O. The 15N- TROSY-HSQC peaks of dSARM1ARM shift when [NMN]/[dSARM1ARM] or [NAD+]/[dSARM1ARM] ratios are increased from 0:1 to 1:1 but remain unchanged when [NMN]/[dSARM1ARM] or [NAD+]/[dSARM1ARM] ratios are greater than 1:1. Addition of NMN leads to appearance of a number of new signals in addition to chemical shift changes, consistent with the stabilization of an intermediate exchange process (in the μs-ms timescale) (Figure 3D).
1H NMR NADase assays
NMR samples were prepared in 175 μL HBS buffer (10 mM HEPES, 150 mM NaCl, pH 7.5), 20 μL D2O, and 5 μL DMSO-d6, resulting in a total volume of 200 μL. Each sample was subsequently transferred to a 3 mm Bruker NMR tube rated for 600 MHz data acquisition. All 1H NMR spectra were acquired with a Bruker Avance 600 MHz NMR spectrometer equipped with 1H/13C/15N triple resonance cryoprobe at 298 K. To suppress resonance from H2O, a water suppression pulse program (P3919GP) using 3-9-19 pulse sequence with gradients (Piotto et al., 1992; Sklenar et al., 1993) was implemented to acquire spectra with an acquisition delay of 2 s and 32 scans per sample. All spectra were processed by TopSpin™ (Bruker) and Mnova 11 (Mestrelab Research). Progression of NADase reaction was calculated based on integration of NAD+ resonance at about 8.35 ppm (H8*) and the corresponding ADPR resonance at about 8.43 ppm. The detection limit (signal-to-noise ratio > 2) was estimated to by 10 μM for NAD+ concentrations.
Saturation-transfer difference (STD) NMR
Samples for STD NMR were prepared in similar solutions as for NMR NADase asasys. With a total volume of 200 μL, each sample consisted of 175 μL HBS buffer, 20 μL D2O, and 5 μL DMSO-d6. The final protein concentrations were 5.25 μM for hSARM1 and 40 μM for dSARM1ARM. The final concentrations of ligands were either 500 μM or 1 mM. STD NMR spectra were acquired with the same NMR spectrometer as for the NADase assays. The pulse sequence STDDIFFGP19.3, in-built within the TopSpin™ program (Bruker), was employed to acquire STD NMR spectra (Mayer et al., 1999). This pulse sequence consists of a 3-9-19 water suppression pulse, the parameters of which were obtained from the water suppression pulse program (P3919GP), to suppress the resonance from H2O. The on-resonance irradiation was set close to protein resonances at 0.8 ppm for hSARM1 or 0.75 ppm for dSARM1ARM, whereas the off-resonance irradiation was set far away from any protein or ligand resonances at 300 ppm. A relaxation delay of 4 s was used, out of which a saturation time of 3 s was used to irradiate the protein with a train of 50 ms Gaussian shaped pulses. The number of scans were kept between 512 and 1024, depending on instrument availability. All spectra were processed by TopSpin™ (Bruker) and Mnova 11 (Mestrelab Research).
Cryo-EM sample preparation and data collection
Immediately before grid preparation, protein at 1.3 mg/mL in gel-filtration buffer (25 mM HEPES pH 7.4, 150 mM NaCl, 5 % glycerol, 0.1 mM TCEP) was buffer-exchanged into low-glycerol buffer, using a spin concentrator column, so that ~0.4% glycerol remained. Three μL of protein (0.27 mg/mL) were then applied to glow-discharged Quantifoil (Cu 300 R2/2) grids that had been prepared with a 6 nm carbon film. Grids were blotted for 3 s, and then plunge-frozen in liquid ethane using a Mark IV Vitrobot (Thermo Fisher Scientific, Waltham, MA, USA). The grids were transferred into cartridges, loaded into a Titan Krios microscope (Thermo Fisher Scientific, Waltham, MA, USA) operated at an accelerating voltage of 300 kV with a 50 μm C2 aperture at an indicated magnification of 81k in nanoprobe EFTEM mode, spot size 5. Gatan K3 direct electron detector positioned after a Gatan Quantum energy filter (Gatan, Pleasanton, CA, USA), operated in a zero-energy-loss mode with a slit width of 20 eV was used to acquire dose-fractionated images. Movies were recorded as compressed TIFFs in super-resolution mode corresponding to a sampling interval of 1.09Å/pixel (super-resolution 0.543 Å/pixel) with an exposure time of 4.99 s amounting to a total exposure of 54 e-/Å2 at an exposure rate of 12.88 e-/pixel/second that was fractionated into 45 subframes. Images were recorded at −1.5 to −2.7 μm defocus.
Cryo-EM data processing
All processing steps were performed using CryoSPARC (Punjani et al., 2017). Movies were imported into CryoSPARC version 2.15 and alignment of movie frames was performed using patch-based motion correction. Fitting of the contrast transfer function and defocus estimation was performed using patch-based CTF estimation. 994,978 particles were picked using a topaz neural network (Bepler et al., 2019) within cryoSPARC. The topaz model was trained on a subset of 200 micrographs. Particles picked using the topaz model were subjected to initial 2D classification. 423,434 particles representing the best 2D classes were then used for ab-initio reconstruction using 2 classes. The final sets of particles for each class were refined using homogenous refinement, with C8 symmetry imposed. The reconstruction from class 1 (3.6 Å resolution; 147,974 particles) showed a strong preferred orientation and was not suitable for further analysis. The reconstruction from class 2 (3.1 Å resolution; 275,460 particles) showed significantly less orientation bias and the map was interpretable for all three domains of hSARM1. Post-processing of the electrostatic potential density map generated during homogenous refinement was performed using DeepEMhancer (Sanchez-Garcia et al., 2020).
Model building and refinement of the hSARM1 cryo-EM structure
Crystal structures of hSARM1 SAM (PDB: 6O0S) and TIR (PDB: 6O0R) domains, as well as a homology model generated in Modeller (ver. 9.24) (Webb et al., 2016) using the NMN-bound dSARM1ARM structure as a template, were initially fit as rigid body into the cryo-EM map in UCSF Chimera (Pintilie et al., 2010), using a combination of manual fitting and the ‘fit in map’ tool. Building of additional residues and replacement of selenomethionine residues was performed using Coot. The model was then subjected to iterative rounds of molecular dynamics flexible fitting (MDFF) using Namdinator (Kidmose et al., 2019). Following MDFF, a single representative chain and the corresponding map density were extracted in UCSF Chimera and subjected to additional rounds of model building and refinement using Coot and phenix.real_space_refine from the PHENIX suite (Afonine et al., 2018), respectively. The full model was generated by applying symmetry operators and refined further using Coot and phenix.real_space_refine. Model validation was performed using the phenix.validation_cryoem tool (Williams et al., 2018).
Structural analyses.
The structures were analyzed using the programs PyMol (Schrodinger), PISA (Krissinel et al., 2007), Dali (Holm, 2020), Ligplot (Wallace et al., 1995) and PDBsum (Laskowski et al., 2018). Figures were prepared using PyMol, UCSF Chimera (Pintilie et al., 2010) and UCSF ChimeraX (Goddard et al., 2018).
Molecular dynamics simulations
All molecular dynamics (MD) simulations were performed using the GPU version Amber19 (Case et al., 2005; Salomon-Ferrer et al., 2013) on the Gadi cluster at the National Computing Infrastructure, Australia. The Gromos 54A7 force field was used to model protein (Oostenbrink et al., 2004; Schmid et al., 2011). The force-field parameters of the NMN ligand were obtained from the Automated Topology Builder (ATB) and Repository (Koziara et al., 2014; Malde et al., 2011; Stroet et al., 2018). The systems were prepared using the GROMOS program (Christen et al., 2005; Kunz et al., 2012; Schmid et al., 2012) and converted to AMBER format using the Topology Converter available on the ATB. The initial coordinates of dSARM1ARM complex with NMN and the ligand-free structure were based on the crystal structures. The protonation states of titratable groups of the protein were chosen appropriate to pH 7.0 (Lys, Arg: protonated; Asp and Glu: deprotonated). Each system was placed in a cubic periodic box and solvated with the simple point charge (SPC) model using a distance of 0.14 nm between the molecule and the wall of the box (Berendsen et al., 1981). All molecular dynamics (MD) simulations were performed at constant temperature (298 K) and pressure (1 atm) using a Berendsen thermostat (coupling time of 0.1 ps) and barostat (coupling time of 1.0 ps and isothermal compressibility of 4.575 × 10⁻⁴ (kJ/mol/nm3)−1) (Berendsen et al., 1984). A nonbonded interaction cut-off of 0.14 nm was used. Long-range electrostatics were treated with the particle-mesh Ewald (PME) method (Essmann et al., 1995). Covalent bonds involving hydrogens were constrained with the SHAKE algorithm (Ryckaert et al., 1977), allowing an integration time step of 2 fs. Each system was energy-minimized for 1000 steps using the steepest descent method, followed by an equilibration MD simulation for 5 ns where the temperature of the system was slowly increased from 100 K to 298 K. The MD simulations were performed for 100 ns in duplicate, starting with different initial velocity distribution for each system. All coordinates, velocities, forces and energies were saved every 10,000 steps for analysis. The analysis was carried out using the GROMOS program. Additional systems included the ligand-free protein in a larger box (with a distance of 0.28 nm between the molecule and the wall of the box) for 200 ns MD simulations in duplicate, and the ligand-free protein in a larger box (with a distance of 0.40 nm between the molecule and the wall of the box) for 300 ns MD simulations.
QUANTIFICATION AND STATISTICAL ANALYSIS
Quantification data from cell-based assays were generated from independent biological experiments. Data are presented as mean ± STD or SEM; *p < 0.05, **p < 0.01, ***p<0.001, ****p<0.0001. For primary neuron experiments, each data point is the mean from each biological replicate, calculated from 3–4 technical replicates (for metabolite data) or 2 technical replicates (for axon degeneration data). Statistical tests were performed in GraphPad Prism 9. Specific statistical tests are described in detail in the Figure Legends. Statistical data for X-ray crystallography and cryo-EM data collection, refinement and validation are provided in Table S1 and S4. These results were derived from AIMLESS (ligand-free) (Evans et al., 2013), autoPROC (NMN-bound) (Vonrhein et al., 2011), Phenix (all structural models) (Afonine et al., 2018), MolProbity (all structural models) (Williams et al., 2018), and CryoSPARC (hSARM1 cryo-EM) (Punjani et al., 2017). The global resolution estimate of the cryo-EM map is based on the gold standard Fourier Shell Correlation (FSC) value of 0.143 calculated between two independent half-maps (Chen et al., 2013; Rosenthal et al., 2003; Scheres et al., 2012). Local resolution calculations of the cryo-EM map were generated in CryoSPARC (Punjani et al., 2017). The ITC derived dissociation constants reported in the manuscript are from duplicate experiments (mean ± STD).
Supplementary Material
KEY RESOURCES TABLE
| REAGENT or RESOURCE | SOURCE | IDENTIFIER |
|---|---|---|
| Antibodies | ||
| rabbit anti-β3 tubulin (TUJ1) antibody | Sigma-Aldrich | Cat# T2200; RRID:AB_262133 |
| rabbit anti-SARM1 (D2M5I) antibody | Cell Signaling Technologies | Cat# 13022; RRID:AB_2798090 |
| mouse anti-2A (3H4) peptide antibody | Novus Biologicals | Cat# NBP2-59627 |
| rabbit anti-GAPDH (D16H11) XP antibody | Cell Signaling Technologies | Cat# 5174; RRID:AB_10622025 |
| Peroxidase AffiniPure Goat Anti-Rabbit IgG secondary antibody | Jackson ImmunoResearch Laboratories | Cat# 111-035-045; RRID:AB_2337938 |
| Peroxidase AffiniPure Goat Anti-Mouse IgG secondary antibody | Jackson ImmunoResearch Laboratories | Cat# 115-035-003; RRID:AB_10015289 |
| Bacterial and Virus Strains | ||
| NEB 5-alpha competent cells | New England Biolabs | Cat# C2987I |
| BL21 (DE3) competent cells | Sigma-Aldrich | Cat# 69450-3 |
| B834 (DE3) competent cells | Sigma-Aldrich | Cat# 69041-3 |
| Chemicals, Peptides, and Recombinant Proteins | ||
| β-nicotinamide mononucleotide (NMN) | Sigma-Aldrich | Cat# N3501 |
| β-nicotinamide adenine dinucleotide sodium salt (NAD+) | Sigma-Aldrich | Cat# N0632 |
| β-Nicotinamide adenine dinucleotide hydrate (NAD+) | Sigma-Aldrich | Cat# N1636 |
| Cyclic adenosine diphosphate-ribose (cADPR) | Sigma-Aldrich | Cat# C7344 |
| L-Selenomethionine (SeMet) | Sigma-Aldrich | Cat# S3132 |
| Nicotinamide riboside (NR) chloride | ChromaDex, Inc. | Tru Niagen |
| Nicotinamide-2,4,5,6-d4 (D4-Nam) | C/D/N Isotypes, Inc. | Cat# D-3457 |
| CZ-48 (Sulfo-ara-F-NMN) | Zhao et al., 2019; Wuxi AppTec | N/A |
| FK866 | NIMH Chemical Synthesis & Drug Supply Program | NIMH #F-901 |
| B-27 Supplement (50X), serum free | Thermo Fisher | Cat# 17504044 |
| Nerve Growth Factor (NGF) | Envigo Bioproducts | Cat# B.5017 |
| 5-Fluoro-2’-deoxyuridine | Sigma-Aldrich | Cat# F0503 |
| Uridine | Sigma-Aldrich | Cat# U3003 |
| Poly-D-lysine hydrobromide | Sigma-Aldrich | Cat# P0899 |
| Laminin Mouse Protein | Thermo Fisher | Cat# 23017015 |
| FuGENE 6 Transfection Reagent | Promega | Cat# E2691 |
| Neurobasal Media | Thermo Fisher | Cat# 21103049 |
| Lenti-X Concentrator | Takara Bio., Inc. | Cat# 631231 |
| In-Fusion HD Cloning Plus Kit | Takara Bio., Inc. | Cat# 638920 |
| Q5® Site-Directed Mutagenesis Kit | New England Biolabs | Cat# E0554S |
| hSARM1 (residues 28–724) | This manuscript | N/A |
| hSARM1 W103A | This manuscript | N/A |
| hSARM1 W103F | This manuscript | N/A |
| hSARM1 E149A | This manuscript | N/A |
| hSARM1 R157A | This manuscript | N/A |
| hSARM1 K193A | This manuscript | N/A |
| dSARMARM (residues 307–678) | This manuscript | N/A |
| dSARMARM315 (residues 315–678) | This manuscript | N/A |
| dSARMARM W385A | This manuscript | N/A |
| dSARMARM R437A | This manuscript | N/A |
| Critical Commercial Assays | ||
| Pierce BCA Protein Assay Kit | Thermo Fisher | Cat# 23225 |
| Deposited Data | ||
| Ligand-free hSARM128–724 cryo-EM structure | This manuscript | PDB: 7LD0 |
| Ligand-free hSARM128–724 cryo-EM map | This manuscript | EMDB: EMD-23278 |
| NMN bound dSARMARM crystal structure | This manuscript | PDB: 7LCZ |
| Ligand-free dSARMARM crystal structure | This manuscript | PDB: 7LCY |
| Crystal structure of the tandem SAM domains from human SARM1 | Horsefield et al., 2019 | PDB: 6O0S |
| Crystal structure of the TIR domain from human SARM1 in complex with glycerol | Horsefield et al., 2019 | PDB: 6O0R |
| NAD+-bound Sarm1 in the self-inhibited state | Jiang et al., 2020 | PDB: 7CM6 |
| Structure of the Cse1:Imp-alpha:RanGTP complex | Matsuura et al., 2004 | PDB: 1WA5 |
| Ring-like DARPin-Armadillo fusion H83_D01 | Ernst et al., 2019 | PDB: 6SA8 |
| Crystal structure of Vac8 (del 19–33) bound to Atg13 | Park et al., 2020 | PDB: 6KBN |
| Crystal structure of SmgGDS-558 | Shimizu et al., 2017 | PDB: 5XGC |
| Crystal structure of NMN/NaMN adenylyltransferase complexed with NAD | Zhou et al., 2003 | PDB: 1KQN |
| Experimental Models: Cell Lines | ||
| HEK293T | ATCC | Cat# CRL-3216 |
| HEK293T NRK1 | Essuman et al., 2017 | N/A |
| Experimental Models: Organisms/Strains | ||
| Mouse: CD-1 | Charles River Laboratories | Crl:CD1 (ICR) |
| Mouse: Sarm1−/− | Szretter et al., 2009 | N/A |
| Recombinant DNA | ||
| PSF-CMV-AMP | Sigma-Aldrich | Cat # OGS2–5UG |
| PSF-CMV-AMP His6Tag-TEV-AviTag-hSARM128–724 | This manuscript | N/A |
| PSF-CMV-AMP His6Tag-TEV-AviTag-hSARM128–724 (W103A) | This manuscript | N/A |
| PSF-CMV-AMP His6Tag-TEV-AviTag-hSARM128–724 (W103F) | This manuscript | N/A |
| PSF-CMV-AMP His6Tag-TEV-AviTag-hSARM128–724 (R149A) | This manuscript | N/A |
| PSF-CMV-AMP His6Tag-TEV-AviTag-hSARM128–724 (R157A) | This manuscript | N/A |
| PSF-CMV-AMP His6Tag-TEV-AviTag-hSARM128–724 (K193A) | This manuscript | N/A |
| FUGW | Lois et al., 2002 | RRID:Addgene_14883 |
| psPAX2 | Trono Lab Packaging and Envelope Plasmids (unpublished) | RRID:Addgene_12260 |
| pCMV-VSV-G | Stewart et al., 2003 | RRID:Addgene_8454 |
| FCIV (IRES Venus) | Araki et al., 2004 | N/A |
| FCIV Nrk1 IRES Venus | Sasaki et al., 2016 | N/A |
| FC SARM1-T2A-P2A-Venus | This manuscript | N/A |
| FC SARM1W103A-T2A-P2A-Venus | This manuscript | N/A |
| FC SARM1W103F-T2A-P2A-Venus | This manuscript | N/A |
| FC SARM1E149A-T2A-P2A-Venus | This manuscript | N/A |
| FC SARM1L152A-T2A-P2A-Venus | This manuscript | N/A |
| FC SARM1R157A-T2A-P2A-Venus | This manuscript | N/A |
| FC SARM1R157E-T2A-P2A-Venus | This manuscript | N/A |
| FC SARM1H190A-T2A-P2A-Venus | This manuscript | N/A |
| FC SARM1K193A | This manuscript | N/A |
| FC SARM1K193R-T2A-P2A-Venus | This manuscript | N/A |
| FC SARM1D317N-T2A-P2A-Venus | This manuscript | N/A |
| FC SARM1Q320A-T2A-P2A-Venus | This manuscript | N/A |
| FC SARM1P324G-T2A-P2A-Venus | This manuscript | N/A |
| FC TNT | This manuscript | N/A |
| FC TNTR780A | This manuscript | N/A |
| pMCSG7 | Stols et al., 2002 | N/A |
| pMCSG7 His6Tag-TEV-dSARM1307–678 | This manuscript | N/A |
| pMCSG7 His6Tag-TEV-dSARM1307–678 (W385A) | This manuscript | N/A |
| pMCSG7 His6Tag-TEV-dSARM1307–678 (R437A) | This manuscript | N/A |
| Software and Algorithms | ||
| TopSpin™ | Bruker | https://www.bruker.com/products/mr/nmr/software/topspin.html |
| Mnova 11 | Mestrelab Research | https://mestrelab.com/software/mnova |
| CryoSPARC (version 2.15) | Punjani et al., 2017 | https://cryosparc.com |
| Topaz | Bepler et al., 2019 | http://cb.csail.mit.edu/cb/topaz |
| DeepEMhancer | Sanchez-Garcia et al., 2020 | https://github.com/rsanchezgarc/deepEMhancer |
| Modeller (version 9.24) | Webb et al., 2016 | https://salilab.org/modeller |
| Chimera | Pintilie et al., 2010 | https://www.cgl.ucsf.edu/chimera |
| ChimeraX | Goddard et al., 2018 | https://www.cgl.ucsf.edu/chimerax |
| Namdinator | Kidmose et al., 2019 | https://namdinator.au.dk |
| Coot | Emsley et al., 2004 | https://www2.mrc-lmb.cam.ac.uk/personal/pemsley/coot |
| PHENIX | Afonine et al., 2012 | https://www.phenix-online.org |
| AUTOPROC | Vonrhein et al., 2007 | https://www.globalphasing.com |
| AUTOSHARP | Vonrhein et al., 2011 | https://www.globalphasing.com |
| Phaser | McCoy et al., 2007 | https://www.phaser.cimr.cam.ac.uk/index.php/Phaser_Crystallographic_Software |
| PISA | Krissinel et al., 2007 | https://www.ebi.ac.uk/pdbe/pisa/ |
| Ligplot | Wallace et al., 1995 | https://www.ebi.ac.uk/thornton-srv/software/LigPlus/ |
| PDBsum | Laskowski et al., 2018 | http://www.ebi.ac.uk/thornton-srv/databases/cgi-bin/pdbsum/GetPage.pl?pdbcode=index.html |
| PyMOL (version 2.2.3) | Schrödinger, LLC | https://pymol.org/2/ |
| NanoAnalyze | TA instruments | https://www.tainstruments.com/support/software-downloads-support/downloads |
| Automated Topology Builder (ATB) | Malde et al., 2011 | https://atb.uq.edu.au |
| GROMOS program | Christen et al., 2005 | http://www.gromos.net |
| GROMOS force field | Oostenbrink et al., 2004 | http://gromos.net |
| Simple Point Charge (SPC) Water model | Berendsen et al., 1981 | http://gromos.net |
| AMBER19 program | Case et al., 2005 | http://ambermd.org |
| Particle-Mesh Ewald (PME) method | Essmann et al., 1995 | http://ambermd.org |
| Berendsen thermostat & barostat | Berendsen et al., 1984 |
http://ambermd.org http://gromos.net |
| SHAKE constraints algorithm | Ryckaert et al., 1977 |
http://ambermd.org http://gromos.net |
| T-coffee Multiple Sequence Alignment Server (Expresso) | Notredame et al., 2000 | http://tcoffee.crg.cat/apps/tcoffee/do:expresso |
| Prism | Graph Pad | RRID:SCR_002798 |
| ImageJ/FIJI | FIJI | RRID:SCR_002285 |
| ImageJ macro for axon degeneration index | Sasaki et al., 2009 | N/A |
| Masshunter Quantitative Analysis software | Agilent | RRID:SCR_015040 |
| Other | ||
| Histrap HP 5 mL | Cytiva | Cat# 17524801 |
| Histrap FF 5 mL | Cytiva | Cat# 17531901 |
| HiLoad 26/60 Superdex 75 pg | Cytiva | Cat# 28989334 |
| HiLoad 26/60 Superdex 200 pg | Cytiva | Cat# 28989336 |
| Superdex 200 Increase 5/150 GL | Cytiva | Cat# 28990945 |
| SnakeSkin Dialysis Tubing, 3.5K MWCO | Thermo Fisher | Cat# 68035 |
| Nano ITC | TA instruments | Product site: https://www.tainstruments.com/ |
| Titan Krios microscope | Thermo Fisher | Product site: https://www.thermofisher.com/au/en/home/electron-microscopy/products/transmission-electron-microscopes.html |
| Mark IV Vitrobot | Thermo Fisher | Product site: https://www.thermofisher.com/au/en/home/electron-microscopy/products/sample-preparation-equipment-em.html |
| Quantifoil (Cu 300 R2/2) grids | Quantifoil Micro Tools GmbH, Germanuy | Product site: https://www.quantifoil.com |
| Bruker Avance 900 MHz NMR spectrometer equipped with a triple-resonance TCI cryoprobe | Bruker | Product site: https://www.bruker.com/products/mr/nmr.html |
| Bruker Avance 600 MHz NMR spectrometer equipped with 1H/13C/15N triple resonance cryoprobe | Bruker | Product site: https://www.bruker.com/products/mr/nmr.html |
| 3 mm unracked NMR-tubes | Bruker | Cat# Z172598 |
| DAWN® HELEOS® II multi-angle light scattering (MALS) detector | WYATT Technology | Product site: https://www.azom.com/equipment-details.aspx?EquipID=2261 |
| Optilab® T-rEX™ Refractive Index Detector | WYATT Technology | Product site: https://www.azonano.com/equipment-details.aspx?EquipID=1059 |
| Operetta High-Content Imaging System | PerkinElmer | Product site: https://www.perkinelmer.com/lab-solutions/resources/docs/011034_01_BRO_Operetta_brochure.pdf |
| Agilent 1290 Infinity LC System | Agilent | Product site: https://www.agilent.com/cs/library/usermanuals/public/G4220-90301_1290InfinityLC-System_EN.pdf |
| Agilent 6470 Ultrasensitive LC-QQQ MS/MS | Agilent | Produce site: https://www.agilent.com/cs/library/slidepresentation/public/Ultrasensitive_LC%20MSMS_Targeted_Detection_and_Quantitation_with_the_Agilent_6470_and_6495.pdf |
Highlights.
SARM1 is activated by an increase in the ratio of NMN to NAD+.
NMN and NAD+ compete for binding to the auto-inhibitory ARM domain of SARM1.
NMN binding influences the structure of SARM1.
NMN binding is required for injury-induced SARM1 activation and axon destruction.
ACKNOWLEDGEMENTS
We acknowledge the use of the University of Queensland Remote Operation Crystallization and X-ray (UQROCX) Facility at the Centre for Microscopy and Microanalysis and the support from staff, Gordon King and Karl Byriel. We acknowledge use of the Australian Synchrotron MX facility and thank the staff for their support. We also acknowledge the support and use of the Krios at the Midlands Regional Cryo-EM Facility, Institute of Structural and Chemical Biology, University of Leicester, UK, and the support and use of the Glacios at the Electron Bio-Imaging Centre (eBIC), Diamond, UK. The computational work was supported by the National Computational Infrastructure (NCI) Australia (Project cj47) and Queensland Cyber Infrastructure Foundation (QCIF, Project fi49). The work was supported by the National Health and Medical Research Council (NHMRC grants 1107804 and 1160570 to B.K., M.M., and T.V., 1071659 to B.K., and 1108859 to T.V.), the Australian Research Council (ARC) Laureate Fellowship (FL180100109 to B.K.), National Institutes of Health grants (R01CA219866 and RO1NS087632 to A.D. and J.M. and RF1AG013730 to J.M.) and Disarm Therapeutics. T.V. received ARC DECRA (DE170100783) funding. Y.S. was a recipient of Griffith University Postdoctoral Fellowship Scheme. W.G. was supported by the UQ International Scholarship (UQI). M.K.M. was supported by the Australian Government Research Training Program Scheme. F.K.S. was supported by the University of Queensland Research Training Scholarship. We thank Clemens Vonrhein and Gérard Bricogne (Global Phasing Ltd.) for the help with dSARM1ARM crystal structure determination. We thank Kelli Simburger and Tim Fahrner for support with molecular cloning. We thank Cassidy Menendez, Rachel McClarney and Mihir Vohra for animal husbandry and maintenance. We thank Alicia Neiner for processing LC-MS-MS samples. We thank Xiaolu Sun for support with tissue culture. We thank members of the DiAntonio and Milbrandt labs for their camaraderie and intellectual support. We thank Michael Coleman for helpful discussions and encouragement for including NMN in the study.
Footnotes
DECLARATION OF INTERESTS
A.D and J.M. are co-founders, scientific advisory board members, and shareholders of Disarm Therapeutics. B.K. is shareholder of Disarm Therapeutics. Y. Sasaki and B.K. are consultants to Disarm Therapeutics. B.K. and T.V receive research funding from Disarm Therapeutics. R.O.H. and T.B. are employees and shareholders in Disarm Therapeutics. K.C. and P.S.K. are employees and shareholders of Evotec Ltd. The authors have no additional competing financial interests.
REFERENCES
- Afonine PV, et al. (2012). Towards automated crystallographic structure refinement with phenix.refine. Acta Crystallogr. D Biol. Crystallogr 68, 352–367. [DOI] [PMC free article] [PubMed] [Google Scholar]
- Afonine PV, Klaholz BP, Moriarty NW, Poon BK, Sobolev OV, Terwilliger TC, Adams PD, and Urzhumtsev A (2018). New tools for the analysis and validation of cryo-EM maps and atomic models. Acta Crystallogr. D Biol. Crystallogr 74, 814–840. [DOI] [PMC free article] [PubMed] [Google Scholar]
- Araki T, Sasaki Y, and Milbrandt J (2004). Increased nuclear NAD biosynthesis and SIRT1 activation prevent axonal degeneration. Science 305, 1010–1013. [DOI] [PubMed] [Google Scholar]
- Bepler T, Morin A, Rapp M, Brasch J, Shapiro L, Noble AJ, and Berger B (2019). Positive-unlabeled convolutional neural networks for particle picking in cryo-electron micrographs. Nat. Methods 16, 1153–1160. [DOI] [PMC free article] [PubMed] [Google Scholar]
- Berendsen HJC, Postma JPM, van Gunsteren WF, DiNola A, and Haak JR (1984). Molecular dynamics with coupling to an external bath. J. Chem. Phys 81, 3684–3690. [Google Scholar]
- Berendsen HJC, Postma JPM, van Gunsteren WF, and Hermans J (1981). Interaction Models for Water in Relation to Protein Hydration. In Intermolecular Forces: Proceedings of the Fourteenth Jerusalem Symposium on Quantum Chemistry and Biochemistry Held in Jerusalem, Israel, April 13–16, 1981, Pullman B, ed. (Dordrecht: Springer Netherlands; ), pp. 331–342. [Google Scholar]
- Bogan KL, and Brenner C (2008). Nicotinic acid, nicotinamide, and nicotinamide riboside: a molecular evaluation of NAD+ precursor vitamins in human nutrition. Annu. Rev. Nutr 28, 115–130. [DOI] [PubMed] [Google Scholar]
- Bratkowski M, et al. (2020). Structural and Mechanistic Regulation of the Pro-degenerative NAD Hydrolase SARM1. Cell Rep. 32, 107999. [DOI] [PubMed] [Google Scholar]
- Case DA, et al. (2005). The Amber biomolecular simulation programs. J. Comput. Chem 26, 1668–1688. [DOI] [PMC free article] [PubMed] [Google Scholar]
- Chen S, McMullan G, Faruqi AR, Murshudov GN, Short JM, Scheres SH, and Henderson R (2013). High-resolution noise substitution to measure overfitting and validate resolution in 3D structure determination by single particle electron cryomicroscopy. Ultramicroscopy 135, 24–35. [DOI] [PMC free article] [PubMed] [Google Scholar]
- Christen M, et al. (2005). The GROMOS software for biomolecular simulation: GROMOS05. J. Comput. Chem 26, 1719–1751. [DOI] [PubMed] [Google Scholar]
- Chuang CF, and Bargmann CI (2005). A Toll-interleukin 1 repeat protein at the synapse specifies asymmetric odorant receptor expression via ASK1 MAPKKK signaling. Genes Dev. 19, 270–281. [DOI] [PMC free article] [PubMed] [Google Scholar]
- Coleman MP, and Hoke A (2020). Programmed axon degeneration: from mouse to mechanism to medicine. Nat. Rev. Neurosci 21, 183–196. [DOI] [PMC free article] [PubMed] [Google Scholar]
- Di Stefano M, et al. (2017). NMN Deamidase Delays Wallerian Degeneration and Rescues Axonal Defects Caused by NMNAT2 Deficiency In Vivo. Curr. Biol 27, 784–794. [DOI] [PubMed] [Google Scholar]
- Di Stefano M, et al. (2015). A rise in NAD precursor nicotinamide mononucleotide (NMN) after injury promotes axon degeneration. Cell Death Differ. 22, 731–742. [DOI] [PMC free article] [PubMed] [Google Scholar]
- Emsley P, and Cowtan KD (2004). Coot: model-building tools for molecular graphics. Acta Crystallogr. D Biol. Crystallogr 60, 2126–2132. [DOI] [PubMed] [Google Scholar]
- Ernst P, Honegger A, van der Valk F, Ewald C, Mittl PRE, and Pluckthun A (2019). Rigid fusions of designed helical repeat binding proteins efficiently protect a binding surface from crystal contacts. Sci. Rep 9, 16162. [DOI] [PMC free article] [PubMed] [Google Scholar]
- Essmann U, Perera L, Berkowitz ML, Darden T, Lee H, and Pedersen LG (1995). A smooth particle mesh Ewald method. J. Chem. Phys 103, 8577–8593. [Google Scholar]
- Essuman K, Summers DW, Sasaki Y, Mao X, DiAntonio A, and Milbrandt J (2017). The SARM1 Toll/interleukin-1 receptor domain possesses intrinsic NAD+ cleavage activity that promotes pathological axonal degeneration. Neuron 93, 1334–1343. [DOI] [PMC free article] [PubMed] [Google Scholar]
- Essuman K, Summers DW, Sasaki Y, Mao X, Yim AKY, DiAntonio A, and Milbrandt J (2018). TIR domain proteins are an ancient family of NAD(+)-consuming enzymes. Curr. Biol 28, 421–430 e424. [DOI] [PMC free article] [PubMed] [Google Scholar]
- Evans PR, and Murshudov GN (2013). How good are my data and what is the resolution? Acta Crystallogr. D Biol. Crystallogr 69, 1204–1214. [DOI] [PMC free article] [PubMed] [Google Scholar]
- Figley MD, and DiAntonio A (2020). The SARM1 axon degeneration pathway: control of the NAD(+) metabolome regulates axon survival in health and disease. Curr. Opin. Neurobiol 63, 59–66. [DOI] [PMC free article] [PubMed] [Google Scholar]
- Formentini L, Moroni F, and Chiarugi A (2009). Detection and pharmacological modulation of nicotinamide mononucleotide (NMN) in vitro and in vivo. Biochem. Pharmacol 77, 1612–1620. [DOI] [PubMed] [Google Scholar]
- Geisler S, Doan RA, Strickland A, Huang X, Milbrandt J, and DiAntonio A (2016). Prevention of vincristine-induced peripheral neuropathy by genetic deletion of SARM1 in mice. Brain 139, 3092–3108. [DOI] [PMC free article] [PubMed] [Google Scholar]
- Geisler S, Huang SX, Strickland A, Doan RA, Summers DW, Mao X, Park J, DiAntonio A, and Milbrandt J (2019). Gene therapy targeting SARM1 blocks pathological axon degeneration in mice. J. Exp. Med 216, 294–303. [DOI] [PMC free article] [PubMed] [Google Scholar]
- Gerdts J, Brace EJ, Sasaki Y, DiAntonio A, and Milbrandt J (2015). SARM1 activation triggers axon degeneration locally via NAD(+) destruction. Science 348, 453–457. [DOI] [PMC free article] [PubMed] [Google Scholar]
- Gerdts J, Sasaki Y, Vohra B, Marasa J, and Milbrandt J (2011). Image-based screening identifies novel roles for IkappaB kinase and glycogen synthase kinase 3 in axonal degeneration. J. Biol. Chem 286, 28011–28018. [DOI] [PMC free article] [PubMed] [Google Scholar]
- Gerdts J, Summers DW, Sasaki Y, DiAntonio A, and Milbrandt J (2013). Sarm1-mediated axon degeneration requires both SAM and TIR interactions. J. Neurosci 33, 13569–13580. [DOI] [PMC free article] [PubMed] [Google Scholar]
- Gilley J, and Coleman MP (2010). Endogenous Nmnat2 is an essential survival factor for maintenance of healthy axons. PLoS Biol. 8, e1000300. [DOI] [PMC free article] [PubMed] [Google Scholar]
- Gilley J, Orsomando G, Nascimento-Ferreira I, and Coleman MP (2015). Absence of SARM1 rescues development and survival of NMNAT2-deficient axons. Cell Rep. 10, 1974–1981. [DOI] [PMC free article] [PubMed] [Google Scholar]
- Gilley J, Ribchester RR, and Coleman MP (2017). Sarm1 Deletion, but Not Wld(S), Confers Lifelong Rescue in a Mouse Model of Severe Axonopathy. Cell Rep. 21, 10–16. [DOI] [PMC free article] [PubMed] [Google Scholar]
- Goddard TD, Huang CC, Meng EC, Pettersen EF, Couch GS, Morris JH, and Ferrin TE (2018). UCSF ChimeraX: Meeting modern challenges in visualization and analysis. Protein Sci. 27, 14–25. [DOI] [PMC free article] [PubMed] [Google Scholar]
- Gu W, Luo Z, Vonrhein C, Jia X, Ve T, Nanson JD, and Kobe B (2021). Crystal structure determination of the armadillo repeat domain of Drosophila SARM1 using MIRAS phasing. bioRxiv, 10.1101/2021.1101.1131.428505. [DOI] [PMC free article] [PubMed] [Google Scholar]
- Henninger N, Bouley J, Sikoglu EM, An J, Moore CM, King JA, Bowser R, Freeman MR, and Brown RH Jr. (2016). Attenuated traumatic axonal injury and improved functional outcome after traumatic brain injury in mice lacking Sarm1. Brain 139, 1094–1105. [DOI] [PMC free article] [PubMed] [Google Scholar]
- Hikosaka K, et al. (2014). Deficiency of nicotinamide mononucleotide adenylyltransferase 3 (nmnat3) causes hemolytic anemia by altering the glycolytic flow in mature erythrocytes. J. Biol. Chem 289, 14796–14811. [DOI] [PMC free article] [PubMed] [Google Scholar]
- Holm L (2020). Using Dali for Protein Structure Comparison. Methods Mol. Biol 2112, 29–42. [DOI] [PubMed] [Google Scholar]
- Horsefield S, et al. (2019). NAD(+) cleavage activity by animal and plant TIR domains in cell death pathways. Science 365, 793–799. [DOI] [PubMed] [Google Scholar]
- Huber AH, Nelson WJ, and Weis WI (1997). Three-dimensional structure of the armadillo repeat region of beta-catenin. Cell 90, 871–882. [DOI] [PubMed] [Google Scholar]
- Hughes RO, Bosanac T, Mao X, Engber TM, DiAntonio A, Milbrandt J, Devraj R, and Krauss R (2021). Small Molecule SARM1 Inhibitors Recapitulate the SARM1(−/−) Phenotype and Allow Recovery of a Metastable Pool of Axons Fated to Degenerate. Cell Rep. 34, 108588. [DOI] [PMC free article] [PubMed] [Google Scholar]
- Jiang Y, Liu T, Lee CH, Chang Q, Yang J, and Zhang Z (2020). The NAD(+)-mediated self-inhibition mechanism of pro-neurodegenerative SARM1. Nature 588, 658–663. [DOI] [PubMed] [Google Scholar]
- Kidmose RT, Juhl J, Nissen P, Boesen T, Karlsen JL, and Pedersen BP (2019). Namdinator - automatic molecular dynamics flexible fitting of structural models into cryo-EM and crystallography experimental maps. IUCrJ 6, 526–531. [DOI] [PMC free article] [PubMed] [Google Scholar]
- Ko KW, Milbrandt J, and DiAntonio A (2020). SARM1 acts downstream of neuroinflammatory and necroptotic signaling to induce axon degeneration. J. Cell Biol 219. [DOI] [PMC free article] [PubMed] [Google Scholar]
- Kobe B, and Kajava AV (2000). When protein folding is simplified to protein coiling: the continuum of solenoid protein structures. Trends Biochem. Sci 25, 509–515. [DOI] [PubMed] [Google Scholar]
- Koziara KB, Stroet M, Malde AK, and Mark AE (2014). Testing and validation of the Automated Topology Builder (ATB) version 2.0: prediction of hydration free enthalpies. J. Comput. Aided Mol. Des 28, 221–233. [DOI] [PubMed] [Google Scholar]
- Krauss R, Bosanac T, Devraj R, Engber T, and Hughes RO (2020). Axons Matter: The Promise of Treating Neurodegenerative Disorders by Targeting SARM1-Mediated Axonal Degeneration. Trends Pharmacol. Sci 41, 281–293. [DOI] [PubMed] [Google Scholar]
- Krissinel E, and Henrick K (2007). Inference of macromolecular assemblies from crystalline state. J. Mol. Biol 372, 774–797. [DOI] [PubMed] [Google Scholar]
- Kunz AP, Allison JR, Geerke DP, Horta BA, Hunenberger PH, Riniker S, Schmid N, and van Gunsteren WF (2012). New functionalities in the GROMOS biomolecular simulation software. J. Comput. Chem 33, 340–353. [DOI] [PubMed] [Google Scholar]
- Laskowski RA, Jabłońska J, Pravda L, Vařeková RS, and Thornton JM (2018). PDBsum: Structural summaries of PDB entries. Protein Sci. 27, 129–134. [DOI] [PMC free article] [PubMed] [Google Scholar]
- Liu HW, Smith CB, Schmidt MS, Cambronne XA, Cohen MS, Migaud ME, Brenner C, and Goodman RH (2018). Pharmacological bypass of NAD(+) salvage pathway protects neurons from chemotherapy-induced degeneration. Proc. Natl. Acad. Sci. U. S. A 115, 10654–10659. [DOI] [PMC free article] [PubMed] [Google Scholar]
- Llobet Rosell A, and Neukomm LJ (2019). Axon death signalling in Wallerian degeneration among species and in disease. Open Biol 9, 190118. [DOI] [PMC free article] [PubMed] [Google Scholar]
- Lois C, Hong EJ, Pease S, Brown EJ, and Baltimore D (2002). Germline transmission and tissue-specific expression of transgenes delivered by lentiviral vectors. Science 295, 868–872. [DOI] [PubMed] [Google Scholar]
- Loreto A, et al. (2020). Potent activation of SARM1 by NMN analogue VMN underlies vacor neurotoxicity. bioRxiv, 10.1101/2020.1109.1118.304261. [DOI] [Google Scholar]
- Loreto A, Di Stefano M, Gering M, and Conforti L (2015). Wallerian Degeneration Is Executed by an NMN-SARM1-Dependent Late Ca(2+) Influx but Only Modestly Influenced by Mitochondria. Cell Rep. 13, 2539–2552. [DOI] [PubMed] [Google Scholar]
- Loring HS, and Thompson PR (2020). Emergence of SARM1 as a Potential Therapeutic Target for Wallerian-type Diseases. Cell Chem Biol 27, 1–13. [DOI] [PMC free article] [PubMed] [Google Scholar]
- Ma S, et al. (2020). Direct pathogen-induced assembly of an NLR immune receptor complex to form a holoenzyme. Science 370, eabe3069. [DOI] [PubMed] [Google Scholar]
- Malde AK, Zuo L, Breeze M, Stroet M, Poger D, Nair PC, Oostenbrink C, and Mark AE (2011). An Automated Force Field Topology Builder (ATB) and Repository: Version 1.0. J. Chem. Theory Comput 7, 4026–4037. [DOI] [PubMed] [Google Scholar]
- Marion CM, McDaniel DP, and Armstrong RC (2019). Sarm1 deletion reduces axon damage, demyelination, and white matter atrophy after experimental traumatic brain injury. Exp. Neurol 321, 113040. [DOI] [PubMed] [Google Scholar]
- Martin R, Qi T, Zhang H, Liu F, King M, Toth C, Nogales E, and Staskawicz BJ (2020). Structure of the activated ROQ1 resistosome directly recognizing the pathogen effector XopQ. Science 370, eabd9993. [DOI] [PMC free article] [PubMed] [Google Scholar]
- Matsuura Y, and Stewart M (2004). Structural basis for the assembly of a nuclear export complex. Nature 432, 872–877. [DOI] [PubMed] [Google Scholar]
- Mayer M, and Meyer B (1999). Characterization of Ligand Binding by Saturation Transfer Difference NMR Spectroscopy. Angew. Chem. Int. Ed. Engl 38, 1784–1788. [DOI] [PubMed] [Google Scholar]
- Maynard ME, Redell JB, Zhao J, Hood KN, Vita SM, Kobori N, and Dash PK (2020). Sarm1 loss reduces axonal damage and improves cognitive outcome after repetitive mild closed head injury. Exp. Neurol 327, 113207. [DOI] [PMC free article] [PubMed] [Google Scholar]
- McCoy AJ (2007). Solving structures of protein complexes by molecular replacement with Phaser. Acta Crystallogr. D Biol. Crystallogr 63, 32–41. [DOI] [PMC free article] [PubMed] [Google Scholar]
- Mehmel M, Jovanovic N, and Spitz U (2020). Nicotinamide Riboside-The Current State of Research and Therapeutic Uses. Nutrients 12. [DOI] [PMC free article] [PubMed] [Google Scholar]
- Notredame C, Higgins DG, and Heringa J (2000). T-Coffee: A novel method for fast and accurate multiple sequence alignment. J. Mol. Biol 302, 205–217. [DOI] [PubMed] [Google Scholar]
- Oostenbrink C, Villa A, Mark AE, and van Gunsteren WF (2004). A biomolecular force field based on the free enthalpy of hydration and solvation: the GROMOS force-field parameter sets 53A5 and 53A6. J. Comput. Chem 25, 1656–1676. [DOI] [PubMed] [Google Scholar]
- Osterloh JM, et al. (2012). dSarm/Sarm1 is required for activation of an injury-induced axon death pathway. Science 337, 481–484. [DOI] [PMC free article] [PubMed] [Google Scholar]
- Park J, et al. (2020). Quaternary structures of Vac8 differentially regulate the Cvt and PMN pathways. Autophagy 16, 991–1006. [DOI] [PMC free article] [PubMed] [Google Scholar]
- Pintilie GD, Zhang J, Goddard TD, Chiu W, and Gossard DC (2010). Quantitative analysis of cryo-EM density map segmentation by watershed and scale-space filtering, and fitting of structures by alignment to regions. J. Struct. Biol 170, 427–438. [DOI] [PMC free article] [PubMed] [Google Scholar]
- Piotto M, Saudek V, and Sklenar V (1992). Gradient-tailored excitation for single-quantum NMR spectroscopy of aqueous solutions. J. Biomol. NMR 2, 661–665. [DOI] [PubMed] [Google Scholar]
- Punjani A, Rubinstein JL, Fleet DJ, and Brubaker MA (2017). cryoSPARC: algorithms for rapid unsupervised cryo-EM structure determination. Nat. Methods 14, 290–296. [DOI] [PubMed] [Google Scholar]
- Rosenthal PB, and Henderson R (2003). Optimal determination of particle orientation, absolute hand, and contrast loss in single-particle electron cryomicroscopy. J. Mol. Biol 333, 721–745. [DOI] [PubMed] [Google Scholar]
- Ryckaert J-P, Ciccotti G, and Berendsen HJC (1977). Numerical integration of the cartesian equations of motion of a system with constraints: molecular dynamics of n-alkanes. J. Comput. Phys 23, 327–341. [Google Scholar]
- Salomon-Ferrer R, Gotz AW, Poole D, Le Grand S, and Walker RC (2013). Routine Microsecond Molecular Dynamics Simulations with AMBER on GPUs. 2. Explicit Solvent Particle Mesh Ewald. J. Chem. Theory Comput 9, 3878–3888. [DOI] [PubMed] [Google Scholar]
- Sanchez-Garcia R, Gomez-Blanco J, Cuervo A, Carazo JM, Sorzano COS, and Vargas J (2020). DeepEMhancer: a deep learning solution for cryo-EM volume post-processing. bioRxiv, 10.1101/2020.1106.1112.148296. [DOI] [PMC free article] [PubMed] [Google Scholar]
- Saridakis V, Christendat D, Kimber MS, Dharamsi A, Edwards AM, and Pai EF (2001). Insights into ligand binding and catalysis of a central step in NAD+ synthesis: structures of Methanobacterium thermoautotrophicum NMN adenylyltransferase complexes. J. Biol. Chem 276, 7225–7232. [DOI] [PubMed] [Google Scholar]
- Sasaki Y, et al. (2020a). cADPR is a gene dosage-sensitive biomarker of SARM1 activity in healthy, compromised, and degenerating axons. Exp. Neurol 329, 113252. [DOI] [PMC free article] [PubMed] [Google Scholar]
- Sasaki Y, et al. (2020b). SARM1 depletion rescues NMNAT1-dependent photoreceptor cell death and retinal degeneration. Elife 9, e62027. [DOI] [PMC free article] [PubMed] [Google Scholar]
- Sasaki Y, Nakagawa T, Mao X, DiAntonio A, and Milbrandt J (2016). NMNAT1 inhibits axon degeneration via blockade of SARM1-mediated NAD(+) depletion. Elife 5, e19749. [DOI] [PMC free article] [PubMed] [Google Scholar]
- Sasaki Y, Vohra BP, Lund FE, and Milbrandt J (2009). Nicotinamide mononucleotide adenylyl transferase-mediated axonal protection requires enzymatic activity but not increased levels of neuronal nicotinamide adenine dinucleotide. J. Neurosci 29, 5525–5535. [DOI] [PMC free article] [PubMed] [Google Scholar]
- Scheres SH, and Chen S (2012). Prevention of overfitting in cryo-EM structure determination. Nat. Methods 9, 853–854. [DOI] [PMC free article] [PubMed] [Google Scholar]
- Schmid N, Christ CD, Christen M, Eichenberger AP, and van Gunsteren WF (2012). Architecture, implementation and parallelisation of the GROMOS software for biomolecular simulation. Comput. Phys. Commun 183, 890–903. [Google Scholar]
- Schmid N, Eichenberger AP, Choutko A, Riniker S, Winger M, Mark AE, and van Gunsteren WF (2011). Definition and testing of the GROMOS force-field versions 54A7 and 54B7. Eur. Biophys. J 40, 843–856. [DOI] [PubMed] [Google Scholar]
- Shen C, et al. (2021). Multiple domain interfaces mediate SARM1 autoinhibition. Proc. Natl. Acad. Sci. U. S. A 118, e2023151118. [DOI] [PMC free article] [PubMed] [Google Scholar]
- Shimizu H, Toma-Fukai S, Saijo S, Shimizu N, Kontani K, Katada T, and Shimizu T (2017). Structure-based analysis of the guanine nucleotide exchange factor SmgGDS reveals armadillo-repeat motifs and key regions for activity and GTPase binding. J. Biol. Chem 292, 13441–13448. [DOI] [PMC free article] [PubMed] [Google Scholar]
- Sklenar V, Piotto M, Leppik R, and Saudek V (1993). Gradient-Tailored Water Suppression for 1H-15N HSQC Experiments Optimized to Retain Full Sensitivity. J. Magn. Reson 102, 241–245. [Google Scholar]
- Sporny M, et al. (2020). Structural basis for SARM1 inhibition and activation under energetic stress. Elife 9, e62021. [DOI] [PMC free article] [PubMed] [Google Scholar]
- Sporny M, Guez-Haddad J, Lebendiker M, Ulisse V, Volf A, Mim C, Isupov MN, and Opatowsky Y (2019). Structural Evidence for an Octameric Ring Arrangement of SARM1. J. Mol. Biol 431, 3591–3605. [DOI] [PubMed] [Google Scholar]
- Stewart SA, et al. (2003). Lentivirus-delivered stable gene silencing by RNAi in primary cells. RNA 9, 493–501. [DOI] [PMC free article] [PubMed] [Google Scholar]
- Stols L, Gu M, Dieckman L, Raffen R, Collart FR, and Donnelly MI (2002). A new vector for high-throughput, ligation-independent cloning encoding a tobacco etch virus protease cleavage site. Protein Expr. Purif 25, 8–15. [DOI] [PubMed] [Google Scholar]
- Stroet M, Caron B, Visscher KM, Geerke DP, Malde AK, and Mark AE (2018). Automated Topology Builder Version 3.0: Prediction of Solvation Free Enthalpies in Water and Hexane. J. Chem. Theory Comput 14, 5834–5845. [DOI] [PubMed] [Google Scholar]
- Studier FW (2005). Protein production by auto-induction in high-density shaking cultures. Protein Expr. Purif 41, 207–234. [DOI] [PubMed] [Google Scholar]
- Summers DW, Gibson DA, DiAntonio A, and Milbrandt J (2016). SARM1-specific motifs in the TIR domain enable NAD+ loss and regulate injury-induced SARM1 activation. Proc. Natl. Acad. Sci. U. S. A 113, E6271–E6280. [DOI] [PMC free article] [PubMed] [Google Scholar]
- Sun J, Siroy A, Lokareddy RK, Speer A, Doornbos KS, Cingolani G, and Niederweis M (2015). The tuberculosis necrotizing toxin kills macrophages by hydrolyzing NAD. Nat. Struct. Mol. Biol 22, 672–678. [DOI] [PMC free article] [PubMed] [Google Scholar]
- Szretter KJ, Samuel MA, Gilfillan S, Fuchs A, Colonna M, and Diamond MS (2009). The immune adaptor molecule SARM modulates tumor necrosis factor alpha production and microglia activation in the brainstem and restricts West Nile Virus pathogenesis. J. Virol 83, 9329–9338. [DOI] [PMC free article] [PubMed] [Google Scholar]
- Tak U, Vlach J, Garza-Garcia A, William D, Danilchanka O, de Carvalho LPS, Saad JS, and Niederweis M (2019). The tuberculosis necrotizing toxin is an NAD(+) and NADP(+) glycohydrolase with distinct enzymatic properties. J. Biol. Chem 294, 3024–3036. [DOI] [PMC free article] [PubMed] [Google Scholar]
- Tewari R, Bailes E, Bunting KA, and Coates JC (2010). Armadillo-repeat protein functions: questions for little creatures. Trends Cell Biol. 20, 470–481. [DOI] [PubMed] [Google Scholar]
- Turkiew E, Falconer D, Reed N, and Hoke A (2017). Deletion of Sarm1 gene is neuroprotective in two models of peripheral neuropathy. J. Peripher. Nerv. Syst 22, 162–171. [DOI] [PMC free article] [PubMed] [Google Scholar]
- Vonrhein C, Blanc E, Roversi P, and Bricogne G (2007). Automated structure solution with autoSHARP. Methods Mol. Biol 364, 215–230. [DOI] [PubMed] [Google Scholar]
- Vonrhein C, Flensburg C, Keller P, Sharff A, Smart O, Paciorek W, Womack T, and Bricogne G (2011). Data processing and analysis with the autoPROC toolbox. Acta Crystallogr. D Biol. Crystallogr 67, 293–302. [DOI] [PMC free article] [PubMed] [Google Scholar]
- Wallace AC, Laskowski RA, and Thornton JM (1995). LIGPLOT: a program to generate schematic diagrams of protein-ligand interactions. Protein Eng. 8, 127–134. [DOI] [PubMed] [Google Scholar]
- Wan L, et al. (2019). TIR domains of plant immune receptors are NAD(+)-cleaving enzymes that promote cell death. Science 365, 799–803. [DOI] [PMC free article] [PubMed] [Google Scholar]
- Webb B, and Sali A (2016). Comparative Protein Structure Modeling Using MODELLER. Curr Protoc Bioinformatics 54, 5.6.1–5.6.37. [DOI] [PMC free article] [PubMed] [Google Scholar]
- Williams CJ, et al. (2018). MolProbity: More and better reference data for improved all-atom structure validation. Protein Sci. 27, 293–315. [DOI] [PMC free article] [PubMed] [Google Scholar]
- Zhao ZY, et al. (2019). A Cell-Permeant Mimetic of NMN Activates SARM1 to Produce Cyclic ADP-Ribose and Induce Non-apoptotic Cell Death. iScience 15, 452–466. [DOI] [PMC free article] [PubMed] [Google Scholar]
- Zhou T, Kurnasov O, Tomchick DR, Binns DD, Grishin NV, Marquez VE, Osterman AL, and Zhang H (2002). Structure of Human Nicotinamide/Nicotinic Acid Mononucleotide Adenylyltransferase: Basis for the dual substrate specificity and activation of the oncolytic agent tiazofurin. J. Biol. Chem 277, 13148–13154. [DOI] [PubMed] [Google Scholar]
- Ziogas NK, and Koliatsos VE (2018). Primary Traumatic Axonopathy in Mice Subjected to Impact Acceleration: A Reappraisal of Pathology and Mechanisms with High-Resolution Anatomical Methods. J. Neurosci 38, 4031–4047. [DOI] [PMC free article] [PubMed] [Google Scholar]
Associated Data
This section collects any data citations, data availability statements, or supplementary materials included in this article.
Supplementary Materials
Data Availability Statement
Ligand-free and NMN bound dSARMARM crystal structures have been deposited in the Protein Data Bank (7LCY and 7LCZ), respectively. The ligand-free hSARM128–724 cryo-EM map and structure have been deposited to the Electron Microscopy Data Bank (EMD-23278 and Protein Data Bank (7LDO), respectively.