
Figure 3.
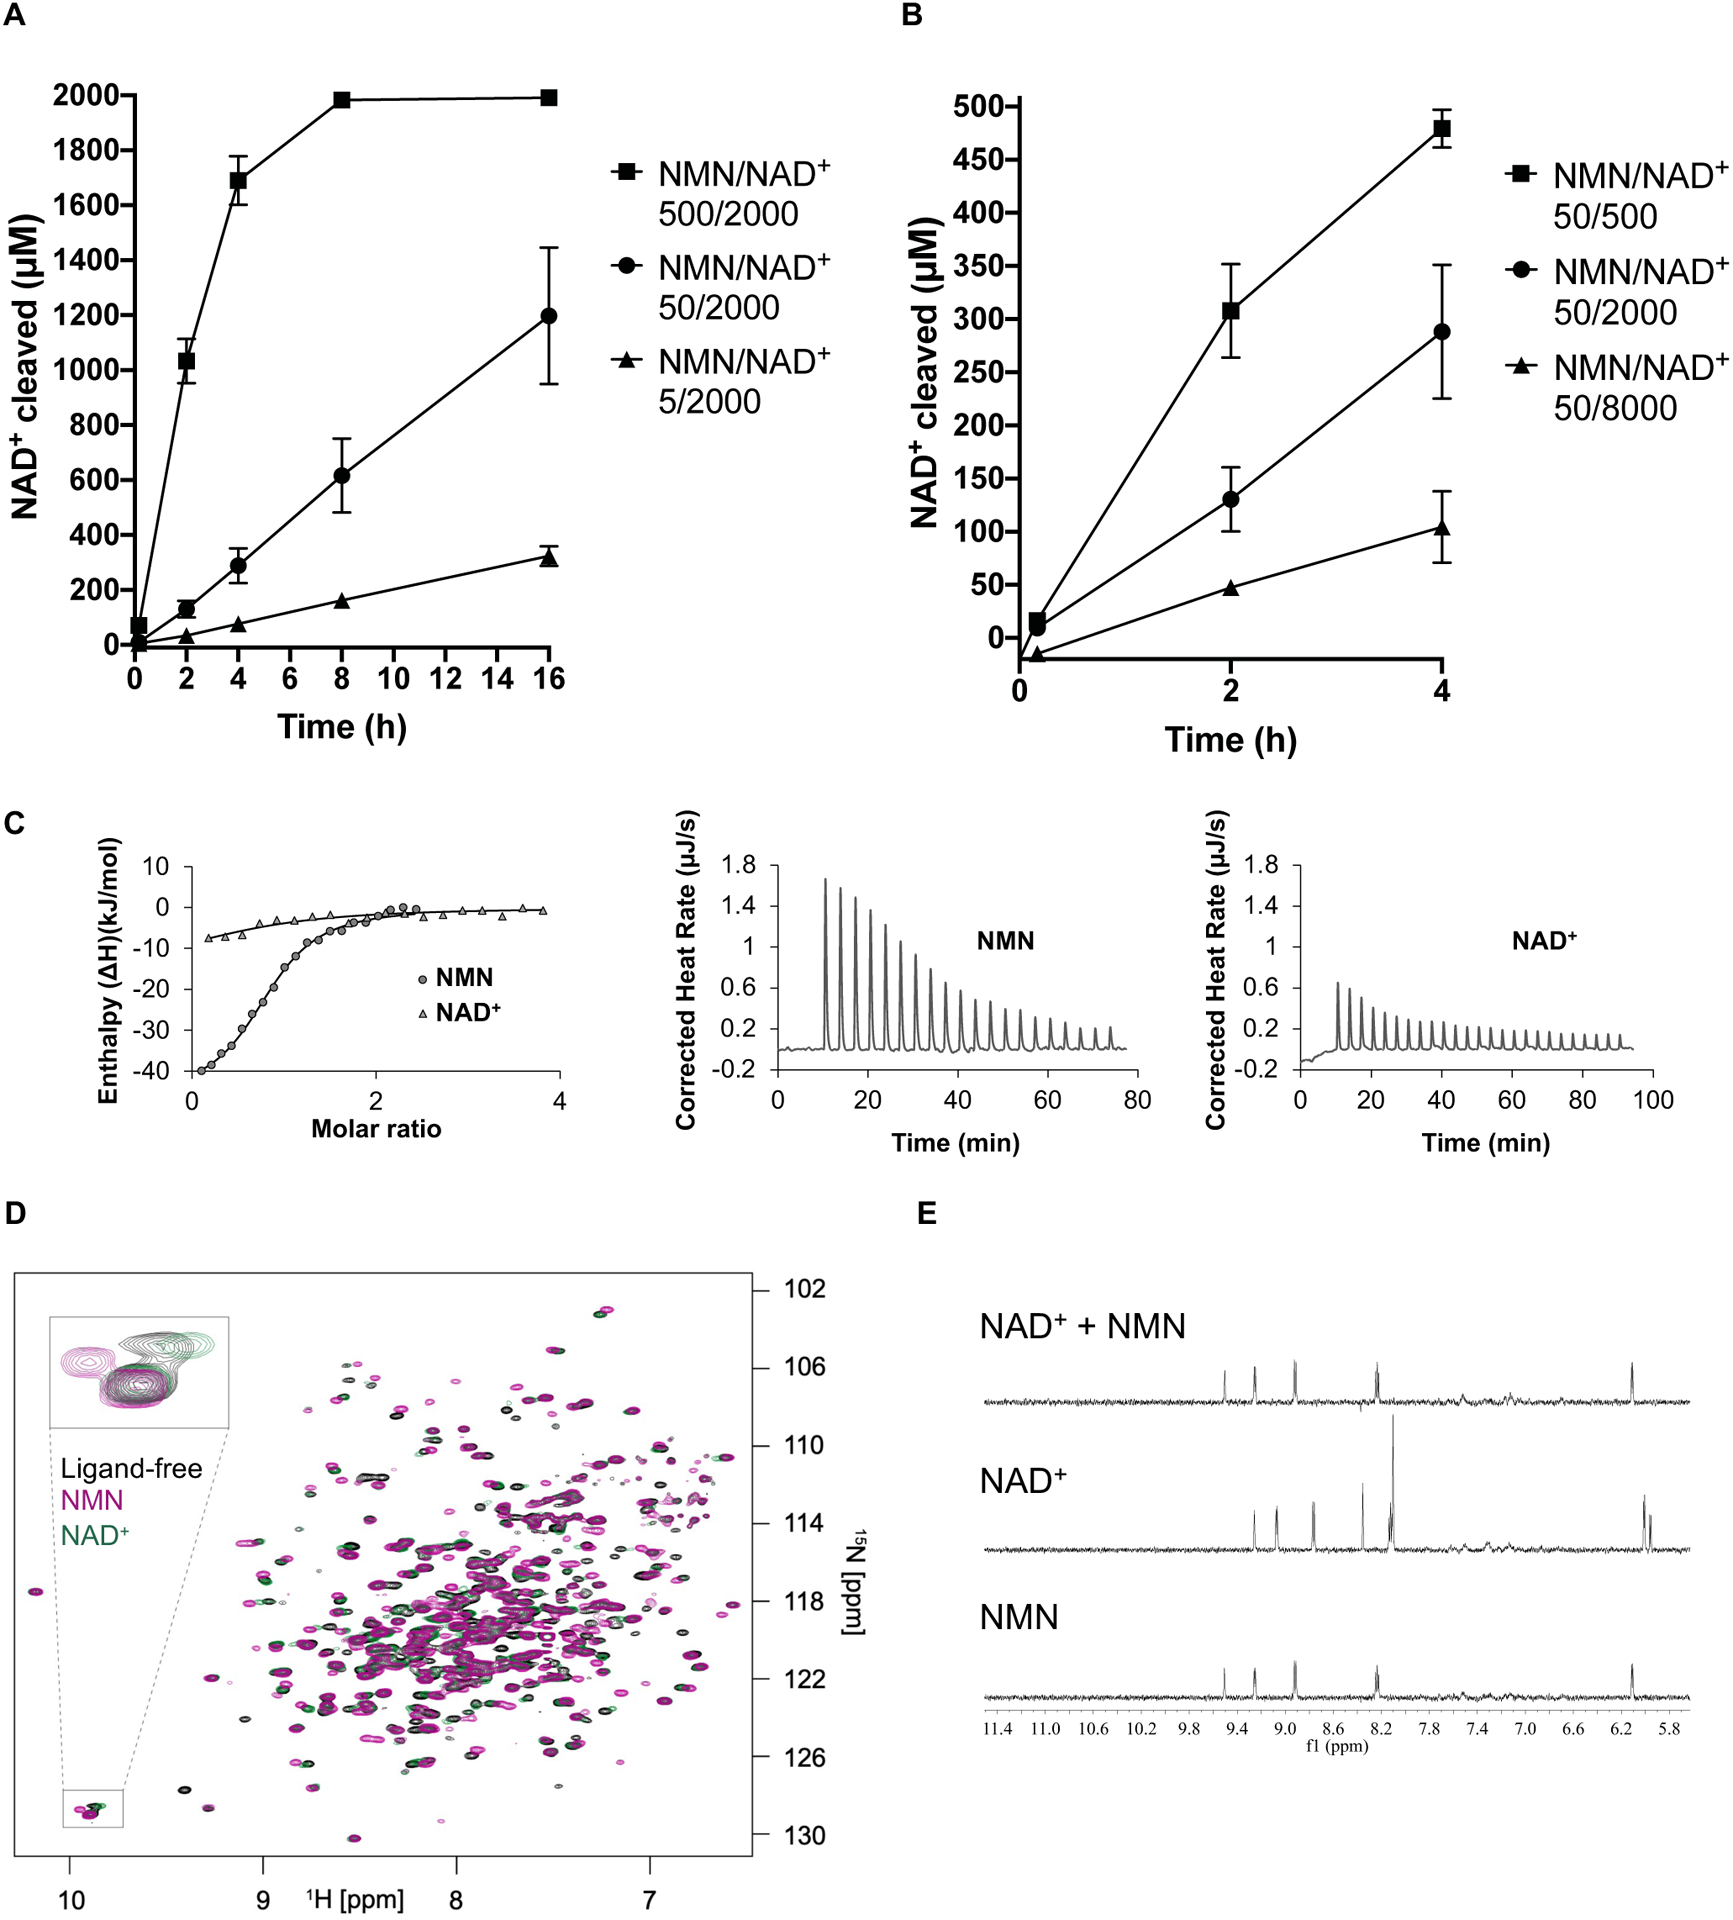
NMN/NAD+ ratio controls NADase activity of recombinantly produced SARM1.
A Increasing the NMN/NAD+ ratio by raising the NMN concentration (5–500 μM) leads to higher NAD+-cleavage activity by hSARM1 (500 nM). Initial NAD+ concentration was 2000 μM for all NMR samples. The mean and range of two experiments are shown.
B Increasing the NMN/NAD+ ratio by lowering initial NAD+ concentration (8 mM – 500 uM) leads to higher NAD+ cleavage activity by hSARM1 (500 nM). The NMN concentration was 50 μM for all NMR samples. Only data from the initial 4 h are shown as the reaction for the 500 μM NAD sample was almost complete by 4 h. The mean and range of two experiments are shown.
C Integrated (left) and raw (right) ITC data for the titration of 0.4 mM NMN with 60 μM dSARM1ARM and 1 mM NAD+ with 80 μM dSARM1ARM.
D Overlay of 15N-TROSY-HSQC NMR spectra, showing the effect of NMN (0.15 mM, purple) and NAD+ (0.15 mM, green) binding to 15N-labelled dSARM1ARM (0.15 mM, black). The inset shows an expansion of the tryptophan indole chemical shift region of the spectrum, where NMN addition causes a larger chemical shift change, and in the opposite direction, than addition of NAD+.
E Expansions of STD NMR spectra, showing saturation-transfer signals in the aromatic region for dSARM1ARM (40 μM) interactions with NMN (1 mM), NAD+ (1 mM), and NMN plus NAD+ (1 mM of each).
See also Figure S3.