
Figure 6.
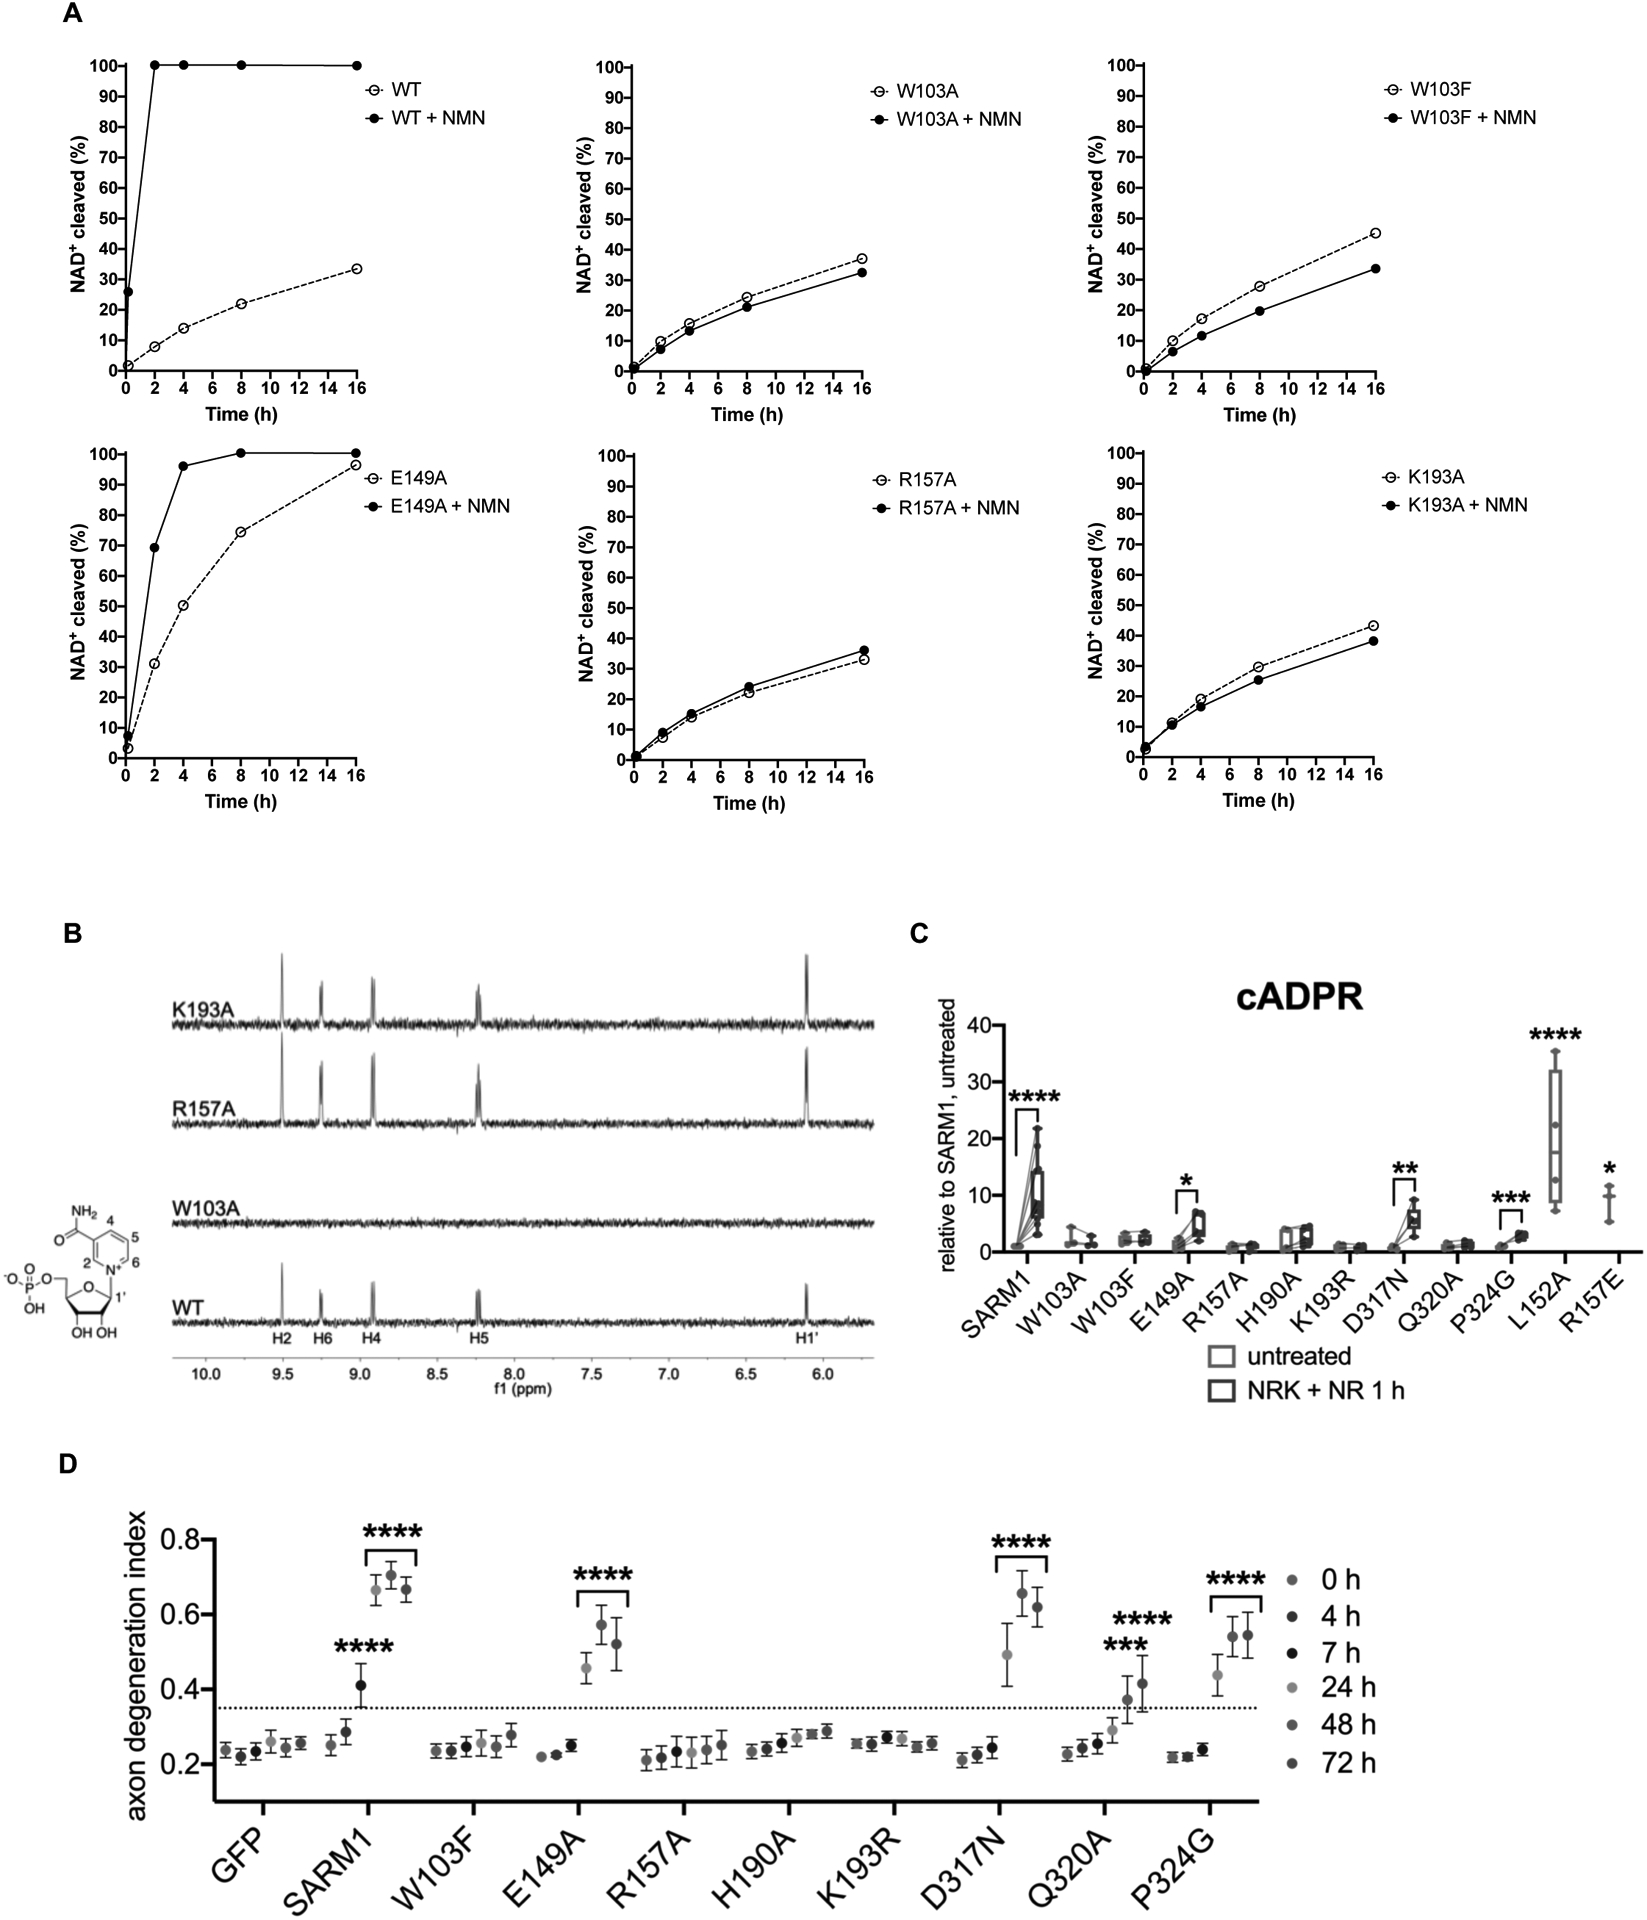
Mutations in the NMN-binding pocket of human SARM1 block NMN- and injury-dependent SARM1 activation.
A Multiple binding-site mutants disrupt NMN-activation of hSARM1 (500 nM) enzyme activity. The NMN concentration was 500 μM for all NMR samples.
B STD NMR spectra showing NMN (500 μM) binding to hSARM1 mutants (5.25 μM).
C cADPR levels from primary eDRG neurons from Sarm1−/− mice expressing wild-type or mutant SARM1 from lentivirus for 5 days, untreated or after 1 h NR [100 μM] treatment, relative to levels from untreated wild-type SARM1 expressing neurons, measured by LC-MS-MS. Data correspond to means from replicate experiments. The box represents the 25–75% and the whiskers extend to maximum and minimum values, to include all data points. Statistical significance was determined by unpaired t-tests comparing untreated to NRK + NR 1 h conditions. Lines connect paired data from individual biological replicates. Two-way ANOVA with Dunnett’s test for multiple comparisons was used to compare untreated SARM1 to untreated SARM1 L152A and R157E. * denotes P value=<0.05; **=<0.01; ***=<0.001; ****=<0.0001.
D Axon degeneration time course after axotomy in primary eDRG neurons from Sarm1−/− mice expressing wild-type or mutant SARM1 from lentivirus, quantified as degeneration index (DI), where a DI of 0.35 or above represents degenerated axons. Data correspond to means from replicate experiments and error bars denote ±SEM. Statistical significance was determined by two-way ANOVA with Dunnett’s multiple comparison test, comparing each time-point to time 0 h within each condition. * denotes P value=<0.05; **=<0.01; ***=<0.001; ****=<0.0001.
See also Figure S7.