

Abstract
Background
Current postresuscitative care after cardiac arrest (CA) does not address the cause of CA. We previously reported that asphyxial CA (ACA) and ventricular fibrillation CA (VFCA) elicit unique injury signatures. We hypothesized that the early cytokine profiles of the serum, heart, and brain differ in response to ACA versus VFCA.
Methods and Results
Adult male rats were subjected to 10 minutes of either ACA or VFCA. Naives and shams (anesthesia and surgery without CA) served as controls (n=12/group). Asphyxiation produced an ≈4‐minute period of progressive hypoxemia followed by a no‐flow duration of ≈6±1 minute. Ventricular fibrillation immediately induced no flow. Return of spontaneous circulation was achieved earlier after ACA compared with VFCA (42±18 versus 105±22 seconds; P<0.001). Brain cytokines in naives were, in general, low or undetectable. Shams exhibited a modest effect on select cytokines. Both ACA and VFCA resulted in robust cytokine responses in serum, heart, and brain at 3 hours. Significant regional differences pinpointed the striatum as a key location of neuroinflammation. No significant differences in cytokines, neuron‐specific enolase, S100b, and troponin T were observed across CA models.
Conclusions
Both models of CA resulted in marked systemic, heart, and brain cytokine responses, with similar degrees of change across the 2 CA insults. Changes in cytokine levels after CA were most pronounced in the striatum compared with other brain regions. These collective observations suggest that the amplitude of the changes in cytokine levels after ACA versus VFCA may not mediate the differences in secondary injuries between these 2 CA phenotypes.
Keywords: brain/metabolism, cardiopulmonary resuscitation, corpus striatum/metabolism, cytokines/metabolism, heart arrest/physiopathology, tumor necrosis factor‐α/metabolism
Subject Categories: Cardiopulmonary Resuscitation and Emergency Cardiac Care, Ischemia, Basic Science Research, Inflammation, Biomarkers
Nonstandard Abbreviations and Acronyms
- ACA
asphyxial cardiac arrest
- CA
cardiac arrest
- GMCSF
granulocyte‐macrophage colony‐stimulating factor
- NSE
neuron‐specific enolase
- ROSC
return of spontaneous circulation
- RT
resuscitation time
- VFCA
ventricular fibrillation cardiac arrest
Clinical Perspective
What Is New?
Both models of cardiac arrest (CA) (ie, asphyxial CA and ventricular fibrillation CA) resulted in marked systemic, heart, and brain cytokine responses that displayed similar degrees of change across the 2 CA insults.
Biomarkers of central nervous system and cardiac injury were also similar, suggesting comparable severity of the respective insults.
The inflammatory response was most pronounced in the striatum in both models.
What Are the Clinical Implications?
Previously documented differences in outcomes between these 2 CA phenotypes, with worse neurologic injury after asphyxia contrasting worse cardiac injury after ventricular fibrillation, may not be mediated by inflammatory response.
Either model could be used in future studies to test novel therapies targeting post‐CA syndrome.
After successful cardiopulmonary resuscitation from prolonged cardiac arrest (CA), patients may develop a “sepsis‐like” syndrome with systemic cytokine responses, resulting in myocardial and brain dysfunction, endothelial disruption, and increased blood‐brain barrier permeability. This deleterious, exaggerated systemic inflammatory response to whole‐body ischemia‐reperfusion resembles the pathophysiologic processes commonly seen in infection‐related sepsis. The term post‐CA syndrome has been coined for this complex multiorgan dysfunction. 1
After successful resuscitation, cerebral reperfusion, although essential and effective in restoring energy stores, triggers harmful biochemical cascades, among which neuroinflammation is thought to play a key role. Various inflammatory cytokines have been implicated as important mediators of ischemia/reperfusion injury in both the brain and extracerebral organs. 2
Current postresuscitative care for survivors of CA does not account for the cause of CA. However, there are significant differences between the pathophysiological features and outcome from asphyxial CA (ACA) versus ventricular fibrillation CA (VFCA). We previously reported that ACA results in worse neurologic outcomes and greater cerebral oxidative stress, whereas VFCA with the same duration of no flow results in worse cardiac injury. 3 We hypothesized that a mechanistic explanation for differences in brain injury between ACA and VFCA might be higher brain cytokine levels after ACA versus higher amplitude increases in the serum and heart after VFCA. Our goal was to define the inflammatory response in the early postresuscitation phase to subsequently identify insult‐specific targets for future therapies. To this end, we characterized changes in cytokine concentrations 3 hours after ACA versus VFCA in the rat heart, serum, and 4 selectively vulnerable regions of the brain (ie, cortex, striatum, hippocampus, and cerebellum).
Methods
The study protocol was approved by the Institutional Animal Care and Use Committee of the University of Pittsburgh (protocol No. 13021161; “neuroinflammation after prolonged cardiac arrest”). The data that support the findings of this study are available from the corresponding author on reasonable request. We used our previously established models of ACA and VFCA. 4
Preparation Phase
In brief, adult male Sprague‐Dawley rats (350–400 g) were obtained from a licensed vendor (Hilltop Lab Animals, Scottdale, PA) and housed under 12 hours/12 hours light/dark in a holding facility for at least 2 days before the experiment. Water was provided ad libitum until the experiment. Standard chow was removed 12 hours before experiment. On the day of the experiment, rats were anesthetized with 4% isoflurane (Baxter, Deerfield, IL) in fraction of inspired oxygen 1.0 in a plexiglass jar, intubated with a 14‐gauge cannula (Becton Dickinson, Sandy, UT), and mechanically ventilated (Harvard Ventilator 683; Harvard Rodent Apparatus, South Natick, MA) with tidal volume 8 mL/kg, positive end‐expiratory pressure 3 cm H2O, and respiratory rate 30 to 40/min to maintain normocapnia. Anesthesia was maintained with 2% isoflurane (fraction of inspired oxygen of 0.5). Arterial (PE50) and venous (PE90) femoral catheters were inserted via cut downs for blood pressure monitoring and drug administration. In rats scheduled for VFCA, a 5F pacing catheter was introduced through the jugular vein to the junction of right atrium and right ventricle. Rats in sham and ACA groups were subjected to jugular vein ligation to mirror surgical effects. ECG and mean arterial pressure (MAP) were continuously monitored and recorded (Polygraph; Grass Instruments, Quincy, MA). Rectal temperature was maintained at 37.0±0.5°C with a temperature‐controlled operating table, an overhead heating lamp, and a fan. After surgery, fraction of inspired oxygen was reduced to 0.3 and isoflurane was gradually weaned over 10 minutes in rats scheduled for CA.
CA and Resuscitation Phase
Four groups were studied: (1) naïve rats; (2) sham controls; (3) rats subjected to ACA; (4) rats subjected to VFCA. Naïve rats were deeply anesthetized with isoflurane, intubated, and perfused transcardially with 250 mL of ice‐cold heparinized normal saline. Sham controls were anesthetized and instrumented as described above (see Preparation Phase), but were not subjected to CA, and resuscitative drugs were not used. Isoflurane anesthesia was maintained throughout the experiment. Normothermia was maintained during the experiment.
Randomization was not possible for logistical reasons, as the preparations for individual insults differed and the experimenters could not be fully masked to the technical protocol. However, the researchers were masked to the allocation to individual groups during statistical evaluation of the primary and secondary end points.
In rats subjected to ACA, neuromuscular blockade was induced with cisatracurium (1 mg/kg; AbbVie, North Chicago, IL), mechanical ventilation was stopped, and the rat was disconnected from the ventilator. This gradually resulted in pulseless electrical activity. The period of no flow was defined as MAP <10 mm Hg. After 10 minutes of ACA (total insult), manual chest compressions were started at a rate ≈360/min along with mechanical ventilation with 100% oxygen. Epinephrine (0.01 mg/kg; Abbott, Abbott Park, IL) was given with compressions. Sodium bicarbonate (1 mEq/kg; Abbott) was given at the start of resuscitation.
In rats subjected to VFCA, no flow was induced by a 2‐minute impulse of 12 V/50 Hz alternating current and ensured by ECG readings and reduction in MAP <10 mm Hg. The pacing catheter was then removed, and the jugular vein was ligated. After 10 minutes of untreated VFCA, manual chest compressions were started at a rate ≈360/min along with mechanical ventilation with 100% oxygen. Epinephrine (0.01 mg/kg; Abbott) was given with start of compressions. Additional epinephrine (0.005 mg/kg) was given at 1 minute resuscitation time (RT). Sodium bicarbonate (1 mEq/kg; Abbott) was given at the start of resuscitation. At 2 minutes after the start of resuscitation (2 minute RT), defibrillation was attempted with a biphasic 10 J impulse (Zoll M series defibrillator; Zoll, Chelmsford, MA). If unsuccessful, subsequent shocks were delivered every 30 seconds, with a maximum of 5 attempts over 4 minutes of resuscitation effort. Return of spontaneous circulation (ROSC) was defined as sustained supraventricular rhythm with MAP >50 mm Hg.
Postoperative Care
After ROSC, rats were mechanically ventilated with fraction of inspired oxygen 1.0, tidal volume (Vt) 8 mL/kg, positive end‐expiratory pressure 5 cm H2O, and respiratory rate adjusted to maintain normocapnia. Epinephrine infusion was titrated to maintain MAP >65 mm Hg. Controlled normothermia (36.5–37.5°C) was maintained for 3 hours. At 3 hour RT, serum samples were obtained, rats were deeply anesthetized with isoflurane 4%, and rats were perfused transcardially with 250 mL of ice‐cold heparinized normal saline. Rats were then decapitated, and hearts and brains were removed and dissected into 4 regions of interest (ie, cortex, hippocampus, striatum, and cerebellum). Individual tissue samples were then snap frozen in liquid nitrogen and stored at −70℃ until further processing.
Cytokine Measurements
Tissues were then processed for cytokine assessment using the Luminex‐200 multiplex analyzer (Luminex, Austin, TX) to simultaneously measure 10 cytokines (tumor necrosis factor‐α [TNF‐α], interleukin 1a [IL‐1a], interleukin 1b [IL‐1b], interleukin 2 [IL‐2], interleukin 4 [IL‐4], interleukin 6 [IL‐6], interleukin 10 [IL‐10], interleukin 12 [IL‐12], interferon‐γ, and granulocyte‐macrophage colony‐stimulating factor [GMCSF]) using a rat‐specific kit (Millipore, Billerica, MA). All values were corrected for protein concentration. The tissue was homogenized in PBS by applying a Dounce homogenizer for 20 strokes. The homogenate was then sonicated for 10 seconds for 3 times with an interval of 20 seconds, followed by centrifugation at 16,000g for 30 minutes. The supernatant was used for cytokine analysis. Protein levels in the supernatants were measured using the BCA (bicinchoninic acid) protein kit (Thermo Fisher Scientific Inc, Rockford, IL). The samples were run singly. Data for individual cytokines that were undetectable or out of range across multiple groups, suggesting a problem with the assay, are not shown (eg, interferon‐γ in serum or GMCSF levels in all individual brain regions). The values beyond the standard range were extrapolated automatically from the calibration curve by the Luminex software. Cytokine concentrations that were read as “out of range below” were nominally assigned a value at one hundredth of the lowest level on the calibration scale.
Biomarkers of Organ‐Specific Injury
Biomarkers of neuronal injury (neuron‐specific enolase [NSE]) and glial injury (S100b) were assessed using ELISA kits (MyBioSource catalog Nos. MBS028924 and MBS046922, respectively), according to manufacturer’s instructions. Myocardial injury was assessed using rat‐specific troponin‐T ELISA kit (MyBioSource catalog No. MBS269369).
Statistical Analysis
The analysis was performed using IBM SPSS Statistics 26.0 software (International Business Machines Corporation, Armonk, NY). Data were tested for normality using the Kolmogorov‐Smirnov test. All physiologic and biochemical data are expressed as the mean±SD. Cytokine levels are presented as median and the first and the third quartile. The differences in cytokines between groups were assessed using the Kruskal‐Wallis test, followed by the Mann‐Whitney test with the Bonferroni post hoc correction. The differences in physiological and biochemical values between groups were evaluated with an ANOVA with the Bonferroni post hoc correction (MAP, heart rate, and biochemical values) or the Tukey post hoc test (NSE, S100b, and troponin T). Changes in physiological and biochemical parameters compared with baseline values were evaluated using a paired‐sample t test. Two‐sided P values are reported. P<0.05 was considered statistically significant.
Results
Asphyxia resulted in ≈6±1 minute no flow. Ventricular fibrillation resulted in immediate CA and no flow of 10 minutes (Figure 1). Three rats in the ACA group did not achieve ROSC, whereas 2 rats in the VFCA group did not achieve ROSC and 1 rat did not survive until the planned euthanasia at 3 hours RT. These rats were excluded from further analyses, for not achieving the study protocol. ROSC was achieved earlier after ACA versus VFCA (42±18 versus 105±22 seconds; P<0.001). Both ACA and VFCA resulted in significant metabolic derangements versus baseline values. Metabolic acidosis was more pronounced and lactate levels were higher after VFCA versus ACA. These derangements were gradually corrected over time (Table 1). Heart rate and MAP were lower in the early postarrest period after VFCA compared with ACA. The total dose of epinephrine needed to maintain MAP >65 mm Hg was 160±200 µg in ACA versus 190±160 µg in VFCA group (P>0.05).
Figure 1. Representative traces of ECGs (green line), arterial pressures (red line), and central venous pressures (blue line) during ventricular fibrillation cardiac arrest (VFCA; top panel) and asphyxial cardiac arrest (ACA; bottom panel).
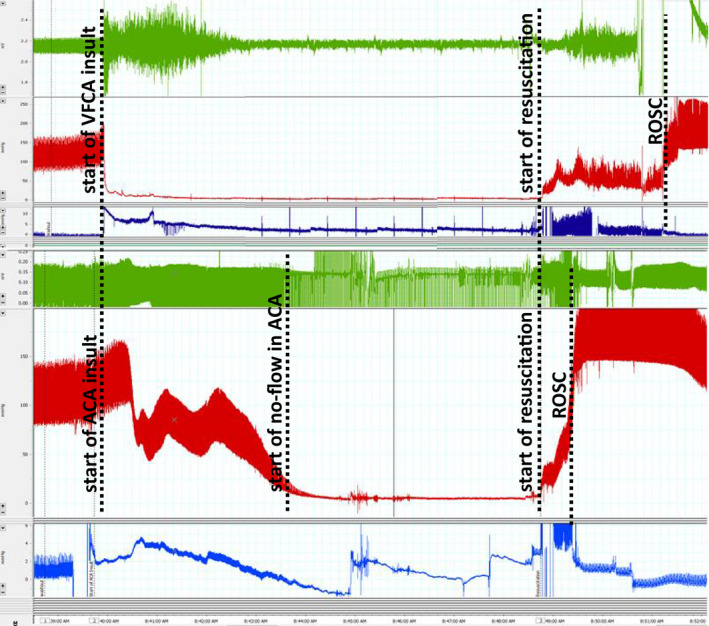
No‐flow time was defined as mean arterial pressure <10 mm Hg in the ACA model. ROSC indicates return of spontaneous circulation.
Table 1.
Biochemical and Hematological Values After 10 minute Asphyxial Cardiac Arrest (ACA) or Ventricular Fibrillation Cardiac Arrest (VFCA)
| BL | RT5 | RT60 | RT120 | RT180 | ||
|---|---|---|---|---|---|---|
| HR, bpm | SHAM | 327±24 | 333±21a | 324±19f | 328±27 | 332±18f |
| ACA | 321±22 | 386±60a,i | 305±49b | 327±39 | 350±38 | |
| VFCA | 333±20 | 304±58a | 352±23b,f | 333±72 | 369±35f | |
| MAP, mmHg | SHAM | 89±8 | 90±9j | 83±11f | 85±9 | 90±11 |
| ACA | 91±10 | 139±46j | 77±16 | 83±20 | 82±18 | |
| VFCA | 91±8 | 111±42 | 74±11f | 80±12 | 79±15 | |
| pHa | SHAM | 7.39±0.06 | 7.38±0.03f,j | 7.38±0.03 | 7.39±0.03 | 7.39±0.03 |
| ACA | 7.41±0.05 | 7.22±0.13j | 7.37±0.07 | 7.41±0.05 | 7.41±0.07 | |
| VFCA | 7.42±0.03 | 7.18±0.19f | 7.37±0.07 | 7.35±0.11 | 7.40±0.09 | |
| paO2, mmHg | SHAM | 208±43 | 274±124 | 399±75d,h | 362±96 | 427±48h |
| ACA | 194±35 | 235±63b | 322±92h | 328±97 | 351±114h | |
| VFCA | 195±41 | 355±98b | 324±86d | 318±85 | 399±65 | |
| paCO2, mmHg | SHAM | 42±7d | 41±5 | 41±5 | 38±4 | 38±4d |
| ACA | 39±5 | 39±12 | 42±7 | 39±5 | 38±8 | |
| VFCA | 36±6d | 33±13 | 38±6 | 37±9 | 33±5d | |
| BE, mmol/L | SHAM | 1±2 | −1±3g,k | −2±2 | −2±2 | −2±2 |
| ACA | 0±2 | −11±4k | −1±3 | 0±3 | −1±2 | |
| VFCA | −1±2 | −15±6g | −3±6 | −2±7 | −3±5 | |
| Hct | SHAM | 42±3 | 41±4 | 40±4d | 41±3 | 38±4 |
| ACA | 44±3 | 50±6c,k | 44±5 | 43±6 | 39±7 | |
| VFCA | 42±3 | 43±3c | 44±4d | 44±6 | 42±4 | |
| Glucose, mg/dL | SHAM | 221±112 | 191±112 | 169±111 | 157±87 | 153±58 |
| ACA | 156±35 | 109±82 | 127±18 | 151±19i | 146±58 | |
| VFCA | 196±92 | 196±155 | 155±93 | 187±108 | 178±90 | |
| Lactate, mmol/L | SHAM | 0.7±0.4d | 0.7±0.4g,k | 0.6±0.4e,k | 0.9±0.5j | 1.0±0.6g |
| ACA | 0.8±0.4 | 9.0±1.8a,k | 3.0±1.3k | 1.8±0.6j | 1.4±0.6j | |
| VFCA | 1.0±0.4 | 13.0±5.8a,g | 6.3±6.0e | 5.4±8.6 | 3.4±1.5g,j |
ACA vs. VFCA: a = p<0.05; b = p<0.01; c = p<0.005; VFCA vs. sham: d = p<0.05; e = p<0.01; f = p<0.005; g = p<0.001; ACA vs. sham: h = p<0.05; i = p<0.01; j = p<0.005; k = p<0.001. BE indicates base excess; BL, baseline; Hct, hematocrit; HR, heart rate; MAP, mean arterial pressure; pHa, arterial pH; and RT, resuscitation time. Analysis of variance with the Bonferroni post hoc correction (n=12/group).
Brain
In general, brain cytokines in naïve rats were low or undetectable. Isoflurane, anesthesia, and/or instrumentation in sham controls had a modest effect on select cytokines. Both ACA and VFCA resulted in robust increases in select cytokines. However, no significant differences in the amplitude of the cytokine increase were observed between the 2 CA models. The following review of individual regions is presented from frontal to dorsal regions, with P values given in the text for overall between‐group differences (Kruskal‐Wallis test) in individual cytokines. Differences between individual groups are displayed in the corresponding figures.
Cortex
CA led to a significant increase in the major proinflammatory cytokines TNF‐α (P=0.04), IL‐1a (P<0.001), IL‐6 (P=0.001), and IL‐12 (P=0.002), along with anti‐inflammatory IL‐10 (P=0.01). In contrast, interferon‐γ (P<0.001) levels were decreased after CA compared with naïve or sham control subjects (Figure 2).
Figure 2. Individual regional cytokine profile in cortex at 3 hours after 10 minutes asphyxial cardiac arrest (ACA) or ventricular fibrillation cardiac arrest (VFCA).
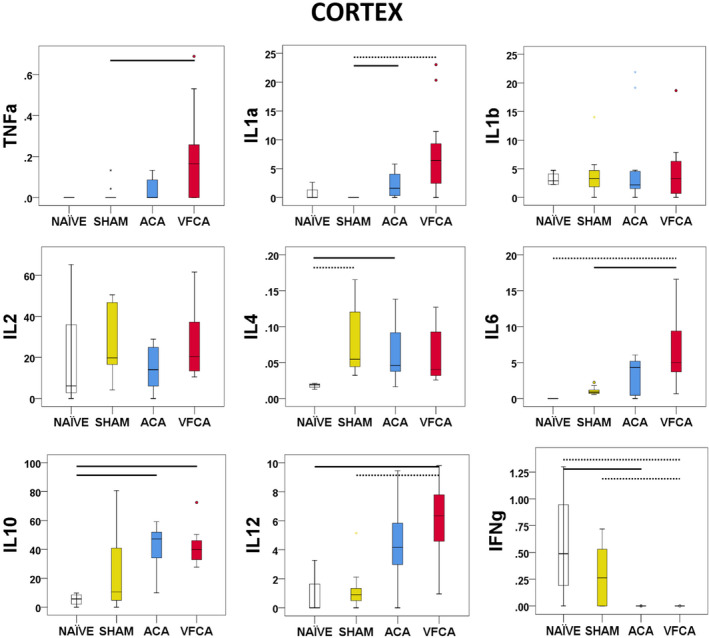
All values are given in pg/mg protein. The box plot represents 25th to 75th interquartile ranges, the line across the box plot represents the median, and the whiskers are minimum‐maximum values. The round marker and asterisk represent outliers. The thick line in each panel signifies statistical difference between groups. The solid line represents P<0.05 between groups. The dashed line represents P<0.01 between groups. IFN‐γ indicates interferon‐γ; IL, interleukin; and TNF‐α, tumor necrosis factor‐α.
Hippocampus
IL‐1a (P<0.001), IL‐6 (P=0.002), and IL‐10 (P=0.004) levels were increased after CA. A significant decrease was again observed in interferon‐γ (P<0.001) after CA. Surprisingly, TNF‐α (P=0.969) was not increased after CA. IL‐1b (P=0.019) levels were decreased after CA compared with naïve subjects. Levels of IL‐12 (P=0.013) increased slightly without reaching statistical significance between groups. GMCSF was not detectable in any group (Figure 3).
Figure 3. Individual regional cytokine profile in the hippocampus at 3 hours after 10 minutes asphyxial cardiac arrest (ACA) or ventricular fibrillation cardiac arrest (VFCA).
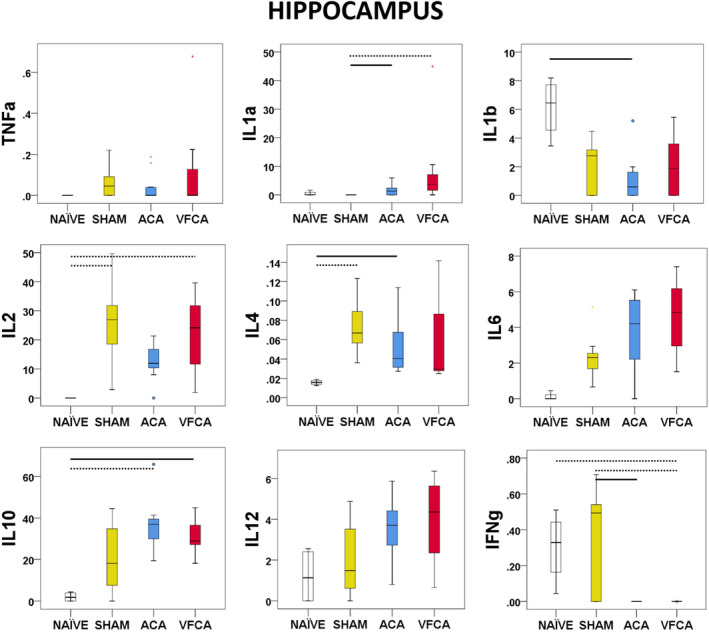
All values are given in pg/mg protein. The box plot represents 25th to 75th interquartile ranges, the line across the box plot represents the median, and the whiskers are minimum‐maximum values. The round marker and asterisk represent outliers. The thick line in each panel signifies statistical difference between groups. The solid line represents P<0.05 between groups. The dashed line represents P<0.01 between groups. IFN‐γ indicates interferon‐γ; IL, interleukin; and TNF‐α, tumor necrosis factor‐α.
Striatum
The striatum showed the most pronounced proinflammatory response after CA, with increased TNF‐α (P=0.001), IL‐1a (P<0.001), IL‐6 (P=0.002), and IL‐12 (0.002). IL‐10 (P=0.002) was also increased after ACA. Interferon‐γ (P<0.001) was decreased after CA versus naive or sham controls (Figure 4).
Figure 4. Individual regional cytokine profile in the striatum at 3 hours after 10 minutes asphyxial cardiac arrest (ACA) or ventricular fibrillation cardiac arrest (VFCA).
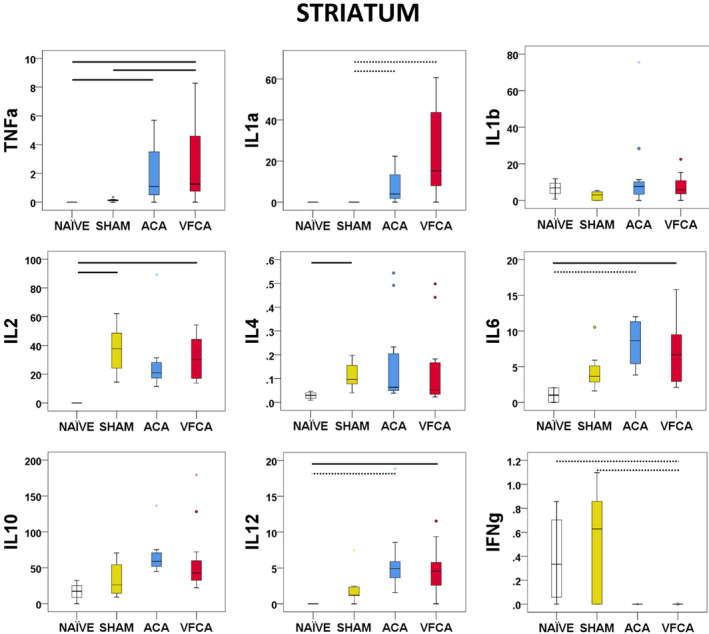
All values are given in pg/mg protein. The box plot represents 25th to 75th interquartile ranges, the line across the box plot represents the median, and the whiskers are minimum‐maximum values. The round marker and asterisk represent outliers. The thick line in each panel signifies statistical difference between groups. The solid line represents P<0.05 between groups. The dashed line represents P<0.01 between groups. IFN‐γ indicates interferon‐γ; IL, interleukin; and TNF‐α, tumor necrosis factor‐α.
Cerebellum
IL‐1a (P<0.001), but not TNF‐α (P=0.083) or IL‐1b (P=0.277), levels were increased after CA. IL‐6 (P=0.001), IL‐10 (P=0.005), and IL‐12 (P=0.001) levels were increased, with statistical significance only after VFCA compared with naive and/or sham controls. Interferon‐γ (P=0.001) was decreased after CA. GMCSF was not detectable (Figure 5).
Figure 5. Individual regional cytokine profile in the cerebellum at 3 hours after 10 minutes asphyxial cardiac arrest (ACA) or ventricular fibrillation cardiac arrest (VFCA).
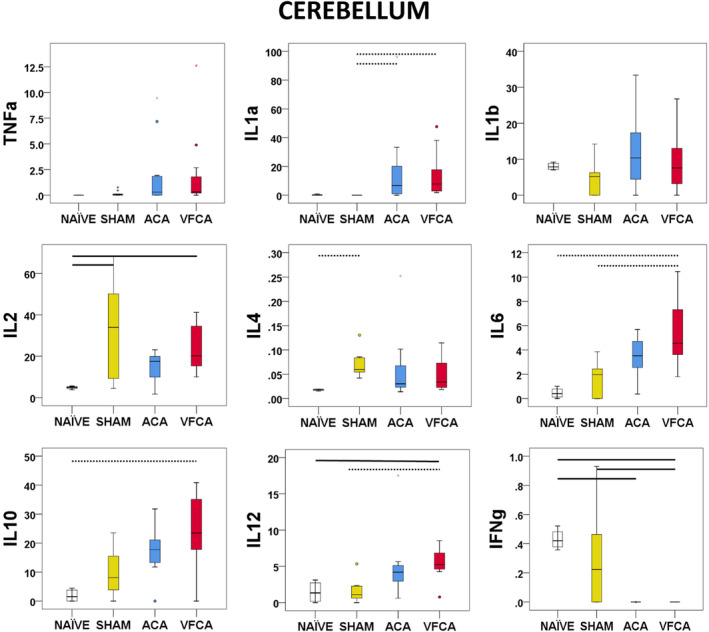
All values are given in pg/mg protein. The box plot represents 25th to 75th interquartile ranges, the line across the box plot represents the median, and the whiskers are minimum‐maximum values. The round marker and asterisk represent outliers. The thick line in each panel signifies statistical difference between groups. The solid line represents P<0.05 between groups. The dashed line represents P<0.01 between groups. IFN‐γ indicates interferon‐γ; IL, interleukin; and TNF‐α, tumor necrosis factor‐α.
Serum
Serum levels of most cytokines were increased after CA over naive and/or sham controls. Significant between‐group differences were observed in the concentration of TNF‐α, IL‐1a, IL‐1b, IL‐2, IL‐4, IL‐6, IL‐10, and IL‐12 (all P<0.001). In contrast with brain tissues, interferon‐γ was not detected but GMCSF levels were increased after CA over sham controls (P=0.002 between groups) (Figure 6).
Figure 6. Individual regional cytokine profile in serum at 3 hours after 10 minutes asphyxial cardiac arrest (ACA) or ventricular fibrillation cardiac arrest (VFCA).
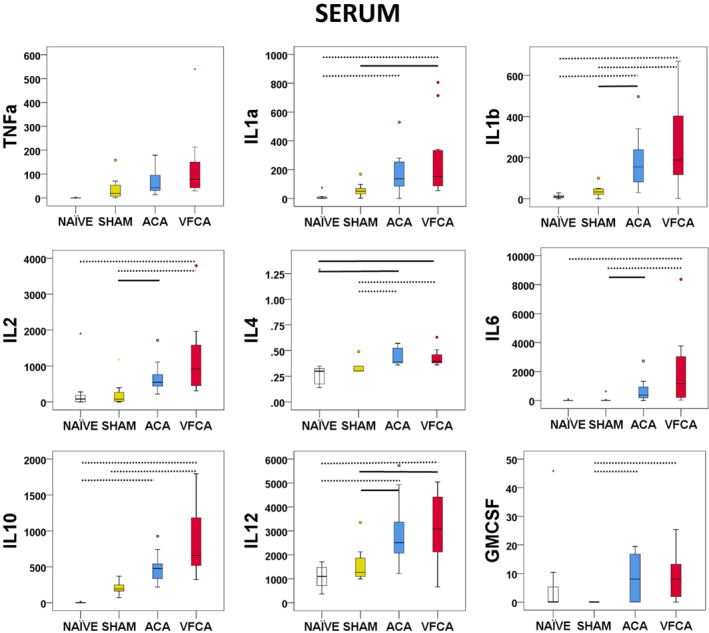
All values are given in pg/mL. The box plot represents 25th to 75th interquartile ranges, the line across the box plot represents the median, and the whiskers are minimum‐maximum values. The round marker and asterisk represent outliers. The thick line in each panel signifies statistical difference between groups. The solid line represents P<0.05 between groups. The dashed line represents P<0.01 between groups. GMCSF indicates granulocyte‐macrophage colony‐stimulating factor; IL, interleukin; and TNF‐α, tumor necrosis factor‐α.
Heart
Levels of both proinflammatory and anti‐inflammatory cytokines were increased after CA (except GMCSF and interferon‐γ, which were detectable only in naïve rats; both P=0.01). Significant increases were observed in TNF‐α (P=0.007), IL‐1b (P=0.014), IL‐6 (P=0.002), IL‐10 (P=0.005), and IL‐12 (P=0.017). A strong trend was identified in the analyses of IL‐1a concentration (P=0.051) (Figure 7).
Figure 7. Individual regional cytokine profile in the heart at 3 hours after 10 minutes asphyxial cardiac arrest (ACA) or ventricular fibrillation cardiac arrest (VFCA).
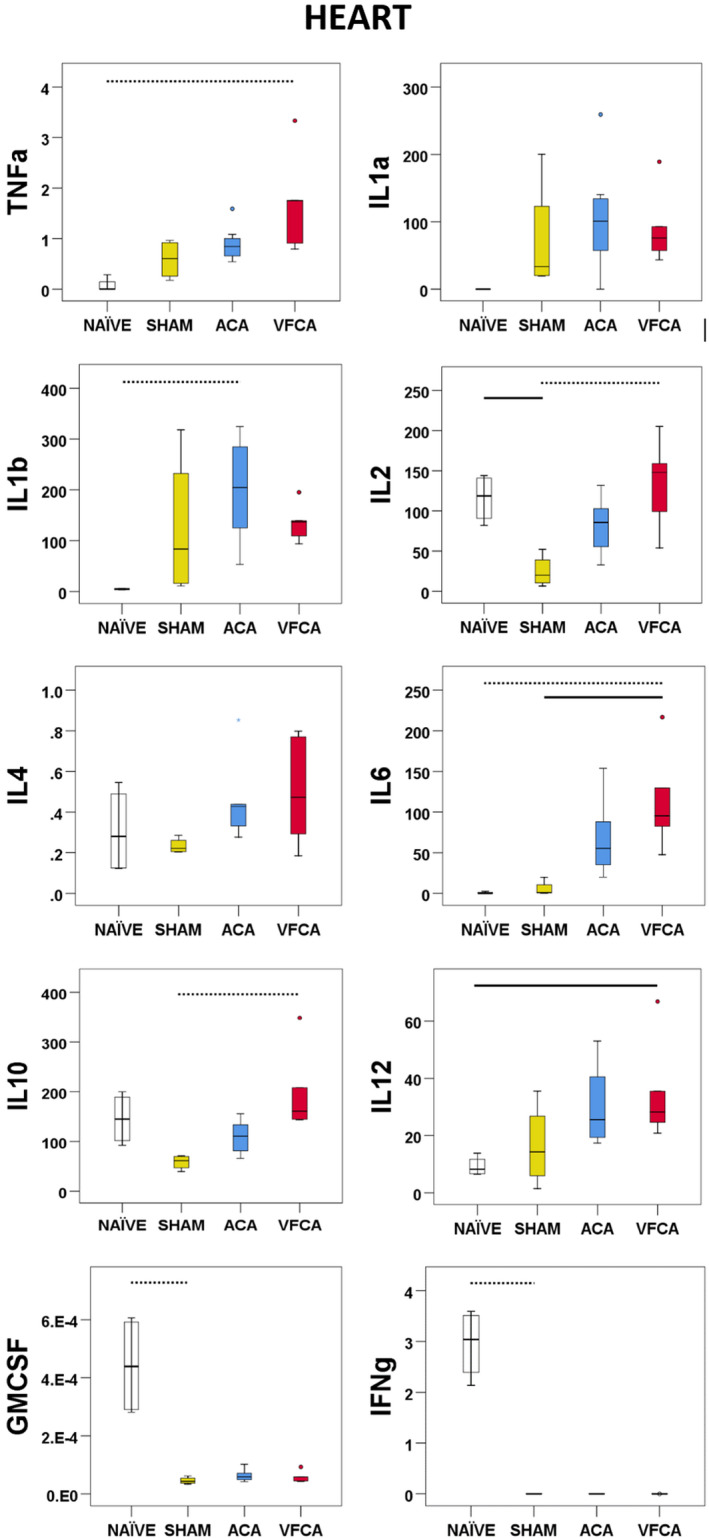
All values are given in pg/mg protein. The box plot represents 25th to 75th interquartile ranges, the line across the box plot represents the median, and the whiskers are minimum‐maximum values. The round marker and asterisk represent outliers. The thick line in each panel signifies statistical difference between groups. The solid line represents P<0.05 between groups. The dashed line represents P<0.01 between groups. GMCSF indicates granulocyte‐macrophage colony‐stimulating factor; IFN‐γ, interferon‐γ; IL, interleukin; and TNF‐α, tumor necrosis factor‐α.
Biomarkers of Organ‐Specific Injury
Significant differences between groups in serum biomarkers of central nervous system (CNS) injury were found for both NSE (P<0.001) and S100b (P=0.009) and in the serum biomarker of myocardial injury, troponin T (P=0.003), with higher levels after CA versus naïve rats and/or sham controls (Table 2).
Table 2.
Levels of NSE, S100b, and TnT at 3 Hours After 10 Minutes ACA or VFCA
| Variable | Naïve | Sham | ACA | VFCA |
|---|---|---|---|---|
| NSE, ng/mL | 0.01±0.02 | 0.03±0.03 | 0.1±0.04* | 0.14±0.07*, † |
| S100b, pg/mL | 21.8±0.6 | 22.8±1.6 | 25.4±1.1 | 29.2±7.2*, ‡ |
| TnT, pg/mL | 4.4±1.2 | 4.8±1.2 | 6.9±1.2 § | 7.4±2.3 ‡ , § |
ANOVA with the Tukey post hoc test (n=6–8/group) was performed. ACA indicates asphyxial cardiac arrest; NSE, neuron‐specific enolase; TnT, troponin T; and VFCA, ventricular fibrillation cardiac arrest.
P<0.01 vs naïve.
P<0.01 vs sham.
P<0.05 vs sham.
P<0.05 vs naïve.
Regional Differences in the Amplitude of Cytokine Changes in Response to CA
To date, our measurements did not reveal robust differences in cytokine levels across the 2 CA models. However, there appeared to be regional differences in the amplitude of the brain’s response to CA. This was examined further by contrasting the changes in cytokine concentrations (ie, the difference compared with sham control subjects) across the 4 brain regions (Figures 8 and 9). The graphs of the relative (versus sham) changes in cytokine levels give us the opportunity to detect region‐specific and cross‐regional effects. These analyses revealed regional differences in interferon‐γ levels (P value of main effect <0.001), with a more profound decrease in interferon‐γ after ACA and VFCA in the striatum compared with the cortex and cerebellum, and less loss of interferon‐γ in the cortex compared with hippocampus (Figure 8A). No regional differences were noted in the responses of IL‐1a, IL‐1b, IL‐2, IL‐4, and IL‐6 to CA (Figure 8A through 8F). In the ACA but not the VFCA animals, the increase in IL‐10 levels was higher in the striatum than cerebellum (main effect P=0.021; Figure 8G). The amplitude of the change in TNF‐α levels after both ACA and VFCA was higher in the striatum than hippocampus (main effect P<0.001; Figure 8I). There was no main effect of injury type in any brain region, confirming that ACA and VFCA induce equivalent changes in brain cytokine levels. Similarly, there were no differences between the 2 injury types in serum or heart, with the exception of the magnitude of the IL‐10 response, as IL‐10 increased to higher levels after VFCA compared with ACA, in both serum and heart tissue (Figure 8J and 8K). A comprehensive display of cross‐organ cytokine responses reveals the magnitude of the cytokine response in the serum and heart compared with the brain, and also highlights the brain regions with the most dramatic changes (the striatum and cerebellum), which can be contrasted with the less‐responsive parts of the telencephalic cortex (cerebral neocortex and hippocampal archicortex; Figure 9).
Figure 8. Regional differences in cytokine responses at 3 hours after 10 minutes asphyxial cardiac arrest (ACA) or ventricular fibrillation cardiac arrest (VFCA).
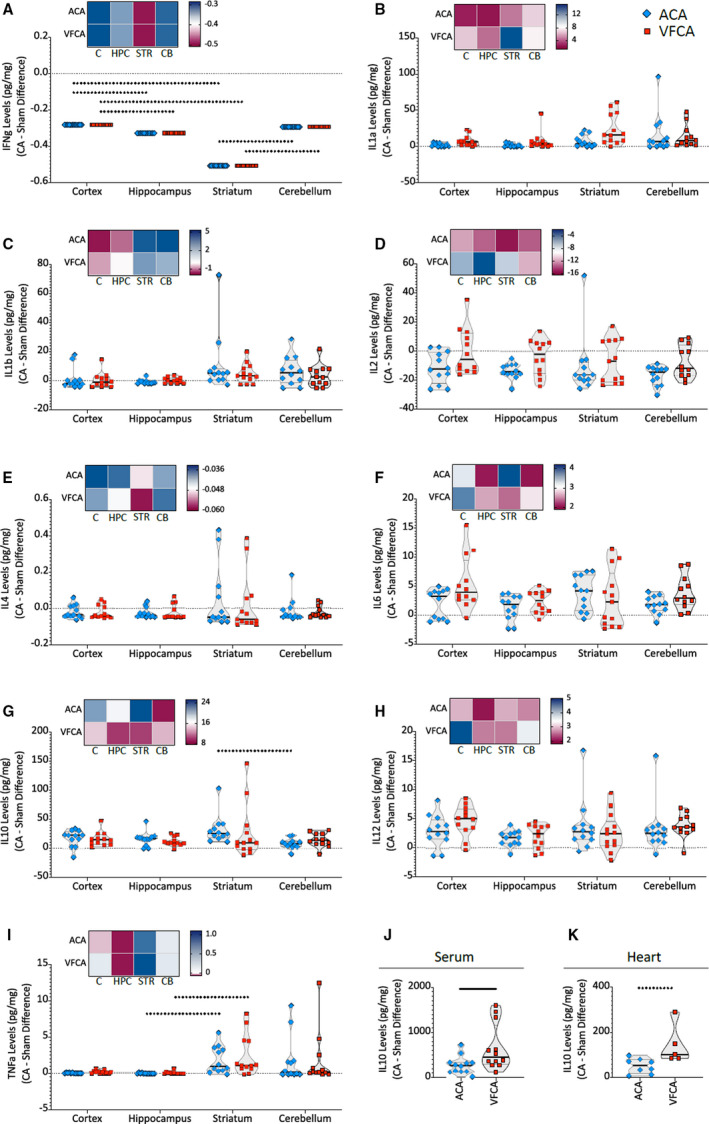
All values are given in pg/mg protein. Cytokine concentrations are displayed as differences between indicated groups and sham control subjects (demarcated as a dotted horizontal line). Violin plots illustrate the median, 25th to 75th interquartile ranges, and density estimations of data distributions. Heat maps above each graph depict the median cytokine concentrations. Each blue diamond and red square denotes an individual animal experiencing ACA and VFCA, respectively. The thick line in each panel signifies statistical difference between groups. The solid line represents P<0.05 between groups. The dashed line represents P<0.01 between groups. Individual panels are as follows: interferon‐γ (IFN‐γ) (A); interleukin (IL)‐1a (B); IL‐1b (C); IL‐2 (D); IL‐4 (E); IL‐6 (F); IL‐10 (G); IL‐12 (H); tumor necrosis factor‐α (TNF‐α) (I); IL‐10 in serum (J); and IL‐10 in heart (K). C indicates cortex; CA, cardiac arrest; CB, cerebellum; HPC, hippocampus; and STR, striatum.
Figure 9. Stacked bar charts illustrating cross‐organ cytokine responses at 3 hours after 10 minutes asphyxial cardiac arrest (ACA) or ventricular fibrillation cardiac arrest (VFCA).
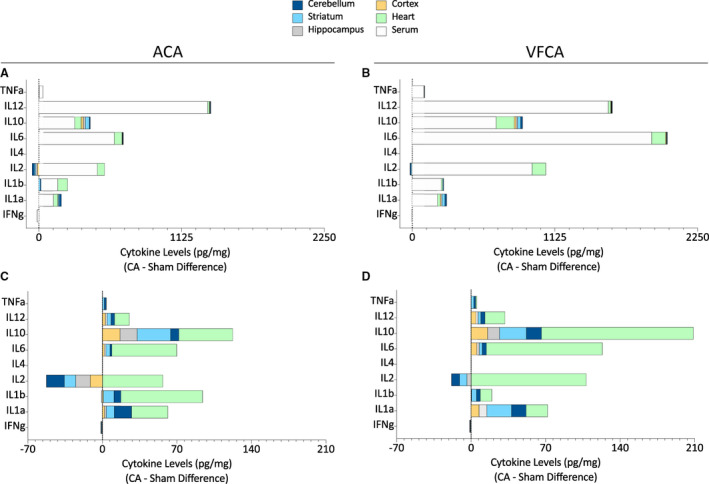
All values are presented in pg/mg protein, compared with sham measurements (demarcated as dotted vertical line). Upper panels depict brain, heart, and serum cytokine levels (ACA [A]; VFCA [B]), to emphasize the scale of the serum cytokine responses. Lower panels depict only brain and heart cytokine levels for clarity (ACA [C]; VFCA [D]). CA indicates cardiac arrest; IFN‐γ, interferon‐γ; IL, interleukin; and TNF‐α, tumor necrosis factor‐α.
Discussion
The goal of the present study was to explore the systemic, myocardial, and regional neuroinflammatory cytokine signatures after 2 types of CA with distinct neurological outcomes in both experimental and clinical settings. Naïve rats and shams subjected to anesthesia served as robust controls. In general, brain cytokines in naïve rats were low to undetectable. Isoflurane anesthesia and instrumentation in sham controls had a distinct, but mild, effect on selected cytokines. Both ACA and VFCA resulted in robust increases in the concentration of selected cytokines in the brain, heart, and serum, along with increases in serum biomarkers of end‐organ injury. Unexpectedly, no significant differences in brain cytokines were observed between the 2 CA models. The no‐flow time was shorter in the ACA model (ie, ≈6 minutes versus 10 minutes in the VFCA model), although the total insult times were equivalent when considering the hypoxemic interval preceding no flow in the ACA model. This observation implies that the hypoxic perfusion before no flow in the ACA model substantially contributes to the resulting injury, both systemically and in key target organs after resuscitation, such as the heart and brain. The contribution of the hypoxic perfusion preceding no flow in the ACA model also gains importance when considering that the resuscitation phase was longer in the VFCA group than in the ACA group. Thus, shorter duration of ACA appears to generate greater brain injury than VFCA. Prior work examining NSE and S100b within the first 24 hours after resuscitation demonstrated higher levels in the ACA group. 5 Similar to prior observations, VFCA resulted in greater early shock 3 because of myocardial dysfunction, 6 producing increased metabolic acidosis and decreased MAP, but not myocardial tissue injury, based on troponin levels. However, we did not detect any differences in biomarkers of CNS or myocardial injury between CA groups.
The mechanistic role of inflammatory cytokines after CA remains controversial. Cytokines may be viewed both as stress‐responsive biomarkers correlated with CA outcomes, but also as therapeutic targets that modify tissue injury, repair, and recovery. Furthermore, most cytokines appear to play a pleiotropic role, acting as both prodegenerative factors and trophic molecules, depending on the cellular context and the extracellular milieu. Individual cytokines are often classified as “proinflammatory” (eg, TNF‐α, IL‐1, or IL‐6), whereas others are typically viewed as “anti‐inflammatory” (eg, IL‐10). It is likely, however, that this binary view is oversimplified, as it fails to take into consideration factors such as tissue concentration and cellular context as well as possible differential effects based on the time of appearance after the initial injury. For example, low TNF‐α levels promote neuronal differentiation and improve myocyte function, but higher levels are deleterious after injury. This nonlinear concentration‐dependent response is further complicated by the binding of TNF‐α to 2 cell receptors: tumor necrosis factor receptor 1 or tumor necrosis factor receptor 2. Cell death signaling is initiated by tumor necrosis factor receptor 1–mediated activation of nuclear factor‐κB and/or several additional nondeath signaling pathways. 7 In contrast, TNF‐α binding to tumor necrosis factor receptor 2 forms a complex inhibiting the inflammatory reaction. 8 , 9 , 10 Traditionally, TNF‐α is considered a “primary” cytokine that can stimulate production of other cytokines, such as IL‐1, 11 but this sequence can also be reversed 12 and/or fueled by other proinflammatory factors, such as interferon‐γ. 13 Aside from these subtle biological strategies, multiple CNS‐resident cells are capable of producing cytokines, and the CNS is engaged in cross talk with extracerebral organs subjected to systemic and organ‐specific inflammation. For these reasons, systemic inflammation and neuroinflammation after CA remain active areas of investigation in resuscitation science. 14 , 15 , 16 , 17 , 18 Thus, we have defined both neuronal and systemic inflammatory response to CA in 2 established rodent models that represent clinically relevant CA phenotypes.
In the present study, the concentration of most cytokines was higher after CA, whether proinflammatory or anti‐inflammatory. In addition, we have demonstrated significant spatial differences across differentially vulnerable regions, in that the striatum displayed the most profound changes in interferon‐γ and TNF‐α. On the other hand, the amplitude of the cytokine response was similar for the 2 CA models, despite unequal no‐flow times. Similar NSE, S100b, and troponin T levels further support the comparable degree of severity of these insults. Previous studies demonstrated brain region‐specific cytokine responses in the VFCA model of shorter durations (6 and 8 minutes VFCA). 19 In the current study, we extended the no‐flow time to 10 minutes to maximize the cytokine response, as the effects appeared to be dose dependent. Herein, we have reproduced the unique cytokine signatures after VFCA and, surprisingly, discovered a lack of robust differences across CA phenotypes. Similar patterns were also observed in our model of exsanguination CA rescued with extracorporeal cardiopulmonary resuscitation. 20 As we have previously shown, ACA results in increased histological injury compared with similar duration of VFCA 3 ; the lower levels of cytokines observed early after CA may precede later rises driven by cell death. Thus, the concept of early inflammation as a cause of greater ACA brain injury, as opposed to the result of greater injury, cannot be supported by our observation.
Brain cytokine levels in naïve rats were low or below the limits of detection, except for interferon‐γ and IL‐1b. We also included a sham group, as prior studies had indicated that prolonged exposure to anesthesia 21 and/or surgery can induce both systemic and brain‐specific cytokine responses. 22 , 23 , 24 , 25 In sham rats, levels of select cytokines were higher than in naïve rats (ie, IL‐2 and IL‐4) across all brain regions, which may be the effect of either surgery or extended anesthesia duration. 26 , 27
Striatal TNF‐α levels were robustly increased by CA, in agreement with prior studies in our laboratory, demonstrating a unique and reproducible neuroinflammatory response in this brain region early after CA. In contrast, hippocampal levels of TNF‐α remained low. Although the striatum and hippocampus harbor highly vulnerable medium spiny and CA1 neurons, respectively, they exhibit markedly different early TNF‐α profiles after resuscitation. Both IL‐1a and IL‐6, other prominent proinflammatory cytokines, were increased after CA across all regions. Anti‐inflammatory cytokine IL‐10 was also increased after CA across regions, suggesting that both proinflammatory and anti‐inflammatory cascades operate simultaneously. Surprisingly, IL‐1b was not affected by CA in either of our models. IL‐12 levels were increased after CA in cortex, striatum, and cerebellum but not in hippocampus. Low levels of interferon‐γ were seen in both naive and sham subjects and decreased after CA, particularly in the striatum. In our prior study in rats subjected to VFCA, levels of IL‐12 decreased from ≈5 to 1 to 2.5 pg/mg protein between 3 and 6 hours. The levels of interferon‐γ remained at the same level of ≈0.5 pg/mg protein between 3 and 6 hours. 19 Thus, our current findings of decreased interferon‐γ may be interpreted with caution and warrant further clarifications. Technical differences between the experiments (ie, animal models and laboratory techniques) could have played a role.
IL‐12 represents one of the most potent regulators of interferon‐γ production in T‐helper type 1 cells. The blood‐brain barrier does not seem to be disrupted in our CA‐induced global brain ischemia model, 28 contrasting the situation in a focal brain ischemia model 29 in which T‐helper type 1 cells invade the lesion and could be responsible for the cytokine production, including IL‐12 and interferon‐γ. We have not attempted to identify the cell source of the cytokines in our current study. We have previously identified various CNS cells as sources of individual cytokines in the brain. 19 , 20 CNS‐originating cytokines may exhibit a distinct time course that may not correlate with systemic cytokine response by extracerebrally originating cytokines. This may need to be evaluated in future longitudinal studies.
In a clinical study of systemic inflammatory response syndrome after out‐of‐hospital CA, neither IL‐12 nor interferon‐γ was associated with mortality at any time point (at admission or at 24, 48, or 72 hours). 30 It seems that neither IL‐12 nor interferon‐γ represents key players determining outcome from CA in the early recovery phases. In contrast, IL‐6 was higher in nonsurvivors. It remains to be determined whether IL‐6 acts as a biomarker of end‐organ injury, or if it represents a therapeutic target that could affect the outcome.
A limited number of studies have explored brain tissue cytokines in preclinical models of CA and have yielded conflicting results. In a rodent model of CA, cerebrospinal fluid levels of TNF‐α or IL‐6 could not be detected. 31 In a porcine model of VFCA, serum levels of TNF‐α did not correlate with cerebrospinal fluid levels, consistent with the concept of immune privilege of the CNS. 32 Saito et al reported early increases in “primary” proinflammatory cytokines TNF‐α, IL‐1b, and IL‐6 in brain after transient global ischemia in gerbils. 33 Yasuda et al reported the most comprehensive long‐term brain cytokine profile using a 4‐vessel occlusion isolated global brain ischemia model in rats. Most cytokines were increased in a delayed phase (7–21 days) but not at 6 hours, and earlier time points were not investigated. 34 Taken together, there may exist 2 distinct therapeutic windows for cytokine modulation after CA, one targeting the early response after reperfusion, and the other targeting delayed neuroinflammation and/or regeneration in survivors.
Microglia are considered the primary CNS‐resident immunocompetent cells. However, we previously reported that the cellular source of the early TNF‐α increase after VFCA was neuronal, 19 whereas IL‐1a and IL‐12 colocalized with astrocyte markers. Hence, microglia may not be the major source of brain cytokines in our CA models at this early stage. 20 Other CNS‐resident cells may produce cytokines in delayed phases of neuroinflammation. 35
Systemically, ischemia‐reperfusion acts as a powerful stimulus for leukocytes, which rapidly respond with massive production of cytokines that negatively affect extracerebral organs and vascular endothelium, resulting in organ dysfunction and increased vascular permeability in post‐CA syndrome. We have observed a marked increase in serum cytokines measured in the 2 CA models. This overwhelming cytokine response is unique, as prior studies yielded mixed results. In a porcine model of VFCA, systemic TNF‐α was detected early (15 minutes RT) after reperfusion, and its peak levels coincided with maximal myocardial depression. TNF‐α levels returned to baseline at 3 hours RT. IL‐6 remained unchanged over the course of 6 hours. 36 In contrast, in a recent study on porcine VFCA, both TNF‐α and IL‐6 levels were increased at 5 minutes RT and continued to rise over 6 hours. 37 Our current results show that TNF‐α levels were increased at 3 hours, compared with naïve controls. However, we cannot rule out that TNF‐α peaked even earlier, and that the levels were already decreasing. IL‐6 was increased at 3 hours over both naïve and sham controls. The observation that serum levels peak early is supported by prior work in rats subjected to 6 minutes VFCA. Those studies failed to show increased levels of IL‐6, IL‐10, or TNF‐α from 6 hours until 7 days, whereas IL‐1b was increased at 6 and 24 hours but not at later time points. 38 Similarly, Wender et al did not observe increased serum TNF‐α levels past 24 hours in a rat CA model. 39 Yang et al reported that serum IL‐6 and TNF‐α levels were both increased at 6 hours after 6 minutes VFCA in rats. Although the severity of the no flow was identical, resuscitation was prolonged. 40 It is thus conceivable that serum cytokine levels would have been increased even in this milder insult at earlier time points, and the levels reflect also resuscitation characteristics. In the present work, NSE and S100b levels were increased 3 hours after VFCA and ACA, but not to different degrees, suggesting that any distinctions between these injuries might not be manifested in these biomarkers until later time points.
Multiple cytokines are thought to mediate cardiac dysfunction in post‐CA syndrome. The exact mechanisms of action of individual cytokines on the heart have not been fully explored. TNF‐α–induced Ca++ mishandling, overproduction of NO via inducible NO synthetase induction, and desensitization of β receptors have all been implicated in cardiovascular dysfunction and cardiomyocyte apoptosis. 41 , 42 IL‐1a is released directly from necrotic cardiomyocytes, whereas IL‐1b is released by activated leukocytes, and both contribute to cardiac dysfunction. We have documented increases in several cytokines, including TNF‐α and IL‐1b, within cardiac tissue after both ACA and VFCA. No differences in cytokines or troponin T were seen across the 2 CA models. The myocardial dysfunction and shock observed in VFCA exceeded that of ACA in the first 5 to 60 minutes after ROSC but by the time of cytokine assay had resolved, which may explain the similarity.
Our study has several limitations. Cytokine signatures were explored at a single time point (3 hours RT), based on our prior study on VFCA, in which we explored both early (3 and 6 hours RT) and late periods (14 days). 19 In that study, earlier time points showed more robust cytokine response than later time points, providing the rationale for focusing on changes in the acute stages of injury in the present work. Hence, we have focused on proteins already present at this early time point, as proteins are the workhorses of the cell and they could directly aggravate or ameliorate the ischemia‐reperfusion injury. Other methods (eg, quantitative reverse transcription–polymerase chain reaction) may have detected additional temporal‐spatial cytokine signatures. However, an increase in mRNA may not fully translate into increased protein levels. A comprehensive temporal analysis of cytokine response to CA should be evaluated in future longitudinal studies. We did not adjust for multiple comparisons in our statistical analysis. We cannot exclude that some of the significant differences may have been caused by chance alone.
Another limitation of the present study is that we only studied healthy young male rats. More pronounced systemic cytokine responses have been observed after ACA in aged rats. 31 A significant sex difference in plasma cytokine responses to CA has also been reported. 36 We were unable to truly “match” the insults despite matching the total insult duration. Our findings represent associations; without inhibitor or knockdown studies, the mechanism of these cytokines, signaling injury or protection, cannot be established.
In conclusion, we have demonstrated that ACA and VFCA are associated with similar early systemic and region‐specific cytokine responses in the brain. Despite a shorter duration of no flow in the ACA model than the VFCA model, a similar biomarker injury profile was also observed. Our findings suggest that therapeutic strategies to manipulate these cytokines may have similar merit across these 2 CA phenotypes. As most patients experiencing CA die within days, largely from acute neurologic injury, the early‐stage cytokine storm may play a significant role in morbidity and mortality, representing a valid therapeutic target for both ACA and VFCA.
Sources of Funding
This project was supported by grants from the Laerdal Foundation (Drs Uray and Drabek). This project used the University of Pittsburgh Cancer Institute Cancer Biomarkers Facility: Luminex Core Laboratory, which is supported in part by award P30CA047904.
Disclosures
None.
(J Am Heart Assoc. 2021;10:e018657. DOI: 10.1161/JAHA.120.018657.)
A part of this article was presented at the American Heart Association Scientific Sessions, November 13 to 17, 2020.
For Sources of Funding and Disclosures, see page 16.
References
- 1. Adrie C, Adib‐Conquy M, Laurent I, Monchi M, Vinsonneau C, Fitting C, Fraisse F, Dinh‐Xuan AT, Carli P, Spaulding C, et al. Successful cardiopulmonary resuscitation after cardiac arrest as a "sepsis‐like" syndrome. Circulation. 2002;106:562–568. DOI: 10.1161/01.CIR.0000023891.80661.AD. [DOI] [PubMed] [Google Scholar]
- 2. Jou C, Shah R, Figueroa A, Patel JK. The role of inflammatory cytokines in cardiac arrest. J Intensive Care Med. 2020;35:219–224. DOI: 10.1177/0885066618817518. [DOI] [PubMed] [Google Scholar]
- 3. Uray T, Lamade A, Elmer J, Drabek T, Stezoski JP, Missé A, Janesko‐Feldman K, Garman RH, Chen N, Kochanek PM, et al. Phenotyping cardiac arrest: bench and bedside characterization of brain and heart injury based on etiology. Crit Care Med. 2018;46:e508–e515. DOI: 10.1097/CCM.0000000000003070. [DOI] [PMC free article] [PubMed] [Google Scholar]
- 4. Janata A, Drabek T, Magnet IA, Stezoski JP, Janesko‐Feldman K, Popp E, Garman RH, Tisherman SA, Kochanek PM. Extracorporeal versus conventional cardiopulmonary resuscitation after ventricular fibrillation cardiac arrest in rats: a feasibility trial. Crit Care Med. 2013;41:e211–e222. DOI: 10.1097/CCM.0b013e318287f51e. [DOI] [PMC free article] [PubMed] [Google Scholar]
- 5. Zhang Y, Li CS, Wu CJ, Yang J, Hang CC. Comparison of cerebral metabolism between pig ventricular fibrillation and asphyxial cardiac arrest models. Chin Med J (Engl). 2015;128:1643–1648. DOI: 10.4103/0366-6999.158340. [DOI] [PMC free article] [PubMed] [Google Scholar]
- 6. Kamohara T, Weil MH, Tang W, Sun S, Yamaguchi H, Klouche K, Bisera J. A comparison of myocardial function after primary cardiac and primary asphyxial cardiac arrest. Am J Respir Crit Care Med. 2001;164:1221–1224. DOI: 10.1164/ajrccm.164.7.2007083. [DOI] [PubMed] [Google Scholar]
- 7. Sedger LM, McDermott MF. TNF and TNF‐receptors: from mediators of cell death and inflammation to therapeutic giants–past, present and future. Cytokine Growth Factor Rev. 2014;25:453–472. DOI: 10.1016/j.cytogfr.2014.07.016. [DOI] [PubMed] [Google Scholar]
- 8. Dopp JM, Mackenzie‐Graham A, Otero GC, Merrill JE. Differential expression, cytokine modulation, and specific functions of type‐1 and type‐2 tumor necrosis factor receptors in rat glia. J Neuroimmunol. 1997;75:104–112. DOI: 10.1016/S0165-5728(97)00009-X. [DOI] [PubMed] [Google Scholar]
- 9. Barnum CJ, Tansey MG. The duality of TNF signaling outcomes in the brain: potential mechanisms? Exp Neurol. 2011;229:198–200. DOI: 10.1016/j.expneurol.2011.02.016. [DOI] [PubMed] [Google Scholar]
- 10. MacEwan DJ. TNF receptor subtype signalling: differences and cellular consequences. Cell Signal. 2002;14:477–492. DOI: 10.1016/S0898-6568(01)00262-5. [DOI] [PubMed] [Google Scholar]
- 11. Dinarello CA, Cannon JG, Wolff SM, Bernheim HA, Beutler B, Cerami A, Figari IS, Palladino MA Jr, O'Connor JV. Tumor necrosis factor (cachectin) is an endogenous pyrogen and induces production of interleukin 1. J Exp Med. 1986;163:1433–1450. DOI: 10.1084/jem.163.6.1433. [DOI] [PMC free article] [PubMed] [Google Scholar]
- 12. Ikejima T, Okusawa S, Ghezzi P, van der Meer JW, Dinarello CA. Interleukin‐1 induces tumor necrosis factor (TNF) in human peripheral blood mononuclear cells in vitro and a circulating TNF‐like activity in rabbits. J Infect Dis. 1990;162:215–223. DOI: 10.1093/infdis/162.1.215. [DOI] [PubMed] [Google Scholar]
- 13. Philip R, Epstein LB. Tumour necrosis factor as immunomodulator and mediator of monocyte cytotoxicity induced by itself, gamma‐interferon and interleukin‐1. Nature. 1986;323:86–89. DOI: 10.1038/323086a0. [DOI] [PubMed] [Google Scholar]
- 14. O'Connor JJ. Targeting tumour necrosis factor‐alpha in hypoxia and synaptic signalling. Ir J Med Sci. 2013;182:157–162. DOI: 10.1007/s11845-013-0911-4. [DOI] [PubMed] [Google Scholar]
- 15. McCoy MK, Tansey MG. TNF signaling inhibition in the CNS: implications for normal brain function and neurodegenerative disease. J Neuroinflammation. 2008;5:45. DOI: 10.1186/1742-2094-5-45. [DOI] [PMC free article] [PubMed] [Google Scholar]
- 16. Lin QM, Tang XH, Lin SR, Chen BD, Chen F. Bone marrow‐derived mesenchymal stem cell transplantation attenuates overexpression of inflammatory mediators in rat brain after cardiopulmonary resuscitation. Neural Regen Res. 2020;15:324–331. DOI: 10.4103/1673-5374.265563. [DOI] [PMC free article] [PubMed] [Google Scholar]
- 17. Xiang Y, Zhao H, Wang J, Zhang L, Liu A, Chen Y. Inflammatory mechanisms involved in brain injury following cardiac arrest and cardiopulmonary resuscitation. Biomed Rep. 2016;5:11–17. DOI: 10.3892/br.2016.677. [DOI] [PMC free article] [PubMed] [Google Scholar]
- 18. Ocak U, Ocak PE, Huang L, Zuo G, Yan J, Hu X, Song Z, Zhang JH. Inhibition of PAR‐2 attenuates neuroinflammation and improves short‐term neurocognitive functions via ERK1/2 signaling following asphyxia‐induced cardiac arrest in rats. Shock. 2020;54:539–547. DOI: 10.1097/SHK.0000000000001516. [DOI] [PMC free article] [PubMed] [Google Scholar]
- 19. Janata A, Magnet IA, Uray T, Stezoski JP, Janesko‐Feldman K, Tisherman SA, Kochanek PM, Drabek T. Regional TNFalpha mapping in the brain reveals the striatum as a neuroinflammatory target after ventricular fibrillation cardiac arrest in rats. Resuscitation. 2014;85:694–701. DOI: 10.1016/j.resuscitation.2014.01.033. [DOI] [PMC free article] [PubMed] [Google Scholar]
- 20. Drabek T, Wilson CD, Janata A, Stezoski JP, Janesko‐Feldman K, Garman RH, Tisherman SA, Kochanek PM. Unique brain region‐dependent cytokine signatures after prolonged hypothermic cardiac arrest in rats. Ther Hypothermia Temp Manag. 2015;5:26–39. DOI: 10.1089/ther.2014.0013. [DOI] [PubMed] [Google Scholar]
- 21. Wu X, Lu Y, Dong Y, Zhang G, Zhang Y, Xu Z, Culley DJ, Crosby G, Marcantonio ER, Tanzi RE, et al. The inhalation anesthetic isoflurane increases levels of proinflammatory TNF‐alpha, IL‐6, and IL‐1beta. Neurobiol Aging. 2012;33:1364–1378. DOI: 10.1016/j.neurobiolaging.2010.11.002. [DOI] [PMC free article] [PubMed] [Google Scholar]
- 22. Yan J, Luo A, Gao J, Tang X, Zhao Y, Zhou B, Zhou Z, Li S. The role of SIRT1 in neuroinflammation and cognitive dysfunction in aged rats after anesthesia and surgery. Am J Transl Res. 2019;11:1555–1568. [PMC free article] [PubMed] [Google Scholar]
- 23. Berger M, Ponnusamy V, Greene N, Cooter M, Nadler JW, Friedman A, McDonagh DL, Laskowitz DT, Newman MF, Shaw LM, et al. The effect of propofol vs. isoflurane anesthesia on postoperative changes in cerebrospinal fluid cytokine levels: results from a randomized trial. Front Immunol. 2017;8:1528. DOI: 10.3389/fimmu.2017.01528. [DOI] [PMC free article] [PubMed] [Google Scholar]
- 24. Zhang J, Tan H, Jiang W, Zuo Z. The choice of general anesthetics may not affect neuroinflammation and impairment of learning and memory after surgery in elderly rats. J Neuroimmune Pharmacol. 2015;10:179–189. DOI: 10.1007/s11481-014-9580-y. [DOI] [PubMed] [Google Scholar]
- 25. Yang N, Liang Y, Yang P, Wang W, Zhang X, Wang J. TNF‐alpha receptor antagonist attenuates isoflurane‐induced cognitive impairment in aged rats. Exp Ther Med. 2016;12:463–468. DOI: 10.3892/etm.2016.3262. [DOI] [PMC free article] [PubMed] [Google Scholar]
- 26. Wang N, Wang M. Dexmedetomidine suppresses sevoflurane anesthesia‐induced neuroinflammation through activation of the PI3K/Akt/mTOR pathway. BMC Anesthesiol. 2019;19:134. DOI: 10.1186/s12871-019-0808-5. [DOI] [PMC free article] [PubMed] [Google Scholar]
- 27. Terrando N, Monaco C, Ma D, Foxwell BM, Feldmann M, Maze M. Tumor necrosis factor‐alpha triggers a cytokine cascade yielding postoperative cognitive decline. Proc Natl Acad Sci USA. 2010;107:20518–20522. DOI: 10.1073/pnas.1014557107. [DOI] [PMC free article] [PubMed] [Google Scholar]
- 28. Tress EE, Clark RS, Foley LM, Alexander H, Hickey RW, Drabek T, Kochanek PM, Manole MD. Blood brain barrier is impermeable to solutes and permeable to water after experimental pediatric cardiac arrest. Neurosci Lett. 2014;578:17–21. DOI: 10.1016/j.neulet.2014.06.020. [DOI] [PMC free article] [PubMed] [Google Scholar]
- 29. Guo Y, Chen X, Li D, Liu H, Ding Y, Han R, Shi Y, Ma X. PR‐957 mediates neuroprotection by inhibiting Th17 differentiation and modulating cytokine production in a mouse model of ischaemic stroke. Clin Exp Immunol. 2018;193:194–206. DOI: 10.1111/cei.13132. [DOI] [PMC free article] [PubMed] [Google Scholar]
- 30. Bro‐Jeppesen J, Kjaergaard J, Wanscher M, Nielsen N, Friberg H, Bjerre M, Hassager C. Systemic inflammatory response and potential prognostic implications after out‐of‐hospital cardiac arrest: a substudy of the target temperature management trial. Crit Care Med. 2015;43:1223–1232. DOI: 10.1097/CCM.0000000000000937. [DOI] [PubMed] [Google Scholar]
- 31. Secher N, Ostergaard L, Tonnesen E, Hansen FB, Granfeldt A. Impact of age on cardiovascular function, inflammation, and oxidative stress in experimental asphyxial cardiac arrest. Acta Anaesthesiol Scand. 2018;62:49–62. DOI: 10.1111/aas.13014. [DOI] [PubMed] [Google Scholar]
- 32. Youngquist ST, Niemann JT, Heyming TW, Rosborough JP. The central nervous system cytokine response to global ischemia following resuscitation from ventricular fibrillation in a porcine model. Resuscitation. 2009;80:249–252. DOI: 10.1016/j.resuscitation.2008.08.018. [DOI] [PubMed] [Google Scholar]
- 33. Saito K, Suyama K, Nishida K, Sei Y, Basile AS. Early increases in TNF‐alpha, IL‐6 and IL‐1 beta levels following transient cerebral ischemia in gerbil brain. Neurosci Lett. 1996;206:149–152. DOI: 10.1016/s0304-3940(96)12460-5. [DOI] [PubMed] [Google Scholar]
- 34. Yasuda Y, Shimoda T, Uno K, Tateishi N, Furuya S, Tsuchihashi Y, Kawai Y, Naruse S, Fujita S. Temporal and sequential changes of glial cells and cytokine expression during neuronal degeneration after transient global ischemia in rats. J Neuroinflammation. 2011;8:70. DOI: 10.1186/1742-2094-8-70. [DOI] [PMC free article] [PubMed] [Google Scholar]
- 35. Orzylowska O, Oderfeld‐Nowak B, Zaremba M, Januszewski S, Mossakowski M. Prolonged and concomitant induction of astroglial immunoreactivity of interleukin‐1beta and interleukin‐6 in the rat hippocampus after transient global ischemia. Neurosci Lett. 1999;263:72–76. DOI: 10.1016/S0304-3940(99)00043-9. [DOI] [PubMed] [Google Scholar]
- 36. Niemann JT, Rosborough JP, Youngquist S, Shah AP, Lewis RJ, Phan QT, Filler SG. Cardiac function and the proinflammatory cytokine response after recovery from cardiac arrest in swine. J Interferon Cytokine Res. 2009;29:749–758. DOI: 10.1089/jir.2009.0035. [DOI] [PMC free article] [PubMed] [Google Scholar]
- 37. Zhu F, Zhong X, Zhou Y, Hou Z, Hu H, Liang L, Chen J, Chen Q, Ji X, Shang D. Protective effects of nicorandil against cerebral injury in a swine cardiac arrest model. Exp Ther Med. 2018;16:37–44. DOI: 10.3892/etm.2018.6136. [DOI] [PMC free article] [PubMed] [Google Scholar]
- 38. Schroeder DC, Maul AC, Mahabir E, Koxholt I, Yan X, Padosch SA, Herff H, Bultmann‐Mellin I, Sterner‐Kock A, Annecke T, et al. Evaluation of small intestinal damage in a rat model of 6 minutes cardiac arrest. BMC Anesthesiol. 2018;18:61. DOI: 10.1186/s12871-018-0530-8. [DOI] [PMC free article] [PubMed] [Google Scholar]
- 39. Wender M, Michalowska‐Wender G, Szczech J. Minimal changes of TNF‐alpha and MCP‐1 expression in blood serum of rats subjected to experimental cardiac arrest. Folia Neuropathol. 2005;43:109–111. [PubMed] [Google Scholar]
- 40. Yang M, Hua T, Yang Z, Chen L, Zou Y, Huang X, Li J. The protective effect of rhBNP on postresuscitation myocardial dysfunction in a rat cardiac arrest model. BioMed Res Int. 2020;2020:6969053. DOI: 10.1155/2020/6969053. [DOI] [PMC free article] [PubMed] [Google Scholar]
- 41. Saini HK, Xu YJ, Zhang M, Liu PP, Kirshenbaum LA, Dhalla NS. Role of tumour necrosis factor‐alpha and other cytokines in ischemia‐reperfusion‐induced injury in the heart. Exp Clin Cardiol. 2005;10:213–222. [PMC free article] [PubMed] [Google Scholar]
- 42. Tian M, Yuan YC, Li JY, Gionfriddo MR, Huang RC. Tumor necrosis factor‐alpha and its role as a mediator in myocardial infarction: a brief review. Chronic Dis Transl Med. 2015;1:18–26. DOI: 10.1016/j.cdtm.2015.02.002. [DOI] [PMC free article] [PubMed] [Google Scholar]