

Abstract
Background
Transcriptomic studies have contributed to fundamental knowledge of myocardial remodeling in human heart failure (HF). However, the key HF genes reported are often inconsistent between studies, and systematic efforts to integrate evidence from multiple patient cohorts are lacking. Here, we aimed to provide a framework for comprehensive comparison and analysis of publicly available data sets resulting in an unbiased consensus transcriptional signature of human end‐stage HF.
Methods and Results
We curated and uniformly processed 16 public transcriptomic studies of left ventricular samples from 263 healthy and 653 failing human hearts. First, we evaluated the degree of consistency between studies by using linear classifiers and overrepresentation analysis. Then, we meta‐analyzed the deregulation of 14 041 genes to extract a consensus signature of HF. Finally, to functionally characterize this signature, we estimated the activities of 343 transcription factors, 14 signaling pathways, and 182 micro RNAs, as well as the enrichment of 5998 biological processes. Machine learning approaches revealed conserved disease patterns across all studies independent of technical differences. These consistent molecular changes were prioritized with a meta‐analysis, functionally characterized and validated on external data. We provide all results in a free public resource (https://saezlab.shinyapps.io/reheat/) and exemplified usage by deciphering fetal gene reprogramming and tracing the potential myocardial origin of the plasma proteome markers in patients with HF.
Conclusions
Even though technical and sampling variability confound the identification of differentially expressed genes in individual studies, we demonstrated that coordinated molecular responses during end‐stage HF are conserved. The presented resource is crucial to complement findings in independent studies and decipher fundamental changes in failing myocardium.
Keywords: consensus signature, heart failure, knowledge banks, machine learning, meta‐analysis, transcriptomics
Subject Categories: Heart Failure, Remodeling, Inflammatory Heart Disease, Chronic Ischemic Heart Disease
Nonstandard Abbreviations and Acronyms
- BH
Benjamini–Hochberg
- GSEA
gene set enrichment analysis
- HF‐CS
heart failure consensus signature
- JAK‐STAT
Janus kinase signal transducer and activator of transcription
- miRNA
micro RNA
- ReHeaT
Reference of the Heart Failure Transcriptome
- TF
transcription factor
Clinical Perspective
What Is New?
We provided a consensus transcriptional signature of human end‐stage heart failure built from more than 900 individuals from 16 different patient cohorts that is independent of technical biases.
This work integrates the efforts of the past 15 years in the field of heart failure transcriptomics; we designed an interactive platform to make all results available to the cardiovascular research community: ReHeaT (Reference of the Heart Failure Transcriptome; https://saezlab.shinyapps.io/reheat/).
Cardiovascular researchers can use this resource to analyze and validate independent omics data sets.
What Are the Clinical Implications?
A reliable reference of the molecular processes underlying heart failure is needed to identify generalizable biomarkers with diagnostic or therapeutic relevance.
By tracing the potential myocardial origin of plasma proteomic biomarkers and defining molecular processes during the reactivation of the fetal program during heart failure, we demonstrate that the presented resource is crucial to complement findings in independent studies and decipher fundamental changes in failing myocardium in a large patient population.
Clinical care for heart failure (HF) has not yet overcome the poor prognosis of the syndrome. 1 To develop novel treatment and diagnostic approaches, the understanding of molecular pathophysiology of myocardial failure is crucial. Large‐scale transcriptomic studies have helped elucidate the complexity of gene regulation in HF, notably in processes influencing cardiac hypertrophy, 2 reverse remodeling, 3 and cardiac metabolism. 4 However, low sample sizes of most studies may underestimate the effects of comorbidities, clinical history, and genetic background that interact with the molecular processes active during myocardial remodeling. Poor patient characterization in published data limits the extent to which the generated knowledge can be generalized and applied to independent cohorts. Lack of standards in experimental design, tissue protocols, and data analysis add technical confounding factors. 5 Additionally, most transcriptomic studies focus mainly on identifying substantial changes in mean expression of genes, disregarding subtle changes in patterns of variation and coexpression of genes during cardiac remodeling, which may be more conserved across patients with variable clinical features. Therefore, the combination of multiple studies can be used to assess the robustness of the previously reported patterns of gene dysregulation, identify consistent molecular changes that are less likely influenced by confounding factors, and allow for functional characterizations that can contribute to the identification of novel targets with diagnostic or therapeutic relevance. Current data repositories and resources, such as ArrayExpress, 6 the Gene Expression Omnibus, 7 the European Nucleotide Archive, 8 recount2, 9 and BioJupies, 10 facilitate the access to public transcriptomic studies and allow their comparison. While repositories like recount2 provide access to preprocessed data sets, they currently do not contain all publicly available HF studies. Thus, it is timely to perform an integrative analysis of reported HF specific molecular processes.
Several reports have attempted to compare HF gene expression studies, 11 , 12 , 13 , 14 but, to our knowledge, no resource that provides a consensus transcriptional disease signature characterized with functional tools exists. Furthermore, previous studies have a limited sample size, did not analyze study similarity, and focused on a single etiology. Here, we present a meta‐analysis of 16 publicly available end‐stage HF transcriptome studies comprising 653 HF and 263 healthy left‐ventricle biopsies. First, we identically reprocessed and reanalyzed all data sets to reduce confounding noise produced by bioinformatic pipelines. We evaluated the extent to which these geographically and technically diverse studies agree and derived an HF consensus signature (HF‐CS) that reflects robust and consistent molecular hallmarks of end‐stage HF. We functionally characterized this ranking and estimated transcription factor (TF), micro RNAs (miRNAs), and signaling pathway activities that revealed established and novel insights to the transcriptional landscape of HF. Finally, we made our results publicly available to be leveraged by the research community and exemplified their utility by exploring the reactivation of fetal gene programs in HF and by tracing the potential myocardial origin of plasma proteomic markers.
Methods
All data and supporting materials have been provided with the published article. Results can be queried and explored at (https://saezlab.shinyapps.io/reheat/), code used for all analyses is available at https://github.com/saezlab/HF_meta‐analysis/, and processed data can be downloaded from Zenodo at https://zenodo.org/record/3797044#.XsQPMy2B2u5.
Study Inclusion Criteria
We identified human HF transcriptomic studies performed with either microarray or RNA sequencing by querying the Gene Expression Omnibus database, 7 the European Nucleotide Archive, 8 and ArrayExpress. 6 Search terms included “heart failure,” “ischemic cardiomyopathy,” “dilated cardiomyopathy,” “cardiac failure,” and “heart disease.” We manually reviewed the results and selected studies for inclusion if (1) case samples came from biopsies of the left ventricle of the human heart of patients with end‐stage HF with either ischemic cardiomyopathy or dilated cardiomyopathy; (2) control samples were obtained from patients with nonfailing hearts; (3) data from at least 5 samples were available; (4) microarray platforms were single‐channel chips and could be processed through pipelines described in Data Processing and Normalization; and (5) a publication or preprint with a detailed methodology was available. The selected studies are presented in Table. 15 , 16 , 17 , 18 , 19 , 20 , 21 , 22 , 23 , 24 , 25 , 26 , 27 , 28 , 29 One study (vanHeesch19) was not found by database query but literature review of cardiac gene transcription.
Table 1.
Overview of Studies Selected for Meta‐Analysis
| Study ID | GEO ID | Samples (Control+HF) | Technology | Year | Country | Citation |
|---|---|---|---|---|---|---|
| Liu15_M | GSE57345 | 313 | Microarray | 2015 | USA | 15 |
| Hannenhalli06 | GSE5406 | 210 | Microarray | 2006 | USA | 16 |
| vanHeesch19 | Not in GEO | 77 | RNA sequencing | 2019 | Germany | 17 |
| Sweet18 | GSE116250 | 64 | RNA sequencing | 2018 | USA | 18 |
| Kittleson05 | GSE1869 | 37 | Microarray | 2005 | USA | 19 |
| Tarazon14 | GSE55296 | 35 | RNA sequencing | 2014 | Spain | 20 |
| Spurrell19 | GSE126573 | 33 | RNA sequencing | 2019 | USA | 21 |
| Kong10 | GSE16499 | 30 | Microarray | 2010 | USA | 22 |
| Molina‐Navarro13 | GSE42955 | 29 | Microarray | 2013 | Spain | 23 |
| Greco12 | GSE26887 | 24 | Microarray | 2012 | Italy | 24 |
| Yang14 | GSE46224 | 24 | RNA sequencing | 2014 | USA | 25 |
| Barth06 | GSE3585 | 12 | Microarray | 2006 | Germany | 26 |
| Pepin19 | GSE123976 | 9 | RNA sequencing | 2019 | USA | 27 |
| Kim16 | GSE76701 | 8 | Microarray | 2016 | USA | 28 |
| Schiano17 | GSE71613 | 6 | RNA sequencing | 2017 | Italy | 29 |
| Liu15_R | GSE57344 | 5 | RNA sequencing | 2015 | USA | 15 |
Sixteen data sets fulfilled the inclusion criteria. Samples size is displayed after processing. GEO indicates gene expression omnibus; and HF, heart failure.
Data Processing and Normalization
Available raw data were downloaded and reprocessed to ensure consistent processing and normalization of all studies. Count matrices from RNA‐sequencing studies were obtained with BioJupies 30 and normalized with edgeR. 31 Microarray studies were processed and normalized with limma 32 and oligo 33 packages (full description in Data S1).
To identify differentially expressed genes within each study, gene expression of the samples of control individuals and patients with HF were compared using linear models with limma. 32 Sex, age, comorbidities, etiology, occasion of sample acquisition, and technical batches were used as covariates for experiments that provided this information (Table S1). Differential expression of known markers associated with HF were used as a quality control check for all studies (Data S1). Estimates of the proportion of explained variance associated with the covariates used in the differential analysis were calculated for each study fitting linear models to a reduced data representation using principal component analysis (Data S1).
Consistency Between Studies
We tested the degree to which individual studies could be used to classify samples of other studies by defining a disease score, inspired by Probability of Expression (POE) 34 and Pathway Responsive Genes for Activity Inference from Gene Expression (PROGENy). 35 The disease score linearly combines the gene expression values of the samples of one study with the disease pattern observed in an independent reference study, captured by the t values obtained after differential expression analysis (Figure S1). The disease score of each sample estimates how similar its expression profile is with the disease phenotype, focusing on the coordinated regulation of genes rather than on the changes of the mean expression of specific genes.
Standardized disease scores were used to classify patients with HF in individual studies using as reference the disease patterns of all of the other studies. Our assumption is that if 2 studies derive similar HF transcriptional signatures, then the disease score should effectively differentiate patients with HF and healthy patients. In total, 16 disease classifiers were built corresponding to the t values of the top 500 differentially expressed genes of each study included in the analysis. The area of the receiver operating characteristic curve (AUROC), where HF was used as response variable, was used to test the accuracy of classification of patients with HF and used as a measurement of conservation of gene regulation patterns and similarity between studies.
To test that the classification performance of the disease score was related to the consistency of the direction of the transcriptional regulation, we separated the top differentially expressed genes of each study into up‐ and downregulated genes and enriched them into the sorted gene‐level statistics of each of the other studies using gene set enrichment analysis (GSEA). 36 Gene‐level statistics of each study were sorted by their t value.
Meta‐Analysis
We combined the Benjamin–Hochberg (BH) corrected P values of the differential expression analysis for all genes that were measured in at least 10 data sets using a Fisher’s combined probability test. The degrees of freedom for the significance test of each gene were defined by the number of data sets that included it. We assumed that nonprobabilistic sampling procedures happened in each study, so no additional study weighting was used. 36 A ranking was generated based on the combined test P values after BH correction, representing the HF‐CS (Table S2). The contribution of each study to the meta‐analysis was estimated with the enrichment score of its top 500 differentially expressed genes in the HF‐CS as calculated by GSEA. 37 To test the gradient of consistency of the HF‐CS, we evaluated the performance of disease score classifiers that used different numbers of top genes from the signature (Data S1). Additionally, to test the effect of each study in the final ranking, we performed a leave‐one‐out procedure. We repeated the meta‐analysis 16 times, each time ignoring the values of 1 study at a time. Then we compared the similarity of the top 1000 genes of each leave‐one‐out experiment and the original top 1000 genes of the HF‐CS using a Jaccard index.
To evaluate the added value of the meta‐analysis, we tested if the selection of the top 500 genes from the consensus signature defined a better transcriptional signature of HF compared with signatures obtained from individual experiments. Specifically, we tested if the AUROCs obtained were greater than the ones coming from classifications made by the top 500 genes coming from individual studies using a Wilcoxon paired test. To show that the top genes of the consensus signature shared a more consistent direction of differential regulation than signatures coming from individual studies, we separated the 500 top genes from the consensus signature into up‐ and downregulated independently for each data set, and enriched them into the sorted gene‐level statistics of each of the other studies using GSEA as previously described. We compared the enrichment scores of these pairwise comparisons to the ones obtained using the top 500 differentially expressed genes of individual experiments using a Wilcoxon paired test. Finally, to demonstrate generalizability, we tested a disease score classifier based on the HF‐CS in studies from the curation effort that did not match inclusion criteria attributable to differences in HF etiology, biopsy location, or profiling platform.
Functional Characterization of the HF‐CS
The‐log10 (meta‐analysis P value) of each gene was weighted by its mean direction of change in all studies to create a directed HF‐CS. Gene ontology terms and canonical and hallmark pathways from MSigDB (data downloaded in December 2019) 38 were tested for enrichment in the directed HF‐CS with GSEA 36 using fgsea. 39 TF and miRNA activities were estimated with viper 40 for human regulons obtained from DoRothEA 41 and the miRNA collection of targets from MSigDB, 38 respectively. The activity of signaling pathways was calculated with PROGENy 35 , 42 (Data S1). BH corrected P values were calculated for each test and are available in Table S3. In the case of MSigDB’s gene sets, multiple test correction was performed to each analyzed collection (collection BH P value) and to the union of all collections (global BH P value).
Results
Study Curation and Description
We identified 16 studies that fit the inclusion criteria (Table), which consisted of 263 control, 372 dilated cardiomyopathy, and 281 ischemic cardiomyopathy samples (Figure 1B). The studies were published between 2005 and 2019, and their sizes varied between 5 and 313 samples. Gene coverage after processing was comparable for all studies (mean Jaccard index of ≈0.67) (Figure S2). A total of 14 041 genes were reported by at least 10 studies.
Figure 1. Infographic of study information.
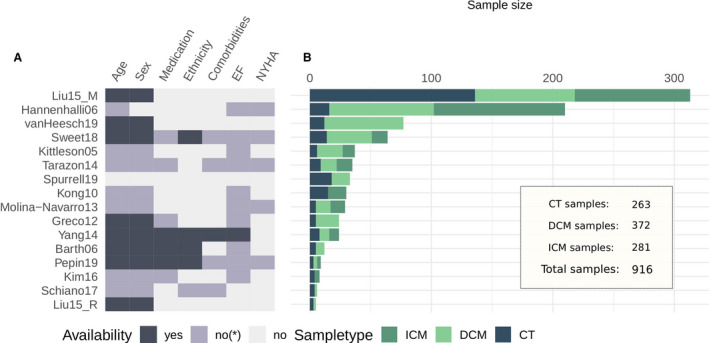
A, Sample information availability per study: yes, information available per sample; no*, incomplete information or only summary statistics; no, no information available. B, Sample size comparison of studies. CT indicates control; DCM, dilated cardiomyopathy; and ICM, ischemic cardiomyopathy.
HF samples from all studies were acquired during heart transplantation, left ventricular assist device implantation, or surgical ventricular restoration, all of which are usually performed for patients with a decompensated failing heart with reduced ejection fraction, justifying their interstudy comparability. As control samples, all studies included biopsies from donor hearts deemed unsuitable for transplant. If stated, unsuitability was attributable to size disparities, ABO mismatch, or other factors. Figure 1A displays the availability of sample information for each study concerning patient demography and HF status. Most of the studies lacked complete descriptions of the clinical and demographic characteristics of the patients included in their publications. When information was available, New York Heart Association classification ranged between III and IV, and left ventricular ejection fraction was reported to be <40% (Table S1). Age and sex distributions are compared in Figure S3.
Sample Variability and Study Consistency
Principal component analysis and analyses of variance were applied to various transformations of the combined data to evaluate sample variability across studies and etiologies (Data S1). The expected interaction of technical heterogeneity with gene expression scales was observed in all samples (Figure S4), but was reduced by gene standardization (Figure S5). Analysis of individual studies revealed that most of the variability of the patients cannot be assigned to reported covariates (Figure S6A). Unmeasured variability may come from clinical, demographic, or genetic differences between patients, but also from differences in tissue biopsies mostly associated with location and cell composition. In studies with reported age and sex differences, we observed different contributions of these covariates to the variability of patients, which highlighted the diversity in experimental designs. In the case of patients with HF (Figure S6B), compared with age (mean, 0.09; SD, 0.08), or difference in sample acquisition (mean, 0.34; SD, 0.04), etiology had a lower mean proportion of explained variance (mean, 0.0698; SD, 0.0624). The variability in gene expression in patients with HF may be explained by other clinically relevant features, but given the lack of patient information, this could not be tested.
We evaluated consistency across the studies by comparing their transcriptional signatures using multiple metrics (Data S1, Figures S7 and S8). We found an almost null concordance among their differentially expressed genes (mean Jaccard index of the top 500 differentially expressed genes, 0.05; Figure 2A), however, the top 500 differentially expressed genes of one study predicted well HF in each other study, using sample classifications based on a disease score (median AUROC, 0.94; Figure 2B; see Data S1, Figure S1). Despite technical differences, each study contained meaningful and complementary information. Studies that profiled only patients with ischemic forms of heart failure (eg, Kong10) effectively classified studies that profiled only patients with dilated cardiomyopathy (eg, Spurrell19) (AUROC, 1) and vice versa (AUROC, 0.95). We observed no association between each study’s mean AUROC and their technology (Wilcoxon test, P=0.72; Figure S9A), sample size, or estimated proportion of variance captured by HF (Pearson correlation, 0.17, 0.18, respectively; P>0.4; Figure S9B). These results indicate that patterns of coexpression of genes are more stable between cohorts than substantial changes in expression of specific genes.
Figure 2. Consistency of the transcriptional signal of end‐stage HF among studies.

A, Pairwise comparison of the top 500 differentially expressed genes of each study using the Jaccard index. B, area under the receiver operating characteristic curve (AUC) of pairwise predictions using a disease score with the top 500 differentially expressed genes of each study. C, Enrichment score (ES) of the top 500 differentially expressed of each study in sorted gene‐level statistics lists.
To confirm that the coordination of molecular responses is conserved among studies, we tested if the direction of deregulation of the top differentially expressed genes of each study were consistent with their direction in the rest of the studies. Up‐ and downregulated genes of each study (500 in total) were enriched separately in the gene‐level statistics of the collection of studies (Figure 2C). Differentially up‐ and downregulated genes had a median enrichment score of 0.55 (Figure 2C, upper panel) and −0.56 (Figure 2C, lower panel), respectively. We observed a correlation between the AUROCs of the disease score classifications and the enrichment scores of differentially expressed genes (Pearson correlations, 0.48 and −0.59; P<10e‐15, for up‐ and downregulated genes, respectively), supporting the idea that even though the size effects of HF‐relevant genes are dependent on the study (Figure 2A), their direction of regulation is generally consistent (Figure 2C), allowing their direct comparison. We observed similar patterns when we selected different numbers of top genes (Figure S10). These results suggest that the proper way to combine the evidence of the curated studies is by looking at the consistency of deregulation of genes and not at the dimension of the change in expression.
Meta‐Analysis of the Transcriptional Responses in End‐Stage HF
We meta‐analyzed the differential expression of 14 041 genes using a Fisher combined probability test (Table S2) to create a HF‐CS that captured a gradient of consistently regulated genes in end‐stage HF across multiple studies regardless of their direction (Figure 3; Figure S11). We found no correlation between the sample size of a study and the enrichment of its differentially expressed genes in the top of the HF‐CS (Spearman correlation, 0.24; P=0.37), suggesting that proper experimental design and representative sampling could compensate for study size. 36 Similarly, we found no association between the enrichment of differentially expressed genes of individual studies in the top of the HF‐CS and the technology used (Wilcoxon test, P=0.4418; Figure S9A), reflecting consistency for all studies. A leave‐one‐out procedure (see Methods) demonstrated robustness of the signature (mean Jaccard index of the top 1000 genes, 0.91), although larger discrepancies were observed when the top 4 largest studies were ignored, as expected (mean Jaccard index of the top 1000 genes, 0.76). Among the top 500 genes in the HF‐CS (Figure 3B) we observed known HF markers such as MYH6, MME, CNN1, NPPA, KCNH2, and ATP2A2; extracellular‐associated proteins such as COL21A1, COL15A1, ECM2, and MXRA5; fibroblast‐associated protein FGF14; mast cell–associated protein KIT; and proteins mapped to force transmission defects like FNDC1, LAMA4, SSPN, or related to ion channels like KCNN3.
Figure 3. Meta‐analysis summary.
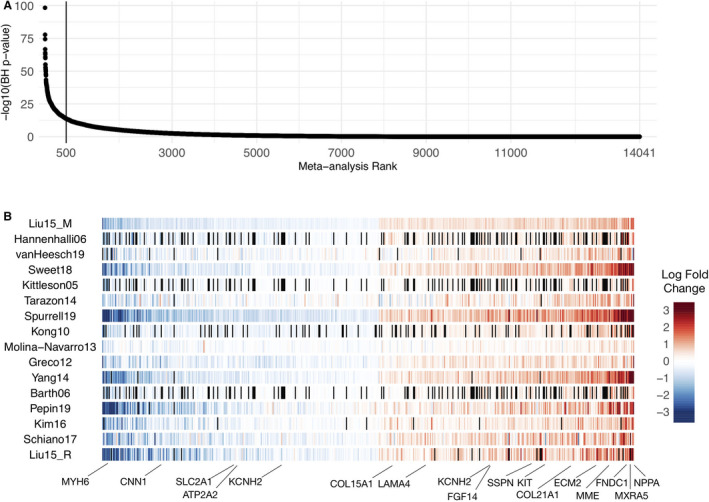
A, Sorted −log10 (meta analysis BH P values) of the 14 041 genes included in the Fisher combined test, representing the heart failure consensus signature (HF‐CS). B, Top 500 genes sorted by their mean log fold change across all studies; black lines represent genes that were not measured in specific studies. A selection of HF marker genes are highlighted. BH indicates Benjamini–Hochberg.
To evaluate the added value of the meta‐analysis, we tested if the selection of the top 500 genes from the HF‐CS defined a better transcriptional signature of HF than signatures obtained from individual experiments of the same size (Data S1). An improvement in the AUROCs of classifiers based on the disease score was obtained (Wilcoxon paired test, P<1×10e‐16), and the top genes of the HF‐CS were consistently more enriched in individual lists of differentially expressed genes than gene signatures from individual experiments (Wilcoxon paired test, P<1×10e‐16). The proportion of variability in gene expression explained by HF, controlled for other clinical and technical covariates, was greater for top genes than for genes in a lower ranking in the HF‐CS (Figures S12 and S13).
To show the added value of the meta‐analysis from a single gene perspective, we identified genes that were highlighted in the HF‐CS but were not considered significantly relevant in individual studies (BH P value of differential expression analysis <0.1). As expected, highly ranked genes in the HF‐CS (rank 1–500) were usually captured by more individual studies than lower‐ranked genes (Wilcoxon test, P<0.0001; Figure S14A). The highest‐ranked genes in the HF‐CS that were reported with a BH P value of <0.1 in only 2 of 16 studies were TTC3, FAM98B, CCDC125, MDH1B, and WIZ. These genes exhibited consistency in the direction of deregulation (Figure S14B). As an example, TTC3’s t values indicate (HF‐CS rank, 109) consistent upregulation (Figure S14B). TTC3 has not been investigated in the context of HF yet, but literature suggests a role in myofibroblast differentiation 43 and was reported to be transcribed to a circular RNA that elicits cardioprotective function after ischemia. 44
We tested if the HF‐CS captured disease processes that could be extrapolated to a broad range of HF etiologies including different infectious diseases (Table S1). We built disease score classifiers (Data S1, Figure S8) based on the HF‐CS and used them to classify patients with HF in studies excluded in the meta‐analysis (Figure S15A). Classifier performance (mean AUROC, 0.9) indicated that many but not all genes of the HF‐CS were generalizable to HF because of diverse etiologies. Furthermore, we tested 2 additional HF studies with dilated cardiomyopathy and ischemic cardiomyopathy samples that were processed with different bioinformatic pipelines for disease score performance (Figure S15B). The perfect classifications (AUROCs, 1) demonstrated the robustness of the HF‐CS to technical variations.
Functional Evaluation of the HF‐CS
We characterized the underlying deregulated processes of the HF‐CS by estimating the activity of TFs, signaling pathways, and miRNAs and testing for enrichment of gene sets capturing various molecular processes (Table S3). We tested a total of 5998 gene sets, of which 77 yielded an enrichment in the HF‐CS (global BH, P<0.25; Figure 4A). When each collection of gene sets was analyzed separately, 148 gene sets yielded an enrichment (collection BH, P<0.25, Table S3). Positively enriched gene sets predominantly relate to the matrisome, while negatively enriched sets associated with diverse processes, many of which involve inflammation. From the inferred transcriptional activity of 343 TFs (see Methods, Figure 4B), we found 65 TFs differentially active in HF (BH P<0.25). Among active TFs were MEF2A‐C, ARNT, and MEIS1‐2. MEF2 family members are expressed during cardiac development and have been described to be part of the fetal reprogramming in HF. 45 The cardiac‐specific depletion of ARNT resulted in an increased fatty acid oxidation leading to improved cardiac function in mice. 13 MEIS1 and MEIS2 contributed to the curbing of cardiomyocyte differentiation in mice and rats. 46 , 47 Of 211 tested miRNAs, 15 were enriched in the HF‐CS (BH, P<0.25) (Figure 4C). Upregulated miRNAs include mir‐137, which has also been reported to negatively regulate α1‐antichymotrypsin following left ventricular assist device treatment in myocardial tissue 48 but has not yet been investigated for its role in end‐stage HF. Other upregulated miRNAs include mir‐513, mir105, and mir3805P, which have not been studied in the context of HF before. From the estimated signaling pathway activities (Figure 4D), tumor necrosis factor‐α (TNFα), NF‐κB (nuclear factor κ‐light‐chain enhancer of activated B cells), and androgen receptor signaling were consistently inactive (BH, P<0.25). While TNFα levels are elevated in patients with HF in relation to decreasing functional status, 49 clinical trials targeting TNFα failed to improve HF outcome. 50 Additionally, there is recent evidence that TNFα signaling could be part of a physiological inflammatory response exerting cardioprotective effects. 51 , 52 Downregulated pathway activities of TNFα and NF‐κB accompanied by decreased TF activities of RELA and NFKB1 in the HF‐CS indicate an ambiguous role of TNFα during HF that has not been fully appreciated yet. Janus kinase signal transducer and activator of transcription (JAK‐STAT) was the only pathway with a high activity (BH, P<0.25). The JAK‐STAT pathway is activated by growth factors and cytokines and is an imperative regulator of cardiac development and inflammation. The role of JAK‐STAT in HF is ambivalently discussed, 53 with evidence that JAK‐STAT is involved in cardiac hypertrophy, 54 ischemic pre‐ and postconditioning, 55 and cardiac fibrosis. 56 Taken together, the functional interpretation of the HF‐CS reflects molecular and cell biology perturbations that shape the pathological gene expression profile in HF and therefore reveals promising objects of future investigations.
Figure 4. Functional characterization of the HF‐CS: −log10 (BH P‐values) coloured by direction of enrichment (A and C) or by direction of activation (B and D) of the top 50 (A) most enriched canonical and hallmark gene sets, (B) transcription factor activities, (C) miRNAs’ targets, and (D) all signaling pathway activities.
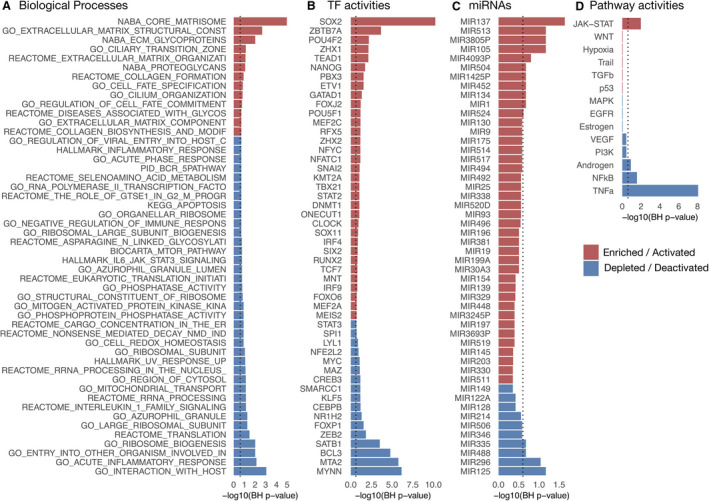
Dashed line indicates BH P=0.25. BH indicates Benjamini‐Hochberg; HF‐CS, heart failure consensus signature; and miRNA, micro RNA.
HF‐CS as a Resource for Biomarker Detection and Hypothesis Building
Finally, we tested how the HF‐CS could be leveraged to build or confirm hypotheses from independent studies by comparing the dysregulation patterns of their reported markers (Figure 5A, Table S4). We analyzed the plasma proteome of patients with early and manifest HF from Egerstedt et al 57 to trace their potential myocardial origin. We observed a clear enrichment of manifest HF proteins (GSEA, P=0.0001) and a modest enrichment of early HF proteins (GSEA, P=0.13) in the top of the HF‐CS (Figure 5B). Sixty‐four plasma proteins from manifest HF were part of the enrichment leading edge and agreed with the direction of transcriptional regulation (Figure 5C). These candidates were investigated for reported protein expression in heart muscle tissue in the Human Protein Atlas 58 (Figure S16A) and tissue specificity (Figure S16B). Candidate markers include the established HF marker NPPA and novel potential markers including CCDC80, BID, MAP2K1, MRC2, JAK2, and LTBP4.
Figure 5. HF‐CS as a reference that complements independent studies: (A) Schematic of a suggested framework.
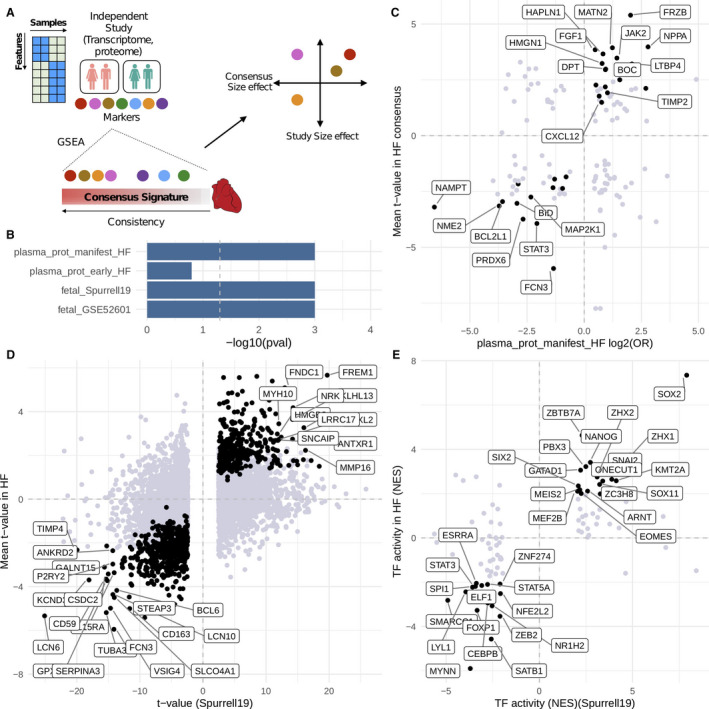
Marker features from independent studies are enriched in the heart failure consensus signature (HF‐CS) with gene set enrichment analysis (GSEA). Features that belong to the leading edge are further filtered, for example, by correlation or ranking in the HF‐CS. B, Enrichment results of marker features from 4 individual studies. C, Plasma proteome of patients with HF mapped to the HF‐CS. D, Fetal cardiac transcriptome (Spurrell19) mapped to HF‐CS on gene level and (E) transcription factor (TF) level. Black dots in (C and D) indicate correlated features in the enrichment leading edge; labeled features in (C and D) indicate genes with a rank <500 in HF‐CS. Black dots in (E) indicate overlap with significantly dysregulated TFs derived from the HF‐CS.
Additionally, we dissected the reactivation of fetal gene programs in HF by analyzing 2 public fetal cardiac transcriptomes (GSE52601, Spurrell19) and their estimated TF activities. Fetal transcriptional signatures of both studies were enriched in the top rankings of the HF‐CS (GSEA, P<0.01) (Figure 5B). A total of 221 of the top 500 genes from HF‐CS correlated with fetal genes reported by Spurrell19 (Figure 5D) while 32 TFs correlated between fetal heart and HF‐CS (Figure 5E). Similar results were observed for GSE52601 (Figure S17).
Discussion
In this study, we present a comprehensive meta‐analysis of the HF transcriptome, analyzing and comparing 16 data sets, and a total of 916 samples. To our knowledge, this report represents the largest meta‐analysis of human HF transcriptome studies to date. HF is a complex disorder on both the clinical and genetic levels. As such, the published work in myocardial transcriptomics represents a heterogeneous picture of transcriptional regulation in the heart with little agreement on key regulated genes. In the studies included in this meta‐analysis, clinical heterogeneity is compounded by wide variability in analysis pipeline, study design, tissue protocol, and patient selection. Our work shows that despite these difficulties, combining the insights of these studies provides an opportunity not only to robustly evaluate their reproducibility, but also to gain a more complete picture of transcriptional regulation.
The presented study combines gene expression data from microarray and sequencing technologies. While the measurements of both technologies differ fundamentally, we demonstrated that similar biological profiles can be captured. We focused on comparing and combining differential expression results across studies, as opposed to integrating all samples in a single data set. This framework prioritized molecular differences between phenotypes that are similar in independent patient cohorts and allowed us to reuse and review a large patient cohort to create the HF‐CS. However, a simplification of the transcriptome was necessary. We could not regard transcript isoforms or noncoding transcripts in this analysis, since we focused on ≈14 000 protein coding genes that were measured to similar extent by both technologies.
Our results suggest that the magnitude of changes in mean expression of marker genes depends highly on the study. We observed a 5% agreement of the top 500 differentially expressed genes between studies. This disagreement cannot be explained by differences in gene coverage or technologies, since the intersection of profiled genes in all studies is ≈70%. However, patterns of gene coexpression are stable and comparable among cohorts, regardless of their sample size, technology, and variability, allowing for their integration. Unexpectedly, studies with fewer than 10 patients were still able to effectively capture similar patterns of gene deregulation as studies with >200 patients. This highlights the importance of representative patient sampling, since it may compensate for sample size. Moreover, we observed that consistent coexpression patterns were shared among etiologies, suggesting that conserved disease mechanisms converge in end‐stage HF.
One strength of this study is the added robustness to the gene dysregulation associations found in end‐stage HF, based on integrating equally the evidence of a diverse collection of studies and focusing in expression patterns, rather than in the magnitude of the change in expression of specific genes. In this meta‐analysis, we balanced the bias of the experimental design and increased the sample size, while reducing technical variance by standardizing the bioinformatics processing and analysis of each data set. Another strength is the proposed transfer learning framework that allows comparison of the patterns of gene coexpression of a disease phenotype of multiple patient cohorts. Additionally, the estimation of TF and signaling activities, as well as the enrichment of molecular processes, provides a functional catalog of interpretable features that describe mechanistic processes that can help to explain the observed patterns of gene expression.
Important limitations of our study relate to the data used. In this meta‐analysis, we included only public data sets from published studies. Since most of the studies lack complete descriptions of the individuals included in their cohorts, it is unfeasible to estimate how much of the clinical and demographic diversity of patients with HF is covered in our curation. As the necessity of studying HF in clinically ramified subgroups is becoming evident, 59 the impact of comorbidities, medication, and disease phenotype on the gene transcription profile needs to be considered. To test how the reported gene expression patterns associate with severity and progression, a deeper patient characterization is required. With this work, we aimed to encourage the community in the field to open the dialogue about secure data‐sharing standards and more inclusive and transparent study designs. Another important limitation of our study, and of all studies using bulk RNA measurements, is that they do not allow the capture of cell type–specific contributions to the disease processes.
We built the user‐friendly free platform ReHeaT (Reference of the Heart Failure Transcriptome; https://saezlab.shinyapps.io/reheat/) to facilitate further use of the HF‐CS. We propose 2 ways in which the HF‐CS can be exploited. First, the genes, TF, and pathways provide a rich resource for interpreting and understanding the transcriptional landscape of HF. Second, the HF‐CS can be used as a trustworthy reference of HF to assist in hypothesis building or confirmation. Below, we discuss in detail both approaches.
We aimed to interpret the presented HF‐CS and identified established hallmarks in HF, including fetal reprogramming, cardiac fibrosis, and activation of JAK‐STAT. This encouraged us to highlight findings that have been less explored yet, like the role of active TFs including MEIS1‐2, ARNT, RUNX2, and TEAD1 or the absence of TNFα signaling. These functional insights, however, still require experimental validation to confirm their relevance.
We demonstrated the utility of the HF‐CS by integration with studies analyzing the fetal transcriptome and the plasma proteome from patients with HF. The activation of a fetal gene program has been linked to the molecular remodeling processes in HF. However, detailed pathophysiology of this process is incompletely understood. Our analysis provides a plethora of genes and TFs that might shape the fetal response in HF. We detected established TFs like MEF2, but also identified a collection of less explored TFs including SOX2, ZBTB7A, NANOG, and ONECUT1. The plasma proteome of patients with HF is used to identify circulating biomarkers. However, tracing the origin of measured candidates to the heart is often difficult. We filtered circulating proteins on the basis of the HF‐CS and identified the established marker NPPA. 60 Other identified markers include Wnt modulators SFRP1 and FRZB; the latter has been associated with HF outcome before. 61 We also identify CXCL12 to be of potential myocardial origin, which is associated with stroke 62 and acute HF. 63 HAPLN1, MATN2, and COL8A1 constitute extracellular matrix components with, to date, an unknown role in HF. To suggest cardiac tissue specificity of candidates, we assessed protein expression in cardiac tissue. As a result of this, we propose CCDC80 as a promising HF biomarker candidate, which has been suggested to be secreted by cardiomyocytes in response to pressure overload before. 64 , 65 BID also displayed reasonable cardiac tissue specificity but has not been studied in the context of HF yet. Other genes with reported protein expression included MAP2K1, MRC2, JAK2, and LTBP4. These candidates could represent biomarkers of pathophysiological relevance and potential clinical utility.
We propose that the utility of data integration with more independent studies is highly promising. Especially with transcriptomic technologies developing toward single‐cell and spatial resolution, this resource could help to confirm cell type–specific elements in a large HF population. Additionally, etiology‐specific responses could be derived by comparing differences of different cohorts with our proposed consensus signature. As more data are released, the resource described in this work will be updated to be a trustful reference of the transcriptome of HF.
In summary, we demonstrated the feasibility of combining gene expression data sets from different technologies, years, and centers in a biologically meaningful way. We highlight the importance of data sharing by building a rich resource and displaying its utility to advance HF research. As the number of cardiovascular high‐throughput studies increases, the need for structured data integration is evident. We provide a reference for this purpose that is applicable to many other research topics within the cardiovascular field.
Sources of Funding
R.O. Ramirez Flores and Drs Lanzer, Levinson, Schultz, and Saez‐Rodriguez are supported by Informatics for Life funded by the Klaus Tschira Foundation.
Disclosures
JSR has received funding from GSK and Sanofi and expects consultant fees from Travere Therapeutics.
Supporting information
Table S1
Table S2
Table S3
Table S4
Acknowledgments
The authors thank Tim Kuhn, Martin Busch, and Jakob Wirbel for useful discussions, and Hyojin Kim for editing the graphical abstract. Open access funding enabled and organized by ProjektDEAL.
(J Am Heart Assoc. 2021;10:e019667. DOI: 10.1161/JAHA.120.019667.)
Preprint posted on MedRvix May 26, 2020. DOI: https://doi.org/10.1101/2020.05.23.20110858.
For Sources of Funding and Disclosures, see page 12.
References
- 1. Ziaeian B, Fonarow GC. Epidemiology and aetiology of heart failure. Nat Rev Cardiol. 2016;13:368–378. DOI: 10.1038/nrcardio.2016.25. [DOI] [PMC free article] [PubMed] [Google Scholar]
- 2. Raghow R. An, “Omics” perspective on cardiomyopathies and heart failure. Trends Mol Med. 2016;22:813–827. DOI: 10.1016/j.molmed.2016.07.007. [DOI] [PubMed] [Google Scholar]
- 3. Kim GH, Uriel N, Burkhoff D. Reverse remodelling and myocardial recovery in heart failure. Nat Rev Cardiol. 2018;15:83–96. DOI: 10.1038/nrcardio.2017.139. [DOI] [PubMed] [Google Scholar]
- 4. Peterzan MA, Lygate CA, Neubauer S, Rider OJ. Metabolic remodeling in hypertrophied and failing myocardium: a review. Am J Physiol Heart Circ Physiol. 2017;313:H597–H616. DOI: 10.1152/ajpheart.00731.2016. [DOI] [PubMed] [Google Scholar]
- 5. Harakalova M, Asselbergs FW. Systems analysis of dilated cardiomyopathy in the next generation sequencing era. Wiley Interdiscip Rev Syst Biol Med. 2018;10:e1419. DOI: 10.1002/wsbm.1419. [DOI] [PubMed] [Google Scholar]
- 6. Athar A, Füllgrabe A, George N, Iqbal H, Huerta L, Ali A, Snow C, Fonseca NA, Petryszak R, Papatheodorou I, et al. ArrayExpress update—from bulk to single‐cell expression data. Nucleic Acids Res. 2018;47:D711–D715. DOI: 10.1093/nar/gky964. [DOI] [PMC free article] [PubMed] [Google Scholar]
- 7. Barrett T, Wilhite SE, Ledoux P, Evangelista C, Kim IF, Tomashevsky M, Marshall KA, Phillippy KH, Sherman PM, Holko M, et al. NCBI GEO: archive for functional genomics data sets—update. Nucleic Acids Res. 2012;41:D991–D995. DOI: 10.1093/nar/gks1193. [DOI] [PMC free article] [PubMed] [Google Scholar]
- 8. Leinonen R, Akhtar R, Birney E, Bower L, Cerdeno‐Tárraga A, Cheng Y, Cleland I, Faruque N, Goodgame N, Gibson R, et al. The European nucleotide archive. Nucleic Acids Res. 2011;39:D28–D31. DOI: 10.1093/nar/gkq967. [DOI] [PMC free article] [PubMed] [Google Scholar]
- 9. Collado‐Torres L, Nellore A, Kammers K, Ellis SE, Taub MA, Hansen KD, Jaffe AE, Langmead B, Leek JT. Reproducible RNA‐seq analysis using recount2. Nat Biotechnol. 2017;35:319–321. DOI: 10.1038/nbt.3838. [DOI] [PMC free article] [PubMed] [Google Scholar]
- 10. Lachmann A, Torre D, Keenan AB, Jagodnik KM, Lee HJ, Wang L, Silverstein MC, Ma’ayan A. Massive mining of publicly available RNA‐seq data from human and mouse. Nat Commun. 2018;9:1–10. DOI: 10.1038/s41467-018-03751-6. [DOI] [PMC free article] [PubMed] [Google Scholar]
- 11. Alimadadi A, Munroe PB, Joe B, Cheng X. Meta‐analysis of dilated cardiomyopathy using cardiac RNA‐seq transcriptomic datasets. Genes. 2020;11:60. DOI: 10.3390/genes11010060. [DOI] [PMC free article] [PubMed] [Google Scholar]
- 12. Asakura M, Kitakaze M. Global gene expression profiling in the failing myocardium. Circ J. 2009;73:1568–1576. DOI: 10.1253/circj.CJ-09-0465. [DOI] [PubMed] [Google Scholar]
- 13. Sharma UC, Pokharel S, Evelo CTA, Maessen JG. A systematic review of large scale and heterogeneous gene array data in heart failure. J Mol Cell Cardiol. 2005;38:425–432. DOI: 10.1016/j.yjmcc.2004.12.016. [DOI] [PubMed] [Google Scholar]
- 14. Barth AS, Kumordzie A, Frangakis C, Margulies KB, Cappola TP, Tomaselli GF. Reciprocal transcriptional regulation of metabolic and signaling pathways correlates with disease severity in heart failure. Circ Cardiovasc Genet. 2011;4:475–483. DOI: 10.1161/CIRCGENETICS.110.957571. [DOI] [PMC free article] [PubMed] [Google Scholar]
- 15. Liu Y, Morley M, Brandimarto J, Hannenhalli S, Hu Y, Ashley EA, Tang WHW, Moravec CS, Margulies KB, Cappola TP, et al. RNA‐Seq identifies novel myocardial gene expression signatures of heart failure. Genomics. 2015;105:83–89. DOI: 10.1016/j.ygeno.2014.12.002. [DOI] [PMC free article] [PubMed] [Google Scholar]
- 16. Hannenhalli S, Putt ME, Gilmore JM, Wang J, Parmacek MS, Epstein JA, Morrisey EE, Margulies KB, Cappola TP. Transcriptional genomics associates FOX transcription factors with human heart failure. Circulation. 2006;114:1269–1276. DOI: 10.1161/CIRCULATIONAHA.106.632430. [DOI] [PubMed] [Google Scholar]
- 17. van Heesch S, Witte F, Schneider‐Lunitz V, Schulz JF, Adami E, Faber AB, Kirchner M, Maatz H, Blachut S, Sandmann C‐L, et al. The translational landscape of the human heart. Cell. 2019;178:242–260.e29. DOI: 10.1016/j.cell.2019.05.010. [DOI] [PubMed] [Google Scholar]
- 18. Sweet ME, Cocciolo A, Slavov D, Jones KL, Sweet JR, Graw SL, Reece TB, Ambardekar AV, Bristow MR, Mestroni L, et al. Transcriptome analysis of human heart failure reveals dysregulated cell adhesion in dilated cardiomyopathy and activated immune pathways in ischemic heart failure. BMC Genomics. 2018;19:812. DOI: 10.1186/s12864-018-5213-9. [DOI] [PMC free article] [PubMed] [Google Scholar]
- 19. Kittleson MM, Minhas KM, Irizarry RA, Ye SQ, Edness G, Breton E, Conte JV, Tomaselli G, Garcia JGN, Hare JM. Gene expression analysis of ischemic and nonischemic cardiomyopathy: shared and distinct genes in the development of heart failure. Physiol Genomics. 2005;21:299–307. DOI: 10.1152/physiolgenomics.00255.2004. [DOI] [PubMed] [Google Scholar]
- 20. Tarazón E, Roselló‐Lletí E, Rivera M, Ortega A, Molina‐Navarro MM, Triviño JC, Lago F, González‐Juanatey JR, Orosa P, Montero JA, et al. RNA sequencing analysis and atrial natriuretic peptide production in patients with dilated and ischemic cardiomyopathy. PLoS One. 2014;9:e90157. DOI: 10.1371/journal.pone.0090157. [DOI] [PMC free article] [PubMed] [Google Scholar]
- 21. Spurrell CH, Barozzi I, Mannion BJ, Blow MJ, Fukuda‐Yuzawa Y, Afzal SY, Akiyama JA, Afzal V, Tran S, Plajzer‐Frick I, et al. Genome‐wide fetalization of enhancer architecture in heart disease. bioRxiv. 2019. Available at: https://www.biorxiv.org/content/10.1101/591362v1.full. Accessed April 29, 2020. [DOI] [PMC free article] [PubMed]
- 22. Kong SW, Hu YW, Ho JWK, Ikeda S, Polster S, John R, Hall JL, Bisping E, Pieske B, dos Remedios CG, et al. Heart failure‐associated changes in RNA splicing of sarcomere genes. Circ Cardiovasc Genet. 2010;3:138–146. DOI: 10.1161/CIRCGENETICS.109.904698. [DOI] [PMC free article] [PubMed] [Google Scholar]
- 23. Molina‐Navarro MM, Roselló‐Lletí E, Ortega A, Tarazón E, Otero M, Martínez‐Dolz L, Lago F, González‐Juanatey JR, España F, García‐Pavía P, et al. Differential gene expression of cardiac ion channels in human dilated cardiomyopathy. PLoS One. 2013;8:e79792. DOI: 10.1371/journal.pone.0079792. [DOI] [PMC free article] [PubMed] [Google Scholar]
- 24. Greco S, Fasanaro P, Castelvecchio S, D’Alessandra Y, Arcelli D, Di Donato M, Malavazos A, Capogrossi MC, Menicanti L, Martelli F. MicroRNA dysregulation in diabetic ischemic heart failure patients. Diabetes. 2012;61:1633–1641. DOI: 10.2337/db11-0952. [DOI] [PMC free article] [PubMed] [Google Scholar]
- 25. Yang K‐C, Yamada KA, Patel AY, Topkara VK, George I, Cheema FH, Ewald GA, Mann DL, Nerbonne JM. Deep RNA sequencing reveals dynamic regulation of myocardial noncoding RNAs in failing human heart and remodeling with mechanical circulatory support. Circulation. 2014;129:1009–1021. DOI: 10.1161/CIRCULATIONAHA.113.003863. [DOI] [PMC free article] [PubMed] [Google Scholar]
- 26. Barth AS, Kuner R, Buness A, Ruschhaupt M, Merk S, Zwermann L, Kääb S, Kreuzer E, Steinbeck G, Mansmann U, et al. Identification of a common gene expression signature in dilated cardiomyopathy across independent microarray studies. J Am Coll Cardiol. 2006;48:1610–1617. DOI: 10.1016/j.jacc.2006.07.026. [DOI] [PubMed] [Google Scholar]
- 27. Pepin ME, Drakos S, Ha C‐M, Tristani‐Firouzi M, Selzman CH, Fang JC, Wende AR, Wever‐Pinzon O. DNA methylation reprograms cardiac metabolic gene expression in end‐stage human heart failure. Am J Physiol Heart Circ Physiol. 2019;317:H674–H684. DOI: 10.1152/ajpheart.00016.2019. [DOI] [PMC free article] [PubMed] [Google Scholar]
- 28. Kim EH, Galchev VI, Kim JY, Misek SA, Stevenson TK, Campbell MD, Pagani FD, Day SM, Johnson TC, Washburn JG, et al. Differential protein expression and basal lamina remodeling in human heart failure. Proteomics Clin Appl. 2016;10:585–596. DOI: 10.1002/prca.201500099. [DOI] [PMC free article] [PubMed] [Google Scholar]
- 29. Schiano C, Costa V, Aprile M, Grimaldi V, Maiello C, Esposito R, Soricelli A, Colantuoni V, Donatelli F, Ciccodicola A, et al. Heart failure: pilot transcriptomic analysis of cardiac tissue by RNA‐sequencing. Cardiol J. 2017;24:539–553. DOI: 10.5603/CJ.a2017.0052. [DOI] [PubMed] [Google Scholar]
- 30. Torre D, Lachmann A, Ma’ayan A. BioJupies: automated generation of interactive notebooks for RNA‐Seq data analysis in the cloud. Cell Syst. 2018;7:556–561.e3. DOI: 10.1016/j.cels.2018.10.007. [DOI] [PMC free article] [PubMed] [Google Scholar]
- 31. Robinson MD, McCarthy DJ, Smyth GK. edgeR: a Bioconductor package for differential expression analysis of digital gene expression data. Bioinformatics. 2010;26:139–140. DOI: 10.1093/bioinformatics/btp616. [DOI] [PMC free article] [PubMed] [Google Scholar]
- 32. Ritchie ME, Phipson B, Wu D, Hu Y, Law CW, Shi W, Smyth GK. limma powers differential expression analyses for RNA‐sequencing and microarray studies. Nucleic Acids Res. 2015;43:e47. DOI: 10.1093/nar/gkv007. [DOI] [PMC free article] [PubMed] [Google Scholar]
- 33. Carvalho BS, Irizarry RA. A framework for oligonucleotide microarray preprocessing. Bioinformatics. 2010;26:2363–2367. DOI: 10.1093/bioinformatics/btq431. [DOI] [PMC free article] [PubMed] [Google Scholar]
- 34. Choi H, Shen R, Chinnaiyan AM, Ghosh D. A latent variable approach for meta‐analysis of gene expression data from multiple microarray experiments. BMC Bioinformatics. 2007;8:364. DOI: 10.1186/1471-2105-8-364. [DOI] [PMC free article] [PubMed] [Google Scholar]
- 35. Schubert M, Klinger B, Klünemann M, Sieber A, Uhlitz F, Sauer S, Garnett MJ, Blüthgen N, Saez‐Rodriguez J. Perturbation‐response genes reveal signaling footprints in cancer gene expression. Nat Commun. 2018;9:20. DOI: 10.1038/s41467-017-02391-6. [DOI] [PMC free article] [PubMed] [Google Scholar]
- 36. Meng X‐L. Statistical paradises and paradoxes in big data (I): Law of large populations, big data paradox, and the 2016 US presidential election. Ann Appl Stat. 2018;12:685–726. [Google Scholar]
- 37. Subramanian A, Tamayo P, Mootha VK, Mukherjee S, Ebert BL, Gillette MA, Paulovich A, Pomeroy SL, Golub TR, Lander ES, et al. Gene set enrichment analysis: a knowledge‐based approach for interpreting genome‐wide expression profiles. Proc Natl Acad Sci U S A. 2005;102:15545–15550. DOI: 10.1073/pnas.0506580102. [DOI] [PMC free article] [PubMed] [Google Scholar]
- 38. Liberzon A, Birger C, Thorvaldsdóttir H, Ghandi M, Mesirov JP, Tamayo P. The molecular signatures database hallmark gene set collection. Cell Syst. 2015;1:417–425. DOI: 10.1016/j.cels.2015.12.004. [DOI] [PMC free article] [PubMed] [Google Scholar]
- 39. Korotkevich G, Sukhov V, Sergushichev A. Fast gene set enrichment analysis. bioRXiv. 2019. DOI: 10.1101/060012. Available at: https://www.biorxiv.org/content/10.1101/060012v2. Accessed August 15, 2020. [DOI]
- 40. Alvarez MJ, Shen Y, Giorgi FM, Lachmann A, Ding BB, Ye BH, Califano A. Functional characterization of somatic mutations in cancer using network‐based inference of protein activity. Nat Genet. 2016;48:838–847. DOI: 10.1038/ng.3593. [DOI] [PMC free article] [PubMed] [Google Scholar]
- 41. Garcia‐Alonso L, Holland CH, Ibrahim MM, Turei D, Saez‐Rodriguez J. Benchmark and integration of resources for the estimation of human transcription factor activities. Genome Res. 2019;29:1363–1375. DOI: 10.1101/gr.240663.118. [DOI] [PMC free article] [PubMed] [Google Scholar]
- 42. Holland CH, Szalai B, Saez‐Rodriguez J. Transfer of regulatory knowledge from human to mouse for functional genomics analysis. Biochim Biophys Acta Gene Regul Mech. 2020;1863:194431. DOI: 10.1016/j.bbagrm.2019.194431. [DOI] [PubMed] [Google Scholar]
- 43. Kim J‐H, Ham S, Lee Y, Suh GY, Lee Y‐S. TTC3 contributes to TGF‐β‐induced epithelial‐mesenchymal transition and myofibroblast differentiation, potentially through SMURF2 ubiquitylation and degradation. Cell Death Dis. 2019;10:92. DOI: 10.1038/s41419-019-1308-8. [DOI] [PMC free article] [PubMed] [Google Scholar]
- 44. Cai L, Qi B, Wu X, Peng S, Zhou G, Wei Y, Xu J, Chen S, Liu S. Circular RNA Ttc3 regulates cardiac function after myocardial infarction by sponging miR‐15b. J Mol Cell Cardiol. 2019;130:10–22. DOI: 10.1016/j.yjmcc.2019.03.007. [DOI] [PubMed] [Google Scholar]
- 45. Dirkx E, da Costa Martins PA, De Windt LJ. Regulation of fetal gene expression in heart failure. Biochim Biophys Acta. 2013;1832:2414–2424. DOI: 10.1016/j.bbadis.2013.07.023. [DOI] [PubMed] [Google Scholar]
- 46. Filomena MC, Bang M‐L. In the heart of the MEF2 transcription network: novel downstream effectors as potential targets for the treatment of cardiovascular disease. Cardiovasc Res. 2018;114:1425–1427. DOI: 10.1093/cvr/cvy123. [DOI] [PubMed] [Google Scholar]
- 47. Shirazi LF, Bissett J, Romeo F, Mehta JL. Role of inflammation in heart failure. Curr Atheroscler Rep. 2017;19:27. DOI: 10.1007/s11883-017-0660-3. [DOI] [PubMed] [Google Scholar]
- 48. Lok SI, van Mil A, Bovenschen N, van der Weide P, van Kuik J, van Wichen D, Peeters T, Siera E, Winkens B, Sluijter JPG, et al. Post‐transcriptional regulation of α‐1‐antichymotrypsin by microRNA‐137 in chronic heart failure and mechanical support. Circ Heart Fail. 2013;6:853–861. DOI: 10.1161/CIRCHEARTFAILURE.112.000255. [DOI] [PubMed] [Google Scholar]
- 49. Mann DL. Innate immunity and the failing heart. Circ Res. 2015;116:1254–1268. DOI: 10.1161/CIRCRESAHA.116.302317. [DOI] [PMC free article] [PubMed] [Google Scholar]
- 50. Chung ES, Packer M, Lo KH, Fasanmade AA, Willerson JT. Randomized, double‐blind, placebo‐controlled, pilot trial of infliximab, a chimeric monoclonal antibody to tumor necrosis factor‐α, in patients with moderate‐to‐severe heart failure. Circulation. 2003;107:3133–3140. DOI: 10.1161/01.CIR.0000077913.60364.D2. [DOI] [PubMed] [Google Scholar]
- 51. Papathanasiou S, Rickelt S, Soriano ME, Schips TG, Maier HJ, Davos CH, Varela A, Kaklamanis L, Mann DL, Capetanaki Y. Tumor necrosis factor‐α confers cardioprotection through ectopic expression of keratins K8 and K18. Nat Med. 2015;21:1076–1084. DOI: 10.1038/nm.3925. [DOI] [PMC free article] [PubMed] [Google Scholar]
- 52. Guo X, Yin H, Li L, Chen Y, Li J, Doan J, Steinmetz R, Liu Q. Cardioprotective role of tumor necrosis factor receptor‐associated factor 2 by suppressing apoptosis and necroptosis. Circulation. 2017;136:729–742. DOI: 10.1161/CIRCULATIONAHA.116.026240. [DOI] [PMC free article] [PubMed] [Google Scholar]
- 53. Boengler K, Hilfiker‐Kleiner D, Drexler H, Heusch G, Schulz R. The myocardial JAK/STAT pathway: from protection to failure. Pharmacol Ther. 2008;120:172–185. DOI: 10.1016/j.pharmthera.2008.08.002. [DOI] [PubMed] [Google Scholar]
- 54. Wagner MA, Siddiqui MAQ. The JAK‐STAT pathway in hypertrophic stress signaling and genomic stress response. JAKSTAT. 2012;1:131–141. DOI: 10.4161/jkst.20702. [DOI] [PMC free article] [PubMed] [Google Scholar]
- 55. Huffman LC, Koch SE, Butler KL. Coronary effluent from a preconditioned heart activates the JAK‐STAT pathway and induces cardioprotection in a donor heart. Am J Physiol Heart Circ Physiol. 2008;294:H257–H262. DOI: 10.1152/ajpheart.00769.2007. [DOI] [PubMed] [Google Scholar]
- 56. Magaye RR, Sevira F, Yue H, Xiong X, Huang L, Reid C, Flynn B, Kaye D, Liew D, Wang BH. Exogenous dihydrosphingosine 1 phosphate mediates collagen synthesis in cardiac fibroblasts through JAK/STAT signalling and regulation of TIMP1. Cell Signal. 2020;72:109629. DOI: 10.1016/j.cellsig.2020.109629. [DOI] [PubMed] [Google Scholar]
- 57. Egerstedt A, Berntsson J, Smith ML, Gidlöf O, Nilsson R, Benson M, Wells QS, Celik S, Lejonberg C, Farrell L, et al. Profiling of the plasma proteome across different stages of human heart failure. Nat Commun. 2019;10:5830. DOI: 10.1038/s41467-019-13306-y. [DOI] [PMC free article] [PubMed] [Google Scholar]
- 58. Uhlen M, Fagerberg L, Hallstrom BM, Lindskog C, Oksvold P, Mardinoglu A, Sivertsson A, Kampf C, Sjostedt E, Asplund A, et al. Proteomics. Tissue‐based map of the human proteome. Science. 2015;347:1260419. DOI: 10.1126/science.1260419. [DOI] [PubMed] [Google Scholar]
- 59. Iorio A, Pozzi A, Senni M. Addressing the heterogeneity of heart failure in future randomized trials. Curr Heart Fail Rep. 2017;14:197–202. DOI: 10.1007/s11897-017-0332-1. [DOI] [PubMed] [Google Scholar]
- 60. Houweling AC, van Borren MM, Moorman AFM, Christoffels VM. Expression and regulation of the atrial natriuretic factor encoding gene Nppa during development and disease. Cardiovasc Res. 2005;67:583–593. DOI: 10.1016/j.cardiores.2005.06.013. [DOI] [PubMed] [Google Scholar]
- 61. Askevold ET, Gullestad L, Nymo S, Kjekshus J, Yndestad A, Latini R, Cleland JGF, McMurray JJV, Aukrust P, Ueland T. Secreted frizzled related protein 3 in chronic heart failure: analysis from the controlled rosuvastatin multinational trial in heart failure (CORONA). PLoS One. 2015;10:e0133970. DOI: 10.1371/journal.pone.0133970. [DOI] [PMC free article] [PubMed] [Google Scholar]
- 62. Schutt RC, Burdick MD, Strieter RM, Mehrad B, Keeley EC. Plasma CXCL12 levels as a predictor of future stroke. Stroke. 2012;43:3382–3386. DOI: 10.1161/STROKEAHA.112.660878. [DOI] [PMC free article] [PubMed] [Google Scholar]
- 63. Döring Y, Pawig L, Weber C, Noels H. The CXCL12/CXCR4 chemokine ligand/receptor axis in cardiovascular disease. Front Physiol. 2014;5:212. DOI: 10.3389/fphys.2014.00212. [DOI] [PMC free article] [PubMed] [Google Scholar]
- 64. Blanton RM, Cooper C, Hergruetter A, Aronovitz M, Calamaras TD. Abstract 154: CCDC80 functions as a protein kinase GI substrate and is secreted by cardiac myocytes. Circ Res. 2017;121:A154. [Google Scholar]
- 65. Iaccarino D, Fedrigo M, Castellani C, Della Noce I, Carra S, Cotelli F, Thiene G, Angelini A, Schepis F. P316 expression and functional role of Ccdc80 in developing heart and in cardiomyopathies. Cardiovasc Res. 2014;103:S57–S58. DOI: 10.1093/cvr/cvu091.4. [DOI] [Google Scholar]
- 66. Liao Y, Smyth GK, Shi W. The R package Rsubread is easier, faster, cheaper and better for alignment and quantification of RNA sequencing reads. Nucleic Acids Res. 2019;47:e47. DOI: 10.1093/nar/gkz114. [DOI] [PMC free article] [PubMed] [Google Scholar]
- 67. Sing T, Sander O, Beerenwinkel N, Lengauer T. ROCR: visualizing classifier performance in R. Bioinformatics. 2005;21:3940–3941. DOI: 10.1093/bioinformatics/bti623. [DOI] [PubMed] [Google Scholar]
Associated Data
This section collects any data citations, data availability statements, or supplementary materials included in this article.
Supplementary Materials
Table S1
Table S2
Table S3
Table S4