

Abstract
Background
Metabolic dyslipidemia (high triglyceride) and low high‐density lipoprotein cholesterol (HDL‐C) is highly prevalent in type 2 diabetes mellitus (T2DM). The extent to which diabetes mellitus–related abnormalities in the triglyceride–HDL‐C profile associates with cardiovascular disease (CVD) risk is incompletely understood. We evaluated the associations of triglyceride and HDL‐C status with CVD outcomes in individuals with T2DM.
Methods and Results
We analyzed data from 4199 overweight/obese adults with T2DM free of CVD with available data on triglyceride and HDL‐C at baseline (2001–2004) in the Look AHEAD (Action for Health in Diabetes) study. We used Cox proportional models to estimate hazard ratios (HRs) and 95% CIs of: (1) composite CVD outcome (myocardial infarction, stroke, hospitalization for angina, and/or death from cardiovascular causes); (2) coronary artery disease events; and (3) cerebrovascular accidents (stroke). Of the 4199 participants, 62% (n=2600) were women, with a mean age of 58 years (SD, 7), and 40% (n=1659) had metabolic dyslipidemia at baseline. Over a median follow‐up of 9.5 years (interquartile range, 8.7–10.3), 500 participants experienced the composite CVD outcome, 396 experienced coronary artery disease events, and 100 experienced stroke. Low HDL‐C was associated with higher hazards of the composite CVD outcome (HR, 1.36; 95% CI, 1.12–1.64 [P=0.002]) and coronary artery disease events (HR, 1.46; 95% CI, 1.18–1.81 [P=0.001]) but not stroke (HR, 1.38; 95% CI, 0.90–2.11 [P=0.140]). Compared with patients with normal triglyceride and normal HDL, participants with metabolic dyslipidemia had higher risks of the composite CVD outcome (HR, 1.30; 95% CI, 1.03–1.63 [P=0.025]) and coronary artery disease events (HR, 1.48; 95% CI, 1.14–1.93 [P=0.003]) but not stroke (HR, 1.23; 95% CI, 0.74–2.05 [P=0.420]).
Conclusions
In a large sample of overweight/obese individuals with T2DM, metabolic dyslipidemia was associated with higher risks of CVD outcomes. Our findings highlight the necessity to account for metabolic dyslipidemia in CVD risk stratification among patients with T2DM.
Registration
URL: https://www.lookaheadtrial.org; Unique identifier: NCT00017953.
Keywords: cardiovascular disease, diabetes mellitus, type 2, metabolic dyslipidemia
Subject Categories: Cardiovascular Disease, Epidemiology
Nonstandard Abbreviations and Acronyms
- ATP III
National Cholesterol Education Program Adult Treatment Panel III
- CADns
coronary artery disease defined by less stringent criteria
- CADs
coronary artery disease defined by stringent criteria
- DM
diabetes mellitus
- Look AHEAD
Action for Health in Diabetes
- REDUCE‐IT
Reduction of Cardiovascular Events With Icosapent Ethyl–Intervention Trial
- strokes
stroke defined by stringent criteria
- strokens
stroke defined by a less stringent criteria
- T2DM
type 2 diabetes mellitus
- VITAL
Vitamin D and Omega‐3 Trial
Clinical Perspective
What Is New?
Whether improvements in the triglyceride–high‐density lipoprotein cholesterol phenotype among individuals with type 2 diabetes mellitus augments cardiovascular disease risk reduction beyond low‐density lipoprotein cholesterol is still a matter of debate.
Metabolic dyslipidemia was highly prevalent (40%) among individuals with type 2 diabetes mellitus.
Low high‐density lipoprotein cholesterol and metabolic dyslipidemia were each associated with increased risks of coronary artery disease events, as well as a composite end point of cardiovascular death, myocardial infarction, stroke, and hospitalization for angina, independently of other cardiovascular disease risk factors.
What Are the Clinical Implications?
Our findings highlight the necessity to account for metabolic dyslipidemia in cardiovascular disease risk stratification among people with type 2 diabetes mellitus.
Cardiovascular disease (CVD) remains the leading cause of mortality in the United States. 1 The high CVD burden is partly related to the elevated prevalence of risk factors including obesity and type 2 diabetes mellitus (T2DM). 1 , 2 Compared with people without T2DM, individuals with T2DM are disproportionately affected by CVD, and the risk is even greater in those who are overweight or obese. 1 , 2 Although low‐density lipoprotein cholesterol (LDL‐C) reduction via the use of statins has reduced the risk of atherosclerotic CVD events, the residual CVD risk remains elevated in patients with T2DM. 3 , 4 Indeed, T2DM is associated with abnormal lipid profiles including elevated triglyceride and/or low high‐density lipoprotein cholesterol (HDL‐C), a feature that has been referred to as metabolic dyslipidemia. 5 , 6 Whether improvements in the triglyceride–HDL‐C phenotype augments CVD risk reduction beyond LDL‐C is still a matter of debate. 7 , 8 , 9 Moreover, data on the relationship of metabolic dyslipidemia with incident CVD in overweight or obese individuals with T2DM is scarce. 10 , 11 , 12
We conducted an analysis of the Look AHEAD (Action of Health in Diabetes) study to evaluate the associations of HDL‐C and triglyceride status with incident CVD outcomes (a composite of nonfatal myocardial infarction [MI], nonfatal stroke, hospitalization for angina, and death from cardiovascular causes) in a large sample of overweight/obese individuals with T2DM. We hypothesized that the incidence of CVD outcomes will be higher among individuals with low levels of HDL‐C and/or high levels of triglyceride.
METHODS
Study Design
The data used for the analyses are publicly available through the National Heart, Lung, and Blood Institute's Biologic Specimen and Data Repository Information Coordination Center (BioLINCC). We conducted a post hoc cohort analysis of data from Look AHEAD, a multicenter randomized, double‐blind clinical trial designed to evaluate the effects of intensive lifestyle interventions (achieved through healthy eating and increased physical activity) compared with the then "standard‐of‐care" diabetes mellitus (DM) management on CVD outcomes. The details about the design and methods of the Look AHEAD study have been published elsewhere. 13 , 14 Briefly, the Look AHEAD study enrolled 5145 participants from August 2001 to April 2004 among 16 clinical centers in the United States who were randomly assigned to participate in an intensive lifestyle intervention (intervention group) or to receive DM support and education (control group). 15 The participants met the following criteria: age 45 to 76 years; self‐reported diagnosis of T2DM verified by measured glucose levels, use of antidiabetic medication, or physician's report; body mass index (BMI) of ≥25 kg/m2 (or ≥27 kg/m2 in patients taking insulin); glycated hemoglobin (HbA1C) ≤11%; systolic blood pressure (BP) <160 mm Hg; diastolic BP of <100 mm Hg; triglyceride levels of <600 mg/dL; the ability to complete a valid maximal exercise test, indicating that it was safe to exercise; and an established relationship with a primary provider. 13 , 14 , 15 For the current investigation, we excluded participants with consent restrictions (n=244), prevalent CVD at baseline (n=691), and missing data on triglyceride and/or HDL‐C levels (n=11). After these exclusions, 4199 participants were included in our analyses. Figure S1 summarizes the exclusion process. Each participant provided informed consent, and the study protocol was approved by the institutional review board at each participating center.
Measurement of Lipid Fractions
At baseline, each participant provided venous blood samples after at least 8 hours of fasting. Blood samples were stored at less than −20ºC and shipped to the look AHEAD Central Biochemistry Laboratory (Northwest Lipid Metabolism and Diabetes Research Laboratories, University of Washington, Seattle, WA), where biological analyses were performed. Plasma total cholesterol and triglyceride were measured enzymatically using methods standardized to the Centers for Disease Control and Prevention reference methods. 14 , 16 HDL‐C was assayed by the treatment of whole plasma with dextran sulfate‐Mg2+ to precipitate all of the apolipoprotein B–containing lipoproteins. 17 The Friedewald equation was used to calculate LDL‐C concentrations. 18
Ascertainment of Cardiovascular Events
The participants were followed for the occurrence of CVD events from the baseline assessment through annual visits and semiannual telephone calls. Staff members queried participants about all medical events and hospitalizations. These queries were enhanced with searches of national databases for deaths. The CVD events were classified by an events adjudication committee that reviewed all relevant medical records and death certificates to confirm CVD events. 13 , 14 , 15
A composite CVD outcome was defined as the first occurrence of nonfatal MI, nonfatal stroke, hospitalization for angina, and death from cardiovascular causes. The other outcomes included coronary artery disease (CAD) and stroke. CAD was defined using 2 alternative definitions: (1) a stringent CAD definition (CADs): first occurrence of MI and/or coronary artery bypass grafting; and (2) a less stringent CAD definition (CADns): first occurrence of MI, coronary artery bypass grafting, and/or hospitalization for angina. Similarly, stroke was defined using 2 definitions: (1) a stringent definition: a composite of ischemic and/or hemorrhagic stroke (strokes); and (2) a less stringent stroke definition (strokens) including a composite of ischemic and/or hemorrhagic stroke as well as carotid endarterectomy.
Assessment of Covariates
At the baseline examination, data on covariates including age, sex, race/ethnicity, duration of DM, history of CVD, medication use, current smoking, and alcohol use were obtained from each participant using standardized questionnaires. 13 , 14 , 15 Anthropometric and BP measures were obtained by certified clinic staff using standard methods. 13 , 14 , 15 Weight and height were measured twice using a digital scale and a standard stadiometer, respectively; and the average of those duplicate measurements were used for the analyses. BMI was computed as weight in kilograms divided by square of height in meters. Waist circumference was measured with participants in light clothing using a nonmetallic, constant tension tape placed around the body at midlevel between the highest point of the iliac crest and the lowest point of the costal margin on the midaxillary line. BP was measured in duplicates with participants seated, and the average of the 2 readings was used in the analyses. Blood assays were performed at the Look AHEAD Central Biochemistry Laboratory. HbA1C was measured by a dedicated ion exchange high‐performance liquid chromatography instrument (Biorad Variant II). Fasting plasma glucose was measured using the glucokinase. 13 , 14 , 15
Statistical Analysis
We created categories of triglyceride and HDL‐C levels into normal triglyceride (triglyceride <150 mg/dL), high triglyceride (triglyceride ≥150 mg/dL), normal HDL‐C (HDL‐C ≥40 mg/dL for men and ≥50 mg/dL for women), and low HDL‐C (HDL‐C <40 mg/dL for men and <50 mg/dL for women) based on the 2013 American College of Cardiology/American Heart Association guidelines. 19 Using these cutoff points, we created a triglyceride‐HDL status variable with the following 4 categories: (1) normal triglyceride, normal HDL (defined as having normal triglyceride and normal HDL‐C levels); (2) high triglyceride, normal HDL (defined as having high triglyceride and normal HDL‐C levels); (3) normal triglyceride, low HDL (defined as having normal triglyceride and low HDL‐C levels); and (4) high triglyceride, low HDL (defined as having high triglyceride and low HDL‐C levels). The high triglyceride, low HDL group represents the metabolic dyslipidemia category. We compared the baseline characteristics of participants across triglyceride‐HDL status using ANOVA or Kruskal‐Wallis test (depending on the distribution of the relevant continuous variable), or the χ2 test, as appropriate.
The time‐to‐event distributions for CVD outcomes were assessed using the Kaplan‐Meier curve and compared by triglyceride‐HDL status using the log‐rank test. Incidence rates per 100 patient‐years were calculated by dividing the cumulative number of events by all at‐risk patient‐years during follow‐up. The patient‐years were estimated from the baseline assessment to the date of first incident CVD outcome, date of death, or September 14, 2012 (the trial's termination date), whichever occurred first. The 95% CIs for the crude incidence rates were estimated using the quadratic approximation to the Poisson log likelihood for the log‐rate parameter.
We used Cox proportional hazards models to generate hazard ratios (HRs) relating triglyceride, HDL‐C, and triglyceride‐HDL status to the outcomes. Regression models were adjusted for age, sex, race/ethnicity, randomization arm, BMI, current smoking (yes/no), alcohol drinking (ounces per week), systolic BP, use of antihypertensive medications (yes/no), LDL‐C, HbA1C, and duration of DM. We tested whether sex, race/ethnicity, and randomization arm modified the relationship between triglyceride‐HDL status and the outcomes by adding separate interaction terms to the model.
To assess the predictive ability of triglyceride‐HDL status above and beyond LDL‐C, we performed stratified analyses by baseline LDL‐C levels. Moreover, where triglyceride‐HDL status was positively associated with outcomes, we used Harrell C statistics and likelihood ratio tests to compare the base model (including age, sex, race/ethnicity, randomization arm, BMI, current smoking, alcohol drinking, systolic BP, use of antihypertensive medications, LDL‐C, HbA1C, and duration of DM) and the base model plus triglyceride‐HDL status. The C statistic and its 95% CI were derived using the bootstrapping method. 20
A 2‐sided P value of <0.05 was considered statistically significant for all analyses. All analyses were performed using STATA 14.2 (StataCorp LLC) and R version 4.0.0 (The R Foundation).
RESULTS
Baseline Characteristics by Triglyceride and HDL‐C Status
Table 1 displays the baseline characteristics of participants. The study sample consisted of 4199 participants (mean age, 58.4 years [SD, 6.6 years]; 61.9% women). Approximately 26.4% of participants had normal triglyceride and normal HDL (n=1110), 11.6% had high triglyceride and normal HDL (n=486), and 22.5% had normal triglyceride and low HDL (n=944), whereas 39.5% had high triglyceride and low HDL (metabolic dyslipidemia, n=1659). Participants with metabolic dyslipidemia were more frequently current smokers and White, and also had higher waist circumference and HbA1C levels (Table 1).
Table 1.
Characteristics of Participants Without CVD at Baseline by Triglyceride and HDL‐C Status in the Look AHEAD Study
| Whole Sample | Triglyceride and HDL‐C Status | |||||
|---|---|---|---|---|---|---|
| Normal Triglyceride, Normal HDL‐C | High Triglyceride, Normal HDL‐C | Normal Triglyceride, Low HDL‐C | High Triglyceride, Low HDL‐C | P Value | ||
| Sample size, n (%) | 4199 (100) | 1110 (26.4) | 486 (11.6) | 944 (22.5) | 1659 (39.5) | … |
| Treatment assignment, n (%) | 0.692 | |||||
| DM support and education | 2111 (50.3) | 557 (50.2) | 233 (47.9) | 484 (51.3) | 837 (50.5) | |
| Intensive lifestyle intervention | 2088 (49.7) | 553 (49.8) | 253 (52.1) | 460 (48.7) | 822 (49.6) | |
| Age, y | 58.4 (6.6) | 59.1 (6.4) | 59.0 (6.4) | 57.8 (7.0) | 58.0 (6.6) | <0.001 |
| Women, n (%) | 2600 (61.9) | 674 (60.7) | 284 (58.4) | 652 (69.1) | 990 (59.7) | <0.001 |
| Race/ethnicity, n (%) | <0.001 | |||||
| White | 2726 (64.9) | 630 (56.8) | 346 (71.2) | 527 (55.8) | 1223 (73.7) | |
| Black (not Hispanic) | 719 (17.1) | 331 (29.8) | 48 (9.9) | 225 (23.8) | 115 (6.9) | |
| Hispanic | 610 (14.5) | 101 (9.1) | 73 (15.0) | 157 (16.6) | 279 (16.8) | |
| Other/mixed | 144 (3.4) | 48 (4.3) | 19 (3.9) | 35 (3.7) | 42 (2.5) | |
| BMI, kg/m2 | 36.0 (5.9) | 35.7 (6.0) | 35.8 (6.0) | 36.4 (6.2) | 36.1 (5.7) | 0.026 |
| Waist circumference, cm | 113.6 (14.1) | 111.8 (13.8) | 113.3 (14.7) | 113.9 (14.0) | 114.8 (14.0) | <0.001 |
| Current smoking, n (%) | 170 (4.1) | 38 (3.4) | 13 (2.7) | 36 (3.8) | 83 (5.0) | 0.058 |
| Alcohol drinking, oz/wk | 0.0 (0.0–5.0) | 0.0 (0.0–7.5) | 0.0 (0.0–6.5) | 0.0 (0.0–5.0) | 0.0 (0.0–5.0) | 0.016 |
| Systolic BP, mm Hg | 129.1 (16.9) | 129.3 (17.6) | 129.8 (16.7) | 128.2 (17.3) | 129.3 (16.2) | 0.269 |
| Diastolic BP, mm Hg | 70.5 (9.5) | 70.4 (9.3) | 70.5 (9.8) | 70.0 (9.6) | 70.7 (9.4) | 0.279 |
| Use of antihypertensive medication, n (%) | 2987 (71.1) | 789 (71.1) | 353 (72.6) | 666 (70.6) | 1179 (71.1) | 0.875 |
| HbA1C, % | 7.2 (1.2) | 7.1 (1.1) | 7.2 (1.2) | 7.1 (1.1) | 7.4 (1.2) | <0.001 |
| Duration of diabetes mellitus, years | 5.0 (2.0–9.0) | 5.0 (2.0–10.0) | 5.0 (2.0–8.0 | 5.0 (2.0–10.0) | 5.0 (2.0–8.0) | 0.232 |
| Use of insulin, n (%) | 716 (17.1) | 226 (20.4) | 60 (12.4) | 162 (17.2) | 268 (16.2) | 0.001 |
| Triglyceride, mg/dL | 152.0 (107.0–219.0) | 96.0 (75.0–121.0) | 190.0 (169.0–235.0) | 114.0 (94.0–131.0) | 226.0 (183.0–303.0) | <0.001 |
| HDL‐C, mg/dL | 42.0 (36.0–50.0) | 54.0 (49.0–61.0) | 51.0 (44.0–57.0 | 39.0 (35.0–45.0) | 36.0 (31.0–41.0) | <0.001 |
| LDL‐C, mg/dL | 112.0 (92.0–134.0) | 113.0 (93.0–134.0) | 115.0 (94.0–138.0) | 112.0 (93.0–134.0) | 110.0 (89.0–132.0) | 0.012 |
Data are expressed as mean (SD), median (interquartile range), or number (proportion) as appropriate. BMI indicates body mass index; BP, blood pressure; CVD, cardiovascular disease; DM, diabetes mellitus; HbA1c, glycated hemoglobin; HDL‐C, high‐density lipoprotein cholesterol; LDL‐C, low‐density lipoprotein cholesterol; and Look AHEAD, Action for Health in Diabetes.
Rates of Cardiovascular Outcomes by Triglyceride and HDL‐C Status
During a median follow‐up of 9.5 (IQR, 8.7–10.3) years, 500 participants (260 men, 240 women) experienced the composite CVD outcome (incidence rate, 1.36 [95% CI, 1.24–1.48] over 36 879 patient‐years); 396 developed CADs (229 men, 167 women); 423 had CADns (237 men, 186 women); 100 experienced strokes (38 men, 62 women); and 118 had the composite of stroke and carotid endarterectomy. The incidence rates for the various CVD outcomes by triglyceride, HDL‐C, and HDL‐triglyceride status are presented in Table 2. In unadjusted comparisons, participants with metabolic dyslipidemia had higher cumulative hazards of developing CVD events as compared with those with normal triglyceride and normal HDL‐C (Figure 1, P value–log rank=0.079).
Table 2.
Incidence of Cardiovascular Outcomes by Triglyceride and HDL‐C Status in the Look AHEAD Study
| Composite CVD Outcome* | CADs † | CADns ‡ | Strokes § | Strokens ‖ | |||||||||||
|---|---|---|---|---|---|---|---|---|---|---|---|---|---|---|---|
| No. Events/No. at Risk | Patient‐y |
IR (95% CI) Per 100 Patient‐y |
No. Events/No. at Risk | Patient‐y |
IR (95% CI) Per 100 Patient‐y |
No. Events/No. at Risk | Patient‐y |
IR (95% CI) Per 100 Patient‐y |
No. Events/No. at Risk | Patient‐y |
IR (95% CI) Per 100 Patient‐y |
No. Events/No. at Risk | Patient‐y |
IR (95% CI) Per 100 Patient‐y |
|
| Whole sample | 500/4199 | 36 879 | 1.36 (1.24–1.48) | 396/4199 | 37 127 | 1.07 (0.97–1.18) | 423/4199 | 37 006 | 1.14 (1.04–1.26) | 100/4199 | 38 501 | 0.26 (0.21–0.32) | 118/4199 | 38 401 | 0.31 (0.26–0.37) |
| Triglyceride | |||||||||||||||
| Normal triglyceride | 233/2054 | 18 024 | 1.29 (1.14–1.47) | 174/2054 | 18 161 | 0.96 (0.83–1.11) | 188/2054 | 18 102 | 1.04 (0.90–1.20) | 50/2054 | 18 779 | 0.27 (0.20–0.35) | 62/2054 | 18 709 | 0.33 (0.26–0.43) |
| High triglyceride | 267/2145 | 18 855 | 1.42 (1.26–1.60) | 222/2145 | 18 966 | 1.17 (1.03–1.34) | 235/2145 | 18 904 | 1.24 (1.09–1.41) | 50/2145 | 19 722 | 0.25 (0.19–0.33) | 56/2145 | 19 692 | 0.28 (0.22–0.37) |
| HDL‐C | |||||||||||||||
| Normal HDL‐C | 163/1596 | 13 945 | 1.17 (1.00–1.36) | 124/1596 | 14 041 | 0.88 (0.74–1.05) | 138/1596 | 13 986 | 0.99 (0.84–1.17) | 32/1596 | 14 494 | 0.22 (0.16–0.31) | 40/1596 | 14 442 | 0.28 (0.20–0.38) |
| Low HDL‐C | 337/2603 | 22 934 | 1.47 (1.32–1.64) | 272/2603 | 23 086 | 1.18 (1.05–1.33) | 285/2603 | 23 020 | 1.24 (1.10–1.39) | 68/2603 | 24 007 | 0.28 (0.22–0.36) | 78/2603 | 23 959 | 0.33 (0.26–0.41) |
| Triglyceride‐HDL status | |||||||||||||||
| Normal triglyceride, normal HDL | 117/1110 | 9691 | 1.21 (1.01–1.45) | 84/1110 | 9763 | 0.86 (0.69–1.07) | 96/1110 | 9717 | 0.99 (0.81–1.21) | 24/1110 | 10 063 | 0.24 (0.16–0.36) | 31/1110 | 10 013 | 0.31 (0.22–0.44) |
| High triglyceride, normal HDL | 46/486 | 4254 | 1.08 (0.81–1.44) | 40/486 | 4278 | 0.93 (0.69–1.27) | 42/486 | 4269 | 0.98 (0.73–1.33) | 8/486 | 4431 | 0.18 (0.09–0.36) | 9/486 | 4430 | 0.20 (0.11–0.39) |
| Normal triglyceride, low HDL | 116/944 | 8333 | 1.39 (1.16–1.67) | 90/944 | 8398 | 1.07 (0.87–1.32) | 92/944 | 8385 | 1.10 (0.89–1.35) | 26/944 | 8716 | 0.30 (0.20–0.44) | 31/944 | 8696 | 0.36 (0.25–0.51) |
| High triglyceride, low HDL | 221/1659 | 14 601 | 1.51 (1.33–1.73) | 182/1659 | 14 688 | 1.24 (1.07–1.43) | 193/1659 | 14 635 | 1.32 (1.15–1.52) | 42/1659 | 15 291 | 0.27 (0.20–0.37) | 47/1659 | 15 262 | 0.31 (0.23–0.41) |
CAD indicates coronary artery disease; HDL‐C, high‐density lipoprotein cholesterol; IR, incidence rate; and Look AHEAD, Action for Health in Diabetes.
The composite cardiovascular disease (CVD) outcome was a composite of death from cardiovascular causes, nonfatal myocardial infarction (MI), nonfatal stroke, and hospitalization for angina.
CADs was the first occurrence of a composite of MI and coronary artery bypass grafting.
CADns was the first occurrence of a composite of MI, coronary artery bypass grafting, and hospitalization for angina.
Strokes was the first occurrence of a composite of ischemic and/or hemorrhagic stroke.
Strokens was the first occurrence of a composite of ischemic and/or hemorrhagic stroke as well as carotid endarterectomy.
Figure 1. Cumulative proportion of participants with cardiovascular disease (CVD) events by triglyceride and high‐density lipoprotein (HDL) cholesterol status in the Look AHEAD (Action for Health in Diabetes) study.
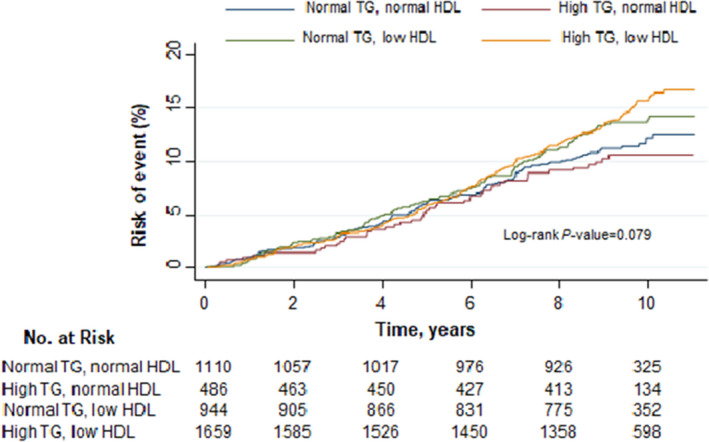
CVD event is a composite of nonfatal myocardial infarction, nonfatal stroke, hospitalization for angina, and death from cardiovascular causes.
Risk of Cardiovascular Outcomes by Triglyceride and HDL‐C Status
Table 3 shows the HRs for each CVD outcome by triglyceride and HDL‐C status. After multivariable adjustment, low HDL‐C levels were associated with higher rates of CVD outcomes, except stroke. Compared with participants with normal HDL‐C, those with low HDL‐C had higher hazards of the composite CVD outcome (HR, 1.36; 95% CI, 1.12–1.64 [P=0.002]), CADs (HR, 1.46; 95% CI, 1.18–1.81 [P=0.001]), and CADns (HR, 1.36; 95% CI, 1.11–1.67 [P=0.002]). HDL‐C was not associated with strokes (HR for low versus normal HDL‐C, 1.38; 95% CI, 0.90–2.11 [P=0.140]) or strokens (HR for low versus normal HDL‐C, 1.28; 95% CI, 0.87–1.88 [P=0.215]). High triglyceride was not associated with CVD outcomes. The adjusted HRs for the high triglyceride versus normal triglyceride comparison were 1.06 (95% CI, 0.88–1.27; P=0.538), 1.16 (95% CI, 0.95–1.42; P=0.152), 1.14 (95% CI, 0.93–1.38; P=0.203), 0.97 (95% CI, 0.65–1.45; P=0.888), and 0.87 (95% CI, 0.60–1.25; P=0.452) for the composite CVD outcome, CADs, CADns, strokes, and strokens, respectively.
Table 3.
HRs of Cardiovascular Outcomes by Triglyceride and HDL‐C Status in the Look AHEAD Study
| Composite CVD Outcome* | CADs † | CADns ‡ | Strokes § | Strokens ‖ | ||||||
|---|---|---|---|---|---|---|---|---|---|---|
| HR (95% CI) | P Value | HR (95% CI) | P Value | HR (95% CI) | P Value | HR (95% CI) | P Value | HR (95% CI) | P Value | |
| HDL‐C | ||||||||||
| Normal HDL‐C | Reference | Reference | Reference | Reference | Reference | |||||
| Low HDL‐C | 1.36 (1.12–1.64) | 0.002 | 1.46 (1.18–1.81) | 0.001 | 1.36 (1.11–1.67) | 0.003 | 1.38 (0.90–2.11) | 0.140 | 1.28 (0.87–1.88) | 0.215 |
| Triglyceride | ||||||||||
| Normal triglyceride | Reference | Reference | Reference | Reference | Reference | |||||
| High triglyceride | 1.06 (0.88–1.27) | 0.538 | 1.16 (0.95–1.42) | 0.152 | 1.14 (0.93–1.38) | 0.203 | 0.97 (0.65–1.45) | 0.888 | 0.87 (0.60–1.25) | 0.452 |
| Triglyceride‐HDL status | ||||||||||
| Normal triglyceride‐HDL | Reference | Reference | Reference | Reference | Reference | |||||
| High triglyceride, normal HDL | 0.85 (0.60–1.20) | 0.359 | 1.00 (0.68–1.46) | 0.986 | 0.92 (0.64–1.32) | 0.634 | 0.74 (0.33–1.66) | 0.472 | 0.64 (0.31–1.36) | 0.247 |
| Normal triglyceride, low HDL | 1.28 (0.99–1.67) | 0.060 | 1.41 (1.04–1.91) | 0.026 | 1.24 (0.93–1.66) | 0.145 | 1.33 (0.76–2.34) | 0.321 | 1.25 (0.76–2.07) | 0.383 |
| High triglyceride, low HDL | 1.30 (1.03–1.63) | 0.025 | 1.48 (1.14–1.93) | 0.003 | 1.37 (1.06–1.75) | 0.014 | 1.23 (0.74–2.05) | 0.420 | 1.07 (0.67–1.69) | 0.779 |
Hazard ratios (HRs) were obtained from Cox proportional hazard models with adjustment for age, sex, race/ethnicity, randomization arm, body mass index, current smoking (yes/no), alcohol drinking (ounces per week), systolic blood pressure, use of antihypertensive medications (yes/no), low‐density lipoprotein cholesterol, glycated hemoglobin, duration of diabetes mellitus. CAD indicates coronary artery disease; HDL‐C, high‐density lipoprotein cholesterol; and Look AHEAD, Action for Health in Diabetes.
The composite cardiovascular disease (CVD) outcome was a composite of death from cardiovascular causes, nonfatal myocardial infarction (MI), nonfatal stroke, and hospitalization for angina.
CAD outcome 1 was the first occurrence of a composite of myocardial infarction (MI) and coronary artery bypass grafting.
CAD outcome 2 was the first occurrence of a composite of MI, coronary artery bypass grafting, and hospitalization for angina.
Strokes was the first occurrence a composite of ischemic and/or hemorrhagic stroke.
Strokens the first occurrence of a composite of ischemic and/or hemorrhagic stroke as well as carotid endarterectomy.
With respect to the triglyceride‐HDL status, compared with participants with normal triglyceride, normal HDL, participants with metabolic dyslipidemia had higher risks of the composite CVD outcome (HR, 1.30; 95% CI, 1.03–1.63 [P=0.025]), CADs (HR, 1.48; 95% CI, 1.14–1.93 [P=0.003]), and CADns (HR, 1.37; 95% CI, 1.06–1.75 [P=0.014]) but not strokes (HR, 1.23; 95% CI, 0.74–2.05 [P=0.420]) or strokens (HR, 1.07; 95% CI, 0.67–1.69 [P=0.779]).
Predictive Ability of Triglyceride‐HDL Status
We performed stratified analyses by baseline LDL‐C levels. The HRs (comparing patients with metabolic dyslipidemia versus those with normal triglyceride, normal HDL) for CVD composite and CAD were the greatest among participants with LDL‐C <100 mg/dL followed by those with LDL‐C between 100 and 130 mg/dL (Figure 2 and Figure S2; Table S1). Additionally, we tested the performance of triglyceride‐HDL status for predicting CVD composite and CAD outcomes. The C statistics for the base model (age, sex, race/ethnicity, randomization arm, BMI, smoking, alcohol drinking, systolic BP, use of antihypertensive medications, LDL‐C, HbA1C, and duration of DM) were 0.669 (95% CI, 0.654–0.693), 0.687 (95% CI, 0.67.1–71.3), and 0.674 (95% CI, 658–0.700) for CVD composite, CADs, and CADns, respectively. After adding triglyceride‐HDL status to the base model, the AUC statistics were 0.673 (95% CI, 0.660–0.700), 0.693 (95% CI, 0.680–0.720), and 0.678 (95% CI, 0.663–0.705) for CVD composite, CADs, and CADns, respectively (Table 4). The results of the likelihood ratio tests comparing these models are shown in Table 4.
Figure 2. Hazard ratios (HRs) of cardiovascular outcomes by triglyceride–high‐density lipoprotein (HDL) cholesterol status and low‐density lipoprotein (LDL) cholesterol categories in the Look AHEAD (Action for Health in Diabetes) study.

Composite cardiovascular disease (CVD) outcome was a composite of death from cardiovascular causes, nonfatal myocardial infarction (MI), nonfatal stroke, and hospitalization for angina. Coronary artery disease (CAD) outcome was the first occurrence of a composite of MI and coronary artery bypass grafting. Stroke outcome was the first occurrence of a composite of ischemic and/or hemorrhagic stroke. NA indicates not available. HRs were obtained from Cox proportional hazard models with adjustment for age, sex, race/ethnicity, randomization arm, body mass index, current smoking (yes/no), alcohol drinking (ounces per week), systolic blood pressure, use of antihypertensive medications (yes/no), glycated hemoglobin, and duration of diabetes mellitus.
Table 4.
Comparisons of Models With and Without Triglyceride–HDL‐C Status
| Model* | Composite CVD † | CADs ‡ | CADns § | ||||||
|---|---|---|---|---|---|---|---|---|---|
| C Statistic | LR Test | C Statistic | LR Test | C Statistic | LR Test | ||||
| C Statistic (95% CI) | P Value | P Value | C Statistic (95% CI) | P Value | P Value | C Statistic (95% CI) | P Value | P Value | |
| Without HDL‐C–triglyceride | 0.669 (0.654–0.693) | 0.028 | 0.011 | 0.687 (0.671–0.713) | 0.009 | 0.006 | 0.674 (0.658–0.700) | 0.056 | 0.022 |
| With HDL‐C–triglyceride | 0.673 (0.660–0.700) | 0.693 (0.679–0.720) | 0.678 (66.3–70.5) | ||||||
CAD indicates coronary artery disease; HDL‐C, high‐density lipoprotein cholesterol; and LR, likelihood ratio.
Each model adjusted for age, sex, race/ethnicity, randomization arm, body mass index, current smoking, alcohol drinking, systolic blood pressure, use of antihypertensive medications, low‐density lipoprotein cholesterol, glycated hemoglobin, and duration of diabetes mellitus.
Composite cardiovascular disease (CVD) was a composite of death from cardiovascular causes, nonfatal myocardial infarction, nonfatal stroke, and hospitalization for angina.
CADs was the first occurrence of a composite of myocardial infarction and coronary artery bypass grafting.
CADns was the first occurrence of a composite of myocardial infarction, coronary artery bypass grafting, and hospitalization for angina.
Secondary Analysis
We tested the robustness of our results by repeating all of the aforementioned analyses using a sample that included participants with a history of CVD at baseline, with further adjustment for history of prevalent CVD. Figure S3 displays the Kaplan‐Meier curves of the composite CVD outcome by triglyceride‐HDL status (log‐rank test P=0.008). Consistent with our main analyses, low HDL‐C was associated with greater hazards of the composite CVD outcome (HR, 1.26; 95% CI, 1.09–1.47 [P=0.002]), CADs (HR, 1.25; 95% CI, 1.05–1.47 [P=0.010]), and CADns (HR, 1.22; 95% CI, 1.03–1.43 [P=0.018]) but not strokes (HR, 1.08; 95% CI, 0.78–1.50 [P=0.654]). Similarly, participants with metabolic dyslipidemia had higher risks of the composite CVD outcome (HR, 1.30; 95% CI, 1.08–1.57 [P=0.005]), CADs (HR, 1.37; 95% CI, 1.11–1.69 [P=0.004]), and CADns (HR, 1.32; 95% CI, 1.08–1.62 [P=0.007]) but not strokes (HR, 1.00; 95% CI, 0.68–1.49 [P=0.981]) compared with those with normal triglyceride and normal HDL‐C (Table S2).
DISCUSSION
This study evaluated the associations of triglyceride–HDL‐C status with several CVD outcomes in a large sample of overweight/obese individuals with T2DM. We made several observations. First, metabolic dyslipidemia was highly prevalent (40%) among individuals with DM. Second, we observed that low HDL‐C and metabolic dyslipidemia were each associated with increased risks of CAD events, as well as a composite end point of cardiovascular death, MI, stroke, and hospitalization for angina, independently of other CVD risk factors. No significant associations were observed with the risk of stroke. Our finding suggests that the metabolic dyslipidemia phenotype provides a better characterization of CVD risk than isolated triglyceride or HDL‐C abnormalities.
Previous reports have evaluated the association of individual components of metabolic dyslipidemia with CVD outcomes. Our observation of a significant association between low HDL‐C and higher hazards of incident CVD corroborates prior reports. 10 , 21 However, recent evidence has not confirmed that increasing HDL‐C level is protective against incident MI. 22 , 23 With respect to high triglyceride and CVD outcomes, our results are consistent with some prior studies, as overall the evidence on the relationship of high triglyceride with incident CVD has been inconsistent. 24 , 25 Our findings are consistent with those of VITAL (Vitamin D and Omega‐3 Trial), which showed significant beneficial effects of n‐3 fatty acid supplementation in preventing CVD events among individuals with DM, but more so among Black individuals than in non‐Hispanic White individuals. 26 The lack of association between isolated high triglyceride and CVD outcomes in our study is at variance with the recently published REDUCE‐IT (Reduction of Cardiovascular Events With Icosapent Ethyl–Intervention Trial), which found that the triglyceride‐lowering agent icosapent ethyl was associated with a reduction in the rate of CVD events. 7 It is, however, worth noting that REDUCE‐IT is an intervention study with controlled experimental conditions, and its patient population is much more heterogenous, including individuals without DM and with type 1 or 2 DM. 7 Our finding of a positive association between metabolic dyslipidemia and worse CVD outcomes is consistent with the published evidence, which is limited. 10 , 11 , 12 , 27 Metabolic dyslipidemia has been described as a key feature of the metabolic syndrome, as defined by the National Cholesterol Education Program Adult Treatment Panel III (ATP III), and metabolic dyslipidemia frequently precedes the full‐blown development of this syndrome. 28 Indeed, in a large case‐control study, most adults aged ≥35 years with metabolic dyslipidemia met the ATP III criteria for the metabolic syndrome. 29 In a report among patients with angiographically confirmed CAD, metabolic dyslipidemia was associated with higher rates of CVD events, 27 a risk that was significantly greater than that yielded by isolated low HDL‐C or high triglyceride. 27
Prior evidence suggests that the increased CVD risk associated with metabolic dyslipidemia in T2DM is linked to accelerated atherosclerosis. 30 , 31 In people with T2DM, there is increased hepatic production of very LDL and impaired clearance of very LDL and intestinal‐absorbed chylomicrons. 30 , 31 This results in the plasma retention of remnant particles, including cholesterol‐enriched intermediate‐density lipoproteins, which have been shown to be highly atherogenic in human and animal studies. 31 , 32 , 33 The overproduction and decreased clearance of large very LDL also results in low HDL‐C and apolipoprotein A‐I levels, as well as increased production of small dense LDL particles via an exchange mechanism mediated by cholesterol ester transfer protein. 30 , 31 Small LDL particles are highly atherogenic because of their lower LDL receptor affinity, 31 , 34 higher affinity for the subendothelial tissue and arterial wall proteoglycans, 31 , 35 , 36 and a greater susceptibility to oxidative alterations. 31 , 37 T2DM is also associated with dysfunctional HDL, characterized by low levels of HDL2 subtype, small HDL particle size. The HDL dysfunction results in a reduction of its antiatherogenic, antioxidative, and anti‐inflammatory properties resulting in accelerated atherosclerosis in T2DM. 30 , 31 , 38
Our findings have multiple clinical and public health implications for people with T2DM. Atherosclerotic CVDs remain the leading cause of death in patients with DM. 1 , 30 , 31 Our observations confirm the putative utility of metabolic dyslipidemia above and beyond LDL‐C level in CVD risk prediction in individuals with T2DM. 39 Additionally, therapeutic interventions that modulate the triglyceride–HDL‐C phenotype may potentially reduce the rates of adverse CVD outcomes in this high‐risk group.
Our results should be interpreted in the context of some limitations. One limitation is that our sample was composed only of overweight or obese individuals with T2DM; hence, the results may not be generalizable to other hyperglycemic states, including people with type 1 DM. A second limitation is that the number of stroke events was relatively small; therefore, it is possible that the lack of association observed with stroke was caused by insufficient statistical power. Finally, our analysis used an observational design, hence there is a possibility of residual confounding. Notwithstanding these limitations, our study has multiple strengths. These include the use of a large sample of participants, the multiracial/ethnic nature of our study sample, the prospective design, the standardized measurements of lipid fractions and adjudication of CVD events, and the robust adjustments for relevant confounders (including accounting for the duration of DM).
Conclusions
In a large sample of overweight/obese adults with T2DM, we observed that low HDL‐C and metabolic dyslipidemia were each associated with higher risks of atherosclerotic CVD events. Our results point to the potential utility of triglyceride–HDL‐C phenotyping in CVD risk stratification in this high‐risk population.
Sources of Funding
Dr Echouffo Tcheugui is supported by the NIH/NHLBI grant K23HL153774‐01, and the Johns Hopkins School of Medicine Dean’s Diversity Award.
Disclosures
The Look AHEAD study was conducted by the Look AHEAD Investigators and supported by the National Institute of Diabetes and Digestive and Kidney Diseases (NIDDK). The data from the Look AHEAD reported here were supplied by the NIDDK Central Repositories. This manuscript was not prepared in collaboration with Investigators of the Look AHEAD study and does not necessarily reflect the opinions or views of the Look Ahead Study, the NIDDK Central Repositories, or the NIDDK.
Look AHEAD was conducted by the Look AHEAD Research Group and supported by the National Institute of Diabetes and Digestive and Kidney Diseases (NIDDK); the National Heart, Lung, and Blood Institute (NHLBI); the National Institute of Nursing Research (NINR); the National Institute of Minority Health and Health Disparities (NIMHD); the Office of Research on Women's Health (ORWH); and the Centers for Disease Control and Prevention (CDC). The data (and samples) from Look AHEAD were supplied by the NIDDK Central Repositories. This manuscript was not prepared under the auspices of the Look AHEAD and does not represent analyses or conclusions of the Look AHEAD Research Group, the NIDDK Central Repositories, or the NIH
Supporting information
Tables S1–S2
Figures S1–S3
Acknowledgments
The authors thank all of the participants in the Look AHEAD study.
(J Am Heart Assoc. 2021;10:e016947.. DOI: 10.1161/JAHA.120.016947.)
Supplementary Material for this article is available at https://www.ahajournals.org/doi/suppl/10.1161/JAHA.120.016947
For Sources of Funding and Disclosures, see page 10.
REFERENCES
- 1. Benjamin EJ, Muntner P, Alonso A, Bittencourt MS, Callaway CW, Carson AP, Chamberlain AM, Chang AR, Cheng S, Das SR, et al. Heart disease and stroke statistics‐2019 update: a report from the American Heart Association. Circulation. 2019;139:e56–e528. DOI: 10.1161/CIR.0000000000000659. [DOI] [PubMed] [Google Scholar]
- 2. Menke A, Casagrande S, Geiss L, Cowie CC. Prevalence of and trends in diabetes among adults in the United States, 1988–2012. JAMA. 2015;314:1021–1029. DOI: 10.1001/jama.2015.10029. [DOI] [PubMed] [Google Scholar]
- 3. Cannon CP, Braunwald E, McCabe CH, Rader DJ, Rouleau JL, Belder R, Joyal SV, Hill KA, Pfeffer MA, Skene AM, et al. Intensive versus moderate lipid lowering with statins after acute coronary syndromes. N Engl J Med. 2004;350:1495–1504. DOI: 10.1056/NEJMoa040583. [DOI] [PubMed] [Google Scholar]
- 4. Pyŏrälä K, Pedersen TR, Kjekshus J, Faergeman O, Olsson AG, Thorgeirsson G. Cholesterol lowering with simvastatin improves prognosis of diabetic patients with coronary heart disease. A subgroup analysis of the Scandinavian Simvastatin Survival Study (4S). Diabetes Care. 1997;20:614–620. DOI: 10.2337/diacare.20.4.614. [DOI] [PubMed] [Google Scholar]
- 5. Association AD. Dyslipidemia management in adults with diabetes. Diabetes Care. 2004;27:s68–s71. DOI: 10.2337/diacare.27.2007.S68. [DOI] [PubMed] [Google Scholar]
- 6. Taskinen M‐R. Diabetic dyslipidaemia: from basic research to clinical practice. Diabetologia. 2003;46:733–749. DOI: 10.1007/s00125-003-1111-y. [DOI] [PubMed] [Google Scholar]
- 7. Bhatt DL, Steg PG, Miller M, Brinton EA, Jacobson TA, Ketchum SB, Doyle RT Jr, Juliano RA, Jiao L, Granowitz C, et al. Cardiovascular risk reduction with icosapent ethyl for hypertriglyceridemia. N Engl J Med. 2019;380:11–22. DOI: 10.1056/NEJMoa1812792. [DOI] [PubMed] [Google Scholar]
- 8. D’Andrea E, Hey SP, Ramirez CL, Kesselheim AS. Assessment of the role of niacin in managing cardiovascular disease outcomes: a systematic review and meta‐analysis. JAMA Netw Open. 2019;2:e192224. DOI: 10.1001/jamanetworkopen.2019.2224. [DOI] [PMC free article] [PubMed] [Google Scholar]
- 9. Nicholls SJ, Lincoff AM, Bash D, Ballantyne CM, Barter PJ, Davidson MH, Kastelein JJ, Koenig W, McGuire DK, Mozaffarian D, et al. Assessment of omega‐3 carboxylic acids in statin‐treated patients with high levels of triglycerides and low levels of high‐density lipoprotein cholesterol: rationale and design of the STRENGTH trial. Clin Cardiol. 2018;41:1281–1288. DOI: 10.1002/clc.23055. [DOI] [PMC free article] [PubMed] [Google Scholar]
- 10. Lee JS, Chang PY, Zhang Y, Kizer JR, Best LG, Howard BV. Triglyceride and HDL‐C dyslipidemia and risks of coronary heart disease and ischemic stroke by glycemic dysregulation status: the Strong Heart Study. Diabetes Care. 2017;40:529–537. DOI: 10.2337/dc16-1958. [DOI] [PMC free article] [PubMed] [Google Scholar]
- 11. Rana JS, Visser ME, Arsenault BJ, Despres JP, Stroes ES, Kastelein JJ, Wareham NJ, Boekholdt SM, Khaw KT. Metabolic dyslipidemia and risk of future coronary heart disease in apparently healthy men and women: the EPIC‐Norfolk prospective population study. Int J Cardiol. 2010;143:399–404. DOI: 10.1016/j.ijcard.2009.03.123. [DOI] [PubMed] [Google Scholar]
- 12. Rana JS, Liu JY, Moffet HH, Solomon MD, Go AS, Jaffe MG, Karter AJ. Metabolic dyslipidemia and risk of coronary heart disease in 28,318 adults with diabetes mellitus and low‐density lipoprotein cholesterol <100 mg/dl. Am J Cardiol. 2015;116:1700–1704. DOI: 10.1016/j.amjcard.2015.08.039. [DOI] [PubMed] [Google Scholar]
- 13. Ryan DH, Espeland MA, Foster GD, Haffner SM, Hubbard VS, Johnson KC, Kahn SE, Knowler WC, Yanovski SZ; Group LAR . Look AHEAD (Action for Health in Diabetes): design and methods for a clinical trial of weight loss for the prevention of cardiovascular disease in type 2 diabetes. Control Clin Trials. 2003;24:610–628. DOI: 10.1016/S0197-2456(03)00064-3. [DOI] [PubMed] [Google Scholar]
- 14. Group LAR , Bray G, Gregg E, Haffner S, Pi‐Sunyer XF, WagenKnecht LE, Walkup M, Wing R. Baseline characteristics of the randomised cohort from the Look AHEAD (Action for Health in Diabetes) study. Diab Vasc Dis Res. 2006;3:202–215. DOI: 10.3132/dvdr.2006.031. [DOI] [PMC free article] [PubMed] [Google Scholar]
- 15. Group LA , Wing RR, Bolin P, Brancati FL, Bray GA, Clark JM, Coday M, Crow RS, Curtis JM, Egan CM, et al. Cardiovascular effects of intensive lifestyle intervention in type 2 diabetes. N Engl J Med. 2013;369:145–154. DOI: 10.1056/NEJMoa1212914. [DOI] [PMC free article] [PubMed] [Google Scholar]
- 16. Warnick GR. Enzymatic methods for quantification of lipoprotein lipids. Methods Enzymol. 1986;129:101–123. [DOI] [PubMed] [Google Scholar]
- 17. Warnick GR, Benderson J, Albers JJ. Dextran sulfate‐Mg2+ precipitation procedure for quantitation of high‐density‐lipoprotein cholesterol. Clin Chem. 1982;28:1379–1388. DOI: 10.1093/clinchem/28.6.1379. [DOI] [PubMed] [Google Scholar]
- 18. Friedewald WT, Levy RI, Fredrickson DS. Estimation of the concentration of low‐density lipoprotein cholesterol in plasma, without use of the preparative ultracentrifuge. Clin Chem. 1972;18:499–502. DOI: 10.1093/clinchem/18.6.499. [DOI] [PubMed] [Google Scholar]
- 19. Stone NJ, Robinson JG, Lichtenstein AH, Bairey Merz CN, Blum CB, Eckel RH, Goldberg AC, Gordon D, Levy D, Lloyd‐Jones DM, et al. 2013 ACC/AHA guideline on the treatment of blood cholesterol to reduce atherosclerotic cardiovascular risk in adults: a report of the American College of Cardiology/American Heart Association Task Force on Practice Guidelines. Circulation. 2014;129:S1–S45. DOI: 10.1161/01.cir.0000437738.63853.7a. [DOI] [PubMed] [Google Scholar]
- 20. Smith GC, Seaman SR, Wood AM, Royston P, White IR. Correcting for optimistic prediction in small data sets. Am J Epidemiol. 2014;180:318–324. DOI: 10.1093/aje/kwu140. [DOI] [PMC free article] [PubMed] [Google Scholar]
- 21. Assmann G, Schulte H, von Eckardstein A, Huang Y. High‐density lipoprotein cholesterol as a predictor of coronary heart disease risk. The PROCAM experience and pathophysiological implications for reverse cholesterol transport. Atherosclerosis. 1996;124(suppl):S11–S20. DOI: 10.1016/0021-9150(96)05852-2. [DOI] [PubMed] [Google Scholar]
- 22. Schwartz GG, Olsson AG, Abt M, Ballantyne CM, Barter PJ, Brumm J, Chaitman BR, Holme IM, Kallend D, Leiter LA, et al. Effects of dalcetrapib in patients with a recent acute coronary syndrome. N Engl J Med. 2012;367:2089–2099. DOI: 10.1056/NEJMoa1206797. [DOI] [PubMed] [Google Scholar]
- 23. Voight BF, Peloso GM, Orho‐Melander M, Frikke‐Schmidt R, Barbalic M, Jensen MK, Hindy G, Hólm H, Ding EL, Johnson T, et al. Plasma HDL cholesterol and risk of myocardial infarction: a Mendelian randomisation study. Lancet. 2012;380:572–580. DOI: 10.1016/S0140-6736(12)60312-2. [DOI] [PMC free article] [PubMed] [Google Scholar]
- 24. Reiner Ž. Hypertriglyceridaemia and risk of coronary artery disease. Nat Rev Cardiol. 2017;14:401–411. DOI: 10.1038/nrcardio.2017.31. [DOI] [PubMed] [Google Scholar]
- 25. Fontbonne A, Eschwège E, Cambien F, Richard JL, Ducimetière P, Thibult N, Warnet JM, Claude JR, Rosselin GE. Hypertriglyceridaemia as a risk factor of coronary heart disease mortality in subjects with impaired glucose tolerance or diabetes. Results from the 11‐year follow‐up of the Paris Prospective Study. Diabetologia. 1989;32:300–304. DOI: 10.1007/BF00265546. [DOI] [PubMed] [Google Scholar]
- 26. Manson JE, Cook NR, Lee IM, Christen W, Bassuk SS, Mora S, Gibson H, Albert CM, Gordon D, Copeland T, et al. Marine n‐3 fatty acids and prevention of cardiovascular disease and cancer. N Engl J Med. 2019;380:23–32. DOI: 10.1056/NEJMoa1811403. [DOI] [PMC free article] [PubMed] [Google Scholar]
- 27. Arca M, Montali A, Valiante S, Campagna F, Pigna G, Paoletti V, Antonini R, Barillà F, Tanzilli G, Vestri A, et al. Usefulness of atherogenic dyslipidemia for predicting cardiovascular risk in patients with angiographically defined coronary artery disease. Am J Cardiol. 2007;100:1511–1516. DOI: 10.1016/j.amjcard.2007.06.049. [DOI] [PubMed] [Google Scholar]
- 28. Vinik AI. The metabolic basis of atherogenic dyslipidemia. Clin Cornerstone. 2005;7:27–35. DOI: 10.1016/S1098-3597(05)80065-1. [DOI] [PubMed] [Google Scholar]
- 29. Wyszynski DF, Waterworth DM, Barter PJ, Cohen J, Kesäniemi YA, Mahley RW, McPherson R, Waeber G, Bersot TP, Sharma SS, et al. Relation between atherogenic dyslipidemia and the Adult Treatment Program‐III definition of metabolic syndrome (Genetic Epidemiology of Metabolic Syndrome Project). Am J Cardiol. 2005;95:194–198. DOI: 10.1016/j.amjcard.2004.08.091. [DOI] [PubMed] [Google Scholar]
- 30. Krauss RM. Lipids and lipoproteins in patients with type 2 diabetes. Diabetes Care. 2004;27:1496–1504. DOI: 10.2337/diacare.27.6.1496. [DOI] [PubMed] [Google Scholar]
- 31. Borggreve SE, De Vries R, Dullaart RP. Alterations in high‐density lipoprotein metabolism and reverse cholesterol transport in insulin resistance and type 2 diabetes mellitus: role of lipolytic enzymes, lecithin:cholesterol acyltransferase and lipid transfer proteins. Eur J Clin Invest. 2003;33:1051–1069. DOI: 10.1111/j.1365-2362.2003.01263.x. [DOI] [PubMed] [Google Scholar]
- 32. Krauss RM. Atherogenicity of triglyceride‐rich lipoproteins. Am J Cardiol. 1998;81:13B–17B. DOI: 10.1016/S0002-9149(98)00032-0. [DOI] [PubMed] [Google Scholar]
- 33. Krauss RM. Triglycerides and atherogenic lipoproteins: rationale for lipid management. Am J Med. 1998;105:58S–62S. DOI: 10.1016/S0002-9343(98)00213-7. [DOI] [PubMed] [Google Scholar]
- 34. Campos H, Arnold KS, Balestra ME, Innerarity TL, Krauss RM. Differences in receptor binding of LDL subfractions. Arterioscler Thromb Vasc Biol. 1996;16:794–801. DOI: 10.1161/01.ATV.16.6.794. [DOI] [PubMed] [Google Scholar]
- 35. Björnheden T, Babyi A, Bondjers G, Wiklund O. Accumulation of lipoprotein fractions and subfractions in the arterial wall, determined in an in vitro perfusion system. Atherosclerosis. 1996;123:43–56. DOI: 10.1016/0021-9150(95)05770-6. [DOI] [PubMed] [Google Scholar]
- 36. Anber V, Griffin BA, McConnell M, Packard CJ, Shepherd J. Influence of plasma lipid and LDL‐subfraction profile on the interaction between low density lipoprotein with human arterial wall proteoglycans. Atherosclerosis. 1996;124:261–271. DOI: 10.1016/0021-9150(96)05842-X. [DOI] [PubMed] [Google Scholar]
- 37. Tribble DL, Holl LG, Wood PD, Krauss RM. Variations in oxidative susceptibility among six low density lipoprotein subfractions of differing density and particle size. Atherosclerosis. 1992;93:189–199. DOI: 10.1016/0021-9150(92)90255-F. [DOI] [PubMed] [Google Scholar]
- 38. Farbstein D, Levy AP. HDL dysfunction in diabetes: causes and possible treatments. Expert Rev Cardiovasc Ther. 2012;10:353–361. DOI: 10.1586/erc.11.182. [DOI] [PMC free article] [PubMed] [Google Scholar]
- 39. Manninen V, Tenkanen L, Koskinen P, Huttunen JK, Mänttäri M, Heinonen OP, Frick MH. Joint effects of serum triglyceride and LDL cholesterol and HDL cholesterol concentrations on coronary heart disease risk in the Helsinki Heart Study. Implications for treatment. Circulation. 1992;85:37–45. DOI: 10.1161/01.CIR.85.1.37. [DOI] [PubMed] [Google Scholar]
Associated Data
This section collects any data citations, data availability statements, or supplementary materials included in this article.
Supplementary Materials
Tables S1–S2
Figures S1–S3