

Abstract
Background
The risk of cardiovascular disease is known to increase after menopause. Mitochondria, which undergo quality control via mitochondrial autophagy, play a crucial role in the regulation of cellular senescence. The aim of this study was to investigate whether the effect of estrogen‐mediated protection from senescence on arteries is attributed to the induction of mitochondrial autophagy.
Methods and Results
We used human umbilical vein cells, vascular smooth muscle cells, and 12‐week‐old female C57BL/6 mice. The administration of 17β‐estradiol (E2) to cells inhibited cellular senescence and mitochondrial dysfunction. Furthermore, E2 increased mitochondrial autophagy, maintaining mitochondrial function, and retarding cellular senescence. Of note, E2 did not modulate LC3 (light chain 3), and ATG7 (autophagy related 7) deficiency did not suppress mitochondrial autophagy in E2‐treated cells. Conversely, E2 increased the colocalization of Rab9 with LAMP2 (lysosomal‐associated membrane protein 2) signals. The E2‐mediated effects on mitochondrial autophagy were abolished by the knockdown of either Ulk1 or Rab9. These results suggest that E2‐mediated mitochondrial autophagy is associated with Rab9‐dependent alternative autophagy. E2 upregulated SIRT1 (sirtuin 1) and activated LKB1 (liver kinase B1), AMPK (adenosine monophosphate‐activated protein kinase), and Ulk1, indicating that the effect of E2 on the induction of Rab9‐dependent alternative autophagy is mediated by the SIRT1/LKB1/AMPK/Ulk1 pathway. Compared with the sham‐operated mice, ovariectomized mice showed reduced mitochondrial autophagy and accelerated mitochondrial dysfunction and arterial senescence; these detrimental alterations were successfully rescued by the administration of E2.
Conclusions
We showed that E2‐induced mitochondrial autophagy plays a crucial role in the delay of vascular senescence. The Rab9‐dependent alternative autophagy is behind E2‐induced mitochondrial autophagy.
Keywords: autophagy, estrogen, mitochondria, vascular senescence
Subject Categories: Vascular Biology
Nonstandard Abbreviations and Acronyms
- E2
17β‐estradiol
- HUVECs
human umbilical vein endothelial cells
- LAMP2
lysosome‐associated membrane protein 2
- OVX
ovariectomy
- OXPHOS
oxidative phosphorylation
- SMCs
smooth muscle cells
- TOMM20
translocase of outer mitochondrial membrane 20
Clinical Perspective
What Is New?
Estrogen regulates mitochondrial autophagy, which contributes to mitochondrial quality control and retards cellular senescence.
Rab9‐dependent alternative autophagy, but not Atg7/LC3 (autophagy related 7/light chain 3)‐dependent conventional autophagy, is a predominant form of estrogen‐induced mitochondrial autophagy.
The effect of estrogen on inducing alternative autophagy is mediated by the SIRT1/LKB1/AMPK/Ulk1 (sirtuin 1/liver kinase B1/adenosine monophosphate‐activated protein kinase) pathway.
What Are the Clinical Implications?
Our finding may contribute to develop new therapeutic approach, such as some techniques to induce Rab9 clinically, to inhibit atherosclerotic cardiovascular diseases in postmenopausal women.
Aging is a process involving physical, psychological, and social changes that ultimately affect life expectancy. For instance, it is associated with changes in multiple endocrine hormones such as androgens and estrogens. In particular, estrogen plays a crucial role in the maintenance of health and of the normal functioning of several organs such as muscles, bones, the brain, and the heart. Reduced endogenous estrogen levels are known to cause muscle loss, 1 osteoporosis, 2 Alzheimer’s disease, 3 and cardiovascular disease (CVD) in postmenopausal women. CVD is the leading cause of death among the older population in the world. Of note, premenopausal women have a lower mortality risk due to CVD than that of age‐matched men in the United States, which is attributed to the vasculature protective effect of estrogen. 4 , 5 The relationship between CVD and menopause was shown in the Framingham cohort; postmenopausal women had 2 to 6 times higher incidence of CVD than premenopausal women of the same age. 6 Estrogens, particularly 17β‐estradiol (E2), have been used as the main constituents of hormone replacement therapy in postmenopausal women. A recent study showed that oral estradiol therapy initiated within 6 years of the menopause onset retarded subclinical atherosclerosis compared with that initiated after 10 or more years of menopause. 7
Damaged organelles and abnormal proteins accumulate during the aging process; this disrupts cellular homeostasis. 8 , 9 , 10 Recently, autophagy was proved as an important mechanism for maintaining cellular homeostasis via the elimination of damaged organelles, including mitochondria, proteins, and intracellular pathogens. 11 , 12 Several studies have shown that age‐related deficit of autophagy was related to vascular senescence, potentially contributing to endothelial dysfunction, arterial stiffness, and vascular pathologies such as atherosclerosis and calcification. 13 , 14 Therefore, interventions aiming to increase autophagy may reciprocally reduce age‐related cardiovascular disease. Furthermore, although the relationship between estrogen and autophagy has been recently reported in tumor cells and neurons, few studies are available in the context of the vasculature. 15
Mitochondria are essential organelles that supply ATP as energy in cells. Dysfunctional mitochondria accumulate with age, leading to reduced respiratory chain efficacy and ATP production and increased reactive oxygen species production, thereby facilitating cellular senescence. 16 Aging may be affected by the increased reactive oxygen species levels in the vasculature. 17 , 18 Because damaged mitochondria cause catastrophic consequences, mitochondrial quality control is important and modulated by various mechanisms. One of these mechanisms is organelle‐specific autophagy; in particular, damaged mitochondria are degraded via autophagy. 19 , 20 Estrogen‐mediated mitophagy has been reported to be involved in various cell fates and human diseases. 21 However, few studies have investigated the effects of estrogen on mitochondrial quality control via autophagy in the cardiovascular system.
Therefore, we hypothesized that the estrogen‐mediated protection of the arteries from senescence and atherosclerosis is attributed to the induction of autophagy, especially mitochondrial autophagy. This study aimed to test this hypothesis.
Methods
The authors declare that all supporting data are available within the article and its online supplementary files. An expanded Methods section is available in Data S1. Autophagy and mitochondrial autophagy were analyzed using electron microscopy, immunohistochemistry, and immunoblots with antibodies against LC3 (light chain 3) (MBL, M186‐3), p62 (SQSTM1; MBL, PM045), Ulk1 (Abcam, ab128859), LAMP2 (lysosome‐associated membrane protein 2; Sigma, L0668), TOMM20 (translocase of outer mitochondrial membrane 20; Abcam, ab186734), and Rab9 (Abcam, ab2810).
Cell Lines and Culture Methods
Human umbilical vein endothelial cells (HUVECs) and human aortic smooth muscle cells (SMCs) were purchased from Lonza Group Ltd. (Basel, Switzerland). When the cells reached 80% confluency, the culture medium was replaced with phenol red‐free Dulbecco’s modified Eagle’s Medium (DMEM; GIBCO, Invitrogen) containing 10% charcoal‐stripped fetal bovine serum (Biowest) and maintained for 24 hours before E2 treatment. Because phenol red itself is known to possess estrogenic properties, 22 , 23 incubation with phenol red‐free medium represents the postmenopausal condition.
Cell Treatment
Cells were treated with 10 nmol/L E2 in phenol red‐free DMEM supplemented with 2% charcoal‐stripped fetal bovine serum. Control cells were exposed to the same volume of medium without E2. For the inhibition experiments performed using ICI 182780 (Sigma), sirtinol (Sigma), and Compound C (Sigma), new DMEM supplemented with 2% charcoal‐stripped fetal bovine serum was added and maintained for 30 minutes, 1, 3, 6, and 24 hours before the addition of the inhibitors: ICI 182780 (1 μmol/L), sirtinol (50 μmol/L), Compound C (10 μmol/L), or G15 (2 μmol/L; Cayman).
Animal Models
All animal experiments were conducted in compliance with the protocol reviewed by the Institutional Animal Care and Use Committee and approved by the Faculty of Medicine, Kagoshima University, and followed the recommendations of the guidelines for animal experimentation at research institutes (Ministry of Education, Culture, Sports, Science and Technology, Japan and Ministry of Health, Labor and Welfare, Japan) and the guidelines for the proper conduct of animal experimentation (Science Council of Japan). Twelve‐week‐old female C57BL/6 mice were anesthetized with a combination of 0.3 mg/kg medetomidine, 4.0 mg/kg midazolam, and 5.0 mg/kg butorphanol by intraperitoneal injection (i.p.) and subjected in a random and allocation concealment fashion to bilateral ovariectomy (OVX) or sham surgery as described previously. 24 Body weight and food intake were measured every week after the surgery. The effects of E2 were determined via the subcutaneous implantation of E2 pellets or control pellets into OVX in mice (0.5 mg per pellet releasing 8.3 μg/day; Innovative Research; OVX+E2), for 8 weeks, as previously described. 24
Statistical Analysis
Data are expressed as the mean±SEM. The Student’s t test was used to determine the statistical significance of differences between 2 groups. For data sets with a skewed distribution or smaller sample size (n=3 to 5 per group), the nonparametric statistical analysis was performed using the Wilcoxon rank sum test. Exceptions were the data in Figure 1A, 2E and 2F, and Figure S1B that were analyzed by 2‐way analysis of variance. Analyses were performed by JMP Pro 15 (SAS Institute, Cary, NC, USA). P values<0.05 were considered significant.
Figure 1. Estrogen treatment delays cellular senescence and maintains mitochondrial function in HUVECs and VSMCs.
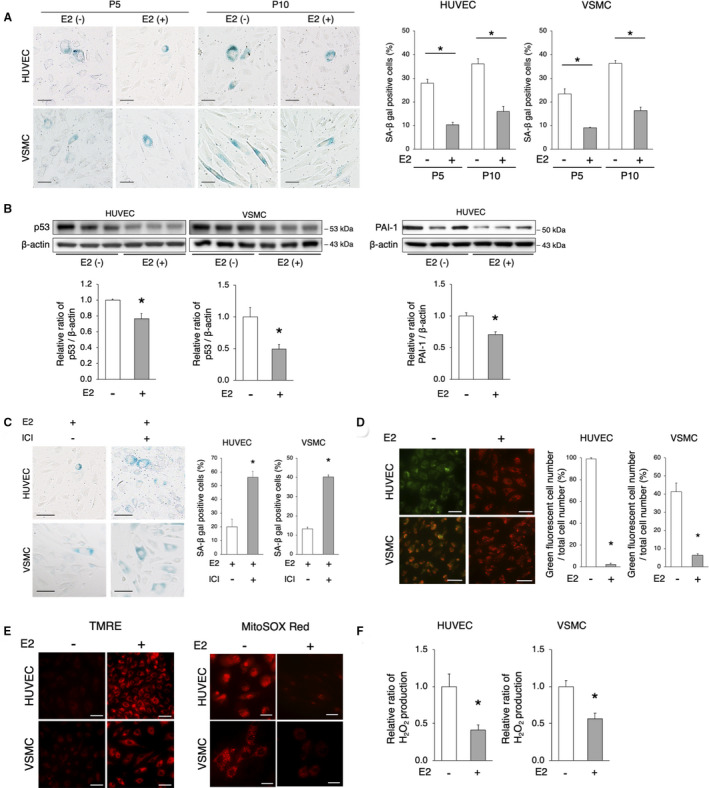
A, Representative images of SA‐β gal staining are shown. SA‐β gal‐positive cells increased with the increase in cell passages. The administration of E2 (10 nmol/L) decreased SA‐β gal‐positive cells. Scale bar=50 μm. *P<0.01 vs E2(−) (n=5 per group). Statistical analysis was performed using 2‐way analysis of variance. B, Immunoblots, and quantitative analysis results of p53, PAI‐1, and β‐actin are shown. The protein expression of p53 and PAI‐1 were lower in E2‐treated cells vs untreated cells. *P<0.05 vs E2(−) (n=3 per group). C, Representative images of SA‐β gal staining of passage 5 cells treated with E2 (10 nmol/L)+ICI 182780 (1 μmol/L) are shown. The administration of ICI attenuated the E2‐mediated delay of cellular senescence. Scale bar, 50 μm. *P<0.01 vs E2 (n=5 per group). D, Mitochondrial membrane potential was evaluated using JC‐1. Red indicates mitochondria in which the membrane potential is maintained, whereas green indicates depolarized mitochondria. The quantification of HUVECs and VSMCs with depolarized mitochondria is shown. Scale bar, 50 μm. *P<0.01 vs E2 (HUVECs, n=3 per group; VSMCs, n=5 per group). E, Left panel: TMRE staining for the assessment of mitochondrial membrane potential. Red indicates polarized mitochondria in which the membrane potential is maintained. Scale bar, 50 μm. Right panel: Mitochondrial ROS was evaluated using MitoSox Red. The level of mitochondrial ROS, as red signals, was lower in E2‐treated cells (n=4 per group). Scale bar, 25 μm. F, H2O2 production in HUVECs and VSMCs treated with or without E2 was evaluated using the Amplex Red Assay. *P<0.01 (HUVECs, n=3 per group; VSMCs, n=4 per group). All data are shown as the mean±SEM. E2 indicates 17β‐estradiol; HUVECs, human umbilical vein endothelial cells; PAI‐1, plasminogen activator inhibitor‐1; ROS, reactive oxygen species; SA‐β gal, senescence‐associated β‐galactosidase; TMRE, tetramethylrhodamine ethyl ester; and VSMCs, vascular smooth muscle cells.
Figure 2. E2‐induced mitochondrial autophagy.
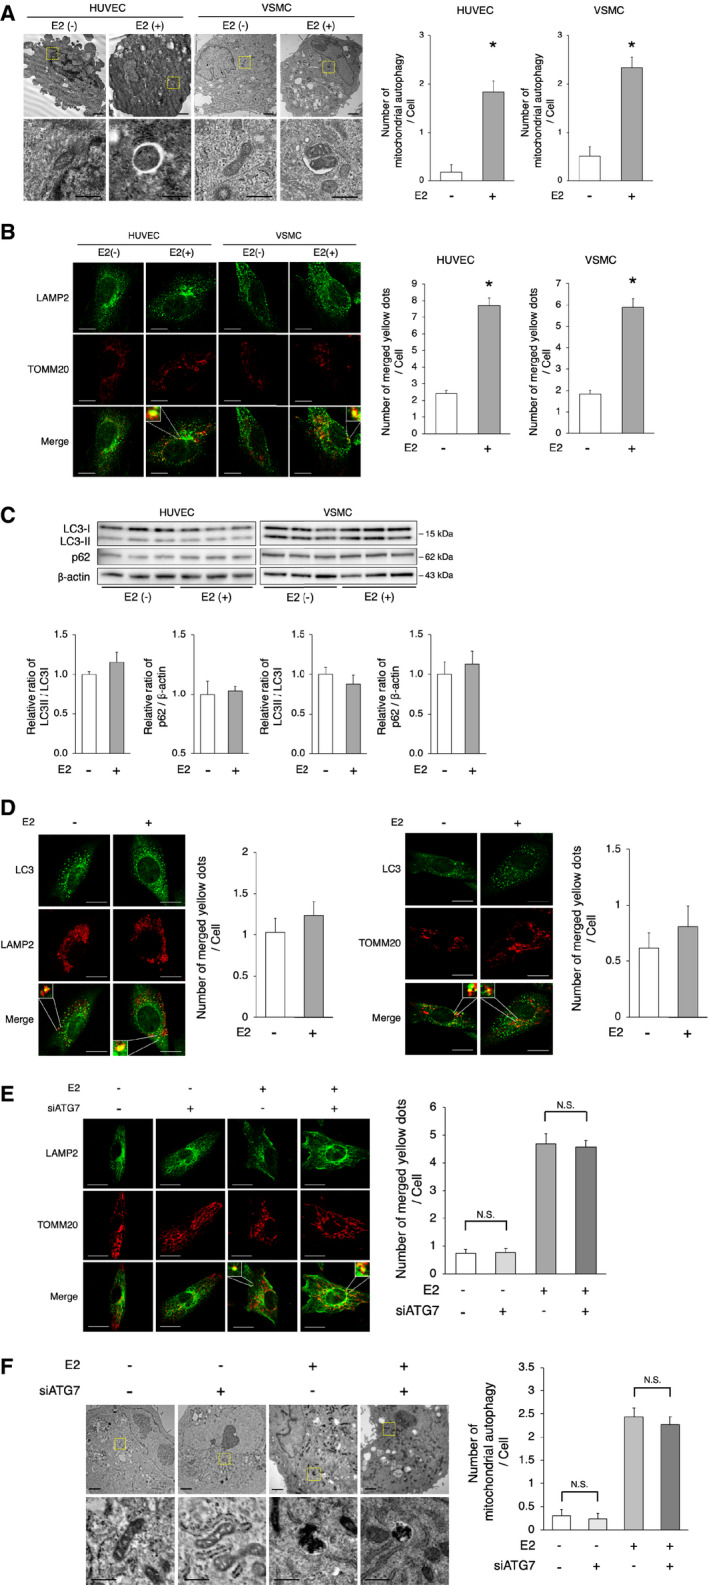
A, Electron microscopy analyses of mitochondrial autophagy in HUVECs and VSMCs with or without E2 (upper panel, scale bar=1 μm). Enlarged images of the areas delineated by the dashed rectangles are shown below (scale bar=500 nm). The cells of each group were randomly selected from 3 independent experiments, and the number of mitochondria engulfed by autophagosomes was counted. The number of autophagosomes/autolysosomes engulfing mitochondria per cell was higher in E2‐treated cells. *P<0.01 vs E2(−). B, Representative images of LAMP2 (green) and TOMM20 (red) immunohistochemistry in HUVECs and VSMCs with or without E2. Thirty cells were evaluated per group, in the context of 3 independent experiments. The number of merged yellow signals was higher in E2‐treated cells. Scale bar=10 μm. *P<0.01 vs E2(−). C, Immunoblots and quantitative analysis results of LC3 and p62 are shown. No difference in LC3 and p62 was noted between the 2 groups (n=3 per group). D, Left panel: Representative images of LC3 (green) and LAMP2 (red) immunohistochemistry in VSMCs with or without E2. Thirty cells were evaluated per group, in the context of 3 independent experiments. The number of merged yellow signals was not different between the 2 groups. Scale bar=10 μm. Right panel: Representative images of LC3 (green) and TOMM20 (red) immunohistochemistry in VSMCs with or without E2. Thirty cells were evaluated per group, in the context of 3 independent experiments. The number of merged yellow signals was not different between the 2 groups. Scale bar=10 μm. E, Representative images of LAMP2 (green) and TOMM20 (red) immunohistochemistry in E2 or vehicle‐treated VSMCs transfected with siATG7 or siControl. Thirty cells were evaluated per group, in the context of 3 independent experiments. The number of merged yellow signals was not different in VSMCs transfected with siATG7 and siControl, either treated with vehicle or E2, respectively. N. S.; not significant. Statistical analysis was performed using 2‐way analysis of variance. Scale bar=10 μm. F, Electron microscopy analyses of mitochondrial autophagy in E2 or vehicle‐treated VSMCs transfected with siATG7 or siControl (upper panel, scale bar, 1 μm). Enlarged images of the areas delineated by the dashed rectangles are shown below (scale bar=500 nm). The cells of each group were randomly selected from 3 independent experiments, and the number of mitochondria engulfed by autophagosomes was counted. The number of autophagosomes/autolysosomes engulfing mitochondria per cell was not different in VSMCs transfected with siATG7 and siControl, either treated with vehicle or E2, respectively. N. S.; not significant. Statistical analysis was performed using 2‐way analysis of variance. All data are shown as the mean±SEM. E2 indicates 17β‐estradiol; HUVECs, human umbilical vein endothelial cells; LAMP2, lysosome‐associated membrane protein 2; LC3, light chain 3; TOMM20, translocase of outer mitochondrial membrane 20; and VSMCs, vascular smooth muscle cells.
Results
Estrogen‐Protected HUVECs and Vascular SMCs from Senescence and Maintained Mitochondrial Function
We investigated the effects of estrogen on cellular senescence. Cellular senescence in HUVECs and vascular SMCs (VSMCs) was estimated using SA‐β gal (senescence‐associated β‐galactosidase) staining. Premature senescence was induced under estrogen‐free conditions and was accelerated in the context of increasing cell passages; importantly the administration of E2 delayed cell senescence (Figure 1A). There was no significant interaction between the cell passages and estrogen effects in HUVECs and VSMCs (HUVECs, P for interaction=0.48; VSMCs, P for interaction=0.06; Figure 1A). In addition, p53 expression was lower in both E2‐treated HUVECs and VSMCs versus untreated control cells (Figure 1B). The expression of PAI‐1 (plasminogen activator inhibitor‐1) was also lower in E2‐treated HUVECs than that in untreated control cells (Figure 1B). The effect of E2 on the delay of cellular senescence was abolished by the administration of the estrogen receptor inhibitor ICI 182780 (Figure 1C). Of note, the expression of p53 was increased according to the increase in cell passages in E2‐treated VSMCs and HUVECs, and ICI 182780 treatment further promoted cellular senescence in E2‐treated passage 10 VSMCs and HUVECs (Figure S1A). These results suggest that estrogen plays a crucial role in the regulation of cellular senescence. The mitochondrial membrane potential was evaluated via the staining of JC‐1: polarized and depolarized mitochondria are marked by red and green fluorescence, respectively. E2‐treated HUVECs and VSMCs showed a significantly lower number of cells with depolarized mitochondria than that in untreated cells (Figure 1D). Moreover, the number of cells with depolarized mitochondria was lower in E2‐treated VSMCs and HUVECs treated with ICI 182780, and similar findings were observed in cells from advanced passages (Figure S1B). There was statistically 2‐way interaction between the cell passages and ICI 182780 effects in E2 treated VSMCs and HUVECs (VSMCs, P for interaction=0.0004; HUVECs, P for interaction<0.0001; Figure S1B). Tetramethylrhodamine ethyl ester staining also showed that E2 treatment in HUVECs and VSMCs maintained the mitochondrial membrane potential (Figure 1E). The intensity of MitoSox Red fluorescence was lower in both HUVECs and VSMCs treated with E2 (Figure 1E). H2O2 production assessed using Amplex Red was also significantly lower in E2‐treated versus untreated cells (Figure 1F). These data indicate that E2 maintains the mitochondrial function.
E2‐Induced Mitochondrial Autophagy
A critical pathological feature of the aging process is the development of mitochondrial abnormalities; mitochondria are degraded by mitochondria‐targeted autophagy to maintain the overall mitochondrial health. Therefore, we investigated whether E2 regulates mitochondrial autophagy. Electron microscopic analysis showed that mitochondrial autophagy was higher in both HUVECs and VSMCs after E2 treatment than in those without E2 treatment (Figure 2A). Immunohistochemistry analysis showed that the colocalization of TOMM20 and LAMP2 signals was higher in both HUVECs and VSMCs treated with E2 than in those without E2 treatment (Figure 2B). Taken together, these results indicate that E2 promotes mitochondrial autophagy. Because the transition of LC3I to LC3II is crucial for the formation of autophagosomes, we determined the ratio of LC3II to LC3I in both HUVECs and VSMCs using western blot. E2 slightly, but not significantly, increased the ratio of LC3II to LC3I and decreased the expression of p62, which was degraded by autophagy (Figure 2C). Immunohistochemistry revealed that the number of LC3 signals that colocalized with LAMP2 signals was comparable between E2‐treated and untreated VSMCs (Figure 2D). The number of LC3 signals that colocalized with TOMM20 signals was also comparable between E2‐treated and untreated VSMCs (Figure 2D). Because ATG7 (autophagy related 7) plays a role in the regulation of LC3‐dependent autophagy, we knocked down ATG7 in cultured VSMCs via transduction with an Atg7‐targeting siRNA (Figure S2A) and investigated TOMM20 and LAMP2 via immunohistochemistry. The number of TOMM20 signals colocalizing with LAMP2 signals was comparable between siATG7‐ and siControl transduced VSMCs in the presence or absence of E2 (Figure 2E). There was no significant interaction between the siATG7 and estrogen effects (P for interaction=0.72; Figure 2E). Moreover, the mitochondrial autophagy number was not different between siATG7‐ and siControl‐transduced VSMCs treated with or without E2 (Figure 2F). There was no significant interaction between the siATG7 and estrogen effects (P for interaction=0.83; Figure 2F). These results suggest that E2 induces mitochondrial autophagy, independently of ATG7.
E2‐Induced Rab9‐Dependent Alternative Autophagy in HUVECs and VSMCs
Recent studies have revealed a different form of autophagy in cardiomyocytes and mouse embryonic fibroblasts, called “alternative autophagy,” which is independent of ATG7 and LC3; it requires Ulk1, followed by recruitment of the membrane trafficking protein Rab9. 25 , 26 In contrast to alternative autophagy, ATG7‐ and LC3‐dependent autophagy is called “conventional autophagy.” Immunohistochemistry of Rab9 and LAMP2 in HUVECs and VSMCs showed that E2 increased the number of LAMP2 signals colocalized with Rab9 signals in both cell types (Figure 3A). Next, we knocked down Rab9 in cultured VSMCs and performed electron microscopy and immunohistochemistry analyses (Figure S2B). Electron microscopy showed that mitochondrial autophagy in E2‐treated VSMCs was decreased in the context of Rab9 knockdown (Figure 3B). Immunohistochemistry further revealed that the number of Rab9 – LAMP2 colocalized signals was lower in E2‐treated VSMCs transduced with siRab9 versus those transduced with siControl (Figure 3C). The number of TOMM20 signals colocalized with LAMP2 signals was also lower in E2‐treated VSMCs transduced with siRab9 than in those transduced with siControl (Figure 3D). To determine whether mitochondrial dysfunction was because of decreased levels of OXPHOS (oxidative phosphorylation) protein, we measured them. There were no significant changes in the expression of OXPHOS protein levels between E2‐treated and untreated VSMCs (Figure S3A). E2‐treated VSMCs transduced with siControl showed a significantly lower number of cells with depolarized mitochondria than in those transduced with siRab9, as per the staining of JC‐1 (Figure S3B). Tetramethylrhodamine ethyl ester staining also showed that E2‐treated VSMCs transduced with siControl maintained mitochondrial membrane potential, contrarily to VSMCs transduced with siRab9 (Figure S3C). Taken together, these results suggest that estrogen induces Rab9‐dependent alternative autophagy, which may contribute to mitochondrial autophagy. Next, we knocked down Ulk1 in cultured VSMCs to determine whether Ulk1 mediates Rab9‐dependent autophagy (Figure S2C). Immunohistochemistry revealed that the number of Rab9 – LAMP2 colocalizing signals was lower in E2‐treated VSMCs transduced with siUlk1 than in those transduced with siControl, suggesting that Rab9‐dependent autophagy in VSMCs requires Ulk1 (Figure 3E). In myocardial ischemia, it has been reported that mitophagy is induced via the Ulk1‐Rab9‐Rip1‐Drp1 pathway; of note, mitochondria dynamics is associated with mitophagy in various cardiovascular diseases. 25 , 27 Therefore, we investigated the expression of phosphorylated Rip1 and Drp1, as well as of several factors involved mitochondrial dynamics. The expression of p‐Drp1 (Ser616), p‐Drp1 (Ser637), Drp1, Mfn1, Mfn2, Opa1, Rip1, and PGC1‐α were not different in E2‐treated versus untreated VSMCs (Figure S3D). Mitotracker also showed that the ratio of cells with fragmented mitochondria were not significantly different, comparing E2‐treated and untreated VSMCs (Figure S3E). These results suggest that neither the Rab9‐Rip1‐Drp1 pathway nor mitochondria dynamics are involved in E2‐induced mitochondrial autophagy.
Figure 3. E2‐induced Rab9‐dependent alternative autophagy.
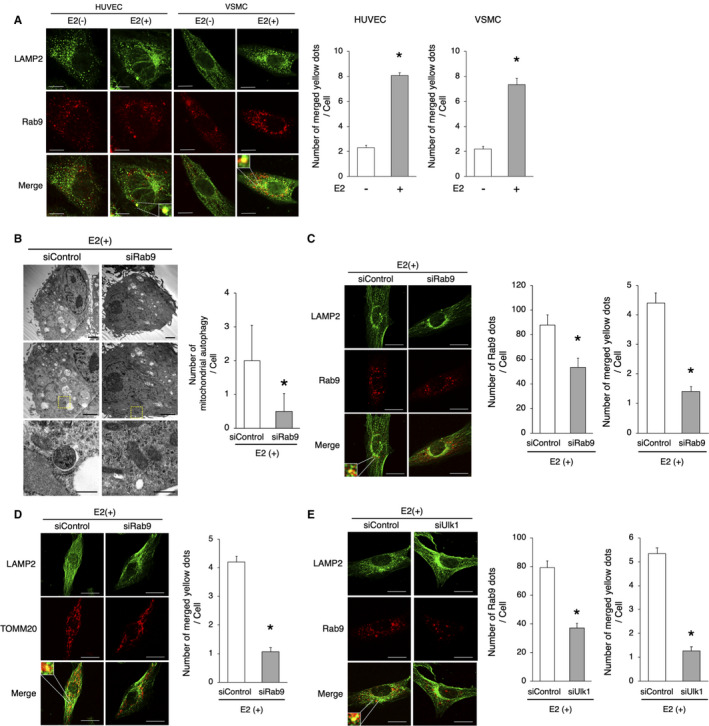
A, Representative images of LAMP2 (green) and Rab9 (red) immunohistochemistry in HUVECs and VSMCs with or without E2. Thirty cells were evaluated per group, in the context of 3 independent experiments. The number of merged yellow signals was higher in E2‐treated cells. *P<0.01 vs E2(−). Scale bar=10 μm. B, Electron microscopy analyses of mitochondrial autophagy in E2‐treated VSMCs transfected with siRab9 or siControl (upper and middle panel, respectively, scale bar, 1 μm). Enlarged images of the areas delineated by the dashed rectangles are shown below (scale bar, 500 nm). The cells of each group were randomly selected from 3 independent experiments, and the number of mitochondria engulfed by autophagosomes was counted. The number of autophagosomes/autolysosomes engulfing mitochondria per cell was lower in E2‐treated cells transfected with siRab9. *P<0.01 vs siControl. C, Representative images of LAMP2 (green) and Rab9 (red) immunohistochemistry in E2‐treated VSMCs transfected with siRab9. Thirty cells were evaluated per group, in the context of 3 independent experiments. The number of Rab9 signals and merged yellow signals was lower in E2‐treated cells transfected siRab9. Scale bar, 10 μm. *P<0.01 vs siControl. D, Representative images of LAMP2 (green) and TOMM20 (red) immunohistochemistry in E2‐treated VSMCs transduced with siRab9. Thirty cells were evaluated per group, in the context of 3 independent experiments. The number of merged yellow signals was lower in E2‐treated cells transfected with siRab9. Scale bar, 10 μm. *P<0.01 vs siControl. E, Representative images of LAMP2 (green) and Rab9 (red) immunohistochemistry in E2‐treated VSMCs transfected with siUlk1. Thirty cells were evaluated per group, in the context of 3 independent experiments. The number of Rab9 signals and merged yellow signals was lower in E2‐treated cells transfected with siUlk1. Scale bar, 10 μm. *P<0.01 vs siControl. All data are shown as the mean±SEM. E2 indicates 17β‐estradiol; HUVECs, human umbilical vein endothelial cells; LAMP2, lysosome‐associated membrane protein 2; TOMM20, translocase of outer mitochondrial membrane 20; and VSMCs, vascular smooth muscle cells.
SIRT1‐Regulated E2‐Mediated Rab9‐Dependent Alternative Autophagy
We investigated the potential mechanism behind E2‐mediated alternative autophagy. The Sir2 (silent information regulator 2) protein (one of the sirtuins) has been shown to prolong the life span of yeast, whereas its deficiency induced the opposite results. 28 Increasing evidence suggests that SIRT1 (sirtuin1), a mammalian Sir2 homolog, has a close relationship with longevity. Furthermore, the activation of SIRT1 leads to antiaging effects in the vasculature, reducing inflammation, oxidative stress, and DNA damage. 29 We previously showed that SIRT1 is regulated by estrogen and is involved in the etiology of menopause‐induced arterial senescence and atherosclerosis in apolipoprotein E‐knockout (ApoE KO) mice. 24 Therefore, we hypothesized that estrogen might induce autophagy via the activation of SIRT1. The expression of SIRT1 was higher in both HUVECs and VSMCs, whereas the administration of ICI 182780 abolished SIRT1 induction by E2 (Figure 4A and 4B, Figure S4A and S4B). Estrogen binds to 3 known estrogen receptors, ERα, ERβ, and G protein‐coupled estrogen receptor. We previously reported that estrogen upregulates the protein expression of SIRT1 via ERα; therefore, we checked the involvement of G protein‐coupled ER in this experiment. The administration of G15, which is a G protein‐coupled ER antagonist, did not significantly change the expression of SIRT1 (Figure 4C). On the other hand, SIRT1 signaling inhibition using a SIRT1 inhibitor, sirtinol, deteriorated the effect of E2 on the delay of cellular senescence in VSMCs (Figure 4D). Taken together, these results suggest that estrogen prevents cellular senescence through the induction of SIRT1. Next, we investigated the relationship between alternative autophagy and SIRT1. Electron microscopy analysis showed that the number of mitochondria undergoing autophagy in the context of E2 stimulation was lower in sirtinol‐treated versus control VSMCs (Figure 4E). Immunohistochemistry of Rab9 and LAMP2 in E2‐treated VSMCs revealed that the number of LAMP2 ‐ Rab9 colocalizing signals was lower in VSMCs treated with sirtinol (versus control VSMCs; Figure 4F). In addition, immunohistochemistry showed that the number of LAMP2 and TOMM20 colocalizing signals was lower in VSMCs treated with E2+sirtinol than in those treated with E2 alone (Figure 4G). Taken together, these results suggest that E2 upregulates SIRT1, which in turn regulates Rab9‐dependent alternative autophagy.
Figure 4. SIRT1 regulates E2‐mediated Rab9‐dependent alternative autophagy.
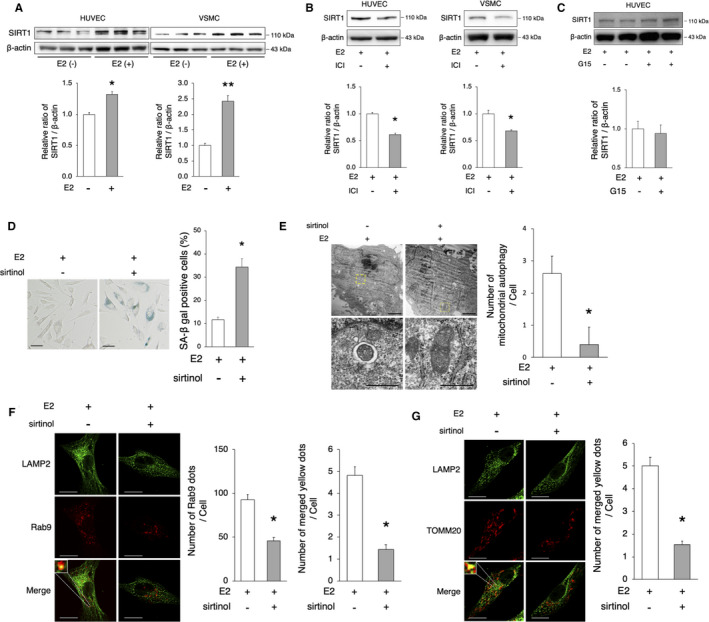
A, Immunoblots and quantitative analysis results of SIRT1 are shown. SIRT1 protein expression was higher in E2‐treated cells vs untreated cells. *P<0.05 vs E2(−); **P<0.01 vs E2(−) (n=3 per group). B, Representative immunoblots and quantitative analysis results of E2‐treated HUVECs and VSMCs with or without ICI 182780 (1 μmol/L) are shown. ICI 182780 decreased the protein expression of SIRT1. *P<0.05 vs E2(+) (HUVECs, n=3 per group; VSMCs, n=4 per group). C, Representative immunoblots and quantitative analysis results of E2‐treated HUVECs with or without G15 (20 μmol/L) are shown. G15 did not change the protein expression of SIRT1 (n=4 per group). D, Representative images of SA‐β gal staining of cells treated with E2 (10 nmol/L)+sirtinol (50 μmol/L) are shown. The number of SA‐β gal‐positive cells was increased after the administration of sirtinol. Scale bar, 50 μm. *P<0.05 vs E2(+) (n=5 per group). E, Electron microscopy analyses of mitochondrial autophagy in E2‐treated VSMCs with or without sirtinol (upper panel, scale bar, 1 μm). Enlarged images of the areas delineated by the dashed rectangles are shown below (scale bar, 500 nm). The cells of each group were randomly selected from 3 independent experiments, and the number of mitochondria engulfed by autophagosomes was counted. The number of autophagosomes/autolysosomes engulfing mitochondria per cell was lower in E2‐treated cells with sirtinol. *P<0.01 vs E2(+). F, Representative images of LAMP2 (green) and Rab9 (red) immunohistochemistry in E2‐treated VSMCs with sirtinol. Thirty cells were evaluated per group, in the context of 3 independent experiments. The number of Rab9 signals and merged yellow signals was lower in E2‐treated cells with sirtinol. Scale bar, 10 μm. *P<0.01 vs E2(+). G, Representative images of LAMP2 (green) and TOMM20 (red) immunohistochemistry in E2‐treated VSMCs with sirtinol. Thirty cells were evaluated per group, in the context of 3 independent experiments. The number of merged yellow signals was lower in E2‐treated cells with sirtinol. Scale bar, 10 μm. *P<0.01 vs E2(+). All data are shown as the mean±SEM. E2 indicates 17β‐estradiol; HUVECs, human umbilical vein endothelial cells; LAMP2, lysosome‐associated membrane protein 2; SA‐β gal, senescence‐associated β‐galactosidase; SIRT1, sirtuin 1; TOMM20, translocase of outer mitochondrial membrane 20; and VSMCs, vascular smooth muscle cells.
The SIRT1/LKB1/AMPK/Ulk1 Axis Induced Alternative Autophagy
We also determined the precise mechanisms by which SIRT1 upregulates the Rab9‐dependent alternative autophagy pathway. Several recent studies revealed that SIRT1 activates AMPK (adenosine monophosphate‐activated protein kinase) through LKB1 (liver kinase B1). 30 In addition, AMPK activation through the phosphorylation of Thr172 was reported to play a crucial role in the induction of Rab9‐dependent alternative autophagy via the activation of Ulk1 (phosphorylation of ser555). 25 Here, E2 increased the expression of LKB1, p‐LKB1 (Ser428), p‐AMPK (Thr172), p‐Ulk1 (Ser555), and Rab9 in VSMCs (Figure 5A). Moreover, the E2‐mediated increase of LKB1, p‐LKB1, p‐AMPK, p‐Ulk1, and Rab9 was abrogated by SIRT1 inhibition (Figure 5B). Furthermore, the same was true in the context of AMPK inhibition, using Compound C (Figure 5C). Of note, the number of Rab9 signals was lower in E2‐treated VSMCs treated with Compound C versus control cells (Figure 5D). We also confirmed that SIRT1, LKB1, AMPK, Ulk1, and Rab9 were upregulated by E2 in HUVECs (Figure S5A–S5C). Taken together, these results suggest that E2 activates the SIRT1‐LKB1‐AMPK pathway accompanied by the activation of Ulk1, resulting in the induction of Rab9‐dependent alternative autophagy.
Figure 5. The SIRT1/LKB1/AMPK/Ulk1 axis is involved in the induction of alternative autophagy.
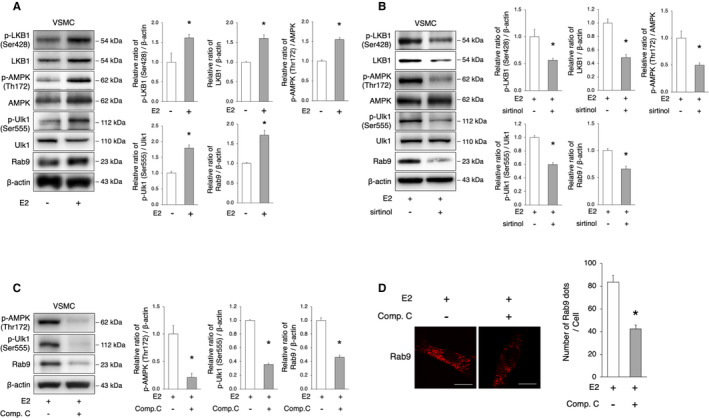
A, Representative immunoblots and quantitative analysis of LKB1, AMPK, Ulk1, and Rab9 in VSMCs with or without E2 treatment. E2 treatment activated LKB1, AMPK, Ulk1, and Rab9. *P<0.05 vs E2(−) (n=3 per group). B, Representative immunoblots and quantitative analysis of LKB1, AMPK, Ulk1, and Rab9 in E2‐treated VSMCs with or without sirtinol. The administration of sirtinol attenuated the activation of LKB1, AMPK, Ulk1, and Rab9 by E2. *P<0.05 vs E2(+) (n=3 per group). C, Representative immunoblots and quantitative analysis of AMPK, Ulk1, and Rab9 in E2‐treated VSMC with or without Compound C (10 μmol/L). The administration of Compound C attenuated the activation of AMPK, Ulk1, and Rab9 by E2. *P<0.05 vs E2(+) (n=3 per group). D, Representative images of Rab9 (red) immunohistochemistry in E2‐treated VSMCs with Compound C (10 μmol/L). Thirty cells were evaluated per group, in the context of 3 independent experiments. The number of Rab9 signals was lower in E2‐treated cells with Compound C. Scale bar, 10 μm. *P<0.01 vs E2(+). All data are shown as the mean±SEM. AMPK indicates adenosine monophosphate‐activated protein kinase; E2, 17β‐estradiol; LAMP2, lysosome‐associated membrane protein 2; LKB1, liver kinase B1; SIRT1, sirtuin 1; and VSMCs, vascular smooth muscle cells.
Estrogen‐Regulated Mitochondrial Autophagy and Arterial Senescence in Mice
We investigated whether OVX would promote arterial senescence in C57BL/6 female mice. Food intake during the experiment, body weight, and serum estradiol concentrations 8 weeks after surgery were not different between sham‐operated and OVX mice (Table). These parameters were also not different between OVX mice administered E2 and those provided control pellets (Table). Arterial fibrosis, assessed using the Masson’s trichrome staining was increased in OVX mice compared with that in sham‐operated mice (Figure 6A). Arterial 4‐hydroxynonenal immunoreactivity and the H2O2 production in the context of isolated mitochondria from the aorta were higher in OVX mice than in sham‐operated mice, suggesting that OVX increased oxidative stress in the arteries (Figure 6B and 6C). Immunoblot analysis revealed that the arterial expression of Ac‐p53 was also higher in OVX versus sham‐operated mice (Figure 6D). Electron microscopy analysis showed that mitochondrial autophagy was significantly lower in OVX mice than that in sham‐operated mice (Figure 6E). Immunohistochemistry revealed that the number of TOMM20 ‐ LAMP2 colocalizing signals was significantly lower in OVX versus sham‐operated mice (Figure 6F). The expression of p‐Ulk1 (Ser555) and Rab9 was also lower in OVX mice than that in sham‐operated mice (Figure 6G). In addition, the number of Rab9 ‐ LAMP2 colocalizing signals was significantly lower in OVX versus sham‐operated mice (Figure 6H). On the other hand, the ratio of LC3II to LC3I and the expression of p62 were not different between sham‐operated and OVX mice (Figure 6I). Taken together, these results suggest that the OVX‐induced decrease of estrogen diminishes mitochondrial autophagy, leading to the decrease of mitochondrial function and the consequent acceleration of arterial senescence. Next, we conducted experiments using female Young mice and Old mice to investigate whether similar results would be observed in function of age. Arterial fibrosis, assessed using the Masson’s trichrome staining, was increased in Old mice compared with that in Young mice (Figure S6A). Electron microscopy analysis showed that mitochondrial autophagy was significantly lower in Old versus Young mice (Figure S6B). The expression of p‐Ulk1 (Ser555) and Rab9 was also lower in Old versus Young mice (Figure S6C). Moreover, immunohistochemistry revealed that the number of Rab9 – LAMP2 colocalizing signals was lower in Old mice (Figure S6D). Conversely, ATP production was lower in Young versus Old mice (Figure S6E). Of note, the ratio of LC3II to LC3I and the expression of p62 were not different between Young and Old mice (Figure S6F). These results suggest that in Old mice, as in OVX mice, the reduction of Rab9‐dependent mitochondrial autophagy induces arterial senescence. We performed rescue experiments using OVX mice implanted with either E2 pellets or control pellets for 8 weeks. Compared with OVX mice implanted with control pellets (OVX+Ctr), OVX mice implanted with E2 pellets (OVX+E2) showed retarded arterial fibrosis, as per the Masson’s trichrome staining (Figure 7A). Arterial 4‐hydroxynonenal immunoreactivity and the production of H2O2 by mitochondria isolated from the aorta were lower in OVX+E2 mice than in OVX+Ctr mice, suggesting that OVX+E2 decreased oxidative stress in the arteries (Figure 7B and 7C). Immunoblot analysis revealed that the expression of Ac‐p53 was lower in OVX+E2 mice than that in OVX+Ctr mice (Figure 7D). Electron microscopy analysis revealed that mitochondrial autophagy was higher in OVX+E2 mice than that in OVX+Ctr mice (Figure 7E). The number of TOMM20 – LAMP2 and Rab9 – LAMP2 colocalizing signals was significantly higher in OVX+E2 versus OVX+Ctr mice (Figure 7F and 7G). The expression of p‐Ulk1 (Ser555) and Rab9 was also higher in OVX+E2 versus OVX+Ctr mice (Figure 7H). The expression of OXPHOS was slightly lower in OVX+E2 mice than that in OVX+Ctr mice; however, the difference in the protein levels was not significant (Figure 7I). On the other hand, ATP production was higher in OVX+E2 versus OVX+Ctr mice (Figure 7J). These results suggest that E2‐induced mitochondrial autophagy contributes to the maintenance of mitochondrial function. Of note, the ratio of LC3II to LC3I and the expression of p62 was not different between OVX+E2 mice and OVX+Ctr mice (Figure S7A). On the other hand, the administration of 3‐Methyladenine, a PI3K (phosphoinositide 3‐kinase) inhibitor commonly used as an autophagy inhibitor, decreased LC3II levels in OVX+E2 mice (Figure S7B). However, electron microscopy analysis showed that the administration of 3‐Methyladenine did not affect mitochondrial autophagy in OVX+E2 mice (Figure S7C). Additionally, the administration of 3‐Methyladenine did not significantly change the expression of senescence markers in OVX+E2 mice (Figure S7D). These results indicate that E2‐induced mitochondrial autophagy is not derived from conventional autophagy. We further performed experiments using female ApoE KO mice, a model of atherosclerosis, to investigate whether Rab9‐dependent mitochondrial autophagy is involved in the exacerbation of vascular pathology. Of note, we previously reported that in ApoE KO mice, OVX promotes arterial senescence and atherosclerosis, whereas estradiol administration suppresses arterial senescence and atherosclerosis. 24 Here, immunoblot analysis showed that the expression of p‐Ulk1 (Ser555) and Rab9 was lower in ApoE KO OVX versus sham‐operated mice (Figure S8A). Immunohistochemistry further revealed that the number of Rab9 – LAMP2 colocalizing signals was significantly lower in ApoE KO OVX mice than that in sham‐operated KO mice (Figure S8B). Again, the ratio of LC3II to LC3I and the expression of p62 were not different between sham and OVX ApoE KO mice (Figure S8C). Furthermore, the administration of E2 rescued p‐Ulk1 (Ser555) and Rab9 expression and mitochondrial autophagy (Figure S8D and S8E); again, the administration of E2 did not change the LC3II levels (Figure S8F). Taken together, these results suggest that E2 regulates mitochondrial autophagy derived from Rab9‐dependent alternative autophagy and maintains mitochondrial function, preventing arterial senescence and atherosclerosis.
Table 1.
Body Weight, Food Intake, and Serum Estradiol Levels
| Sham (n=7) | OVX (n=7) | P Value | OVX (n=6) | OVX+E2 (n=6) | P Value | |
|---|---|---|---|---|---|---|
| Body weight, g | 29.1±1.8 | 31.2±1.1 | 0.08 | 31.1±0.9 | 30.2±1.4 | 0.22 |
| Food intake, g/day | 4.6±0.2 | 4.5±0.1 | 0.29 | 4.4±0.2 | 4.7±0.1 | 0.10 |
| Estradiol, pg/mL | 23.4±9.9 | 5.8±2.2 | 0.05 | 7.3±2.4 | 22.2±6.2 | 0.05 |
All values are mean and SD. No animals died in the experiments. OVX indicates ovariectomy.
Figure 6. OVX promotes arterial senescence via the decrease of mitochondrial autophagy.
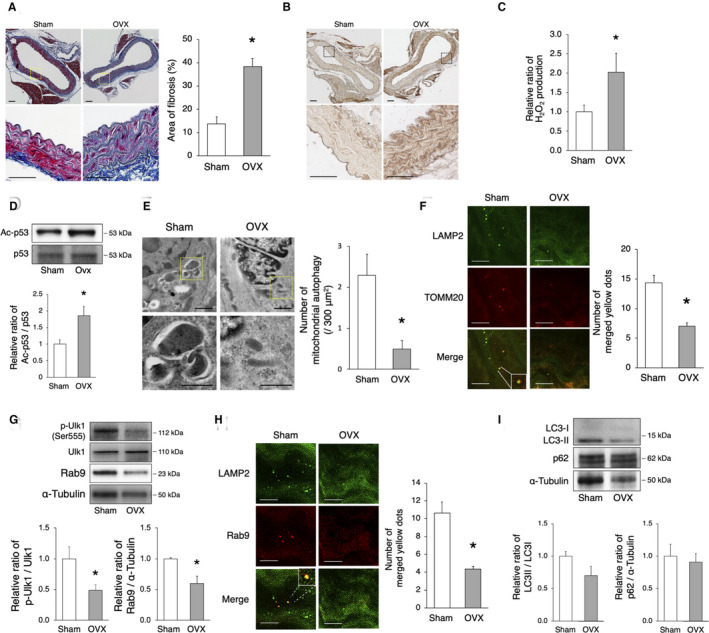
C57BL/6 mice were subjected to OVX or sham surgery. A, Assessment of aortic fibrosis in sham‐operated and OVX mice using the Masson’s trichrome staining 8 weeks after surgery. Enlarged images of the areas delineated by the dashed rectangles are shown below. The area of fibrosis was greater in OVX mice. Scale bar, 25 μm. *P<0.05 vs sham (n=3 per group). B, Representative images of 4‐HNE in sham‐operated and OVX mice. Immunoreactivity of 4‐HNE increased in the aorta of OVX mice compared with that of sham‐operated mice. C, The relative H2O2 production by isolated mitochondria from the aorta of sham‐operated and OVX mice 8 weeks after surgery was evaluated using the Amplex Red Assay. H2O2 production was higher in OVX mice. *P<0.05 vs sham (n=3 per group). D, Representative immunoblots and quantitative analysis of Ac‐p53 and p53 in sham‐operated and OVX mice. The expression of Ac‐p53 was higher in OVX mice than that in sham‐operated mice. *P<0.05 vs sham (n=4 per group). E, Electron microscopy images of the aorta from sham‐operated and OVX mice (upper panel, scale bar, 1 μm). Enlarged images of the areas delineated by the dashed rectangles are shown below (scale bar, 500 nm). More than 900 μm2 of the aorta of each mouse were screened in a random fashion; 3 samples per group were evaluated and the number of mitochondria engulfed by autophagosomes was counted. The number of mitochondrial autophagy was lower in OVX mice. *P<0.05 vs sham. F, Representative images of LAMP2 (green) and TOMM20 (red) immunohistochemistry of the aorta in sham‐operated and OVX mice. The merged yellow signals were lower in OVX mice. Scale bar, 5 μm. *P<0.05 vs sham (n=3 per group). G, Representative immunoblots and quantitative analysis of Ulk1 and Rab9 in sham‐operated and OVX mice. The expression of activated Ulk1 and Rab9 was higher in sham‐operated vs OVX mice. *P<0.05 vs sham (n=4 per group). H, Representative images of LAMP2 (green) and Rab9 (red) immunohistochemistry of the aorta in sham‐operated and OVX mice. The number of yellow signals was lower in OVX mice. Scale bar, 5 μm. *P<0.05 vs sham (n=3 per group). I, Representative immunoblots and quantitative analysis of LC3 and p62 in sham and OVX mice. The expression of both LC3 and p62 was not different between the 2 groups (n=4 per group). All data are shown as the mean±SEM. 4‐HNE indicates 4‐hydroxynonenal; LAMP2, lysosome‐associated membrane protein 2; LC3, light chain 3; OVX, ovariectomy; and TOMM20, translocase of outer mitochondrial membrane 20.
Figure 7. Estrogen rescues OVX‐induced arterial senescence via the induction of mitochondrial autophagy.
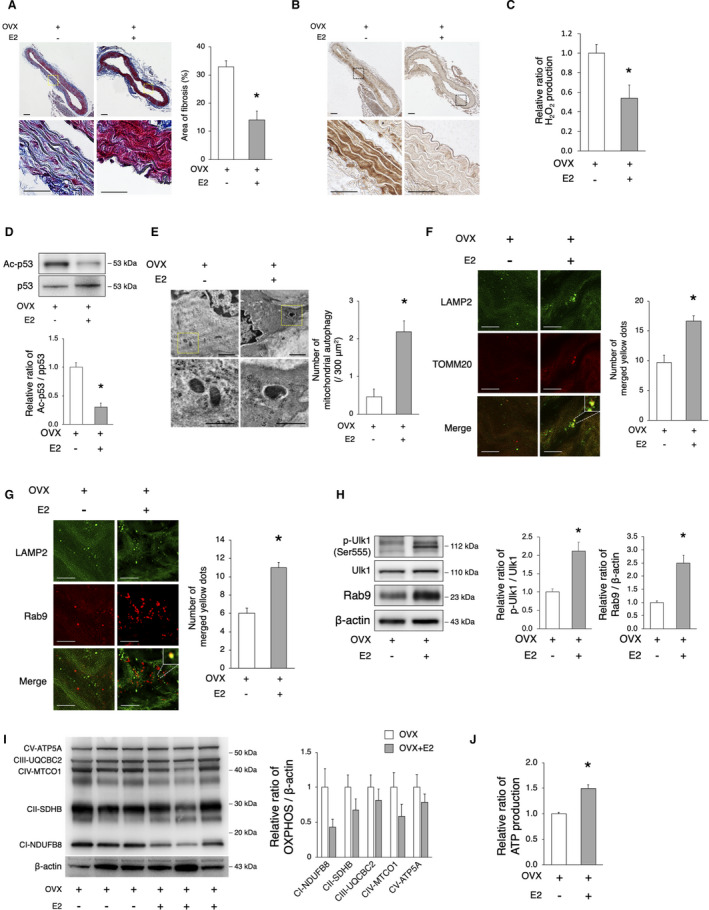
OVX mice were implanted with either E2 or control pellets for 8 weeks. A, Assessment of aortal fibrosis in OVX and OVX+E2 mice using the Masson’s trichrome staining 8 weeks after implantation. Enlarged images of the areas delineated by the dashed rectangles are shown below. The area of fibrosis was smaller in OVX+E2 mice. Scale bar, 25 μm. *P<0.05 vs OVX (n=3 per group). B, Representative images of 4‐HNE in OVX and OVX+E2 mice. Immunoreactivity of 4‐HNE increased in the aorta of OVX mice compared with that of OVX+E2 mice. C, The relative H2O2 production by isolated mitochondria from the aorta of OVX and OVX+E2 mice 8 weeks after implantation was evaluated using the Amplex Red assay. H2O2 production was lower in OVX+E2 mice. *P<0.05 vs OVX (n=3 per group). D, Representative immunoblots and quantitative analysis of Ac‐p53 and p53 in OVX and OVX+E2 mice. The expression of Ac‐p53 in OVX+E2 mice was lower than that in OVX mice. *P<0.05 vs sham (n=3 per group). E, Electron microscopy images of the aorta from OVX and OVX+E2 mice (upper panel, scale bar, 1 μm). Enlarged images of the areas delineated by the dashed rectangles are shown below (scale bar, 500 nm). More than 900 μm2 of the aorta of each mouse were screened in a random fashion; 3 samples per group were evaluated and the number of mitochondria engulfed by autophagosomes was counted. The number of mitochondrial autophagy was higher in OVX+E2 mice. *P<0.05 vs OVX. F, Representative images of LAMP2 (green) and TOMM20 (red) immunohistochemistry in OVX and OVX+E2 mice. The merged yellow signals were higher in OVX+E2 mice. Scale bar, 5 μm. *P<0.05 vs OVX (n=3 per group). G, Representative images of LAMP2 (green) and Rab9 (red) immunohistochemistry in OVX and OVX+E2 mice. The merged yellow signals were higher in OVX+E2 mice. Scale bar, 5 μm. *P<0.05 vs OVX (n=3 per group). H, Representative immunoblots and quantitative analysis of Ulk1 and Rab9 in OVX and OVX+E2 mice. The expression of activated Ulk1 and Rab9 in OVX+E2 mice was higher than that in OVX mice. *P<0.05 vs sham (n=3 per group). I, Representative immunoblots and quantitative analysis of total OXPHOS in OVX and OVX+E2 mice. The expression of total OXPHOS was not different between the 2 groups (n=3 per group). J, The relative ATP production of isolated mitochondria from the aorta of OVX and OVX+E2 mice 8 weeks after implantation was evaluated. ATP production was higher in OVX+E2 mice. *P<0.05 vs OVX (n=3 per group). All data are shown as the mean±SEM. 4‐HNE indicates 4‐hydroxynonenal; E2, 17β‐estradiol; LAMP2, lysosome‐associated membrane protein 2; OVX, ovariectomy; OXPHOS, oxidative phosphorylation; and TOMM20, translocase of outer mitochondrial membrane 20.
Discussion
Our findings suggest that estrogen regulates mitochondrial autophagy, which contributes to mitochondrial quality control and delays cellular senescence. Rab9‐dependent alternative autophagy, but not Atg7/LC3‐dependent conventional autophagy, is the predominant form of E2‐induced mitochondrial autophagy. The effect of E2 on the induction of alternative autophagy is mediated by the SIRT1/LKB1/AMPK/Ulk1 pathway. The administration of E2 to C57BL/6 OVX mice restored mitochondrial autophagy through the Rab9‐dependent alternative autophagy and delayed OVX‐induced arterial senescence.
Estrogen‐mediated autophagy and mitochondrial autophagy are involved in various cell fates and human diseases, such as osteoporosis, Hodgkin lymphoma, Parkinson’s disease, osteoarthritis, and ischemic heart; of note, they play a protective role, maintaining cell homeostasis. However, few studies have investigated the relationship between estrogen‐induced autophagy and the vasculature. In addition, which form of autophagy, conventional or alternative, contributes to mitochondrial quality control in the vasculature is not yet known. ATG5 and ATG7 are key molecules, and the conversion of LC3I to LC3II is vital to induce autophagy. 31 , 32 However, recently, several studies showed the existence of alternative forms of autophagy, independent of ATG5, ATG7, and LC3. Nishida et al described that ATG5/ATG7‐independent autophagosome formation in mouse embryonic fibroblasts appeared to be regulated by the small GTPase Rab9 and required Ulk1 in the initial step of autophagy induction. 26 ATG5/ATG7‐dependent conventional autophagy that requires LC3 plays a crucial role in the degradation of unfolded and aged proteins and organelles, which contributes to the maintenance of tissue homeostasis. Conversely, alternative autophagy is remarkably involved in the prevention of cellular damage caused by various stressors. 33 In our study, the number of LAMP2 – Rab9 colocalizing signals and the number of autophagosome‐engulfed mitochondria in both HUVECs and VSMCs were increased by E2. Of note, this phenotype was lost after the knockdown of either Rab9 or Ulk1 and was not affected after the silencing of ATG7, suggesting that E2 induces ATG7‐independent and Ulk1/Rab9‐dependent alternative autophagy. Although increasing pieces of evidence suggest that both LC3‐dependent and LC3‐independent autophagy contribute to mitochondrial autophagy, here we show that estrogen‐regulated Rab9‐dependent alternative autophagy is the predominant form of mitochondrial autophagy in the vasculature.
Although conventional autophagy is regulated by Ulk1 and PI3K complexes, alternative autophagy also requires Ulk1. In fact, the study of etoposide‐treated and etoposide‐untreated ATG5‐deficient mouse embryonic fibroblasts in the context of Ulk1 silencing revealed reduced autophagic vacuoles, indicating that ATG5/ATG7‐independent autophagy requires the Ulk1 complex. 26 Here, we show that the increase in the number of LAMP2 – Rab9 colocalizing signals induced by E2 was abolished by Ulk1silencing, suggesting that E2‐induced Rab9 dependent alternative autophagy requires Ulk1 in VSMCs and HUVECs. Although Ulk1 and PI3K are necessary for both conventional and alternative autophagy, alternative autophagy does not require Atg5 or LC3I to LC3II transition. Conventional and alternative autophagy are believed to be selectively activated by the phosphorylation/dephosphorylation of different serine/threonine residues in Ulk1. At least 13 Ulk1 phosphorylation sites have been identified. 34 Ulk1 is phosphorylated at serine 638 in the context of nutrient‐sensing through AMPK, leading to the induction of conventional autophagy. Serine 758 (serine 757 in mouse) has also been reported to be involved in the regulation of conventional autophagy. 35 Additionally, serine 555 is also phosphorylated by AMPK. 36 , 37 Importantly, a recent study showed that the phosphorylation of Ulk1 at serine 555 plays an essential role in the regulation of alternative autophagy via the interaction of Ulk1 with Rab9 in ischemic hearts. 25 We showed that E2 increased the phosphorylation of Ulk1 at the serine 555 site. On the other hand, the phosphorylation of serine 638 and serine 757 was not affected (data not shown). Therefore, we believe that the phosphorylation of Ulk1 at serine 555 contributes to the induction of alternative autophagy in vascular cells. Saito et al demonstrated that Rab9‐dependent alternative autophagy contributed the maintenance of mitochondrial quality in the form of mitophagy, derived from the activation of the Rip1‐Ulk1‐Rab9‐Drp1 pathway. 25 In our study, Rip1, and Drp1 were not involved in the induction of Rab9‐dependent autophagy by E2. We demonstrate that E2‐induced SIRT1 contributed to the initiation of alternative autophagy via the activation of the AMPK/ULK1/Rab9 pathway as shown in Figures 4, and 5. We also confirmed that there was no significant difference comparing the mitochondrial contents of E2‐treated cells in the presence or absence of the SIRT1 inhibitor, sirtinol, whereas the mitochondrial function was decreased by the inhibition of SIRT1 (data not shown). Because estrogen plays a crucial role in the induction of SIRT1, and estrogen receptors are not abundant in cardiomyocytes, we speculate that the differences in the induction of Rab9‐dependent alternative autophagy between vascular cells and cardiomyocyte are owing to this fact.
Histone deacetylases control LKB1/AMPK signaling through acetylation and de‐acetylation. 38 Notably, SIRT1 has been reported to play a critical role in the regulation of cardiac inflammation and apoptosis through the LKB1/AMPK pathway. 39 In this study, we found that E2 activated LKB1 and AMPK via the phosphorylation of serine 428 and threonine 172, respectively, and this effect was abolished by sirtinol. In addition, the inhibition of AMPK by Compound C decreased the phosphorylation levels of Ulk1 at serine 555 and E2‐induced Rab9, suggesting that the SIRT1/LKB1 pathway is behind the induction of alternative autophagy. These results suggest that E2 controls the activation of Ulk1 through the SIRT1/LKB1 pathway. However, the phosphorylation of AMPK at Thr172 was also reported to be involved in conventional autophagy. 35 Therefore, we need to further investigate how activated AMPK controls the phosphorylation of different sites of Ulk1.
Mitochondrial dysfunction induced by metabolic stress results in vascular dysfunction, leading to the development of cardiovascular diseases. 40 , 41 Mitochondrial autophagy, the selective autophagy of mitochondria, is a mechanism of mitochondrial quality control, essential for the removal of dysfunctional or damaged mitochondria. One of the well‐known mechanisms to identify dysfunctional mitochondria is the PINK1 (PTEN‐induced kinase 1)‐Parkin‐dependent mechanism. 42 PINK1 stabilizes and accumulates in depolarized mitochondria. PINK1 activation recruits Parkin from the cytosol to the mitochondria through the phosphorylation of Parkin at serine 65. 43 PINK1 activation recruits LC3 receptors or adapters, including p62, NDP52, NBR1, optineurin, and Nix, and induces mitochondrial autophagy through the phosphorylation of ubiquitin and Parkin. 44 A previous study showed that mitochondrial autophagy induced by the PINK1‐Parkin pathway plays a role in maintaining mitochondrial integrity and protecting vascular endothelial cells under metabolic stress conditions. 45 In addition, mitochondrial autophagy induced through PINK1 and Parkin is involved in the prevention of atherosclerosis. 46 These mechanisms enable autophagosomes through the LC3‐dependent autophagy to engulf damaged mitochondria. Our study revealed that, when estrogen‐free stress was applied to the mitochondria, dysfunctional mitochondria increased, but Parkin was not observed in VSMCs, indicating that mitochondrial dysfunction induced by estrogen‐free stress conditions does not induce the PINK1‐Parkin pathway (data not shown). A recent study also showed that Ulk1‐Rab9‐dependent mitochondrial autophagy was induced by a mechanism distinct from PINK1‐Parkin‐dependent mitochondrial autophagy in myocardial ischemia. 25 Similarly, our experimental results suggested that estrogen‐induced mitochondrial autophagy in vascular cells may be PINK1‐Parkin‐independent. However, how the alternative autophagy machinery recognizes damaged mitochondria in the vasculature is still unknown. We previously showed that OVX induces arterial senescence and atherosclerosis through the downregulation of SIRT1 and that the administration of estrogen prevents these alterations via SIRT1 induction. 24 However, up to now, no molecules downstream of SIRT1 were involved in the suppression of the development of vascular aging and atherosclerosis. Here, we found that the estrogen/SIRT1/LKB1/Ulk1/Rab9 axis plays a crucial role in the mediation of alternative autophagy, which acts as mitochondrial autophagy, removing damaged mitochondria and delaying vascular senescence (Figure 8). We believe that our finding may contribute to develop new therapeutic approach to inhibit atherosclerotic cardiovascular diseases in postmenopausal women.
Figure 8. The proposed mechanism of the effect of estrogen on the delay of arterial senescence.
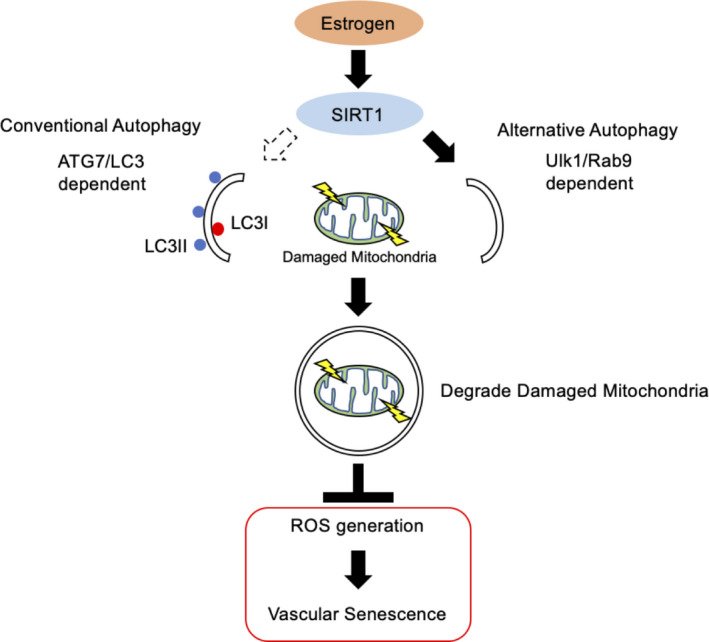
Estrogen increases mitochondrial autophagy, contributing to mitochondrial quality control and delaying cellular senescence. Rab9 dependent alternative autophagy, but not conventional autophagy, is the predominant form of E2‐induced mitochondrial autophagy. The effect of E2 on the induction of Rab9 is mediated by the SIRT1/LKB1/AMPK/Ulk1 pathway. As a result, mitochondrial autophagy derived from SIRT1/LKB1/AMPK/Ulk1/Rab9‐mediated alternative autophagy plays a key role in the effect of estrogen on the delay of vascular senescence. AMPK indicates adenosine monophosphate‐activated protein kinase;ATG7, autophagy related 7; E2, 17β‐estradiol; LC3, light chain 3; LKB1, liver kinase B1; ROS, reactive oxygen species; and SIRT1, sirtuin 1.
Limitations
The precise mechanism behind mitochondrial autophagy induced by E2, particularly, how the Rab9‐dependent alternative autophagy recognizes damaged mitochondria in a PINK1‐Parkin pathway‐independent manner, needs to be determined. Furthermore, in vivo experiments using a mouse specifically knocked out of phosphorylated Ulk1 at serine 555, are essential to determine whether alternative autophagy is suppressed. Moreover, arterial‐specific loss of function studies (eg, Rab9 conditional knockout) in vivo were not conducted in this study, and should be performed in the future.
Sources of Funding
This work was supported by the Japan Society for the Promotion of Science KAKENHI (Grant No., JP16K09250).
Disclosures
None.
Supporting information
Acknowledgments
We thank Ms Michiko Shimokawa, Ms Ayako Kuroki, and Ms Aya Yanagi for their excellent technical assistance and all of the staff members of the Institute of Laboratory Animal Science, Kagoshima University (Frontier Science Research Center) for maintaining the animals in good condition. We also thank the joint Research Laboratory, Kagoshima University Graduate School of Medical and Dental Science, for allowing the use of their facilities.
(J Am Heart Assoc. 2021;10:e019310. DOI: 10.1161/JAHA.120.019310.)
Supplementary Material for this article is available at https://www.ahajournals.org/doi/suppl/10.1161/JAHA.120.019310
For Sources of Funding and Disclosures, see page 17.
References
- 1. Sheffield‐Moore M, Urban RJ. An overview of the endocrinology of skeletal muscle. Trends Endocrinol Metab. 2004;15:110–115. DOI: 10.1016/j.tem.2004.02.009. [DOI] [PubMed] [Google Scholar]
- 2. Stevenson JC. A woman’s journey through the reproductive, transitional and postmenopausal periods of life: impact on cardiovascular and musculo‐skeletal risk and the role of estrogen replacement. Maturitas. 2011;70:197–205. [DOI] [PubMed] [Google Scholar]
- 3. Viña J, Lloret A. Why women have more Alzheimer’s disease than men: gender and mitochondrial toxicity of amyloid‐β peptide. J Alzheimer’s Dis. 2010;20:S527–S533. DOI: 10.3233/JAD-2010-100501. [DOI] [PubMed] [Google Scholar]
- 4. Barton M, Meyer MR, Haas E. Hormone replacement therapy and atherosclerosis in postmenopausal women: does aging limit therapeutic benefits? Arterioscler Thromb Vasc Biol. 2007;27:1669–1672. DOI: 10.1161/ATVBAHA.106.130260. [DOI] [PubMed] [Google Scholar]
- 5. Xing D, Nozell S, Chen YF, Hage F, Oparil S. Estrogen and mechanisms of vascular protection. Arterioscler Thromb Vasc Biol. 2009;29:289–295. DOI: 10.1161/ATVBAHA.108.182279. [DOI] [PMC free article] [PubMed] [Google Scholar]
- 6. Kannel WB, Hjortland MC, McNamara PM, Gordon T. Menopause and risk of cardiovascular disease: the Framingham study. Ann Intern Med. 1976;85:447–452. DOI: 10.7326/0003-4819-85-4-447. [DOI] [PubMed] [Google Scholar]
- 7. Hodis HN, Mack WJ, Henderson VW, Shoupe D, Budoff MJ, Hwang‐Levine J, Li Y, Feng M, Dustin L, Kono N, et al. Vascular effects of early versus late postmenopausal treatment with estradiol. N Engl J Med. 2016;374:1221–1231. DOI: 10.1056/NEJMoa1505241. [DOI] [PMC free article] [PubMed] [Google Scholar]
- 8. Finkel T, Serrano M, Blasco MA. The common biology of cancer and ageing. Nature. 2007;448:767–774. DOI: 10.1038/nature05985. [DOI] [PubMed] [Google Scholar]
- 9. Denzel MS, Storm NJ, Gutschmidt A, Baddi R, Hinze Y, Jarosch E, Sommer T, Hoppe T, Antebi A. Hexosamine pathway metabolites enhance protein quality control and prolong life. Cell. 2014;156:1167–1178. DOI: 10.1016/j.cell.2014.01.061. [DOI] [PubMed] [Google Scholar]
- 10. Buchberger A, Bukau B, Sommer T. Protein quality control in the cytosol and the endoplasmic reticulum: brothers in arms. Mol Cell. 2010;40:238–252. DOI: 10.1016/j.molcel.2010.10.001. [DOI] [PubMed] [Google Scholar]
- 11. Levine B, Kroemer G. Autophagy in the pathogenesis of disease. Cell. 2008;132:27–42. DOI: 10.1016/j.cell.2007.12.018. [DOI] [PMC free article] [PubMed] [Google Scholar]
- 12. Rubinsztein DC, Mariño G, Kroemer G. Autophagy and aging. Cell. 2011;146:682–695. DOI: 10.1016/j.cell.2011.07.030. [DOI] [PubMed] [Google Scholar]
- 13. Larocca TJ, Henson GD, Thorburn A, Sindler AL, Pierce GL, Seals DR. Translational evidence that impaired autophagy contributes to arterial ageing. J Physiol. 2012;590:3305–3316. DOI: 10.1113/jphysiol.2012.229690. [DOI] [PMC free article] [PubMed] [Google Scholar]
- 14. LaRocca TJ, Gioscia‐Ryan RA, Hearon CM, Seals DR. The autophagy enhancer spermidine reverses arterial aging. Mech Ageing Dev. 2013;134:314–320. DOI: 10.1016/j.mad.2013.04.004. [DOI] [PMC free article] [PubMed] [Google Scholar]
- 15. Xiang J, Liu X, Ren J, Chen K, Wang HL, Miao YY, Qi MM. How does estrogen work on autophagy? Autophagy. 2019;15:197–211. DOI: 10.1080/15548627.2018.1520549. [DOI] [PMC free article] [PubMed] [Google Scholar]
- 16. Sun N, Youle RJ, Finkel T. The mitochondrial basis of aging. Mol Cell. 2016;61:654–666. DOI: 10.1016/j.molcel.2016.01.028. [DOI] [PMC free article] [PubMed] [Google Scholar]
- 17. Lakatta EG, Levy D. Arterial and cardiac aging: major shareholders in cardiovascular disease enterprises: part I: aging arteries: a “set up” for vascular disease. Circulation. 2003;107:139–146. DOI: 10.1161/01.CIR.0000048892.83521.58. [DOI] [PubMed] [Google Scholar]
- 18. North BJ, Sinclair DA. The intersection between aging and cardiovascular disease. Circ Res. 2012;110:1097–1108. DOI: 10.1161/CIRCRESAHA.111.246876. [DOI] [PMC free article] [PubMed] [Google Scholar]
- 19. Youle RJ, Narendra DP. Mechanisms of mitophagy. Nat Rev Mol Cell Biol. 2011;12:9–14. DOI: 10.1038/nrm3028. [DOI] [PMC free article] [PubMed] [Google Scholar]
- 20. Saito T, Sadoshima J. Molecular mechanisms of mitochondrial autophagy/mitophagy in the heart. Circ Res. 2015;116:1477–1490. DOI: 10.1161/CIRCRESAHA.116.303790. [DOI] [PMC free article] [PubMed] [Google Scholar]
- 21. Wei Y, Huang J. Role of estrogen and its receptors mediated‐autophagy in cell fate and human diseases. J Steroid Biochem Mol Biol. 2019;191:105380.– 10.1016/j.jsbmb.2019.105380. [DOI] [PubMed] [Google Scholar]
- 22. Hofland LJ, van Koetsveld P, Koper JW, den Holder A, Lamberts SWJ. Weak estrogenic activity of phenol red in the culture medium: its role in the study of the regulation of prolactin release in vitro. Mol Cell Endocrinol. 1987;54:43–50. DOI: 10.1016/0303-7207(87)90138-9. [DOI] [PubMed] [Google Scholar]
- 23. Węsierska‐Gądek J, Schreiner T, Maurer M, Waringer A, Ranftler C. Phenol red in the culture medium strongly affects the susceptibility of human MCF‐7 cells to roscovitine. Cell Mol Biol Lett. 2007;12:280–293. DOI: 10.2478/s11658-007-0002-5. [DOI] [PMC free article] [PubMed] [Google Scholar]
- 24. Sasaki Y, Ikeda Y, Miyauchi T, Uchikado Y, Akasaki Y, Ohishi M. Estrogen‐SIRT1 axis plays a pivotal role in protecting arteries against menopause‐induced senescence and atherosclerosis. J Atheroscler Thromb. 2020;27:47–59. DOI: 10.5551/jat.47993. [DOI] [PMC free article] [PubMed] [Google Scholar]
- 25. Saito T, Nah J, Oka S, Mukai R, Monden Y, Maejima Y, Ikeda Y, Sciarretta S, Liu T, Li H, et al. An alternative mitophagy pathway mediated by Rab9 protects the heart against ischemia. J Clin Invest. 2019;129:802–819. DOI: 10.1172/JCI122035. [DOI] [PMC free article] [PubMed] [Google Scholar]
- 26. Nishida Y, Arakawa S, Fujitani K, Yamaguchi H, Mizuta T, Kanaseki T, Komatsu M, Otsu K, Tsujimoto Y, Shimizu S. Discovery of Atg5/Atg7‐independent alternative macroautophagy. Nature. 2009;461:654–658. DOI: 10.1038/nature08455. [DOI] [PubMed] [Google Scholar]
- 27. Ikeda Y, Shirakabe A, Brady C, Zablocki D, Ohishi M, Sadoshima J. Molecular mechanisms mediating mitochondrial dynamics and mitophagy and their functional roles in the cardiovascular system. J Mol Cell Cardiol. 2015;78:116–122. DOI: 10.1016/j.yjmcc.2014.09.019. [DOI] [PMC free article] [PubMed] [Google Scholar]
- 28. Kaeberlein M, McVey M, Guarente L. The SIR2/3/4 complex and SIR2 alone promote longevity in Saccharomyces cerevisiae by two different mechanisms. Genes Dev. 1999;13:2570–2580. DOI: 10.1101/gad.13.19.2570. [DOI] [PMC free article] [PubMed] [Google Scholar]
- 29. Ungvari Z, Tarantini S, Donato AJ, Galvan V, Csiszar A. Mechanisms of vascular aging. Circ Res. 2018;123:849–867. DOI: 10.1161/CIRCRESAHA.118.311378. [DOI] [PMC free article] [PubMed] [Google Scholar]
- 30. Lan F, Cacicedo JM, Ruderman N, Ido Y. SIRT1 modulation of the acetylation status, cytosolic localization, and activity of LKB1: possible role in AMP‐activated protein kinase activation. J Biol Chem. 2008;283:27628–27635. DOI: 10.1074/jbc.M805711200. [DOI] [PMC free article] [PubMed] [Google Scholar]
- 31. Kuma A, Hatano M, Matsui M, Yamamoto A, Nakaya H, Yoshimori T, Ohsumi Y, Tokuhisa T, Mizushima N. The role of autophagy during the early neonatal starvation period. Nature. 2004;432:1032–1036. DOI: 10.1038/nature03029. [DOI] [PubMed] [Google Scholar]
- 32. Komatsu M, Waguri S, Ueno T, Iwata J, Murata S, Tanida I, Ezaki J, Mizushima N, Ohsumi Y, Uchiyama Y, et al. Impairment of starvation‐induced and constitutive autophagy in Atg7‐deficient mice. J Cell Biol. 2005;169:425–434. DOI: 10.1083/jcb.200412022. [DOI] [PMC free article] [PubMed] [Google Scholar]
- 33. Shimizu S. Biological roles of alternative autophagy. Mol Cells. 2018;41:50–54. [DOI] [PMC free article] [PubMed] [Google Scholar]
- 34. Alers S, Loffler AS, Wesselborg S, Stork B. Role of AMPK‐mTOR‐Ulk1/2 in the regulation of autophagy: cross talk, shortcuts, and feedbacks. Mol Cell Biol. 2012;32:2–11. DOI: 10.1128/MCB.06159-11. [DOI] [PMC free article] [PubMed] [Google Scholar]
- 35. Shang L, Chen S, Du F, Li S, Zhao L, Wang X. Nutrient starvation elicits an acute autophagic response mediated by Ulk1 dephosphorylation and its subsequent dissociation from AMPK. Proc Natl Acad Sci USA. 2011;108:4788–4793. DOI: 10.1073/pnas.1100844108. [DOI] [PMC free article] [PubMed] [Google Scholar]
- 36. Egan DF, Shackelford DB, Mihaylova MM, Gelino S, Kohnz Rebecca A, Mair W, Vasquez DS, Joshi A, Gwinn DM, Taylor R, et al. Phosphorylation of ULK1 (hATG1) by AMPK‐activated protein kinase connects energy sensing to mitophagy. Science. 2011;331:456–461. [DOI] [PMC free article] [PubMed] [Google Scholar]
- 37. Bach M, Larance M, James DE, Ramm G. The serine/threonine kinase ULK1 is a target of multiple phosphorylation events. Biochem J. 2011;440:283–291. DOI: 10.1042/BJ20101894. [DOI] [PubMed] [Google Scholar]
- 38. Mihaylova MM, Shaw RJ. Metabolic reprogramming by class I and II histone deacetylases. Trends Endocrinol Metab. 2013;24:48–57. DOI: 10.1016/j.tem.2012.09.003. [DOI] [PMC free article] [PubMed] [Google Scholar]
- 39. Zheng Z, Chen H, Li J, Li T, Zheng B, Zheng Y, Jin H, He Y, Gu Q, Xu N. Sirtuin 1‐mediated cellular metabolic memory of high glucose via the LKB1/AMPK/ROS pathway and therapeutic effects of metformin. Diabetes. 2012;61:217–228. DOI: 10.2337/db11-0416. [DOI] [PMC free article] [PubMed] [Google Scholar]
- 40. Madamanchi NR, Runge MS. Mitochondrial dysfunction in atherosclerosis. Circ Res. 2007;100:460–473. DOI: 10.1161/01.RES.0000258450.44413.96. [DOI] [PubMed] [Google Scholar]
- 41. Kluge MA, Fetterman JL, Vita JA. Mitochondria and endothelial function. Circ Res. 2013;112:1171–1188. DOI: 10.1161/CIRCRESAHA.111.300233. [DOI] [PMC free article] [PubMed] [Google Scholar]
- 42. Narendra D, Tanaka A, Suen DF, Youle RJ. Parkin is recruited selectively to impaired mitochondria and promotes their autophagy. J Cell Biol. 2008;183:795–803. DOI: 10.1083/jcb.200809125. [DOI] [PMC free article] [PubMed] [Google Scholar]
- 43. Nguyen TN, Padman BS, Lazarou M. Deciphering the molecular signals of PINK1/Parkin mitophagy. Trends Cell Biol. 2016;26:733–744. DOI: 10.1016/j.tcb.2016.05.008. [DOI] [PubMed] [Google Scholar]
- 44. Lazarou M, Sliter DA, Kane LA, Sarraf SA, Wang C, Burman JL, Sideris DP, Fogel AI, Youle RJ. The ubiquitin kinase PINK1 recruits autophagy receptors to induce mitophagy. Nature. 2015;524:309–314. DOI: 10.1038/nature14893. [DOI] [PMC free article] [PubMed] [Google Scholar]
- 45. Wu W, Xu H, Wang Z, Mao Y, Yuan Y, Luo W, Cui Z, Cui T, Wang XL, Shen YH. PINK1‐parkin‐mediated mitophagy protects mitochondrial integrity and prevents metabolic stress‐induced endothelial injury. PLoS One. 2015;10:1–14. DOI: 10.1371/journal.pone.0132499. [DOI] [PMC free article] [PubMed] [Google Scholar]
- 46. Bravo‐San Pedro JM, Kroemer G, Galluzzi L. Autophagy and mitophagy in cardiovascular disease. Circ Res. 2017;120:1812–1824. DOI: 10.1161/CIRCRESAHA.117.311082. [DOI] [PubMed] [Google Scholar]
- 47. Yang HJ, Kong B, Shuai W, Zhang J, Huang H. MD1 deletion exaggerates cardiomyocyte autophagy induced by heart failure with preserved ejection fraction through ROS/MAPK signalling pathway. J Cell Mol Med. 2020;24:9300–9312. DOI: 10.1111/jcmm.15579. [DOI] [PMC free article] [PubMed] [Google Scholar]
- 48. Miyauchi T, Miyata M, Ikeda Y, Akasaki Y, Hamada N, Shirasawa T, Furusho Y, Tei C. Waon therapy upregulates Hsp90 and leads to angiogenesis through the AKT‐endothelial nitric oxide synthase pathway in mouse hindlimb ischemia. Circ J. 2012;76:1712–1721. DOI: 10.1253/circj.CJ-11-0915. [DOI] [PubMed] [Google Scholar]
- 49. Ikeda Y, Shirakabe A, Maejima Y, Zhai P, Sciarretta S, Toli J, Nomura M, Mihara K, Egashira K, Ohishi M, et al. Endogenous Drp1 mediates mitochondrial autophagy and protects the heart against energy stress. Circ Res. 2015;116:264–278. DOI: 10.1161/CIRCRESAHA.116.303356. [DOI] [PubMed] [Google Scholar]
Associated Data
This section collects any data citations, data availability statements, or supplementary materials included in this article.