Abstract
The oxidative potential (OP) of particles can be represented by the ability of particles to generate hydroxyl radicals in an aqueous solution which can be measured with electron paramagnetic resonance (EPR) spectrometry. The oxidative potential of particles may be a more health-relevant metric than other physicochemical properties of particles. While OPEPR has been measured in several outdoor locations, it remains largely unstudied in indoor environments. Total suspended particle samples were collected at an unoccupied research house in eighteen four-day sampling events. The OPEPR of indoor particles was found to be 59 % ± 30 % of the OPEPR of outdoor particles on a sampling volume basis during normal indoor conditions in eight sampling events. However, OPEPR per particle mass was 3.5 ± 0.62 times higher indoors than outdoors, indicating that reactions taking place indoors likely increase OPEPR of indoor particles. In ten sampling events, indoor temperature, relative humidity (RH), air change rate (λ), and cooking activities were varied. OPEPR of indoor particles was found to be significantly influenced (in order of importance) by indoor RH, λ, and temperature. OPEPR of indoor particles was higher than OPEPR for outdoor particles when indoor RH and λ were increased. The presence of cooking activities did not appear to consistently increase OPEPR of indoor particles.
Keywords: EPR, Hydroxyl radical, Relative Humidity, Air Change Rate, Temperature, Cooking
1. Introduction
Epidemiological studies have drawn strong links between exposure to particulate matter (PM) and health effects including respiratory and cardiovascular diseases 1, 2. There is mounting evidence that exposure to particles and foreign matter induces cells to generate reactive oxygen species 3, 4. Such exposure can cause oxidative stress if the endogenous reactive oxygen species (ROS) overwhelm the natural antioxidants present in cells.
The ability of PM to oxidize compounds has been proposed as a measure of the degree of oxidative stress PM can cause when inhaled into the respiratory tract 5–7. Most methods for measuring the redox potential of PM involve the use of spectrophotometric dyes, which can be sensitive to light 8. Another way of quantifying the oxidative potential of PM is to measure the ability of PM to dissociate hydrogen peroxide (H2O2) into hydroxyl radicals (•OH). The •OH radicals are stabilized with a spin trap and measured with an electron paramagnetic resonance (EPR) spectrometer. This method has been used to measure the oxidative potential (OPEPR) of outdoor particles mainly in Europe 9–18 and to a limited extent in the U.S. 19. OPEPR of PM combines some of the physicochemical properties of PM into a more physiologically relevant property.
EPR spectroscopy can be used in vivo to track paramagnetic metal ions in chemical and biochemical reactions that lead to the formation of free radicals and cause DNA damage in animals 20. It can also be used in vitro to measure the formation of hydroxyl radicals when cells are exposed to pollutants 6, 21. The present study uses EPR spectroscopy in an acellular method to measure the formation of radicals from PM, which presents a practical way to assess the oxidative stress that PM can potentially cause when inhaled into the respiratory system.
While several studies have measured the oxidative potential of outdoor particles, only two studies have measured OPEPR of indoor particles 12, 22. Briede et al. conducted sampling in a building on a university campus in the Netherlands without making a simultaneous outdoor measurement22. Yang et al. measured OPEPR of indoor and outdoor PM2.5 at the homes of 15 volunteers in Europe and collected occupant activity data via questionnaires rather than directly measuring indoor environmental conditions or building performance parameters such as air change rates 12. Given the length of exposure in indoor environments, it is important to assess OPEPR of indoor particles as a function of OPEPR of outdoor particles and to study how it is affected by indoor environmental conditions. As such, one objective of this study was to determine the difference in OPEPR of indoor and outdoor particles, and another was to study the effect of indoor temperature, relative humidity (RH), air change rate (λ), and cooking activity on the OPEPR of indoor particles. The results from a year-long sampling campaign comprising 18 four-day sampling events in an unoccupied, 14-year old research house in Gaithersburg, MD, are presented in this paper.
2. Materials and Methods
2.1. Sample Collection, Indoor Conditions, and Mass Measurements
Triplicate styrene filter cassettes were used to collect total suspended particles on 37 mm polytetrafluoroethylene (PTFE) filters (1 μm pore size, Pall) inside and outside the Indoor Air Quality and Ventilation group’s (IAQ&V) research house at the National Institute of Standards and Technology (NIST). The house is sparsely furnished, has a floor area of 140 m2 and a volume of 340 m3 with carpet in the living spaces and vinyl flooring in the kitchen area 23. The house is tucked away in a corner of the NIST campus, away from the main buildings and parking lots, though it is about three-quarters of a mile from a major highway which can bring traffic related pollutants. The house heating, ventilating and air-conditioning (HVAC) system was operating on thermostatic control during all sampling periods, with the air distribution fan on continuously in all these tests. Samples were collected continuously for 4-day periods during September 2015 through September 2016 using air sampling pumps calibrated (mini-Buck Calibrator M-30, A. P. Buck) to ran at 20 L/min. Total suspended particles were collected in order to gather enough particles during the 4-day sampling periods and not fall below the detection limit of the OP measurements. Indoor particles were collected 1 m above the floor in the centrally located kitchen area of the house, whereas outdoor particles were collected 1.5 m above the ground in front of the house. Indoor and outdoor particle counts were measured in about 5 of the 18 sampling events using an optical particle counter (either CI-7300, Climet; Particle Scan Pro, IQ Air; or Aerotrak, TSI; further discussed in Supporting Information, SI). Air change rates were measured using the tracer gas (SF6) decay method 24. The concentrations of SF6 were measured with a tracer gas monitor (Autotrac model 101, Lagus Applied Technology, Inc). Relative humidity and temperature were monitored in several locations inside and outside the house with RH probes (model HMP-45A, Vaisala) and thermistors (model 44201 for indoors, model 44203 for outdoors, YSI, Inc.). Wind speed and direction were recorded with a sonic anemometer wind speed and direction sensor (model 102779, Climatronics Corporation). The variability in measurements made with these instruments during each sampling period is displayed in Tables 1, 2, and S1, and Figures 4, 5, and 6.
Table 1.
Air change rate and indoor and outdoor environmental conditions during the eight 4-day sampling events when the research house was operated under normal conditions. The average value and the standard deviation and uncertainty in the measurements are reported (SD) over the 4-day sampling events.
| Sampling Stop Date | Air change Rate [hr−1] | Temperature [°C] | Relative Humidity [%] | Outdoor Wind | ||||||||||
|---|---|---|---|---|---|---|---|---|---|---|---|---|---|---|
| Average | SD | Outdoor | SD | Indoor | SD | Outdoor | SD | Indoor | SD | Speed [m/s] | SD | Direction [°] | SD | |
| 9/4/2015 | - | - | - | - | - | - | - | - | - | - | - | - | - | - |
| 9/18/2015 | - | - | - | - | - | - | - | - | - | - | - | - | - | - |
| 11/20/2015 | 0.32 | 0.02 | 13.1 | 3.7 | 22.1 | 0.9 | 73.3 | 23.6 | 39.4 | 2.2 | 4.14 | 2.38 | 186.4 | 91.9 |
| 3/15/2016 | 0.20 | 0.02 | 11.3 | 3.6 | 24.5 | 0.5 | 76.3 | 21.0 | 29.4 | 1.7 | 2.28 | 1.60 | 116.4 | 99.6 |
| 3/21/2016 | 0.28 | 0.09 | 6.9 | 4.8 | 22.3 | 0.5 | 58.5 | 24.3 | 26.2 | 1.6 | 3.26 | 2.97 | 193.4 | 113.5 |
| 4/18/2016 | 0.26 | 0.04 | 13.6 | 6.1 | 26.4 | 1.8 | 48.7 | 19.3 | 22.9 | 1.3 | 1.78 | 1.47 | 149.0 | 99.2 |
| 5/23/2016 | 0.19 | 0.02 | 15.1 | 4.5 | 23.9 | 0.9 | 80.2 | 24.0 | 41.0 | 2.7 | - | - | - | - |
| 9/14/2016 | 0.16 | 0.03 | 24.4 | 4.7 | 25.9 | 0.8 | 68.4 | 17.1 | 51.0 | 2.2 | - | - | - | - |
Missing values correspond to times when data collection failed.
Table 2.
Air change rate and indoor and outdoor environmental conditions during the ten 4-day sampling events when indoor temperature, relative humidity, air change rate and cooking activities were modulated at the research house. ‘Ave’ represents the average value, and ‘SD’ represents the standard deviation and uncertainty in the measurements.
| Sampling Stop Date | Indoor Conditions | λ [hr−1] | Temperature [°C] | Relative Humidity [%] | Outdoor Wind | ||||||||||
|---|---|---|---|---|---|---|---|---|---|---|---|---|---|---|---|
| Ave | SD | Out | SD | In | SD | Out | SD | In | SD | Speed [m/s] | SD | Direction [°] | SD | ||
| 1/31/2016 | High T | 0.51 | 0.13 | 1.5 | 5.4 | 33.1 | 1.1 | 63.7 | 16.0 | 12.2 | 0.6 | 2.85 | 2.57 | 208.7 | 74.0 |
| 2/23/2016 | High T | 0.47 | 0.08 | 7.9 | 4.1 | 34.3 | 4.0 | 71.2 | 20.2 | 15.3 | 0.7 | 2.53 | 1.83 | 164.8 | 102.4 |
| 1/14/2016 | High RH | 0.40 | 0.06 | −1.6 | 4.8 | 20.0 | 0.6 | 49.5 | 10.1 | 32.5 | 1.4 | 3.85 | 2.94 | 232.4 | 71.6 |
| 5/13/2016 | High RH | 0.18 | 0.02 | 15.4 | 3.0 | 24.4 | 1.1 | 87.5 | 13.0 | 62.9 | 3.9 | - | - | - | - |
| 2/5/2016 | High T&RH | 0.45 | 0.12 | 6.3 | 3.2 | 33.0 | 0.8 | 75.3 | 19.5 | 23.9 | 1.3 | 6.34 | 12.43 | 218.8 | 106.1 |
| 2/29/2016 | High T&RH | 0.58 | 0.08 | 5.1 | 6.0 | 32.3 | 0.7 | 48.7 | 12.0 | 27.3 | 1.6 | 4.90 | 3.39 | 255.2 | 51.9 |
| 4/12/2016 | High λ | 1.19 | 0.10 | 8.7 | 6.7 | 22.0 | 0.8 | 55.2 | 16.9 | 23.9 | 1.5 | 4.69 | 2.96 | 236.7 | 68.8 |
| 5/9/2016 | High λ | 1.18 | 0.05 | 19.1 | 9.1 | 22.0 | 1.0 | 80.2 | 22.3 | 41.4 | 3.2 | - | - | - | - |
| 4/1/2016 | Cooking | 0.44 | 0.21 | 13.2 | 5.6 | 25.3 | 0.8 | 53.4 | 16.5 | 30.8 | 2.2 | 5.64 | 3.50 | 223.4 | 75.1 |
| 4/22/2016 | Cooking | 0.19 | 0.02 | 17.4 | 5.6 | 24.7 | 0.8 | 47.9 | 19.2 | 28.5 | 2.4 | 2.56 | 1.84 | 174.9 | 96.1 |
- Missing values correspond to times when data collection failed.
Figure 4.
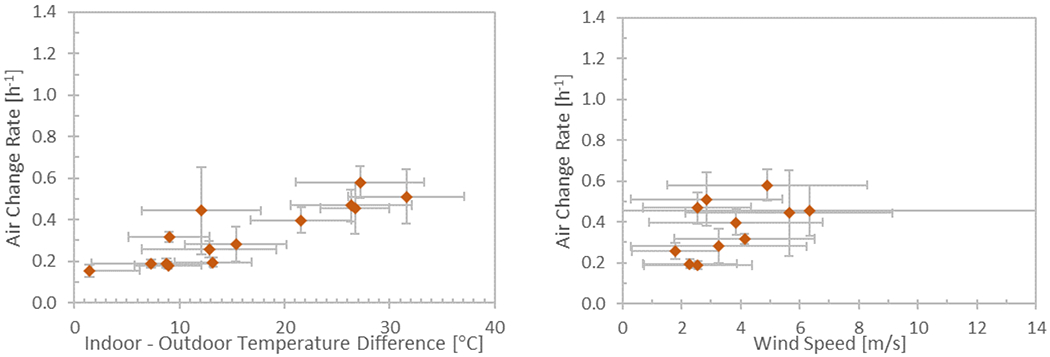
Air change rate measured during the sampling events when λ was not artificially elevated. λ is shown as a function of the indoor and outdoor temperature difference and the wind speed. Error bars denote the combination of uncertainty and standard deviation of measurements made over each 4-day sampling period.
Figure 5.
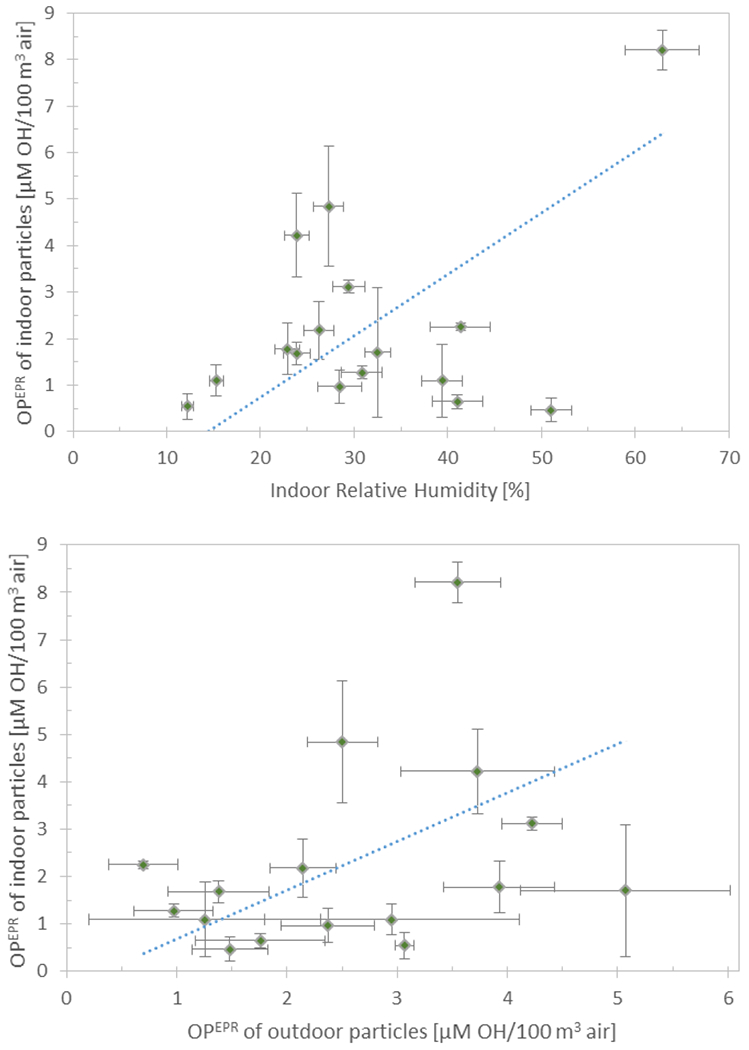
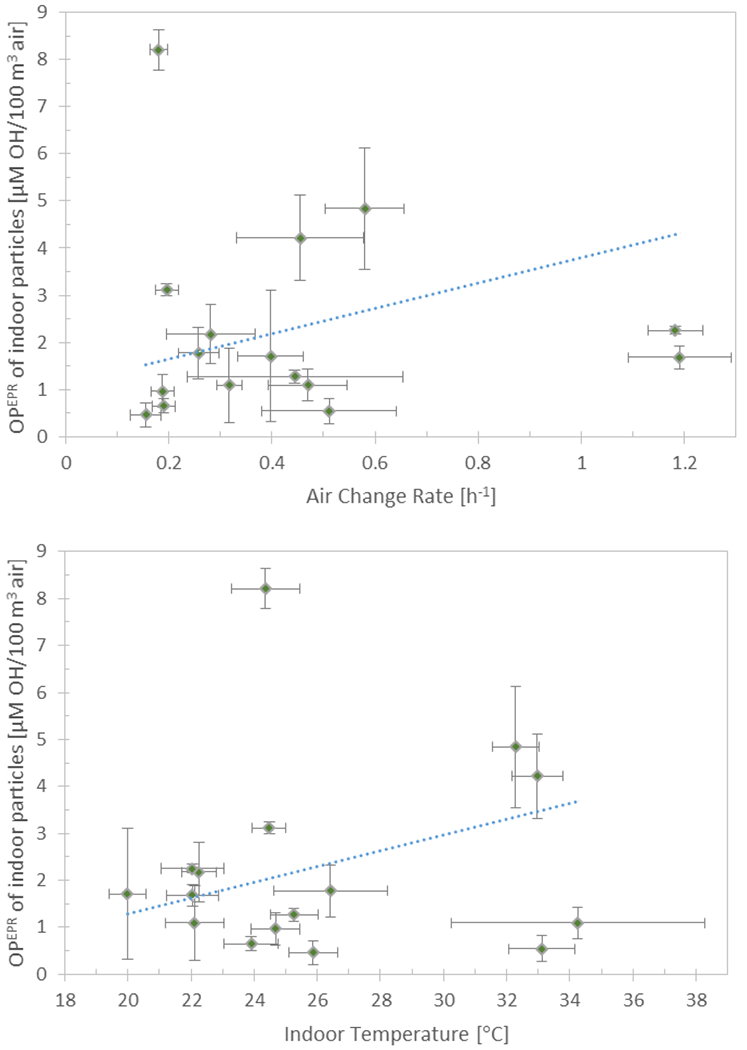
Volume normalized OPEPR of indoor particles shown as a function of indoor RH, volume normalized OPEPR of outdoor particles, air change rate, and indoor temperature. The error bars on OPEPR depict the standard deviation of triplicate samples, and the error bars for independent variables depict the standard deviation and measurement uncertainty of all measurements over the 4-day sampling period. The dotted line depicts the regression line calculated by setting all other variables to their mean value.
Figure 6.

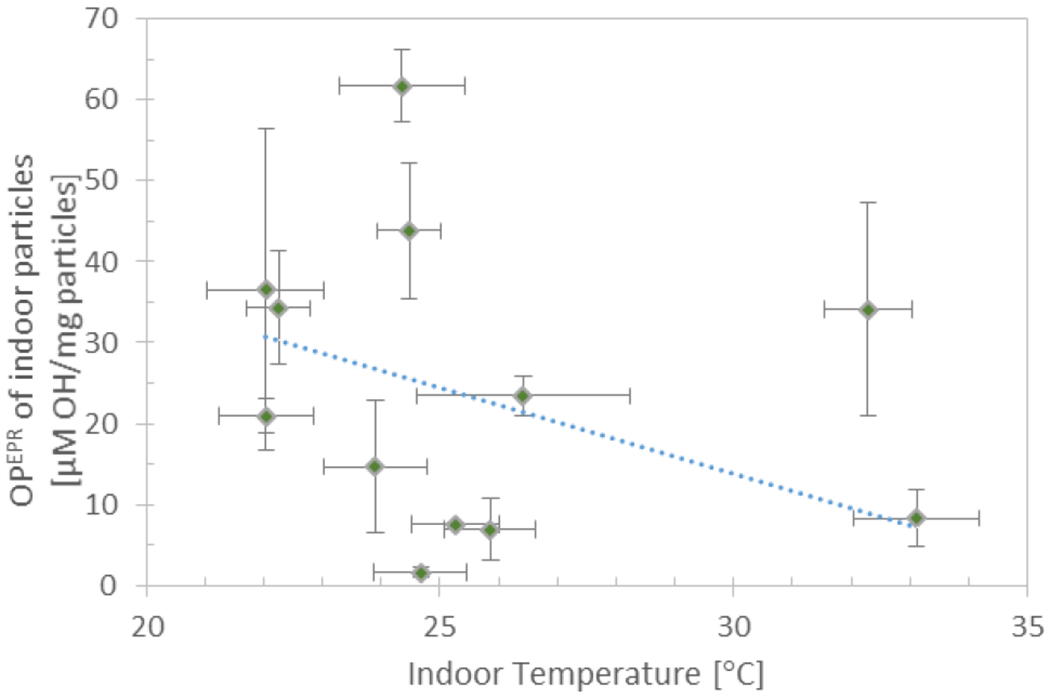
Mass normalized OPEPR of indoor particles shown as a function of mass normalized OPEPR of outdoor particles, indoor RH, and indoor temperature. The error bars on OPEPR depict the standard deviation of triplicate samples, and the error bars for other variables depict the standard deviation and measurement uncertainty of all measurements over the 4-day sampling period. The dotted line depicts the regression line calculated from the linear regression model developed with the three variables.
Filters were weighed twice before and twice after PM sampling on a (Mettler Toledo XP205) scale with an antistatic source (DC Static Eliminator, AD-1683, A&D Company) placed about 10 cm from the weighing scale to reduce static charges. Filters were placed in a desiccator for at least 24 hours prior to the mass measurements. Each filter mass measurement was alternated with the measurement of a “standard mass,” so that drift in scale response could be adjusted for in the mass calculations. Further details of the mass measurements are provided in SI. All filter mass measurements had uncertainties less than 40 μg (other than one that had an uncertainty of 85 μg), and the average uncertainty in each filter’s mass measurement was 10.8 μg (0.03%). Out of the 96 sampling filters used in this study, 72 filters were weighed with this method, and only one had a particle mass measurement below the limit of detection (LOD, calculated as three times the standard deviation of all blank filter mass measurements) and was excluded from the OPEPR/mass calculations. The other 24 filters were weighed with the same scale but in the absence of an antistatic source and without comparison with a standard mass; these earlier measurements had more variability which is why they were not included in the OPEPR/mass analyses (but were included in the OPEPR/volume analyses).
2.2. Sample Extraction and EPR Measurements
Each filter was placed in a 2 mL tube with water (>18 ohm) and was alternately vortexed (at 2000 rpm, or 33.3 Hz), sonicated and vortexed for 5 minutes each. Inhomogeneity in the PM suspension and selective extraction of PM components (including incomplete recovery of ultrafine particles) can cause variability in aliquots and loss of reactivity 22. Instead of using an aliquot of the PM suspension, the spin trap (5,5-dimethyl-1-pyrroline-N-oxide, DMPO, Dojindo Molecular Technologies, Inc.) and hydrogen peroxide (H2O2, Sigma Aldrich) were added (in order) directly to the tube with the filter immediately after the last vortex step. The final concentrations of DMPO and H2O2 were 72 mmol/L and 125 mmol/L, respectively. Both water soluble and water insoluble components of PM have been shown to cause damage to lung cells; water soluble components can induce ROS generation in cells (which can lead to oxidative stress) and water insoluble components can disrupt the cell membrane 4. By adding reagents directly to the filter, the effect of both water soluble and water insoluble components of PM on oxidative potential could be included. Earlier work with this assay had recommended a filtration step prior to the EPR measurement, but recent work has shown that unpaired electrons ligated to a spin trap (e.g. DMPO-OH) exhibit a characteristic spin resonance frequency that is distinctly different from the behaviour of any paramagnetic solid particles in the suspension, which makes it unnecessary to filter out the solid particles prior to the EPR measurement 25. After a 15-minute incubation step in a vortex, the sample was transferred into a 50 μL glass capillary, placed in a quartz EPR tube (Wilmad-LabGlass, 702-PQ-7) and inserted into the EPR cavity (Bruker Elexsys E500 EPR spectrometer). The spectrometer was tuned with each sample, and the DMPO-OH spectra was then recorded with the following operating parameters: modulation frequency 100 kHz, modulation amplitude 1.0 G (10−4 T), receiver gain 70 dB, time constant 20 ms, conversion time 20 ms, sweep time 20.97 s, center field 3340 G (0.334 T), sweep width 80 G (8×10⁻³ T), number of points 1024, attenuation 15 dB, and number of scans 3. The oxidative potential of each PM sample (OPEPR) was calculated from the sum of the area under the four peaks in the characteristic 1:2:2:1 DMPO-•OH quartet signal (the recorded spectra correspond to the first derivative and were double integrated to calculate the area under the peaks). The spin-counting method was calibrated using a standard compound 4-hydroxy-2,2,6,6-tetramethylpiperidin-1-oxyl (TEMPOL, Sigma Aldrich), which has similar EPR behavior as DMPO-OH 26, 27. The amount of DMPO-OH in the sample was converted into an equivalent molar concentration of TEMPOL (Figure 1) to get an effective concentration of •OH, and divided by the sampled air volume (volume normalized) or the mass of particles collected (mass normalized). The characteristic spectra of DMPO-OH and TEMPOL are shown in Figure 2. For three sampling filters, the sample was transferred to duplicate or triplicate 50 μL glass capillaries to assess variation in spin-counts from the same particle suspension; the coefficient of variation (CV) for replicates from the same particle suspension was <15 %. For all experiments where replicate samplers were used (16 out of 18 experiments), the CV for spin counts measured with the EPR spectrometer was <35 % and the average CV was 18 %.
Figure 1.

Chemical structure of DMPO and DMPO-OH adduct, as well as TEMPOL which was used to calibrate the concentration of •OH produced in the samples.
Figure 2.
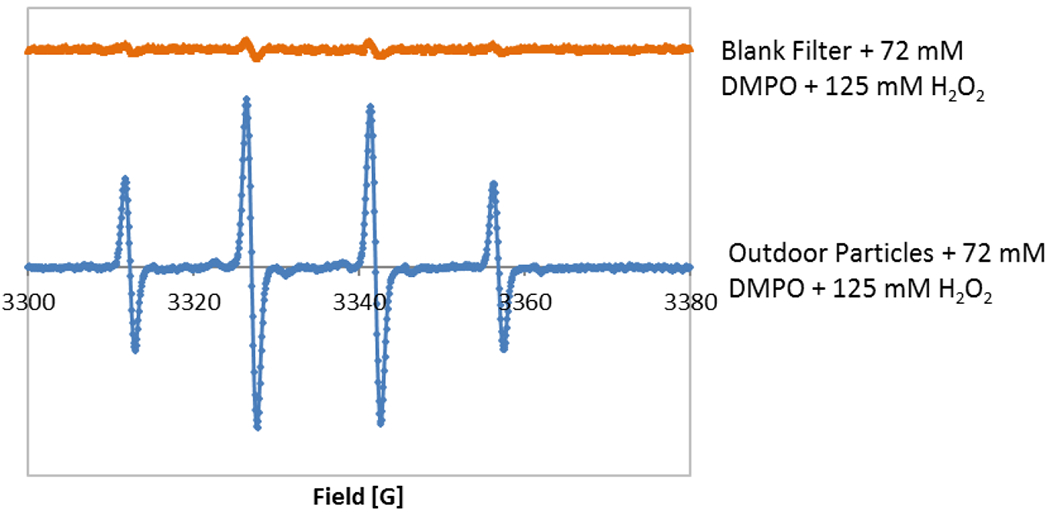
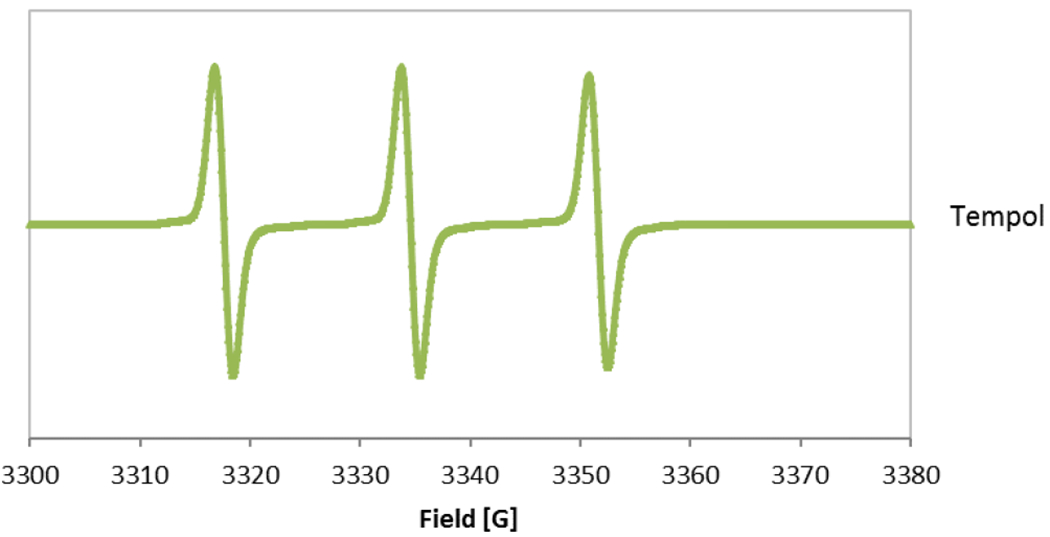
a. Electron Paramagnetic Resonance Spectra of DMPO-OH adducts with the 1:2:2:1 quartet. (i) Blank filter with 72 mM DMPO and 125 mM H2O2 and (ii) outdoor sample filter with 72 mM DMPO and 125 mM H2O2. b. The characteristic EPR spectra of 0.01 mM TEMPOL (y-scale on TEMPOL has been reduced by 50 times in comparison to DMPO-OH).
On three separate days, blank filters were vortexed and sonicated in >18 ohm water, and DMPO and H2O2 were added in the same concentrations as for the samples. The average OPEPR of these blank filters was subtracted from all the sample OPEPR measurements. The LOD of the OPEPR measurements was calculated as three times the standard deviation of the blank filter measurements, and was 0.17 μM OH. All OPEPR measurements of the samples were above the LOD.
It appeared that some particles may remain adhered to the filters after the particle extraction step (with sonication and vortex). To test if there was any effect on measured OPEPR due to the particles that did not go into suspension, a control experiment was conducted with six samplers sampling outdoor particles for four days; three of the filters were passed through the normal steps, and the other three filters were removed from reaction tubes just after the aqueous extraction step and before the addition of reagents (Section 3.5).
All statistical tests were performed using Stata 11.2. The parameters were assessed for normality using the Shapiro-Wilk test. Pairwise t-tests and Pearson’s correlation tests were used to analyze the normally distributed data, and non-parametric tests were used for the data that was not normally distributed. Results of these tests were deemed significant at the 95 % confidence level (p<0.05). F-tests were used to test the overall significance of linear regression models and t-tests were used to test the significance of regression coefficients. The residuals of linear regression models were checked for normality using the Shapiro-Wilk test, kernel density plot, standardized normal probability (P-P) plot and quantile-quantile (Q-Q) plot, and they were checked for heteroscedasticity using the White’s test and the Breusch-Pagan test (details in Supporting Information, SI).
3. Results and Discussion
3.1. OPEPR of Indoor vs. Outdoor Particles
During the eight experiments shown in Table 1, sampling was conducted at the research house under normal operating conditions (indoor temperature 22 °C to 26 °C, RH 23 % to 51 %, air change rate 0.16 /h to 0.32 /h). As expected, the OPEPR of indoor particles varied with the OPEPR of outdoor particles. From an exposure point of view (i.e., OPEPR per volume of air sampled), the average OPEPR of indoor particles was (1.49 ± 0.98) μM OH/100 m3 (mean ± standard deviation) in these eight experiments and OPEPR for simultaneously sampled outdoor particles was (2.51 ± 1.10) μM OH/100 m3 (Figure 3a). OPEPR of indoor particles was significantly different from OPEPR of outdoor particles on a volume basis (two-sample paired mean-comparison test, p=0.007), and the indoor concentration was 59 % ± 30 % of the outdoor concentration. However, OPEPR per particle mass indoors was (24.64 ± 14.81) μM OH/mg particles, which was on average, 3.5 ± 0.62 times higher than outdoors (6.66 ± 3.38) μM OH/mg particles (Figure 3b). This means that for the same mass of particles, indoor particles potentially have a higher oxidative potential than outdoor particles. OPEPR of indoor particles was also significantly different from OPEPR of outdoor particles on a mass basis (p=0.025). It is important to characterize differences in volume-normalized and mass-normalized oxidative potential results since a high value for one metric doesn’t necessarily mean a high value for the other 28, and the comparison enables a better understanding of the oxidative potential of particles generated under different conditions.
Figure 3.
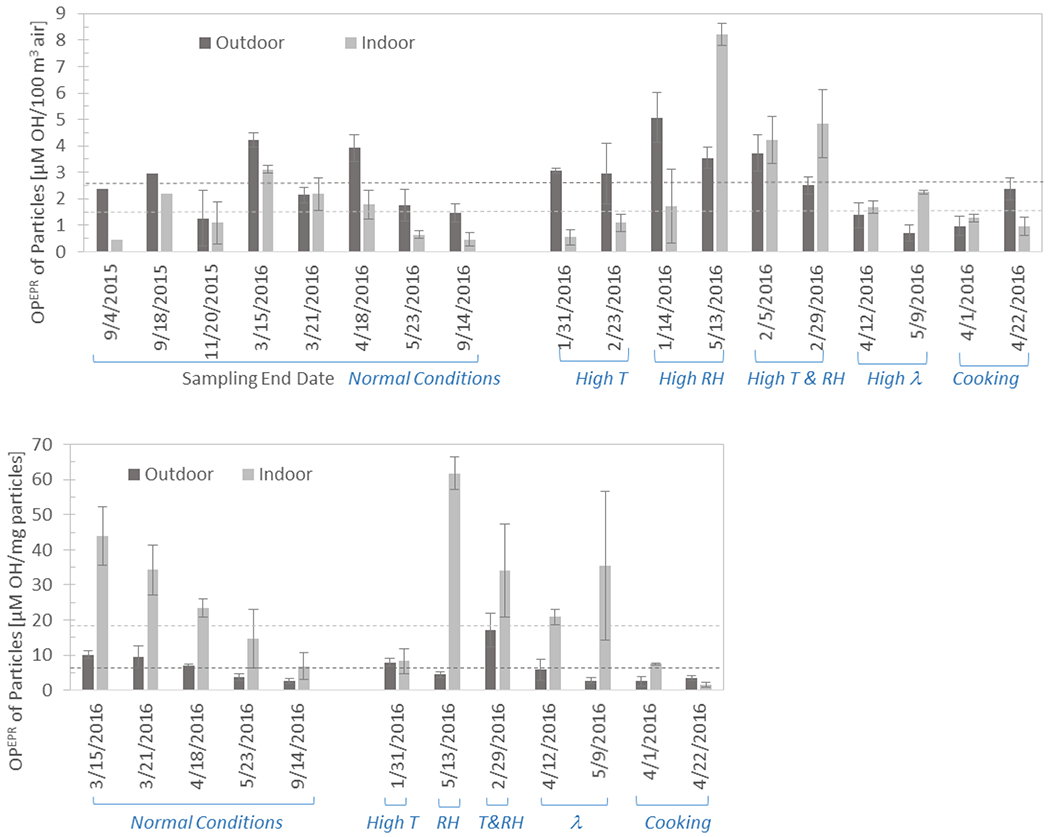
Oxidative potential of indoor and outdoor particles collected over continuous 4-day periods at the research house during normal operating conditions and varied indoor conditions (high temperature; high RH; high temperature and high RH; high air change rate, and presence of cooking activities). (a) OPEPR per volume of air sampled, (b) OPEPR per mass of particle sampled. Error bars denote standard deviation of triplicate samples. Dotted lines denote the average outdoor and indoor OPEPR concentrations during sampling events with “normal conditions”.
3.2. OPEPR of Indoor Particles as a function of Indoor Conditions
During 10 out of the 18 experiments conducted at the research house, indoor temperature, RH, λ, and cooking activities were varied to study the effect of each of these parameters on the oxidative potential of indoor particles (Figure 3). The indoor and outdoor temperature, indoor and outdoor RH, λ, and outdoor wind speed and direction during these tests are given in Table 2.
We studied the associations between indoor environmental conditions (λ, temperature, RH, presence of cooking activities) and OPEPR of indoor and outdoor particles with Spearman’s rank correlation tests and Pearson’s correlation tests (Table 3). OPEPR of indoor and outdoor particles was significantly correlated for both volume-normalized and mass-normalized results. Indoor RH was significantly correlated with the air change rate and indoor temperature.
Table 3.
Correlation coefficients between OPEPR of indoor particles (), OPEPR of outdoor particles (), λ, indoor temperature (T), indoor RH, presence of cooking activities (Cook), and mass of indoor (Min) and outdoor (Mout) particles collected.
| λ | T | RH | Cook | Mout | |||
|---|---|---|---|---|---|---|---|
| 0.351 | 0.355 | ||||||
| 0.504* | −0.329 | ||||||
| λ | 0.189 | 0.168 | |||||
| T | −0.124 | −0.399 | 0.031 | ||||
| RH | 0.080 | 0.420 | −0.508* | −0.541* | |||
| Cook | −0.248 | −0.515 | −0.175 | 0.059 | −0.060 | ||
| Min | 0.224 | −0.168 | 0.056 | −0.049 | 0.315 | 0.648* | −0.042 |
- Spearman’s rank correlations are listed for the parameters that were not normally distributed (, λ, T, , Min) and Pearson’s correlation coefficients are listed for the associations where both parameters were normally distributed (coefficients italicized). vol denotes volume-normalized; mass denotes mass-normalized.
- Bold values represent significance at p<0.05 and
represents significance at p<0.001.
3.2.1. Air Change Rate (λ)
The λ was increased to 1.2 /h in two sampling events (labelled “High λ ” in Table 3) by turning on the kitchen exhaust fan, drawing air out of the central area of the house, which led to outdoor air entering through leaks in the building envelope. In all other sampling events, λ ranged 0.16 /h to 0.58 /h (average 0.33 /h). The OPEPR of indoor particles was higher than the OPEPR of outdoor particles in the sampling events with elevated λ quite clearly so when comparing OPEPR per mass of particles sampled, but also when comparing OPEPR per volume of air sampled (Figure 3). The average ratio of particle mass collected on indoor and outdoor sampling filters during the eight “normal operating conditions” sampling events was 0.15, whereas it was 0.33 and 0.32 during the sampling events when λ was elevated. A higher λ not only brings in outdoor particles, but also gas-phase pollutants (such as ozone) that can react with building materials forming secondary species, some of which can condense into aerosols and may influence OPEPR.
The air change rates measured during the eight sampling events conducted under normal indoor conditions (22 °C to 26 °C) ranged from 0.16 /h to 0.32 /h, with higher values (0.45 /h to 0.58 /h) measured during the sampling events when indoor temperature was elevated to 32 °C to 34 °C. Figure 4 displays λ measured during each sampling event as a function of indoor and outdoor temperature difference, and outdoor wind speed. This data is consistent with what Nabinger and Persily 23 measured at the research house after building retrofits were done (during 2002-2011) to tighten the building envelope and reduce duct leakage.
3.2.2. Relative Humidity and Temperature
Indoor RH was elevated relative to outdoors during two sampling events (labelled “High RH” in Table 3) using (one and three, respectively) portable humidifiers filled with distilled water. The highest OPEPR of indoor particles out of all 18 sampling events was measured during the second high-RH sampling event, both on a sampling volume basis (8.21 ± 0.43 μM OH/100 m3) and on a particle mass basis (61.76 ± 4.54 μM OH/mg particles). In two other sampling events (labelled “High T” in Table 3), indoor temperature was increased with HVAC thermostatic controls (without trying to simultaneously increase RH). Higher temperatures increase the moisture holding capacity of air and decrease RH if the humidity ratio stays the same, which was evident from the inverse correlation between indoor temperature and RH during the 18 sampling events (p=0.0001, table 3).
Both temperature and RH were increased in two sampling events (using two or three humidifiers, labelled “High T&RH” in Table 3). Increasing indoor temperature and RH simultaneously had the effect of increasing indoor particle concentrations (ratio of particle mass collected on indoor and outdoor sampling filters was 0.98 during elevated temperature and RH, whereas it was 0.15 on average during normal indoor conditions). In both the “High T & RH” sampling events the OPEPR of indoor particles was higher than the OPEPR of outdoor particles. The use of humidifiers increases the mass concentration of particles in the air by increasing the water content of existing particles, and can lead to chemical reactions that generate particles29. It is possible that the high value of OPEPR/mg particles observed during high indoor RH conditions at the research house is because of a mechanism linking particles generated under high RH conditions with high OPEPR.
3.2.3. Cooking
During two sampling events (labelled “Cooking” in Table 3), residential cooking activities were simulated by heating oil in a frying pan to 150 °C to 180 °C and boiling water in a pot to 85 °C to 90 °C for 45 minutes, 3 times per day. These cooking activities increased indoor particle concentrations. They were correlated with higher particle mass collected on sampling filters (p<0.0001, table 3), and the ratio of particle mass collected on indoor and outdoor sampling filters was 0.43 and 0.87 during the two cooking sampling events, whereas it was 0.15 on average under normal conditions.
While OPEPR of indoor particles was marginally higher than the OPEPR of outdoor particles on a volume basis in the first cooking test, it was lower than the OPEPR of outdoor particles in the second, so cooking was not found to have a significant effect on OPEPR on a volume basis. Some of the lowest values of OPEPR/mg particle (7.6 and 1.6 μM OH/mg particles) were measured in the two cooking sampling events. As a result, mass normalized OPEPR of indoor particles was found to be inversely correlated with the presence of cooking activities (Pearson’s correlation coefficient −0.52, p=0.0013, table 3).
3.2.4. Linear Regression Model: Effect of Indoor Conditions on OPEPR
Since the indoor conditions are interconnected with each other (Table 3), multiple linear regression models were developed to understand the synergistic effect of the indoor conditions on OPEPR of indoor particles. The effect estimates for the associations of OPEPR of indoor particles in relation to select indoor conditions (temperature, RH, λ, presence of cooking activities) and OPEPR of outdoor particles are presented in Table 4.
Table 4.
Multivariable associations between OPEPR of indoor particles and indoor conditions tested during 18 4-day long sampling events at NIST IAQ&V research house.
| Volume Normalized OPEPR | Mass Normalized OPEPR | |||
|---|---|---|---|---|
| Regression Coefficient (95% CI) | p-value | Regression Coefficient (95% CI) | p-value | |
| OPEPR of outdoor particles | 1.14 (0.71, 1.58) | <0.001 | 3.15 (1.90, 4.39) | <0.001 |
| ACR | 3.09 (1.45, 4.73) | <0.001 | 5.19 (−6.00, 16.39) | 0.351 |
| Temperature | 0.18 (0.07, 0.29) | 0.002 | −1.90 (−3.21, −0.60) | 0.006 |
| RH | 0.14 (0.10, 0.18) | <0.001 | 0.79 (0.44, 1.14) | <0.001 |
| Cooking Activities | 0.82 (−0.55, 2.19) | 0.235 | −8.14 (−19.72, 3.44) | 0.161 |
- Bold values represent significance.
The indoor conditions that were significantly associated with OPEPR of indoor particles were used to develop multiple linear regression models for OPEPR of indoor particles. The regression coefficients of the model for volume normalized OPEPR of indoor particles were found to be as follows: indoor RH 0.13 (p<0.001), λ 2.69 (p=0.001), indoor temperature 0.17 (p=0.003), and volume normalized OPEPR of outdoor particles 1.03 (p<0.001), with a regression constant of −10.13 (the presence of cooking activities was not found to be significantly associated with OPEPR of indoor particles). This model was significant (F-test p<0.0001) and the independent variables in the model accounted for 60 % of the variability in volume normalized OPEPR of indoor particles. Beta (or standardized) coefficients, measured in standard deviations rather than the units of the variables, were calculated to compare the relative strength of the independent variables in the regression model. Indoor RH was found to have the strongest effect on indoor OPEPR (β = 0.84), followed by OPEPR of outdoor particles (β = 0.62), then λ (β = 0.43), and lastly indoor temperature (β = 0.37). For each variable, figure 5 displays the regression line calculated by setting all other variables to their mean value. Several diagnostic tests were used to check that (i) the residuals of the model were normally distributed (which assures that the p-values for the t-tests on the coefficients and F-test on the model are valid), and (ii) the variance of the residuals was homogeneous (which is an underlying assumption for a well-fitted ordinary least squares regression) (see SI for details).
The linear regression model for mass normalized OPEPR of indoor particles comprised of indoor RH and temperature, and controlled for mass normalized OPEPR of outdoor particles (λ and the presence of cooking activities were not found to be significantly associated with mass normalized OPEPR of indoor particles). Higher indoor RH (regression coefficient 0.82, p<0.001) and lower indoor temperature (regression coefficient −2.14, p=0.002) contribute to higher mass normalized OPEPR of indoor particles. Indoor RH has a slightly stronger effect on mass normalized indoor OPEPR (β = 0.62) than indoor temperature (β = −0.43). However, mass normalized OPEPR of outdoor particles was the strongest influencer (β = 0.86). For each variable, figure 6 displays the regression line calculated by setting the other variables to their mean value. The model was significant (p<0.0001), had a regression constant of 28.80, and the independent variables in the model accounted for 65 % of the variability in mass normalized OPEPR of indoor particles. These results suggest that in high RH conditions, pollutants may desorb from indoor surfaces and attach onto or condense into particles (especially when indoor temperatures are lower facilitating condensation) leading to particles having a higher OPEPR.
3.3. Comparative OPEPR of Indoor Particles
To our knowledge, Briede et al. 22 and Yang et al. 12 are the only studies to have measured the oxidative potential of indoor PM. Both these studies reported the amplitude of the peaks in the DMPO-OH quartet in arbitrary units; however, in the present study, the area under the peaks in the DMPO-OH quartet was integrated and converted into an equivalent molar concentration of hydroxyl radicals using a calibration curve of TEMPOL, which is a molecule that has similar EPR characteristics to DMPO-OH. Converting the EPR signal from arbitrary units into molar concentrations of hydroxyl radicals enables cross-comparison between studies that use different EPR spectrometers.
Briede et al. had sampled PM10 in a building on the Maastricht University campus in the Netherlands. DMPO-OH per μg PM10 collected indoors was less than half of PM10 collected from exhaust of cars running on fossil fuels, but more than two times greater than for PM10 collected outdoors at other times and locations in Maastricht (they didn’t simultaneously sample outdoors). Similarly, we found that OPEPR of indoor particles was, in most cases, two to four times greater than OPEPR of outdoor particles on a mass basis. Briede et al. used a slightly different method than the one used in this study, where sampling filters were placed in the resonator of the EPR spectrometer with Tris-HCl buffer and DMPO.
Yang et al. 12 measured volume normalized OPEPR of indoor and outdoor PM2.5 at the homes of 15 volunteers in three European cities. They did not measure mass normalized OPEPR. They collected activity data through questionnaires, but did not measure temperature, RH, or λ in the homes. They found that the median ratio of OPEPR of indoor and outdoor particles was 0.9 on a sampling volume basis. This value is higher than what we observed when the house was operated under normal conditions (0.59 ± 0.30), but is relatively similar to the value obtained from all 18 sampling events that include cooking, high temperature, RH, and λ conditions (mean ± SD = 1.01 ± 0.85, median = 0.80). Our results indicate that people’s indoor activities (showering, cooking, etc. which increase RH, temperature, and λ) can increase the ratio of OPEPR of indoor and outdoor particles. Yang et al. found that the median ratio for personal vs. outdoor exposure to OPEPR of PM2.5 was 0.8. They also found that the absence of a fume-hood and presence of cleaning activities contributed to OPEPR of indoor PM2.5, but these factors were not linked with OP measured with the dithiothreitol (DTT) assay.
In the present study, OPEPR of indoor particles was not higher than OPEPR of outdoor particles when the research house was operated under normal conditions, but it was higher in 6 out of the 10 sampling events when the indoor conditions were modulated to reflect variations in how typical homes operate. Higher OPEPR of indoor particles can be due to several reasons. One reason suggested by Yang et al. 12 is that high I/O ratios of metals (e.g., copper from sources such as cooking and vacuum cleaning) could lead to high I/O ratios of OPEPR since OPEPR is sensitive to transition metals involved in Fenton-like reactions. However, cooking is not routinely conducted at the research house and did not appear to significantly influence OPEPR. There are likely other factors that contribute to OPEPR of particles being higher indoors than outdoors at times at the research house.
3.4. Mass of Particles
PM loading in the indoor samples was low (40 μg to 138 μg, with an average of 81 μg), other than during high RH conditions or when cooking was done. The highest mass of particles (709 μg) was collected during the second cooking sampling event. PM loading in the outdoor samples (150 μg to 951 μg, with an average of 509 μg) was substantially higher than in the indoor samples. Due to the lower mass loadings expected in the indoor samples, samples were not subdivided for further PM characterization tests. In future work, it would be useful to study the OPEPR of indoor particles as a function of different PM components such as metals, and organic and elemental carbon content.
This study did not assess OPEPR of particles as a function of particle size. Particle counts are lower indoors which means that much longer sampling events would have to be conducted to collect enough particle mass in each size fraction for samples to not fall below the detection limit. While OPEPR of different indoor PM fractions have not been measured, OPEPR of different outdoor PM fractions have been measured by other research groups. Janssen et al., 11 found that on a mass basis, OPEPR/μg was higher for PM10 than PM2.5, with a median ratio of 1.3, for particles collected at four locations near traffic and at background sites in the Netherlands. This was not the case for oxidative potential measured with the DTT assay which was lower in PM10 than in PM2.5 (median ratio 0.8). Similar to Janssen et al., Boogaard et al. 17 analyzed particles at 18 locations near major streets and at background sites in the Netherlands and found that OPEPR was higher for PM10 than PM2.5, 3.1 times higher on a mass basis, and 4.6 higher on a volume basis.
3.5. Filter Presence During OPEPR Assay Steps
Knaapen et al. 9 observed that the insoluble fraction of PM also possesses •OH generating capacity, which could be due to insoluble metals and reactive surfaces of poorly soluble PM components. In this study, the •OH generating capacity of both the soluble and insoluble components of PM were considered because DMPO was added directly to the sampling filter. Most of the particles on the sampling filters came into aqueous suspension after extraction (vortex and sonication), but some particles remained on the filters leading to a faint mark in the center of the extracted filters. In order to study the effect of the particles that remained on the filter, a control experiment was conducted with and without the filters present when the reagents are added. There was no significant difference between the OPEPR measurements of the two groups indicating that the particles that remained on the filters did not contribute to the •OH generation capacity (or were embedded too deeply in the filter to interact fully with the reagents) (p=0.75) (figure 7). Therefore, it appears that the soluble and insoluble components of particles that went into the aqueous suspension were responsible for the •OH generated in this study.
Figure 7.
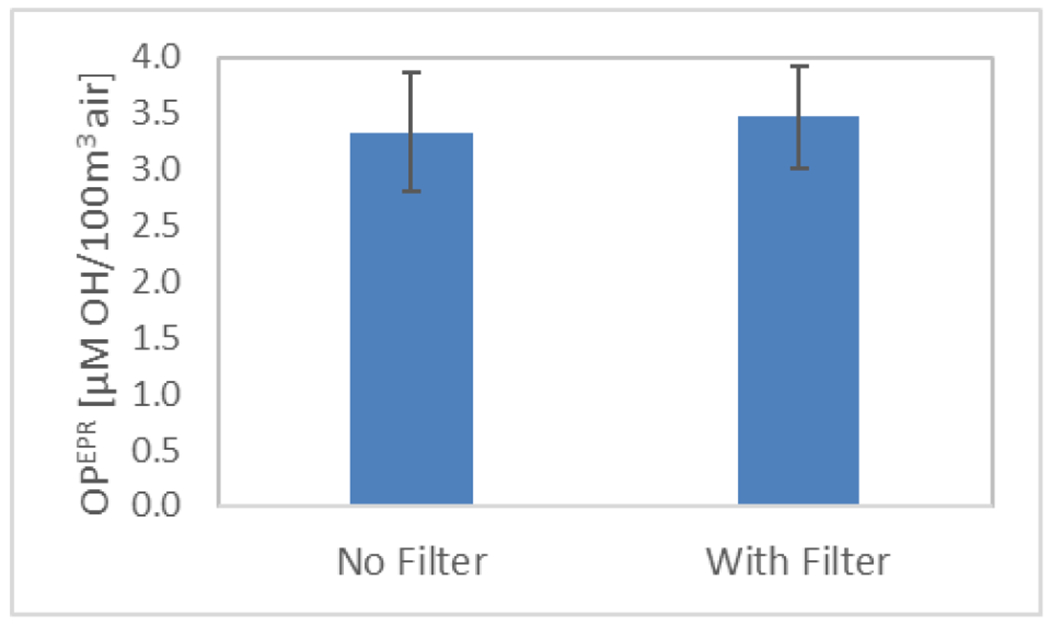
Volume normalized OPEPR of outdoor particles when the sampling filter was removed after extracting the particles (‘No Filter’) and when the sampling filter was retained in the reaction tube during the addition of DMPO and H2O2 (‘With Filter’). The presence of the filter did not appear to significantly increase the •OH generation capacity of the samples. The error bars denote standard deviation of triplicate samples.
3.6. Decay of OPEPR
No significant difference (p=0.96) was observed in OPEPR of outdoor particles when the filters were extracted and analyzed immediately after filters were weighed (after being conditioned in a desiccator for 1 day following the 4-day sampling period) or 15 days later (Figure 8). This confirms that the oxidative potential of particles arises from components of particles that are stable over time, whose •OH generating capacity doesn’t diminish readily. In other work, PM samples have been stored for more than four years at 4 °C in the dark before being analyzed 13.
Figure 8.
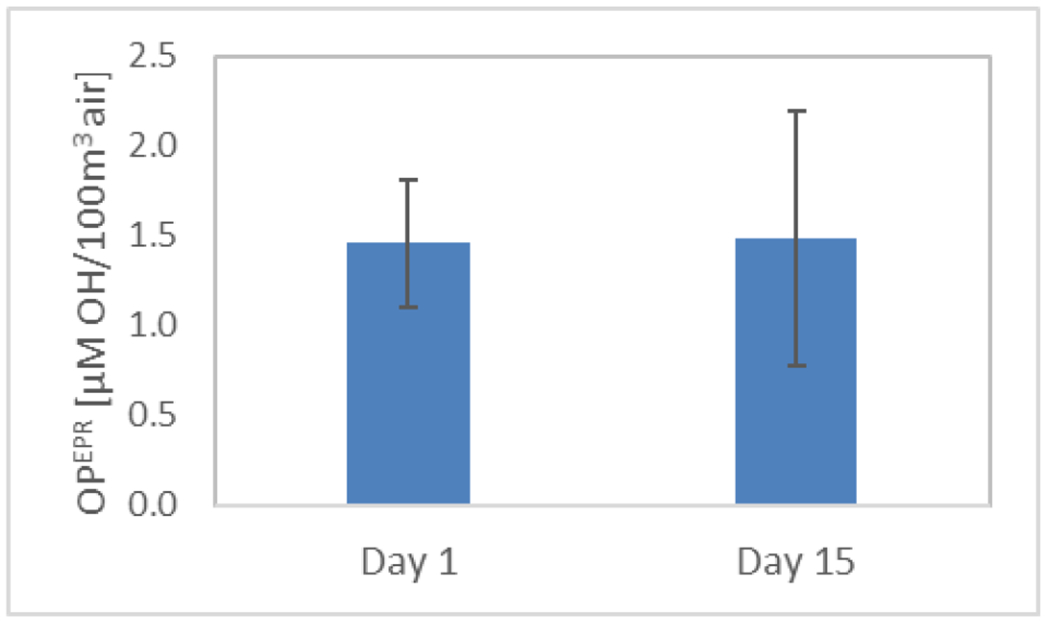
OPEPR of outdoor particles from a 4-day sampling period, measured the day after sampling ended and 15 days later. The error bars denote standard deviation of triplicate samples.
3.7. Oxidative Potential of Particles as a Health-Relevant Metric
The oxidative potential of particles has been suggested to be a more health-relevant metric than the mass and composition of particulate matter, because it provides a measure of the oxidative stress particles can cause when inhaled. OPEPR has been found to be correlated with several toxicological endpoints in A549 cells (release of IL-8 and lactate dehydrogenase (LDH), and oxidative DNA damage measured with the Comet Assay) 30. However, a study of 31 healthy volunteers exposed to different outdoor environments for 5 hours found associations between OP of particles and airway inflammatory markers, but found inconsistent associations between OP of particles and lung function and vascular inflammatory markers 10. Annual average OPEPR modelled with land use regression models was not found to be associated with asthma incidence or airway inflammation in a cohort of Dutch children at birth and age 12, but associations were found for oxidative potential measured with the dithiothreitol (DTT) assay 31. While it is possible that measures of OP other than OPEPR may be better markers of health effects caused by exposure to particles, few studies have been done to study this in different types of populations. A comparison of the association between OP of particles and health outcomes, with the association between other physicochemical characteristics of PM and health outcomes, would be beneficial in identifying the most relevant metric(s) for predicting health effects induced by exposure to particulate pollution.
Limitations
Studies on OPEPR of outdoor particles have found correlations between certain PM components and OPEPR 11, 14, 17 and it would be useful to see if these trends also exist for indoor particles, or if they are masked by indoor reactions and transport of particles through the building envelope. OPEPR is based on the ability of PM to dissociate H2O2 into •OH radicals, which occurs mainly through Fenton-type reactions and is thought to be influenced by transition metals in PM. It would be interesting to study if the correlations between OPEPR and transition metals (e.g., Fe and Cu) observed in outdoor environments hold in indoor environments. While the redox potential of particles in indoor environments has been studied in a few previous studies 32, 33, it would also be useful to compare OP and redox potential of indoor PM measured with different methods. Furthermore, the link between OP of indoor particles and elemental carbon/organic carbon (EC/OC) content has not been explored and such efforts would help put our limited knowledge of OP of indoor particles in context with our understanding of OP of outdoor particles.
Supplementary Material
Highlights.
Measured capacity of indoor particles to generate •OH using an EPR spectrometer
Samples collected in 18 4-day events under different suburban indoor conditions
OPEPR per volume of air sampled indoors was 59% of air sampled outdoors
OPEPR per mass of indoor PM was more than 3 times that of outdoor PM
OPEPR of indoor PM is significantly influenced by indoor RH, λ, and temperature
Acknowledgements
The authors would like to acknowledge the assistance of Dan Greb of NIST in conducting the tracer gas tests and setting up the air quality measurement equipment at the house. We would also like to thank Dennis Leber in the Statistical Engineering Division at NIST for his help with an earlier iteration of the statistical analyses. Stephanie Watson provided access to the EPR spectrometer and, along with Deborah Stanley, provided valuable assistance in setting up the EPR measurements. We would also like to thank Patrick Abbott and Alexander Moses in the Mass and Force Group at NIST for developing the framework for weighing the filters accurately against NIST standard masses. Dustin Poppendieck of NIST provided useful input during the planning stages of the study. Shahana Khurshid’s work was funded by a National Research Council RAP fellowship.
Footnotes
Publisher's Disclaimer: Disclaimer
Certain commercial equipment or materials are identified in this paper in order to specify the experimental procedure adequately. Such identification is not intended to imply recommendation or endorsement by the National Institute of Standards and Technology, nor is it intended to imply that the equipment or materials identified are necessarily the best available for the purpose.
References
- 1.Pope CA 3rd; Burnett RT; Thun MJ; Calle EE; Krewski D; Ito K; Thurston GD, Lung cancer, cardiopulmonary mortality, and long-term exposure to fine particulate air pollution. JAMA 2002, 287, (9), 1132–41. [DOI] [PMC free article] [PubMed] [Google Scholar]
- 2.Pope CA; Turner MC; Burnett RT; Jerrett M; Gapstur SM; Diver WR; Krewski D; Brook RD, Relationships Between Fine Particulate Air Pollution, Cardiometabolic Disorders, and Cardiovascular Mortality. Circulation Research 2015, 116, (1), 108–U258. [DOI] [PubMed] [Google Scholar]
- 3.Nel A, Air pollution-related illness: Effects of particles. Science 2005, 308, (5723), 804–806. [DOI] [PubMed] [Google Scholar]
- 4.Zou YJ; Jin CY; Su Y; Li JR; Zhu BS, Water soluble and insoluble components of urban PM2.5 and their cytotoxic effects on epithelial cells (A549) in vitro. Environ. Pollut 2016, 212, 627–635. [DOI] [PubMed] [Google Scholar]
- 5.Shi TM; Schins RPF; Knaapen AM; Kuhlbusch T; Pitz M; Heinrich J; Borm PJA, Hydroxyl radical generation by electron paramagnetic resonance as a new method to monitor ambient particulate matter composition. J. Environ. Monit 2003, 5, (4), 550–556. [DOI] [PubMed] [Google Scholar]
- 6.Kagan VE; Tyurina YY; Tyurin VA; Konduru NV; Potapovich AI; Osipov AN; Kisin ER; Schwegler-Berry D; Mercer R; Castranova V; Shvedova AA, Direct and indirect effects of single walled carbon nanotubes on RAW 264.7 macrophages: Role of iron. Toxicol. Lett 2006, 165, (1), 88–100. [DOI] [PubMed] [Google Scholar]
- 7.Borm PJA; Kelly F; Kunzli N; Schins RPF; Donaldson K, Oxidant generation by particulate matter: from biologically effective dose to a promising, novel metric. Occupational and Environmental Medicine 2007, 64, (2), 73–74. [DOI] [PMC free article] [PubMed] [Google Scholar]
- 8.Gomes A; Fernandes E; Lima J, Fluorescence probes used for detection of reactive oxygen species. J. Biochem. Biophys. Methods 2005, 65, (2-3), 45–80. [DOI] [PubMed] [Google Scholar]
- 9.Knaapen AM; Shi TM; Borm PJA; Schins RPF, Soluble metals as well as the insoluble particle fraction are involved in cellular DNA damage induced by particulate matter. Mol. Cell. Biochem 2002, 234, (1), 317–326. [PubMed] [Google Scholar]
- 10.Janssen NAH; Strak M; Yang A; Hellack B; Kelly FJ; Kuhlbusch TAJ; Harrison RM; Brunekreef B; Cassee FR; Steenhof M; Hoek G, Associations between three specific a-cellular measures of the oxidative potential of particulate matter and markers of acute airway and nasal inflammation in healthy volunteers. Occupational and Environmental Medicine 2015, 72, (1), 49–56. [DOI] [PubMed] [Google Scholar]
- 11.Janssen NAH; Yang AL; Strak M; Steenhof M; Hellack B; Gerlofs-Nijland ME; Kuhlbusch T; Kelly F; Harrison RM; Brunekreef B; Hoek G; Cassee F, Oxidative potential of particulate matter collected at sites with different source characteristics. Science of the Total Environment 2014, 472, 572–581. [DOI] [PubMed] [Google Scholar]
- 12.Yang A; Hoek G; Montagne D; Leseman D; Hellack B; Kuhlbusch TAJ; Cassee FR; Brunekreef B; Janssen NAH, Agreement of central site measurements and land use regression modeled oxidative potential of PM2.5 with personal exposure. Environmental Research 2015, 140, 397–404. [DOI] [PubMed] [Google Scholar]
- 13.Yang A; Wang M; Eeftens M; Beelen R; Dons E; Leseman D; Brunekreef B; Cassee FR; Janssen NAH; Hoek G, Spatial Variation and Land Use Regression Modeling of the Oxidative Potential of Fine Particles. Environ. Health Perspect 2015, 123, (11), 1187–1192. [DOI] [PMC free article] [PubMed] [Google Scholar]
- 14.Yang AL; Hellack B; Leseman D; Brunekreef B; Kuhlbusch TAJ; Cassee FR; Hoek G; Janssen NAH, Temporal and spatial variation of the metal-related oxidative potential of PM2.5 and its relation to PM2.5 mass and elemental composition. Atmospheric Environment 2015, 102, 62–69. [Google Scholar]
- 15.Hellack B; Quass U; Nickel C; Wick G; Schins RPF; Kuhlbusch TAJ, Oxidative potential of particulate matter at a German motorway. Environ. Sci.-Process Impacts 2015, 17, (4), 868–876. [DOI] [PubMed] [Google Scholar]
- 16.Baulig A; Poirault JJ; Ausset P; Schins R; Shi TM; Baralle D; Dorlhene P; Meyer M; Lefevre R; Baeza-Squiban A; Marano F, Physicochemical characteristics and biological activities of seasonal atmospheric particulate matter sampling in two locations of Paris. Environ. Sci. Technol 2004, 38, (22), 5985–5992. [DOI] [PubMed] [Google Scholar]
- 17.Boogaard H; Janssen NAH; Fischer PH; Kos GPA; Weijers EP; Cassee FR; van der Zee SC; de Hartog JJ; Brunekreef B; Hoek G, Contrasts in Oxidative Potential and Other Particulate Matter Characteristics Collected Near Major Streets and Background Locations. Environ. Health Perspect 2012, 120, (2), 185–191. [DOI] [PMC free article] [PubMed] [Google Scholar]
- 18.Kunzli N; Mudway IS; Gotschi T; Shi TM; Kelly FJ; Cook S; Burney P; Forsberg B; Gauderman JW; Hazenkamp ME; Heinrich J; Jarvis D; Norback D; Payo-Losa F; Poli A; Sunyer J; Borm PJA, Comparison of oxidative properties, light absorbance, and total and elemental mass concentration of ambient PM2.5 collected at 20 European sites. Environ. Health Perspect 2006, 114, (5), 684–690. [DOI] [PMC free article] [PubMed] [Google Scholar]
- 19.Gehling W; Khachatryan L; Dellinger B, Hydroxyl Radical Generation from Environmentally Persistent Free Radicals (EPFRs) in PM2.5. Environ. Sci. Technol 2014, 48, (8), 4266–4272. [DOI] [PMC free article] [PubMed] [Google Scholar]
- 20.Liu KJ; Shi XL, In vivo reduction of chromium (VI) and its related free radical generation. Mol. Cell. Biochem 2001, 222, (1-2), 41–47. [PubMed] [Google Scholar]
- 21.Ye JP; Wang SW; Leonard SS; Sun Y; Butterworth L; Antonini J; Ding M; Rojanasakul Y; Vallyathan V; Castranova V; Shi XL, Role of reactive oxygen species and p53 in chromium(VI)-induced apoptosis. J. Biol. Chem 1999, 274, (49), 34974–34980. [DOI] [PubMed] [Google Scholar]
- 22.Briede JJ; De Kok T; Hogervorst JGF; Moonen EJC; Den Camp C; Kleinjans JCS, Development and application of an electron spin resonance spectrometry method for the determination of oxygen free radical formation by particulate matter. Environ. Sci. Technol 2005, 39, (21), 8420–8426. [DOI] [PubMed] [Google Scholar]
- 23.Nabinger S; Persily A, Impacts of airtightening retrofits on ventilation rates and energy consumption in a manufactured home. Energy and Buildings 2011, 43, (11), 3059–3067. [Google Scholar]
- 24.ASTM Standard E741: Determining Air Change in a Single Zone by Means of a Tracer Gas Dilution. In West Conshohocken, PA, 2011. [Google Scholar]
- 25.Hellack B; Yang A; Cassee FR; Janssen NAH; Schins RPF; Kuhlbusch TAJ, Intrinsic hydroxyl radical generation measurements directly from sampled filters as a metric for the oxidative potential of ambient particulate matter. Journal of Aerosol Science 2014, 72, 47–55. [Google Scholar]
- 26.Arangio AM; Tong HJ; Socorro J; Poschl U; Shiraiwa M, Quantification of environmentally persistent free radicals and reactive oxygen species in atmospheric aerosol particles. Atmos. Chem. Phys 2016, 16, (20), 13105–13119. [Google Scholar]
- 27.Khachatryan L; Vejerano E; Lomnicki S; Dellinger B, Environmentally Persistent Free Radicals (EPFRs). 1. Generation of Reactive Oxygen Species in Aqueous Solutions. Environ. Sci. Technol 2011, 45, (19), 8559–8566. [DOI] [PMC free article] [PubMed] [Google Scholar]
- 28.Vreeland H; Schauer JJ; Russell AG; Marshall JD; Fushimi A; Jain G; Sethuraman K; Verma V; Tripathi SN; Bergin MH, Chemical characterization and toxicity of particulate matter emissions from roadside trash combustion in urban India. Atmospheric Environment 2016, 147, 22–30. [Google Scholar]
- 29.Jia L; Xu YF, Ozone and secondary organic aerosol formation from Ethylene-NO (x)-NaCl irradiations under different relative humidity conditions. J. Atmos. Chem 2016, 73, (1), 81–100. [Google Scholar]
- 30.Wessels A; Birmili W; Albrecht C; Hellack B; Jermann E; Wick G; Harrison RM; Schins RPF, Oxidant Generation and Toxicity of Size-Fractionated Ambient Particles in Human Lung Epithelial Cells. Environ. Sci. Technol 2010, 44, (9), 3539–3545. [DOI] [PubMed] [Google Scholar]
- 31.Yang A; Janssen NAH; Brunekreef B; Cassee FR; Hoek G; Gehring U, Children’s respiratory health and oxidative potential of PM2.5: the PIAMA birth cohort study. Occupational and Environmental Medicine 2016, 73, (3), 154–160. [DOI] [PubMed] [Google Scholar]
- 32.Khurshid SS; Siegel JA; Kinney KA, Particulate reactive oxygen species on total suspended particles - measurements in residences in Austin, Texas. Indoor Air 2016, 26, (6), 953–963. [DOI] [PubMed] [Google Scholar]
- 33.Khurshid SS; Siegel JA; Kinney KA, Indoor particulate reactive oxygen species concentrations. Environmental Research 2014, 132, 46–53. [DOI] [PubMed] [Google Scholar]
- 34.Picard A; Davis RS; Glaser M; Fujii K, Revised formula for the density of moist air (CIPM-2007). Metrologia 2008, 45, (2), 149–155. [Google Scholar]
- 35.Yoo DH; Han SK; Lee MJ; Kang JW, Spin trapping EPR method for simultaneous monitoring of hydroxyl radicals and hydrogen atoms in gamma-irradiation process. J. Ind. Eng. Chem 2005, 11, (2), 215–221. [Google Scholar]
- 36.Spencer MT; Shields LG; Prather KA, Simultaneous measurement of the effective density and chemical composition of ambient aerosol particles. Environ. Sci. Technol 2007, 41, (4), 1303–1309. [DOI] [PubMed] [Google Scholar]
- 37.Hu M; Peng JF; Sun K; Yue DL; Guo S; Wiedensohler A; Wu ZJ, Estimation of Size-Resolved Ambient Particle Density Based on the Measurement of Aerosol Number, Mass, and Chemical Size Distributions in the Winter in Beijing. Environ. Sci. Technol 2012, 46, (18), 9941–9947. [DOI] [PubMed] [Google Scholar]
- 38.Hodgson AT, Nabinger SJ, Persily AK Volatile Organic Compound Concentrations and Emission Rates Measured over One Year in a New Manufactured House; LBNL-56272; Lawrence Berkeley National Laboratory: 2004. [Google Scholar]
Associated Data
This section collects any data citations, data availability statements, or supplementary materials included in this article.


